Attached files
| file | filename |
|---|---|
| EX-99.1 - EX 99.1 EARNINGS RELEASE - Forestar Group Inc. | exh991forreleaseq214.htm |
| 8-K - 8-K - Forestar Group Inc. | earningsq2148-k.htm |
Second Quarter 2014 Financial Results August 6, 2014 Growing Forward Through Strategic and Disciplined Investment and Increasing Returns

Notice To Investors This presentation contains “forward-looking statements” within the meaning of the federal securities laws. Forward-looking statements are typically identified by words or phrases such as “will,” “anticipate,” “estimate,” “expect,” “project,” “intend,” “plan,” “believe,” “target,” “forecast,” and other words and terms of similar meaning. These statements reflect management’s current views with respect to future events and are subject to risk and uncertainties. We note that a variety of factors and uncertainties could cause our actual results to differ significantly from the results discussed in the forward-looking statements, including but not limited to: general economic, market, or business conditions; changes in commodity prices; opportunities (or lack thereof) that may be presented to us and that we may pursue; fluctuations in costs and expenses including development costs; demand for new housing, including impacts from mortgage credit rates or availability; lengthy and uncertain entitlement processes; cyclicality of our businesses; accuracy of accounting assumptions; competitive actions by other companies; changes in laws or regulations; and other factors, many of which are beyond our control. Except as required by law, we expressly disclaim any obligation to publicly revise any forward-looking statements contained in this presentation to reflect the occurrence of events after the date of this presentation. This presentation includes Non-GAAP financial measures. The required reconciliation to GAAP financial measures can be found as an exhibit to this presentation and on our website at www.forestargroup.com. 2

On Track to Deliver Growing FORward Strategic Initiatives 3 Initiatives Q2 2014 Results Accelerating total segment EBITDA and return on assets Total segment EBITDA of $47 million up 150% vs. Q2 2013 Growing through strategic and disciplined investments in existing markets and communities, and proven resource plays Invested $63 million in “A” locations and resource plays Repositioning non-core assets Sold $8 million in non-core assets Funding Growing FORward initiatives through balance sheet strength, cash flows and existing liquidity Available liquidity up $121 million vs. Q4 2013

Accelerating Real Estate and Oil and Gas Segment Earnings Total Segment Earnings Up Almost 200% in Q2 2014 vs. Q2 2013 4 • 2nd quarter 2014 real estate segment results include a $10.5 million gain, pre-tax, associated with the exchange of over 10,000 acres of timber leases for 5,400 acres of undeveloped land from Ironstob venture. • 2nd quarter 2014 oil and gas segment results include a $4.5 million gain, pre-tax, associated with the sale of our interest in 97 gross (6 net) non-core producing wells in Oklahoma, a $1.2 million gain, pre-tax, from the sale of leasehold interests in 223 net mineral acres in North Dakota and $2.1 million dry hole expense, pre-tax, associated with a working interest investment in an exploratory well in East Texas. Note: Second Quarter 2014 weighted average diluted shares outstanding were 43.7 million ($ in Millions, except per share data) 2nd Quarter 2014 2nd Quarter 2013 Net Income $14.8 $0.5 Earnings Per Share $0.34 $0.02 Segment Earnings: Real Estate $27.3 $8.1 Oil and Gas 9.5 4.2 Other Natural Resources 2.1 1.0 Total Segment Earnings $38.9 $13.3

Improving Financial Strength and Liquidity While Executing Growth Strategy Execution of Strategic Initiatives Positions Forestar with Strong Balance Sheet, Ample Liquidity and Assets Well Positioned to Generate Earnings and Cash Flow Going Forward 1 Fair value of convertible notes as of Q2 2014 is $102 million and YE 2013 is $100 million; principal amount of notes is $125 million which is due and payable at maturity in 2020 2 Represents amortizing note portion of $150 million tangible equity unit offering 3 Consolidated debt principally non-recourse to Forestar 4 Includes unrestricted cash plus available revolver 5 1 ($ in Millions) Q2 2014 Actual YE 2013 Actual Credit Facility Borrowings --- $200 8.50% Senior Secured Notes $250 --- Convertible Debt 1 102 100 Amortizing Notes 2 21 26 Other Consolidated Debt 3 27 31 Total Debt $400 $357 Shareholder’s Equity $738 $715 Total Debt / Total Capital 35% 33% Available Liquidity 4 $474 $353 Q2 2014 Debt Maturity Schedule $20 $10 $17 $1 $125 $250 2014 2015 2016 2017 2018 2019 2020 2021 2022
Real Estate Second Quarter 2014 Highlights Building Momentum By Accelerating Real Estate Sales and Building a Solid Multifamily Pipeline 6
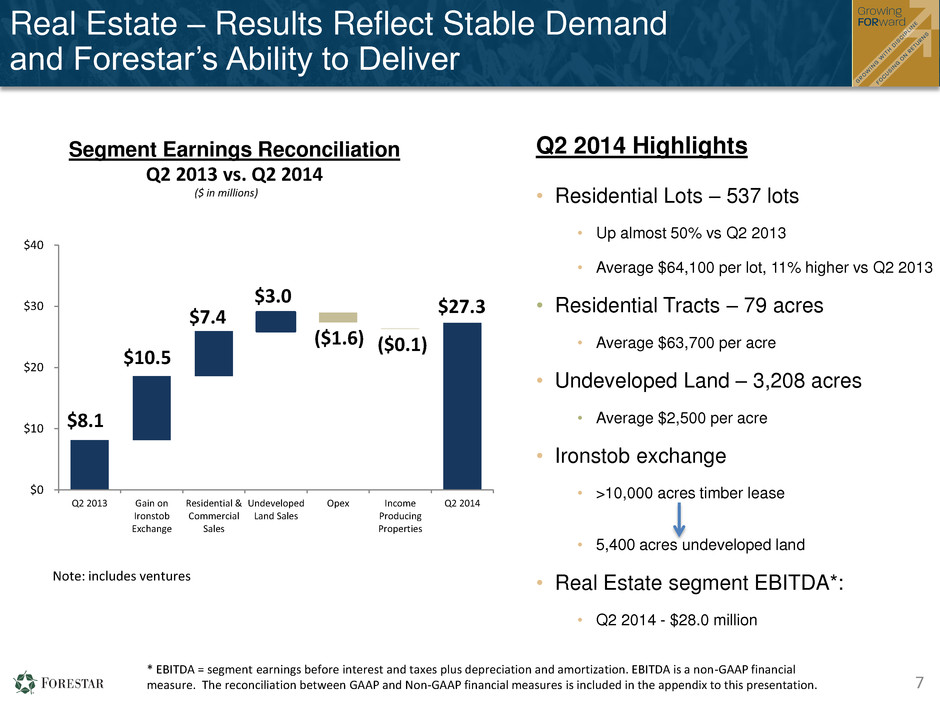
($1.6) ($0.1) $8.1 $10.5 $7.4 $3.0 $27.3 $0 $10 $20 $30 $40 Q2 2013 Gain on Ironstob Exchange Residential & Commercial Sales Undeveloped Land Sales Opex Income Producing Properties Q2 2014 Q2 2014 Highlights • Residential Lots – 537 lots • Up almost 50% vs Q2 2013 • Average $64,100 per lot, 11% higher vs Q2 2013 • Residential Tracts – 79 acres • Average $63,700 per acre • Undeveloped Land – 3,208 acres • Average $2,500 per acre • Ironstob exchange • >10,000 acres timber lease • 5,400 acres undeveloped land • Real Estate segment EBITDA*: • Q2 2014 - $28.0 million Segment Earnings Reconciliation Q2 2013 vs. Q2 2014 ($ in millions) 7 Note: includes ventures Real Estate – Results Reflect Stable Demand and Forestar’s Ability to Deliver * EBITDA = segment earnings before interest and taxes plus depreciation and amortization. EBITDA is a non-GAAP financial measure. The reconciliation between GAAP and Non-GAAP financial measures is included in the appendix to this presentation.

* Actual results may vary A n n u al Lo t Sal e s 2006 Peak Sales = 3,600 lots Annual Lot Sales & Avg. Lot Margin 8 Real Estate Capitalizing on Well Located Communities, Low Inventories and Solid Job Growth $0 $5,000 $10,000 $15,000 $20,000 $25,000 $30,000 0 500 1,000 1,500 2,000 2,500 2008 2009 2010 2011 2012 2013 2014E* Lot Sales Average Lot Margin 1,365 804 642 A ve ra ge Lo t M ar gi n 1,883 1,060 1,117 Note: Includes ventures Q1 974 Planned Lot Sales Q2 537 ** Texas Markets represent Dallas, Houston, San Antonio and Austin Source: Metrostudy Texas Finished Vacant Inventory and MoS** Rank MSA Job Gains Percent Change (YOY) 1 Dallas-Fort Worth-Arlington, TX 113,100 3.7% 4 Houston-The Woodlands-Sugar Land, TX 93,300 3.3% 12 Austin-Round Rock, TX 31,000 3.6% 21 San Antonio-New Braunfels, TX 23,700 2.6% Texas Major Markets 261,100 3.4% US Average 2,408,000 1.8% Top Job Growth MSAs - May 2014 - 0.50 1.00 1.50 2.00 2.50 3.00 3.50 - 5,000 10,000 15,000 20,000 25,000 30,000 4Q 0 0 3Q 0 1 2Q 0 2 1Q 0 3 4Q 0 3 3Q 0 4 2Q 0 5 1Q 0 6 4Q 0 6 3Q 0 7 2Q 0 8 1Q 0 9 4Q 0 9 3Q 1 0 2Q 1 1 1Q 1 2 4Q 1 2 3Q 1 3 2Q 1 4 FinVacant (FV) FVMos Equilibrium
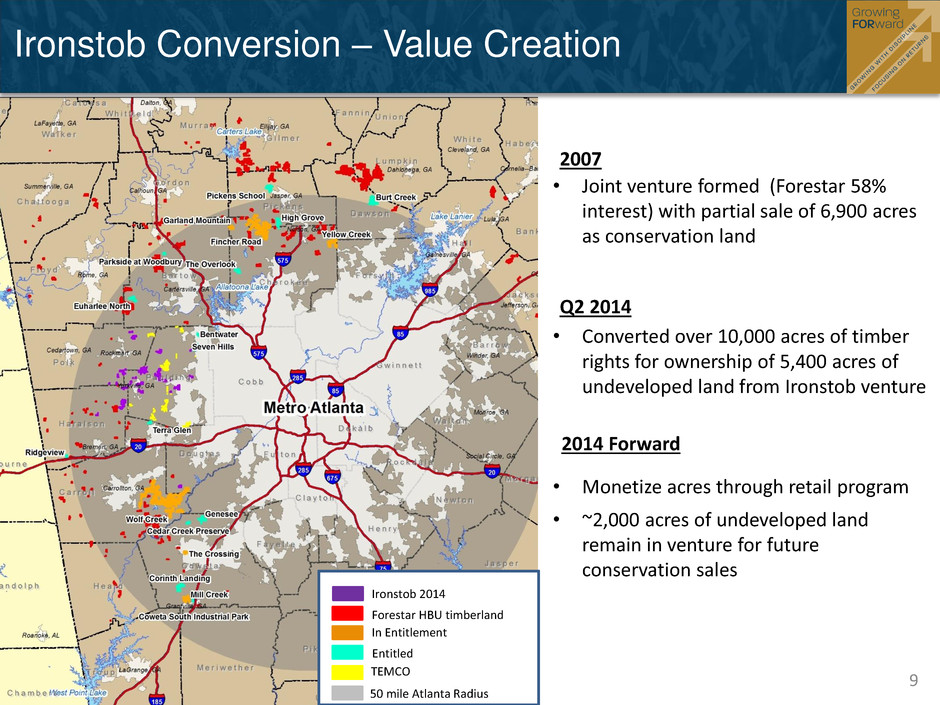
• Joint venture formed (Forestar 58% interest) with partial sale of 6,900 acres as conservation land • Converted over 10,000 acres of timber rights for ownership of 5,400 acres of undeveloped land from Ironstob venture • Monetize acres through retail program • ~2,000 acres of undeveloped land remain in venture for future conservation sales Ironstob Conversion – Value Creation Ironstob 2014 Forestar HBU timberland In Entitlement Entitled TEMCO 50 mile Atlanta Radius 9 Q2 2014 2007 2014 Forward

Building Solid Pipeline of Multifamily Development Opportunities (Proforma) Proforma Project Cash Flows Expected Forestar Cash Flows Project Market % Complete Units FOR Ownership Total Development Cost Expected Project NOI FOR Equity FOR Total Cash Cash Multiple* Eleven Austin 100% 257 25% $40 – 45 $3.4 $4 $12 3.0x 360° Denver 66% 304 20% 50 – 55 3.8 4 11 2.8x Midtown Dallas 56% 354 100% 35 – 40 2.8 10 20 2.0x Acklen Nashville 18% 320 30% 55 – 60 4.1 6 14 2.3x Littleton Denver 1% 385 25% 70 – 75 5.1 6 16 2.6x 1,620 40% $250 – 275 $19.2 $30 $73 2.4x * Cash multiples include fees 10 Site Pipeline Expected Ownership Proforma Units Charlotte, NC Venture 379 Austin, TX – Pressler Venture 280 Austin, TX – Westlake Venture 218 ($ in millions)
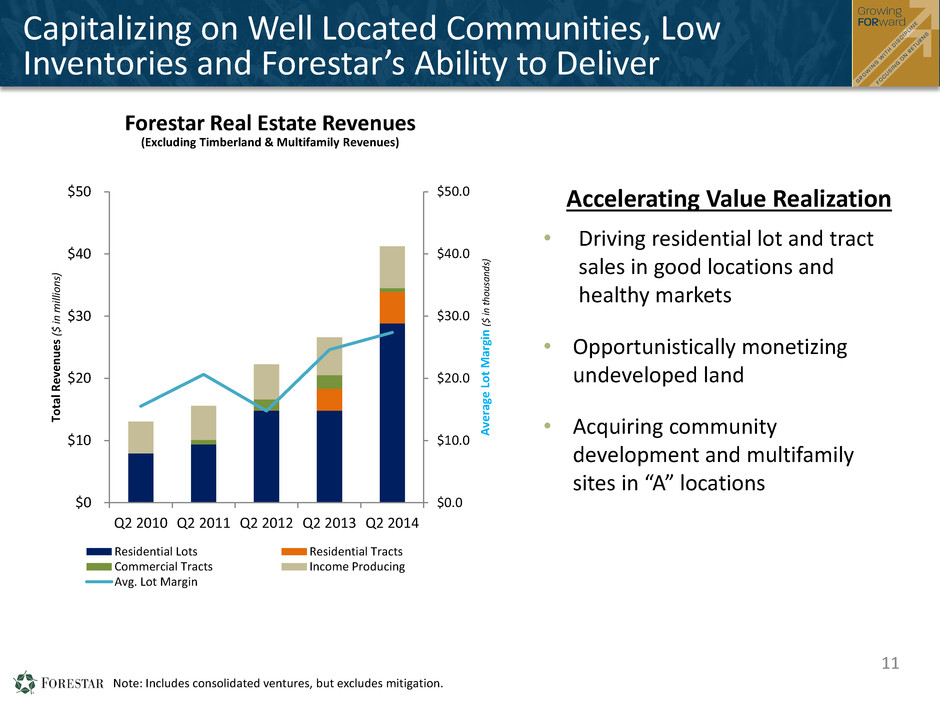
Note: Includes consolidated ventures, but excludes mitigation. Forestar Real Estate Revenues (Excluding Timberland & Multifamily Revenues) Capitalizing on Well Located Communities, Low Inventories and Forestar’s Ability to Deliver 11 • Driving residential lot and tract sales in good locations and healthy markets • Opportunistically monetizing undeveloped land • Acquiring community development and multifamily sites in “A” locations Accelerating Value Realization $0.0 $10.0 $20.0 $30.0 $40.0 $50.0 $0 $10 $20 $30 $40 $50 Q2 2010 Q2 2011 Q2 2012 Q2 2013 Q2 2014 A ve ra ge Lo t M ar gi n ($ in t h o u sa n d s) To tal R e ve n u e s ($ in m ill io n s) Residential Lots Residential Tracts Commercial Tracts Income Producing Avg. Lot Margin

Other Natural Resources Second Quarter 2014 Highlights Building Momentum Through Sustainable Harvests and Delivering Economic Water Solutions 12

Other Natural Resources Segment Results $1.0 $0.3 ($0.6) $2.1 $0.7 $0.7 $0.0 $1.0 $2.0 $3.0 Q2 2013 Water Reservation Gain on Termination of Timber Lease Operating Expenses Fiber Sales Q2 2014 Se gm en t Ea rn in gs Q2 2014 Highlights • Signed amended groundwater reservation agreement, generating $0.7 million in earnings • $0.7 million gain on termination of timber lease in connection with Ironstob venture • Sold 107,800 tons of fiber • Average fiber pricing $16.86 per ton, up over 26% vs. Q2 2013 Segment Earnings Reconciliation Q2 2013 vs. Q2 2014 ($ in millions) 13

Oil and Gas Second Quarter 2014 Highlights Building Momentum By Driving Leasing and Exploration to Increase Production and Reserves 14

Investments and Asset Sales Drive Higher EBITDAX Q2 2014 Highlights • Working interest volume up 56% vs. Q2 2013 • Mineral royalties volume down 28% vs. Q2 2013 • Sold leasehold interest in 223 net mineral acres in the Bakken/Three Forks generating $1.2 million gain • Sold working interest in 97 gross (6 net) non-core producing wells in Oklahoma for $7.5 million, generating $4.5 million gain • 1,380 fee mineral acres leased to third parties for $352/acre • Acquired leasehold interest in over 77,000 net mineral acres, primarily in Nebraska, for $9.1 million ($ in millions) 15 ($ in millions) Note: EBITDAX = segment earnings before interest and taxes, plus depreciation, depletion, amortization, geological, geophysical, seismic and dry hole costs. EBITDAX is a Non-GAAP financial measure. The reconciliation between GAAP and Non-GAAP financial measures is included in the appendix to this presentation and provided on the company’s investor relations website. $4.2 ($3.5) $4.0 $5.7 ($0.9) $9.5 $0.0 $2.0 $4.0 $6.0 $8.0 $10.0 $12.0 $14.0 Q2 2013 Gain on Sale Working Interest Dry Hole Expense Operating Expenses Q2 2014 Se gme n t Ea rning s $11.0 $5.8 $5.7 ($0.9) ($3.5) $4.0 $22.1 $0.0 $5.0 $10.0 $15.0 $20.0 $25.0 Q2 2013 DD&A and Exploration Gain on Sale Working Interest Dry Hole Expense Operating Expenses Q2 2014 Se gme n t EBIT D A X Segment Earnings Reconciliation Q2 2013 vs. Q2 2014 Segment EBITDAX Reconciliation Q2 2013 vs. Q2 2014 2nd quarter 2014 oil and gas segment results include a $4.5 million gain associated with the sale of our interest in 97 gross (6 net) non-core producing wells in Oklahoma and a $1.2 million gain from the sale of leasehold interests in 223 net mineral acres in North Dakota. 2nd Qtr. 2014 oil and gas segment results include 4.0 million in dry hole expenses, including $2.1 million associated with our working interest in an exploratory well in East Texas, and $1.9 million in Kansas and Nebraska.

16 Drilling and Completion Investments Driving Production Growth and Improved EBITDAX 50,000 100,000 150,000 200,000 250,000 Q4 2012 Q1 2013 Q2 2013 Q3 2013 Q4 2013 Q1 2014 Q2 2014 B O E Working Interest Legacy Minerals Quarterly Oil & Gas Production Quarterly Oil & Gas EBITDAX $0 $2,000 $4,000 $6,000 $8,000 $10,000 $12,000 $14,000 $16,000 Q4 2012 Q1 2013 Q2 2013 Q3 2013 Q4 2013 Q1 2014 Q2 2014 $ in thou sand s Working Interest Legacy Minerals * *Excludes $5.7 million gain on sale of oil and gas properties
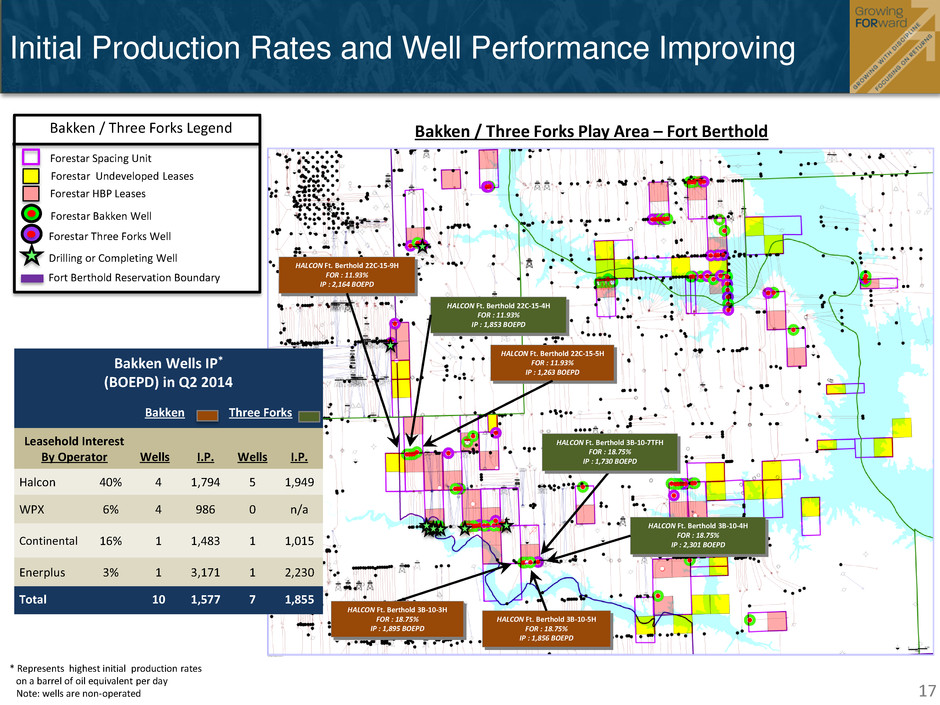
HALCON Ft. Berthold 3B-10-4H FOR : 18.75% IP : 2,301 BOEPD HALCON Ft. Berthold 3B-10-5H FOR : 18.75% IP : 1,856 BOEPD Initial Production Rates and Well Performance Improving 17 * Represents highest initial production rates on a barrel of oil equivalent per day Note: wells are non-operated Bakken Wells IP* (BOEPD) in Q2 2014 Bakken Three Forks Leasehold Interest By Operator Wells I.P. Wells I.P. Halcon 40% 4 1,794 5 1,949 WPX 6% 4 986 0 n/a Continental 16% 1 1,483 1 1,015 Enerplus 3% 1 3,171 1 2,230 Total 10 1,577 7 1,855 Bakken / Three Forks Legend Forestar Bakken Well Forestar Three Forks Well Drilling or Completing Well Fort Berthold Reservation Boundary Forestar HBP Leases Forestar Undeveloped Leases Forestar Spacing Unit HALCON Ft. Berthold 22C-15-5H FOR : 11.93% IP : 1,263 BOEPD HALCON Ft. Berthold 3B-10-3H FOR : 18.75% IP : 1,895 BOEPD HALCON Ft. Berthold 3B-10-7TFH FOR : 18.75% IP : 1,730 BOEPD HALCON Ft. Berthold 22C-15-4H FOR : 11.93% IP : 1,853 BOEPD HALCON Ft. Berthold 22C-15-9H FOR : 11.93% IP : 2,164 BOEPD HALCON Ft. Berthold 3B-10-4H FOR : 18.75% IP : 2,301 BOEPD Bakken / Three Forks Play Area – Fort Berthold

18 18 Bakken / Three Forks Leasehold Interests 2014 Producers Added During Q1 2014 3 Producers Added During Q2 2014 17 Average WI Q2 2014 ~7% Drilling & Awaiting Frac at End Q2 2014 12 Total Wells Drilled 2014 Est* 50 Expected WI Average - Wells Drilled in 2014 ~10% Bakken / Three Forks Drilling Activity Investment and Value Realization * Based on current plans from operators, subject to change 0 20 40 60 80 100 120 140 2010 2011 2012 2013 2014E P ro d u ci n g W e lls Producing Wells** Actual Wells Planned Wells +44 +25 +7 +4 +46 ** Gross wells EUR Sensitivity *** EUR (MBOE) IRR 700 56% 600 38% 500 25% ***Estimated Ultimate Recoveries (EUR’s)assuming $90 oil and $3 natural gas average price over life of well. Total costs includes land, drilling and completion, LOE and production severance taxes. Note: Actual results may vary from illustrations
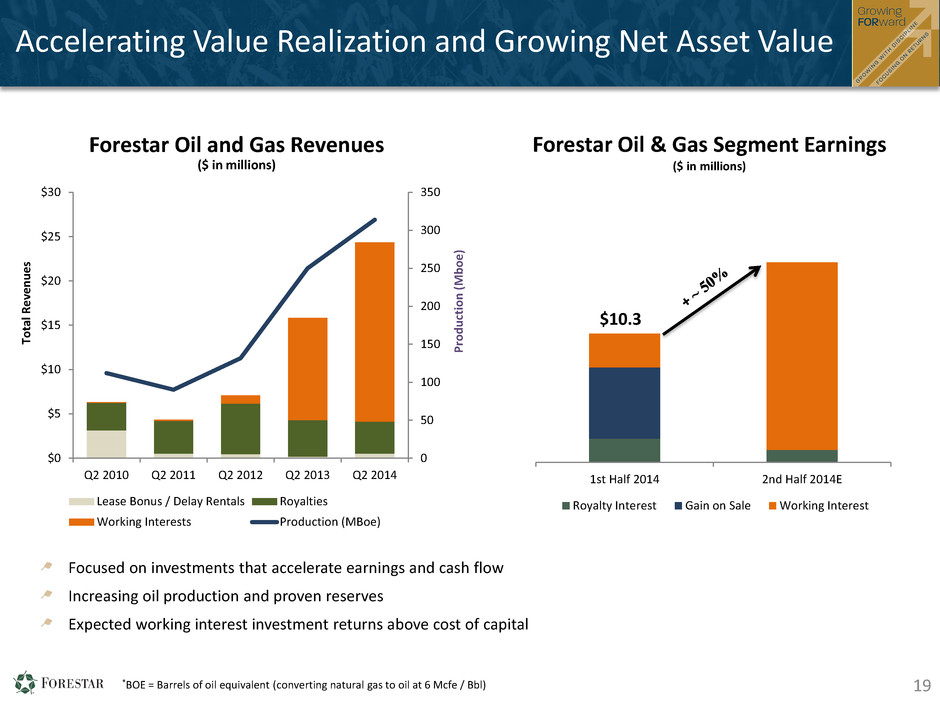
Accelerating Value Realization and Growing Net Asset Value Focused on investments that accelerate earnings and cash flow Increasing oil production and proven reserves Expected working interest investment returns above cost of capital 19 0 50 100 150 200 250 300 350 $0 $5 $10 $15 $20 $25 $30 Q2 2010 Q2 2011 Q2 2012 Q2 2013 Q2 2014 P ro d u ctio n ( M b o e ) To tal R e ve n u e s Forestar Oil and Gas Revenues ($ in millions) Lease Bonus / Delay Rentals Royalties Working Interests Production (MBoe) *BOE = Barrels of oil equivalent (converting natural gas to oil at 6 Mcfe / Bbl) 1st Half 2014 2nd Half 2014E Royalty Interest Gain on Sale Working Interest $10.3 Forestar Oil & Gas Segment Earnings ($ in millions)
Strategic Initiatives Update Building Momentum By Accelerating Value Realization, Optimizing Transparency and Growing Net Asset Value 20
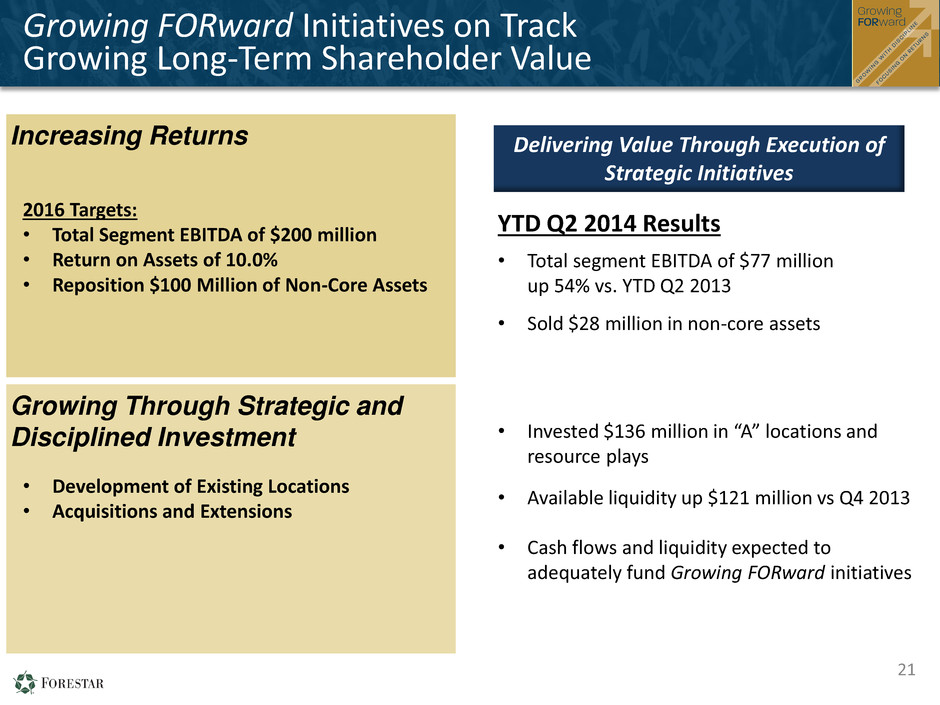
Growing FORward Initiatives on Track Growing Long-Term Shareholder Value Growing Through Strategic and Disciplined Investment Increasing Returns 21 • Development of Existing Locations • Acquisitions and Extensions 2016 Targets: • Total Segment EBITDA of $200 million • Return on Assets of 10.0% • Reposition $100 Million of Non-Core Assets Delivering Value Through Execution of Strategic Initiatives YTD Q2 2014 Results • Total segment EBITDA of $77 million up 54% vs. YTD Q2 2013 • Sold $28 million in non-core assets • Invested $136 million in “A” locations and resource plays • Available liquidity up $121 million vs Q4 2013 • Cash flows and liquidity expected to adequately fund Growing FORward initiatives

Second Quarter 2014 Financial Results For questions, please contact: Anna Torma SVP Corporate Affairs Forestar Group Inc. 6300 Bee Cave Road Building Two, Suite 500 Austin, TX 78746 512-433-5312 annatorma@forestargroup.com 22

Second Quarter 2014 Financial Results Second Quarter 2014 Appendix - Segment KPI’s - Earnings Reconciliations - Reconciliation of Non-GAAP Financial Measures 23
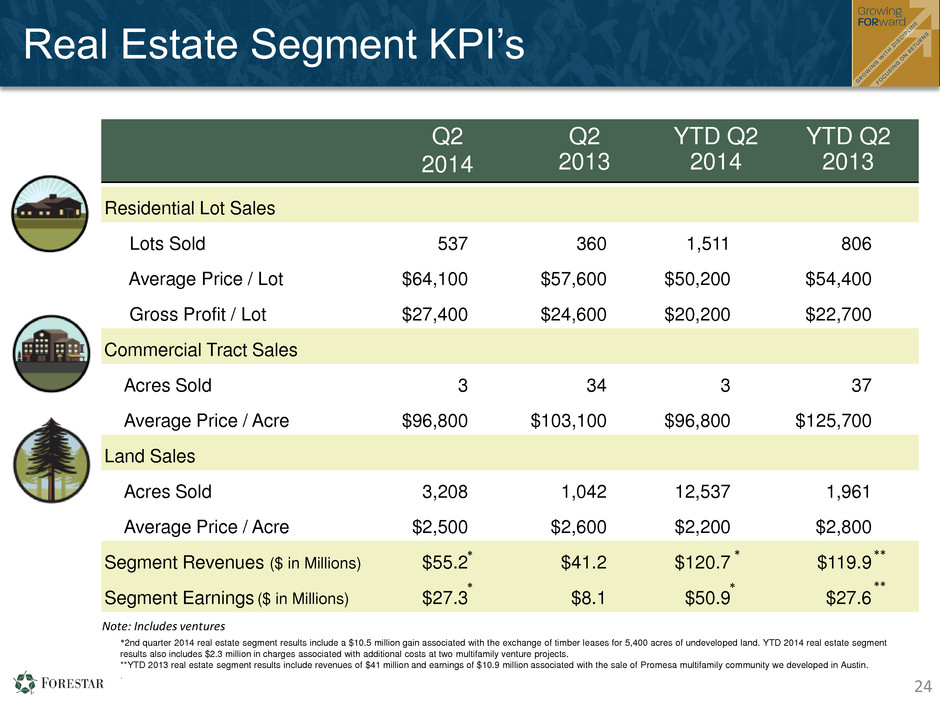
Q2 2014 Q2 2013 YTD Q2 2014 YTD Q2 2013 Residential Lot Sales Lots Sold 537 360 1,511 806 Average Price / Lot $64,100 $57,600 $50,200 $54,400 Gross Profit / Lot $27,400 $24,600 $20,200 $22,700 Commercial Tract Sales Acres Sold 3 34 3 37 Average Price / Acre $96,800 $103,100 $96,800 $125,700 Land Sales Acres Sold 3,208 1,042 12,537 1,961 Average Price / Acre $2,500 $2,600 $2,200 $2,800 Segment Revenues ($ in Millions) $55.2 $41.2 $120.7 $119.9 Segment Earnings ($ in Millions) $27.3 $8.1 $50.9 $27.6 *2nd quarter 2014 real estate segment results include a $10.5 million gain associated with the exchange of timber leases for 5,400 acres of undeveloped land. YTD 2014 real estate segment results also includes $2.3 million in charges associated with additional costs at two multifamily venture projects. **YTD 2013 real estate segment results include revenues of $41 million and earnings of $10.9 million associated with the sale of Promesa multifamily community we developed in Austin. . Note: Includes ventures 24 24 24 Real Estate Segment KPI’s ** ** * * * *
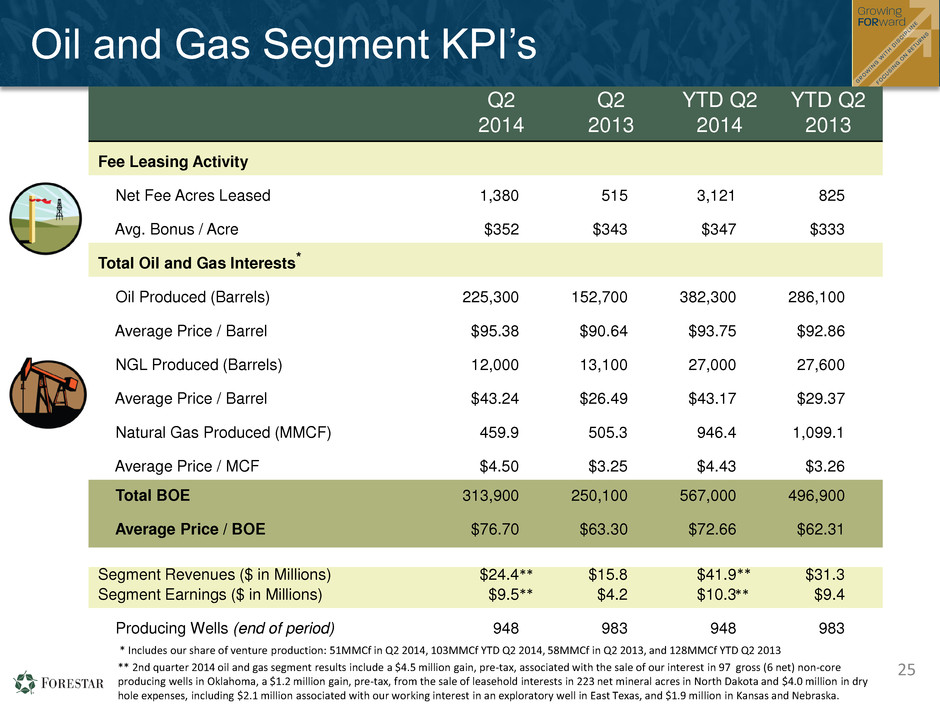
Q2 2014 Q2 2013 YTD Q2 2014 YTD Q2 2013 Fee Leasing Activity Net Fee Acres Leased 1,380 515 3,121 825 Avg. Bonus / Acre $352 $343 $347 $333 Total Oil and Gas Interests* Oil Produced (Barrels) 225,300 152,700 382,300 286,100 Average Price / Barrel $95.38 $90.64 $93.75 $92.86 NGL Produced (Barrels) 12,000 13,100 27,000 27,600 Average Price / Barrel $43.24 $26.49 $43.17 $29.37 Natural Gas Produced (MMCF) 459.9 505.3 946.4 1,099.1 Average Price / MCF $4.50 $3.25 $4.43 $3.26 Total BOE 313,900 250,100 567,000 496,900 Average Price / BOE $76.70 $63.30 $72.66 $62.31 Segment Revenues ($ in Millions) $24.4 $15.8 $41.9 $31.3 Segment Earnings ($ in Millions) $9.5 $4.2 $10.3 $9.4 Producing Wells (end of period) 948 983 948 983 25 25 Oil and Gas Segment KPI’s * Includes our share of venture production: 51MMCf in Q2 2014, 103MMCf YTD Q2 2014, 58MMCf in Q2 2013, and 128MMCf YTD Q2 2013 ** 2nd quarter 2014 oil and gas segment results include a $4.5 million gain, pre-tax, associated with the sale of our interest in 97 gross (6 net) non-core producing wells in Oklahoma, a $1.2 million gain, pre-tax, from the sale of leasehold interests in 223 net mineral acres in North Dakota and $4.0 million in dry hole expenses, including $2.1 million associated with our working interest in an exploratory well in East Texas, and $1.9 million in Kansas and Nebraska. ** ** ** **
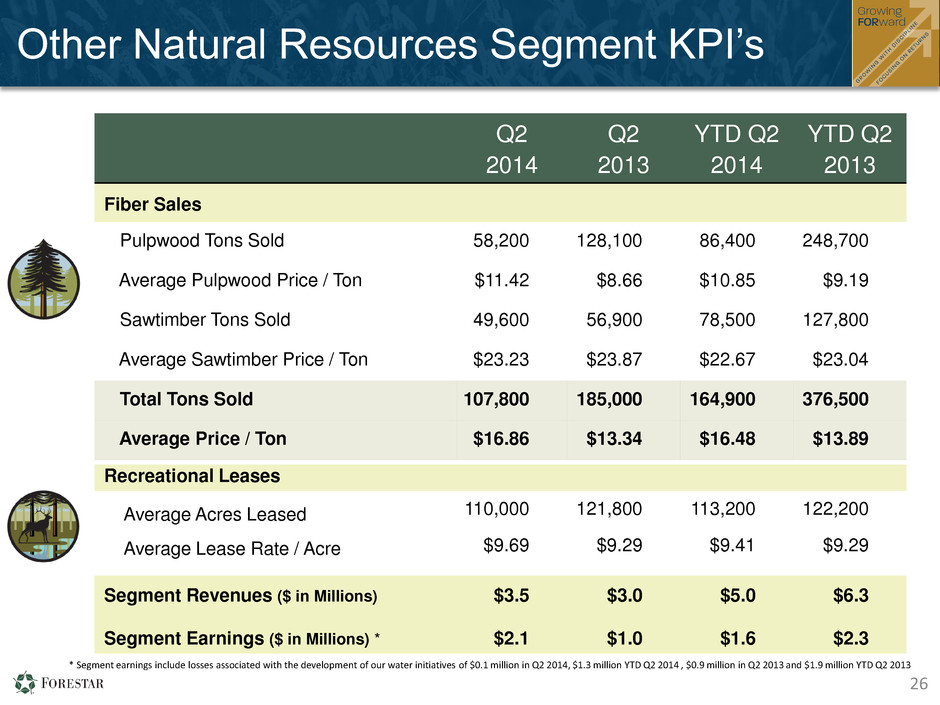
26 Q2 2014 Q2 2013 YTD Q2 2014 YTD Q2 2013 Fiber Sales Pulpwood Tons Sold 58,200 128,100 86,400 248,700 Average Pulpwood Price / Ton $11.42 $8.66 $10.85 $9.19 Sawtimber Tons Sold 49,600 56,900 78,500 127,800 Average Sawtimber Price / Ton $23.23 $23.87 $22.67 $23.04 Total Tons Sold 107,800 185,000 164,900 376,500 Average Price / Ton $16.86 $13.34 $16.48 $13.89 Recreational Leases Average Acres Leased 110,000 121,800 113,200 122,200 Average Lease Rate / Acre $9.69 $9.29 $9.41 $9.29 Segment Revenues ($ in Millions) $3.5 $3.0 $5.0 $6.3 Segment Earnings ($ in Millions) * $2.1 $1.0 $1.6 $2.3 26 26 Other Natural Resources Segment KPI’s * Segment earnings include losses associated with the development of our water initiatives of $0.1 million in Q2 2014, $1.3 million YTD Q2 2014 , $0.9 million in Q2 2013 and $1.9 million YTD Q2 2013

Second Quarter 2014 Earnings Reconciliation $0.5 $14.8 $3.4 $12.5 $0.7 ($1.1) ($1.0) ($0.2) $0.0 $5.0 $10.0 $15.0 $20.0 Q2 2013 Real Estate Oil & Gas Other Natural Resources Share Based Comp Interest, Taxes & Other Expenses G&A Q2 2014 ($ in millions) 27 $0.02 $0.29 $0.08 $0.02 ($0.03) ($0.03) ($0.01) $0.34 $0.00 $0.10 $0.20 $0.30 $0.40 $0.50 Q2 2013 Real Estate Oil & Gas Other Natural Resources Share Based Comp Interest, Taxes & Other Expenses G&A Q2 2014 Net Income Per Share Reconciliation Q2 2013 vs. Q2 2014 Net Income Reconciliation Q2 2013 vs. Q2 2014 Note: 2nd quarter 2014 weighted average diluted shares outstanding were 43.7 million • 2nd quarter 2014 real estate segment results include a $10.5 million gain associated with the exchange of a timberland lease for 5,400 acres of undeveloped land from Ironstob venture. • 2nd quarter 2014 oil and gas segment results include a $4.5 million gain associated the sale of our interest in 97 gross (6 net) non-core producing wells in Oklahoma, $1.2 million gain from the sale of leasehold interests in 223 net mineral acres in North Dakota and $2.1 million dry hole expense associated with a working interest investment in a well in East Texas.

28 Forestar’s Segment EBITDA is a non-GAAP financial measure within the meaning of Regulation G of the Securities and Exchange Commission. Non-GAAP financial measures are not in accordance with, or an alternative to, U.S. Generally Accepted Accounting Principles (GAAP). The company believes presenting non-GAAP Segment EBITDA is helpful to analyze financial performance without the impact of items that may obscure trends in the company’s underlying performance. A detailed reconciliation is provided below outlining the differences between these non-GAAP measures and the directly related GAAP measures. Reconciliation of Non-GAAP Financial Measures (Unaudited) Quarter YTD ($ in millions, except per share amounts) Q2 2014 Q2 2013 YTD Q2 2014 YTD Q2 2013 Real Estate Segment Earnings in accordance with GAAP $27.3 $8.1 $50.9 $27.6 Depreciation, Depletion & Amortization 0.7 0.7 1.3 1.7 EBITDA $28.0 $8.8 $52.2 $29.3 Oil & Gas Segment Earnings in accordance with GAAP $9.5 $4.2 $10.3 $9.4 Depreciation, Depletion & Amortization 7.5 4.7 12.3 8.4 EBITDA $17.0 $8.9 $22.6 $17.8 Other Natural Resources Segment Earnings in accordance with GAAP $2.1 $1.0 $1.6 $2.2 Depreciation, Depletion & Amortization 0.1 0.2 0.2 0.4 EBITDA $2.2 $1.2 $1.8 $2.6 Total Segment Total Segment Earnings in accordance with GAAP $38.9 $13.3 $62.8 $39.2 Depreciation, Depletion & Amortization 8.3 5.6 13.8 10.5 EBITDA $47.2 $18.9 $76.6 $49.7
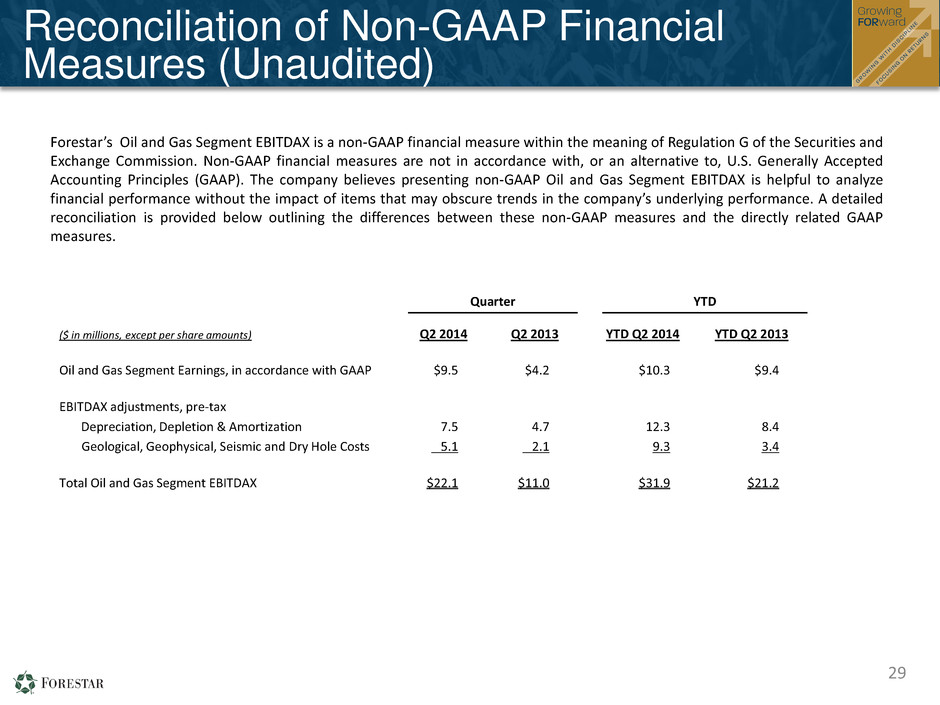
29 Forestar’s Oil and Gas Segment EBITDAX is a non-GAAP financial measure within the meaning of Regulation G of the Securities and Exchange Commission. Non-GAAP financial measures are not in accordance with, or an alternative to, U.S. Generally Accepted Accounting Principles (GAAP). The company believes presenting non-GAAP Oil and Gas Segment EBITDAX is helpful to analyze financial performance without the impact of items that may obscure trends in the company’s underlying performance. A detailed reconciliation is provided below outlining the differences between these non-GAAP measures and the directly related GAAP measures. Quarter YTD ($ in millions, except per share amounts) Q2 2014 Q2 2013 YTD Q2 2014 YTD Q2 2013 Oil and Gas Segment Earnings, in accordance with GAAP $9.5 $4.2 $10.3 $9.4 EBITDAX adjustments, pre-tax Depreciation, Depletion & Amortization 7.5 4.7 12.3 8.4 Geological, Geophysical, Seismic and Dry Hole Costs 5.1 2.1 9.3 3.4 Total Oil and Gas Segment EBITDAX $22.1 $11.0 $31.9 $21.2 Reconciliation of Non-GAAP Financial Measures (Unaudited)

Second Quarter 2014 Financial Results For questions, please contact: Anna Torma SVP Corporate Affairs Forestar Group Inc. 6300 Bee Cave Road Building Two, Suite 500 Austin, TX 78746 512-433-5312 annatorma@forestargroup.com 30
