Attached files
| file | filename |
|---|---|
| 8-K - 8-K - Apollo Residential Mortgage, Inc. | d772156d8k.htm |
| EX-99.1 - EX-99.1 - Apollo Residential Mortgage, Inc. | d772156dex991.htm |
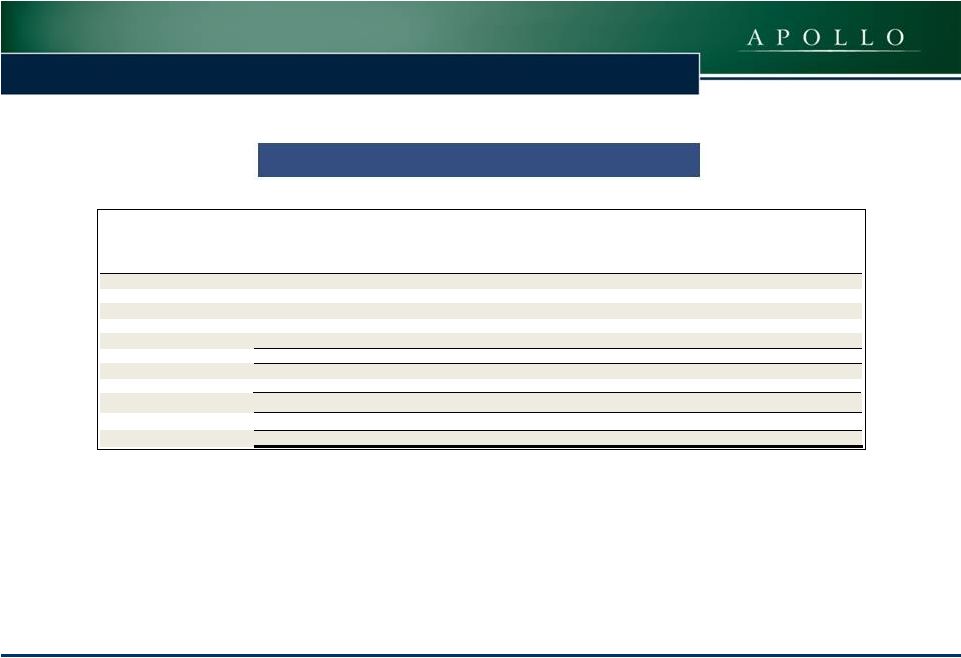
 August 6, 2014
Q2 2014
Information is as of June 30, 2014 except as otherwise noted.
It should not be assumed that investments made in the future will be
profitable or will equal the performance of investments in this document.
Exhibit 99.2
Supplemental Financial Information Presentation
|
 2
APOLLO RESIDENTIAL MORTGAGE, INC. (“AMTG”)
Apollo Residential Mortgage, Inc.
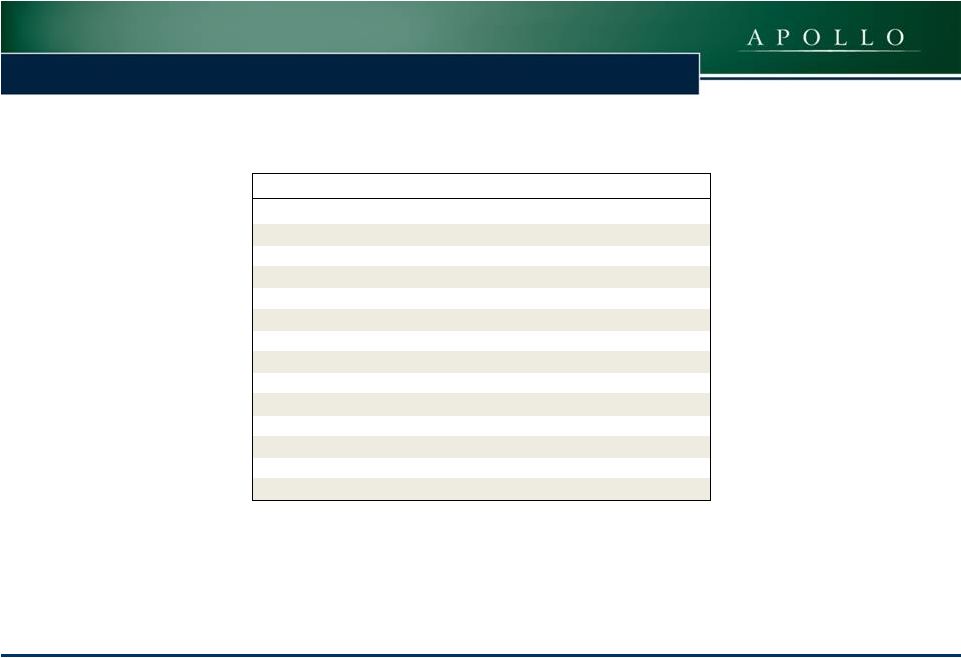
Second Quarter 2014 Earnings Call
August 6, 2014
Michael A. Commaroto
Chief Executive Officer
Teresa D. Covello
Chief Financial Officer
Keith Rosenbloom
Agency Portfolio Manager
Paul Mangione
Non-Agency Portfolio Manager
Hilary Ginsberg
Investor Relations Manager |
 3
APOLLO RESIDENTIAL MORTGAGE, INC. (“AMTG”)
We make forward-looking statements in this presentation and other
filings we make with the Securities and Exchange Commission (“SEC”)
within
the
meaning
of
Section
27A
of
the
Securities
Act
of
1933,
as
amended,
and
Section
21E
of
the
Securities
Exchange
Act
of
1934,
as
amended, and such statements are intended to be covered by the safe
harbor provided by the same. Forward-looking statements are subject
to
substantial
risks
and
uncertainties,
many
of
which
are
difficult
to
predict
and
are
generally
beyond
our
control.
These
forward-looking
statements
include
information
about
possible
or
assumed
future
results
of
our
business,
financial
condition,
liquidity,
results
of
operations,
plans
and
objectives,
including
information
about
our
ability
to
generate
attractive
returns
while
attempting
to
mitigate
risk.
When
used
in
this
presentation, the words believe, expect, anticipate, estimate, plan,
continue, intend, should, may or similar expressions are intended to
identify
forward-looking
statements.
Statements
regarding
the
following
subjects,
among
others,
may
be
forward-looking:
the
return
on
equity; the yield on investments; the ability to borrow to finance
assets; and risks associated with investing in real estate assets, including
changes in business conditions and the general economy.
The forward-looking statements are based on our beliefs,
assumptions and expectations of our future performance, taking into account all
information currently available to us. Forward-looking statements
are not predictions of future events. These beliefs, assumptions and
expectations can change as a result of many possible events or factors,
not all of which are known to us. Some of these factors are described
in the Company's Annual Report on Form 10-K for the year ended
December 31, 2013 and other filings with the SEC. If a change occurs,
our business, financial condition, liquidity and results of operations
may vary materially from those expressed in our forward-looking
statements. Any forward-looking statement speaks only as of the
date on which it is made. New risks and uncertainties arise over time, and
it
is
not
possible
for
us
to
predict
those
events
or
how
they
may
affect
us.
Except
as
required
by
law,
we
are
not
obligated
to,
and
do
not
intend to, update or revise any forward-looking statements, whether
as a result of new information, future events or otherwise. This
presentation may contain statistics and other data that in some cases has been obtained from or compiled from information made
available by third-party service providers.
Forward Looking Statements |
 4
APOLLO RESIDENTIAL MORTGAGE, INC. (“AMTG”)
Second Quarter 2014 Summary Highlights
Reported
Operating
Earnings
of
$16.5
million,
or
$0.52
per
share
of
common
stock
for
the
second
quarter
of
2014
(1)
RMBS
portfolio
at
June
30,
2014
consisted
of
Agency
RMBS
with
an
estimated
fair
value
of
$2.2
billion
and non-
Agency RMBS with an estimated fair value of $1.4 billion
RMBS,
securitized
mortgage
loans
and
other
credit
investment
portfolio
had
a
2.6%
effective
net
interest
spread
and
a
14.1%
effective
levered
asset
yield
at
June
30,
2014
(2)
Quarter-end leverage multiple of 3.8x at June 30, 2014
Estimated taxable income of $0.42 per share of common stock
Declared a $0.42 per share of common stock quarterly dividend for
stockholders of record as of June 30, 2014 Book
value
per
share
of
common
stock
of
$19.49
at
June
30,
2014,
a
4.6%
increase
over
March
31,
2014
book
value
per
share
of
common
stock
of $18.64
$13.5 million outstanding on warehouse facility to fund the acquisition
and rehabilitation of 220 homes through the
bond-for-title program
(1) Operating Earnings and Operating Earnings per share of common stock
are non-GAAP financial measures. Operating Earnings and Operating Earnings per share of common stock presented exclude, as applicable: (i) certain realized and unrealized gains and losses recognized through earnings;
(ii) non-cash equity compensation; (iii) one time events pursuant
to changes in GAAP; and (iv) certain other non-cash charges. Please see page 17 for a reconciliation of Operating Earnings and Operating Earnings per common share to GAAP net income allocable to common stockholders
and GAAP net income allocable to common stockholders per share of common
stock. Operating Earnings represents the earnings, as adjusted, allocable to common stock.
(2) Effective net interest spread and effective levered asset yield are
non-GAAP financial measures, which include the cost of the Company’s Swaps as a component of its interest expense. Please see page 8.
|
 5
APOLLO RESIDENTIAL MORTGAGE, INC. (“AMTG”)
($ amounts in thousands except per share data)
June 30, 2014
March 31, 2014
June 30, 2014
June 30, 2013
Interest Income
$38,141
$38,180
$41,329
$76,321
$79,576
Interest Expense
(7,510)
(7,268)
(7,237)
(14,778)
(13,454)
Net Interest Income
$30,631
$30,912
$34,092
$61,543
$66,122
Operating Earnings
(1)
$16,521
$17,116
$18,900
$33,593
$37,991
Weighted Average Common Shares Outstanding -
Basic
32,020
32,015
31,995
32,018
28,858
Operating Earnings per Common Share
(1)
$0.52
$0.53
$0.59
$1.05
$1.32
Leverage Multiple (Debt / Equity)
3.8x
3.8x
3.9x
3.8x
3.9x
Annualized Return on Average Assets
(2)
2.3%
2.3%
1.8%
2.3%
2.0%
Annualized Return on Average Equity
(3)
10.2%
10.6%
10.4%
10.5%
11.2%
Three Months Ended
Six Months Ended
Financial Summary
(1)
Operating Earnings and Operating Earnings per share of common stock are
non-GAAP financial measures. Operating Earnings and Operating Earnings per share of common stock presented exclude, as applicable: (i) certain realized and unrealized gains and losses recognized through
earnings; (ii) non-cash equity compensation; (iii) one-time
events pursuant to changes in GAAP; and (iv) certain other non-cash charges. Please see page 17 for a reconciliation of Operating Earnings and Operating Earnings per share of common stock to GAAP net income allocable
to common stockholders and GAAP net income allocable to common
stockholders per share. Operating Earnings represents the earnings, as adjusted, allocable to common stock.
(2)
Annualized Return on Average Assets is calculated as annualized
Operating Earning plus preferred dividend requirement for the period, as a percentage of average interest earning assets, excluding cash.
(3)
Annualized Return on Average Equity is calculated as annualized
Operating Earnings plus preferred dividend requirement for the period, as a percentage of average equity over the period.
June 30, 2013 |
 6
APOLLO RESIDENTIAL MORTGAGE, INC. (“AMTG”)
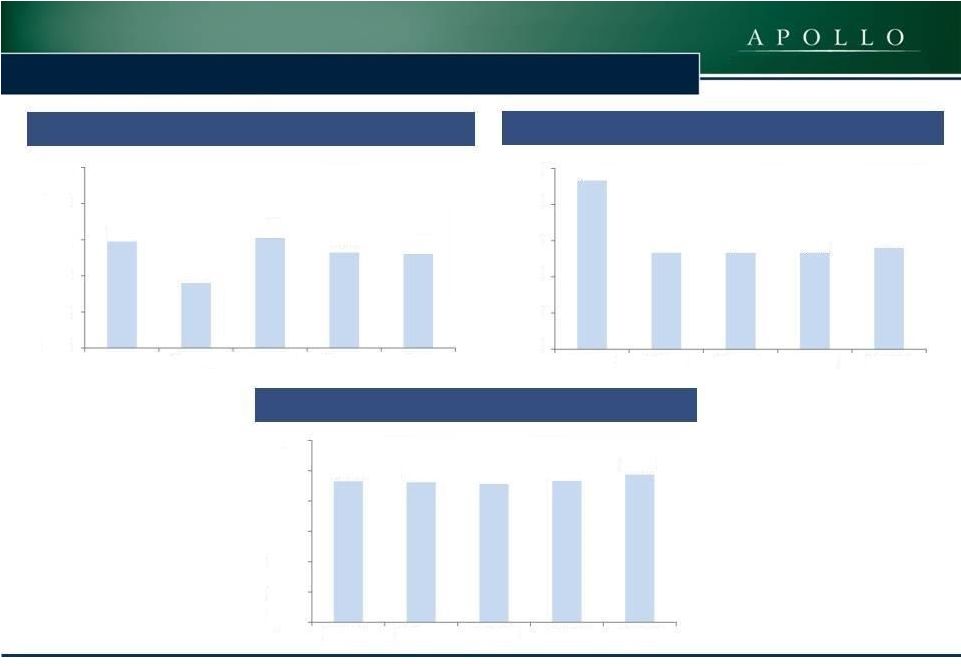
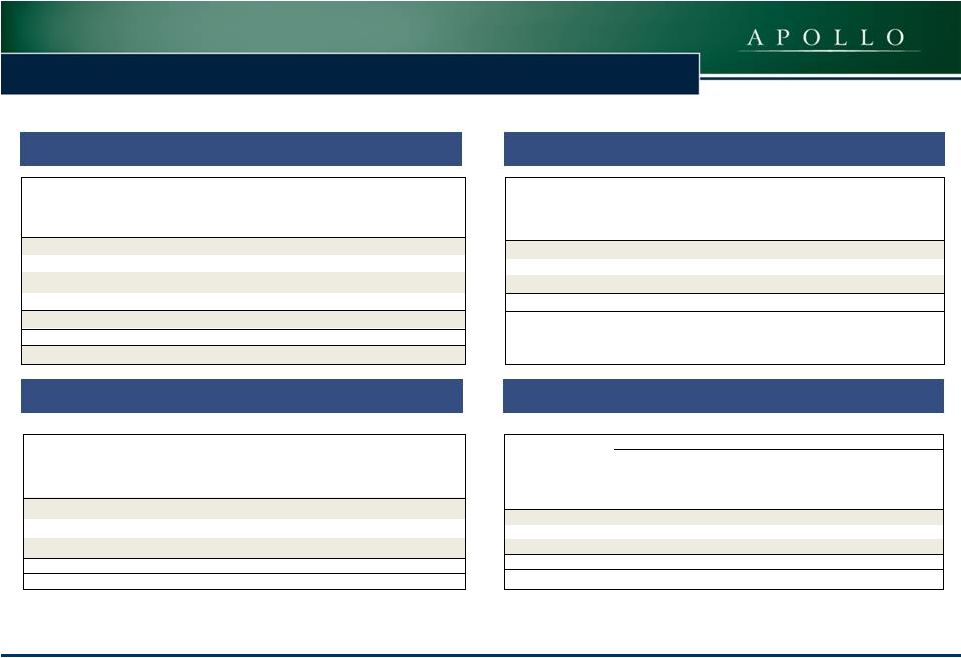
Operating
Earnings
per
Share
of
Common
Stock
(1)
Book Value per Share of Common Stock
Dividends per Share of Common Stock
(1)
Operating Earnings and Operating Earnings per share of common stock are
non-GAAP financial measures. Operating Earnings and Operating Earnings per share of common stock presented exclude, as applicable: (i) certain realized and unrealized gains and losses recognized through earnings;
(ii) non-cash equity compensation; (iii) one-time events
pursuant to changes in GAAP; and (iv) certain other non-cash charges. Please see page 17 for a reconciliation of Operating Earnings and Operating Earnings per common share to GAAP net income allocable to common stockholders and GAAP
net income allocable to common stockholders per share of common stock.
Operating Earnings represents the earnings, as adjusted, allocable to common stock.
$0.59
$0.36
$0.61
$0.53
$0.52
$0.00
$0.20
$0.40
$0.60
$0.80
$1.00
Q2 2013
Q3 2013
Q4 2013
Q1 2014
Q2 2014
$0.70
$0.40
$0.40
$0.40
$0.42
$0.00
$0.15
$0.30
$0.45
$0.60
$0.75
Q2 2013
Q3 2013
Q4 2013
Q1 2014
Q2 2014
$18.63
$18.50
$18.26
$18.64
$19.49
$0.00
$4.00
$8.00
$12.00
$16.00
$20.00
$24.00
Q2 2013
Q3 2013
Q4 2013
Q1 2014
Q2 2014
Financial Summary
APOLLO RESIDENTIAL MORTGAGE, INC. (“AMTG”)
|
 7
APOLLO RESIDENTIAL MORTGAGE, INC. (“AMTG”)
Book Value Roll-Forward
Book Value - March 31, 2014 (unaudited)
18.64
$
Common stock dividend declared
(0.42)
Operating Earnings, net of preferred dividend
0.52
Non-Operating Items Impacting Net Income:
Unrealized gain on Agency RMBS, net
1.46
Unrealized gain on non-Agency RMBS, net
0.15
Unrealized gain on securitized mortgage loans, net
0.06
Unrealized loss on derivatives, net
(0.45)
Realized loss on sales of Agency RMBS, net
(0.23)
Realized gain on sales of non-Agency RMBS, net
0.01
Realized loss on expirations of Swaptions
(0.24)
Other, net
(0.01)
Book Value - June 30, 2014 (unaudited)
19.49
$ |
 8
Portfolio Summary and Net Interest Spread
Allocation
of
Portfolio
Equity
at
June
30,
2014
(1)
Effective
Net
Interest
Spread
at
June
30,
2014
(2)
Allocation
of
Portfolio
Equity
at
March
31,
2014
(1)
Effective
Net
Interest
Spread
at
March
31,
2014
(2)
Agency
RMBS
Non-Agency
RMBS and
Other
Credit
Investments
Securitized
Mortgage
Loans
Weighted
Average
Asset Yield
3.1%
6.9%
7.9%
4.5%
Interest Expense
0.4%
2.1%
3.2%
1.0%
Cost of Swaps
1.1%
-
1.9%
0.7%
Effective Net Interest Spread
1.6%
4.8%
2.8%
2.8%
Debt / Equity
(3)
6.2x
2.7x
1.6x
3.8x
Effective Levered Asset Yield
(2)
13.1%
19.9%
12.4%
15.1%
Agency
RMBS
Non-Agency
RMBS and
Other
Credit
Investments
Securitized
Mortgage
Loans
Weighted
Average
Asset Yield
2.9%
6.1%
7.8%
4.3%
Interest Expense
0.3%
2.0%
3.1%
1.0%
Cost of Swaps
1.0%
-
1.9%
0.7%
Effective Net Interest Spread
1.6%
4.1%
2.8%
2.6%
Debt / Equity
(3)
6.4x
2.7x
1.5x
3.8x
Effective Levered Asset Yield
(2)
12.9%
17.3%
12.2%
14.1%
Securitized
Mortgage Loans
5%
Agency RMBS
38%
Cash and Other,
net
8%
Non-Agency
RMBS and
Other Credit
Investments
49%
Securitized
Mortgage Loans
6%
Agency RMBS
39%
Cash and Other,
net
9%
Non-Agency
RMBS and
Other Credit
Investments
46%
APOLLO RESIDENTIAL MORTGAGE, INC. (“AMTG”)
Percentages reflect amount of equity allocated to Agency RMBS,
non-Agency RMBS and other credit investments and securitized mortgage loans, net of associated assets and liabilities, including the fair value of interest rate derivatives. Cash and other net, represents
cash and other assets and liabilities not specifically allocable to
Agency RMBS, non-Agency RMBS and other credit investments or securitized mortgage loans.
Effective net interest spread and effective levered asset yield are
non-GAAP financial measures, which include the cost of the Company’s Swaps as a component of its interest expense, as presented.
Debt/Equity multiples for each asset class are adjusted to reflect cash
held to meet margin calls and certain other assets and liabilities specifically allocable to Agency RMBS, non-Agency RMBS and other credit investments or securitized mortgage loans.
(1)
(2)
(3) |
 9
APOLLO RESIDENTIAL MORTGAGE, INC. (“AMTG”)
Agency RMBS Portfolio at June 30, 2014
Agency Portfolio Overview
Constant Prepayment Rates
(1)
Other includes Interest Only and Inverse Interest Only Securities.
Loan Balance 15
Year Pass-Throughs
2%
Loan Balance 30
Year Pass-Throughs
54%
Low Credit 30 Year
Pass-Throughs
16%
Other(1)
3%
HARP / MHA /
High LTV 30 Year
Pass-Throughs
25%
3.7%
5.2%
5.8%
7.0%
7.1%
6.7%
4.9%
4.9%
6.7%
0.0%
1.0%
2.0%
3.0%
4.0%
5.0%
6.0%
7.0%
8.0%
Q2 2012
Q3 2012
Q4 2012
Q1 2013
Q2 2013
Q3 2013
Q4 2013
Q1 2014
Q2 2014
Total Agency Portfolio average one month CPR
($ in thousands)
Estimated Fair Value
Q2 2014 CPR
Agency Pass-Throughs
2,100,874
$
6.6
%
Agency IOs and Agency IIOs
67,529
8.5
Total
2,168,403
$
6.7
% |
 10
APOLLO RESIDENTIAL MORTGAGE, INC. (“AMTG”)
Agency RMBS Portfolio at June 30, 2014
Agency RMBS Portfolio Composition Summary
(1)
Amortized cost is reduced by unrealized losses that are classified as
other-than-temporary impairments. (2)
Estimated weighted average yield at the date presented incorporates
prepayment assumptions on Agency RMBS. (3)
Agency IOs and Agency IIOs have no principal balance and bear interest
on a notional balance. The notional balance is used solely to determine interest distributions on interest-only classes of securities. At June 30, 2014, Agency IOs had a notional balance of $401,322
and Agency Inverse IOs had a notional balance of $123,339.
($ in thousands)
Principal Balance
Unamortized
Premium
Amortized Cost
(1)
Estimated Fair
Value
Weighted
Average
Coupon
Estimated
Weighted
Average
Yield
(2)
30-Year Mortgages
Fixed-rate coupons:
3.5%
88,735
5,167
93,902
91,263
3.50
%
2.58
%
4.0%
1,295,054
95,147
1,390,201
1,372,490
4.00
%
2.83
%
4.5%
537,388
40,294
577,682
584,812
4.50
%
2.96
%
1,921,177
140,608
2,061,785
2,048,565
4.12
%
2.86
%
15-Year Mortgages
3.0% Coupons
50,435
1,352
51,787
52,309
3.00
%
2.48
%
Agency IOs
(3)
-
-
39,144
42,368
3.96
%
0.67
%
Agency IIOs
(3)
-
-
25,070
25,161
6.06
%
13.52
%
Total Agency RMBS
1,971,612
$
141,960
$
2,177,786
$
2,168,403
$
4.17
%
2.93
% |
 11
APOLLO RESIDENTIAL MORTGAGE, INC. (“AMTG”)
Non-Agency RMBS Portfolio Overview
Non-Agency RMBS Portfolio at June 30, 2014
Non-Agency RMBS Portfolio Vintage
Non-Agency RMBS Cash-Flow Profile
Subprime
79%
Pay-option
ARM
10%
Alt-A
11%
1998-2002
5%
2003
7%
2004
31%
2005
30%
2006
17%
2007
9%
2014
1%
Current-Pay
60%
Locked-Out
40% |
 12
APOLLO RESIDENTIAL MORTGAGE, INC. (“AMTG”)
Non-Agency RMBS Portfolio at June 30, 2014
(1)
Credit
enhancement
is
expressed
as
a
percentage
of
all
outstanding
mortgage
loan
collateral.
The
Company's
non-Agency
RMBS
may
incur
losses
if
credit
enhancement
is
reduced
to
zero.
(2) CRR stands for conditional repayment rate. Information
is based on loans for individual groups owned by the Company. Amounts presented reflect the weighted average monthly performance for the three months ended June 30, 2014.
June 30, 2014
Portfolio Characteristics
Estimated Fair Value ($ in thousands)
$1,413,194
Amortized Cost to Par Value
81.0%
Net Weighted Average Security Coupon
1.2%
Collateral Attributes
Weighted Average Loan Age (months)
113
Weighted Average Original Loan-to-Value
79.8%
Weighted Average Original FICO Credit Score
638
Current Performance
60+ Day Delinquencies
29.5%
Average Credit Enhancement
(1)
33.3%
3 Month CRR
(2)
4.2% |
 13
APOLLO RESIDENTIAL MORTGAGE, INC. (“AMTG”)
Financing and Derivative Instruments Overview
(1)
Includes $28,569 of repurchase borrowings collateralized by
non-Agency RMBS of $48,638 that were eliminated from the Company’s consolidated balance sheet in consolidation with the variable interest entity associated with our securitization transaction.
(2)
Securitized debt, which represents non-recourse senior securities
sold to third parties in connection with a securitization transaction, has a final contractual maturity of May 2047. Weighted average remaining maturity represents the underwritten final maturity of the security based on the
projected final repayment of principal. The actual maturity of the
securitized debt may differ significantly given that actual interest collections, mortgage prepayments and/or losses on liquidation of mortgages may differ significantly from those expected.
($ in thousands)
Balance
Weighted
Average
Borrowing Rate
Weighted
Average
Remaining
Maturity
Repurchase agreement borrowings:
Agency RMBS
1,905,783
$
0.35%
22 days
Non-Agency RMBS
(1)
1,075,603
1.99%
174 days
Other investment securities
10,603
1.83%
24 days
Total repurchase agreements
2,991,989
$
0.94%
77 days
Securitized debt
37,348
$
4.00%
55 months
(2)
Total Borrowings
3,029,337
$
0.98%
($ in
thousands)
Notional Amount
Estimated Fair
Value
Swaps -
assets
957,000
$
18,087
$
Swaptions
- assets
1,335,000
2,855
Swaps -
(liabilities)
730,000
(8,729)
Total Derivative Instruments
3,022,000
$
12,213
$
($ in thousands)
Weighted Average
Months Until
Fixed Pay Rate for
Option
Notional
Swap Terms
Underlying Swap
Fair Value
Expiration
Amount
(Years)
2.50 -
3.00%
879
$
11
160,000
$
5
3.50 -
4.00%
1,976
6
1,075,000
10
4.00 -
4.50%
-
2
100,000
10
2,855
$
6
1,335,000
$
9.4
Option
Underlying Swap
Swaps Overview at June 30, 2014
Swaptions Overview at June 30, 2014
Derivative Instruments at June 30, 2014
Borrowings at June 30, 2014
($ in thousands)
Term to Maturity
Notional Amount
Average Fixed Pay
Rate
Average
Maturity
(Years)
Greater than 1 year up to 3 years
580,000
$
1.20%
2.7
Greater than 3 years up to 5 years
529,000
0.90%
3.4
Greater than 5 years
578,000
2.13%
8.4
Total
1,687,000
$
1.43%
4.9 |
 14
APOLLO RESIDENTIAL MORTGAGE, INC. (“AMTG”)
Financials |
 15
APOLLO RESIDENTIAL MORTGAGE, INC. (“AMTG”)
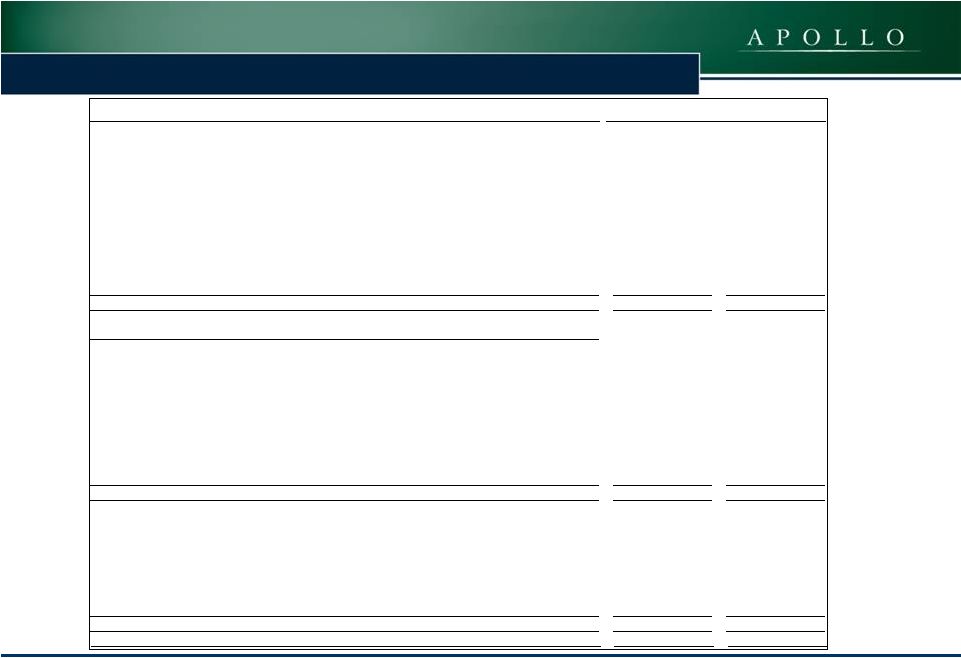
Balance Sheet
(in thousands—except share and per share data)
June 30, 2014
December 31, 2013
Assets:
(unaudited)
Cash
98,014
$
127,959
$
Restricted cash
45,092
67,458
RMBS, at fair value (of which $3,379,235 and $3,317,060 were pledged
as collateral, respectively) 3,581,597
3,503,326
Securitized mortgage loans (transferred to a consolidated VIE), at
fair value 109,712
110,984
11,846
11,515
Warehouse line receivable
13,462
-
Investment related receivable (of which $0 and $21,959 were pledged as
collateral, respectively) 3,136
24,887
Interest receivable
10,087
10,396
Deferred financing costs, net
817
882
Derivative instruments, at fair value
20,942
53,315
Other assets
705
854
Total Assets
3,895,410
$
3,911,576
$
Liabilities and Stockholders' Equity
Liabilities:
Borrowings under repurchase agreements
2,991,989
$
3,034,058
$
Non-recourse securitized debt, at fair value
38,656
43,354
Investment related payable
13,299
-
Obligation to return cash held as collateral
11,426
38,654
Accrued interest payable
11,077
8,708
Derivative instruments, at fair value
8,729
4,610
Payable to related party
5,218
5,444
Dividends payable
16,912
16,812
Accounts payable and accrued expenses
1,069
2,335
Total Liabilities
3,098,375
$
3,153,975
$
Stockholders' Equity:
Preferred stock, $0.01 par value, 50,000,000 shares authorized,
6,900,000 shares issued and outstanding ($172,500 aggregate
liquidation preference) 69
$
69
$
Common stock, $0.01 par value, 450,000,000 shares authorized,
32,051,303 and 32,038,970 shares 320
320
Additional paid-in-capital
792,877
792,010
Retained earnings/(accumulated deficit)
3,769
(34,798)
Total Stockholders' Equity
797,035
$
757,601
$
Total Liabilities and Stockholders'
Equity 3,895,410
$
3,911,576
$
issued and outstanding, respectively
Other investment securities, at fair value (of which $11,846 and
$11,515 were pledged as collateral, respectively) |
 16
APOLLO RESIDENTIAL MORTGAGE, INC. (“AMTG”)
Income Statement
(in thousands—except per share data)
2014
2013
2014
2013
Interest Income:
RMBS
35,991
$
39,032
$
71,816
$
75,946
$
Securitized mortgage loans
1,927
2,297
4,173
3,630
Other
223
-
332
-
Total Interest Income
38,141
41,329
76,321
79,576
Interest Expense:
Repurchase agreements
(7,078)
(6,729)
(13,904)
(12,636)
Securitized debt
(432)
(508)
(874)
(818)
Total Interest Expense
(7,510)
(7,237)
(14,778)
(13,454)
Net Interest Income
30,631
$
34,092
$
61,543
$
66,122
$
Other Income/(Loss):
Realized loss on sale of RMBS, net
(7,072)
$
(47,508)
$
(18,882)
$
(31,713)
$
Gain/(loss) on derivative instruments, net (includes
($14,467), respectively)
(27,133)
83,369
(64,323)
77,571
Unrealized gain/(loss) on RMBS, net
51,590
(134,822)
102,237
(167,870)
Unrealized gain/(loss) on securitized debt
(364)
887
(354)
15
Unrealized gain/(loss) on securitized mortgage loans, net
2,042
(3,473)
3,096
(625)
Unrealized gain on other investment securities
54
-
176
-
Other, net
(49)
43
(31)
68
Other Income/(Loss), net
19,068
$
(101,504)
$
21,919
(122,554)
$
Operating Expenses:
($545) of non-cash stock based compensation, respectively)
(2,921)
$
(2,434)
$
(6,016)
$
(5,285)
$
(2,774)
(2,921)
(5,560)
(5,710)
Total Operating Expenses
(5,695)
$
(5,355)
$
(11,576)
(10,995)
$
Net Income/(Loss)
44,004
$
(72,767)
$
71,886
$
(67,427)
$
Preferred Stock Dividends Declared
(3,450)
(3,450)
(6,900)
(6,900)
Net Income/(Loss) Allocable to Common Stock and
Participating Securities
40,554
$
(76,217)
$
64,986
$
(74,327)
$
1.26
$
(2.39)
$
2.02
$
(2.59)
$
1.25
$
(2.39)
$
2.01
$
(2.59)
$
Dividends Declared per Share of Common
Stock 0.42
$
0.70
$
0.82
$
1.40
$
Three Months Ended
June 30,
Six Months Ended
June 30,
(Unaudited)
(Unaudited)
Earnings/(Loss) per Share of Common Stock - Basic
Earnings/(Loss) per Share of Common Stock - Diluted
$79,778, ($33,185) and $78,119 of unrealized gains/(losses),
net, General and administrative (includes ($408), ($146),
($867) and Management fee - related party
|
 17
APOLLO RESIDENTIAL MORTGAGE, INC. (“AMTG”)
Reconciliation of Operating Earnings
(1)
(1)
Operating Earnings and Operating Earnings per share of common stock are
non-GAAP financial measures. Operating Earnings and Operating Earnings per hare of common stock presented exclude, as applicable: (i) certain realized and unrealized gains and losses recognized through earnings;
(ii) non-cash equity compensation; (iii) one time events pursuant to
changes in GAAP; and (iv) certain other non-cash charges. Operating Earnings represents the earnings, as adjusted, allocable to common stock.
(2)
Reflects per share amount for each component presented.
(in thousands—except share and per share data)
June 30, 2014
Per Share
Amount
(2)
June 30, 2013
Per Share
Amount
(2)
Operating Earnings:
Net income/(loss) allocable to common stockholders
40,291
$
1.26
$
(76,356)
$
(2.39)
$
Adjustments:
Non-cash stock-based compensation expense
408
0.01
146
-
Unrealized (gain)/loss on RMBS, net
(51,590)
(1.61)
134,822
4.21
Unrealized (gain)/loss on derivatives, net
14,467
0.45
(79,778)
(2.49)
Unrealized (gain)/loss on securitized mortgage loans, net
(2,042)
(0.06)
3,473
0.11
Unrealized (gain)/loss on securitized debt
364
0.01
(887)
(0.03)
Unrealized (gain) on other investment securities
(54)
-
-
-
Realized loss on sale of RMBS, net
7,072
0.22
47,508
1.49
Realized (gain)/loss on Swaps/Swaption terminations and
expirations, net
7,585
0.24
(10,028)
(0.31)
Tax amortization of gain/(loss) on Swaption terminations and
expirations, net
(48)
-
-
-
Other
68
-
-
-
Total adjustments to arrive at operating earnings:
(23,770)
(0.74)
95,256
2.98
Operating Earnings
16,521
$
0.52
$
18,900
$
0.59
$
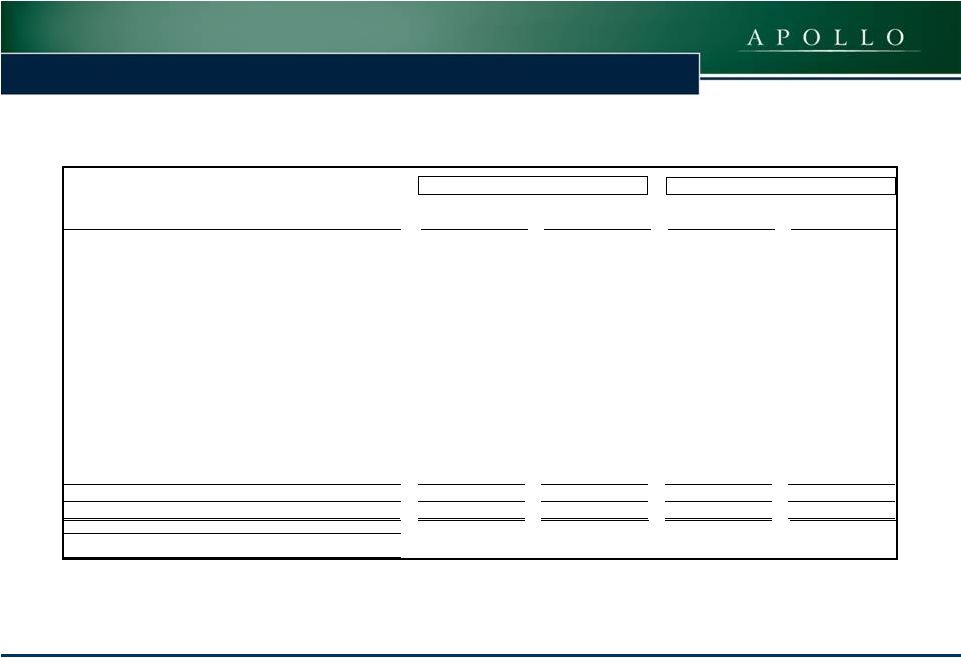
Weighted average common shares
32,019,863
31,995,321
Three Months Ended
Three Months Ended |
 18
APOLLO RESIDENTIAL MORTGAGE, INC. (“AMTG”)
Reconciliation
of
Operating
Earnings
(1)
and
Effective
Cost
of
Funds
(2)
(1)
Operating Earnings and Operating Earnings per common share are
non-GAAP financial measures. Operating Earnings and Operating Earnings per common share presented exclude, as applicable: (i) certain realized and unrealized gains and losses recognized through
earnings; (ii) non-cash equity compensation; (iii) one time events
pursuant to changes in GAAP; and (iv) certain other non-cash charges. Operating Earnings represents the earnings, as adjusted, allocable to common stock.
(2)
Effective cost of funds reflects interest expense adjusted to include
the net interest component related to Swaps. (3)
Reflects per share amount for each component presented.
(4)
Effective Cost of Funds
($ in thousands)
Reconciliation
Cost of Funds/Effective
Cost of Funds
Interest expense
7,510
$
1.01%
Adjustment:
Net-interest paid for Swaps
5,081
0.68%
Effective interest expense/effective cost of funds
12,591
$
1.69%
Weighted average balance of borrowings
2,939,415
$
June 30, 2014
Three Months Ended
(in thousands—except share and per share data)
June 30, 2014
Per Share
Amount
(3)
June 30, 2013
Per Share
Amount
(3)
Operating Earnings:
Net income/(loss) allocable to common stockholders
64,570
$
2.02
$
(74,600)
$
(2.59)
$
Adjustments:
Non-cash stock-based compensation expense
867
0.03
545
0.02
Unrealized (gain)/loss on RMBS, net
(102,237)
(3.19)
167,870
5.82
Unrealized (gain)/loss on derivatives, net
33,185
1.04
(78,119)
(2.71)
Unrealized (gain)/loss on securitized mortgage loans, net
(3,096)
(0.10)
625
0.02
Unrealized (gain)/loss on securitized debt
354
0.01
(15)
-
Unrealized (gain) on other investment securities
(176)
(0.01)
-
-
Realized loss on sale of RMBS, net
18,882
0.59
31,713
1.10
Realized (gain)/loss on Swaps/Swaption terminations and
expirations, net
14,112
0.44
(10,028)
(0.34)
Tax amortization of gain/(loss) on Swaption terminations and
expirations, net
(92)
-
-
-
Realized
loss
on
Short
TBA
Contracts
(4)
7,156
0.22
-
-
Other
68
-
-
-
Total adjustments to arrive at operating earnings:
(30,977)
(0.97)
112,591
3.91
Operating Earnings
33,593
$
1.05
$
37,991
$
1.32
$
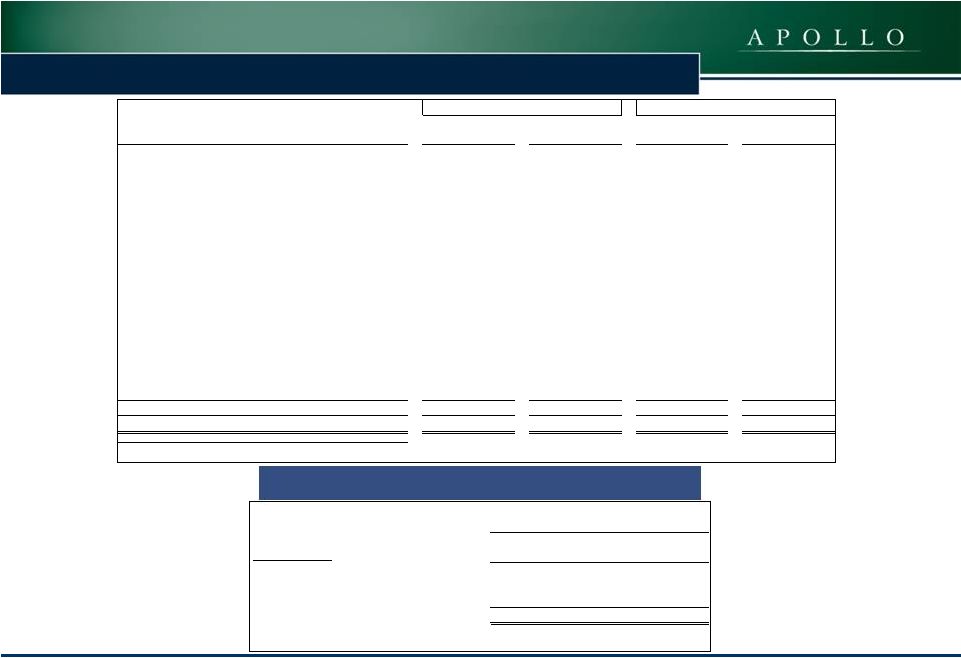
Weighted average common shares
32,017,640
28,858,241
Six Months Ended
Six Months Ended
A Short TBA Contract refers to a “to-be-announced”
contract to sell certain Agency RMBS on a forward basis. |
 19
Contact Information
Hilary Ginsberg
Investor Relations Manager
212-822-0767
APOLLO RESIDENTIAL MORTGAGE, INC. (“AMTG”)
|