Attached files
| file | filename |
|---|---|
| 8-K - FORM 8-K - PUBLIC SERVICE ENTERPRISE GROUP INC | d753031d8k.htm |
 Forward-Looking Statement
EXHIBIT 99
2
Certain of the matters discussed in this report about our and our subsidiaries'
future performance, including, without limitation, future revenues, earnings, strategies, prospects, consequences
and all other statements that are not purely historical constitute
“forward-looking statements” within the meaning of the Private Securities Litigation Reform Act of 1995. Such forward-looking
statements are subject to risks and uncertainties, which could cause actual
results to differ materially from those anticipated. Such statements are based on management's beliefs as well as
assumptions made by and information currently available to management. When used
herein, the words “anticipate,” “intend,” “estimate,” “believe,” “expect,” “plan,” “should,” “hypothetical,”
“potential,” “forecast,” “project,” variations of
such words and similar expressions are intended to identify forward-looking statements. Factors that may cause actual results to differ are often
presented with the forward-looking statements themselves. Other factors
that could cause actual results to differ materially from those contemplated in any forward-looking statements made
by us herein are discussed in filings we make with the United States Securities
and Exchange Commission (SEC), including our Annual Report on Form 10-K and subsequent reports on Form
10-Q and Form 8-K and available on our website: http://www.pseg.com.
These factors include, but are not limited to: adverse changes in the demand for or the price of the capacity and energy that
we sell into wholesale electricity markets, adverse changes in energy industry law, policies and regulation, including
market structures and a potential shift away from competitive markets toward subsidized market
mechanisms, transmission planning and cost allocation rules, including rules
regarding how transmission is planned and who is permitted to build transmission in the future, and
reliability standards,
any inability of our transmission and distribution businesses to obtain
adequate and timely rate relief and regulatory approvals from federal and state regulators,
changes in federal and state environmental regulations and enforcement that
could increase our costs or limit our operations, changes in nuclear regulation and/or general developments in the nuclear power
industry, including various impacts from any accidents or incidents experienced at our facilities or
by others in the industry, that could limit operations of our nuclear
generating units, actions or activities at one of our nuclear units located on a multi-unit
site that might adversely affect our ability to continue to operate that unit or other units located at the same
site,
any inability to manage our energy obligations, available supply and risks,
adverse outcomes of any legal, regulatory or other proceeding, settlement,
investigation or claim applicable to us and/or the energy industry,
any deterioration in our credit quality or the credit quality of our
counterparties, availability of capital and credit at commercially reasonable terms and
conditions and our ability to meet cash needs, changes in the cost of, or interruption in the supply of, fuel and other
commodities necessary to the operation of our generating units, delays in receipt of necessary permits and approvals for our construction and
development activities, delays or unforeseen cost escalations in our construction and development
activities, any inability to achieve, or continue to sustain, our expected levels of
operating performance, any equipment failures, accidents, severe weather events or other incidents
that impact our ability to provide safe and reliable service to our customers, and any inability to obtain
sufficient insurance coverage or recover proceeds of insurance with respect to
such events, acts of terrorism, cybersecurity attacks or intrusions that could adversely
impact our businesses, increases in competition in energy supply markets as well as competition for
certain transmission projects, any inability to realize anticipated tax benefits or retain tax credits,
challenges associated with recruitment and/or retention of a qualified
workforce, adverse performance of our decommissioning and defined benefit plan trust fund
investments and changes in funding requirements, changes in technology, such as distributed generation and micro grids, and
greater reliance on these technologies, and changes in customer behaviors, including increases in energy efficiency,
net-metering and demand response. All of the forward-looking statements made in this report are qualified by
these cautionary statements and we cannot assure you that the results or developments anticipated by management
will be realized or even if realized, will have the expected consequences to,
or effects on, us or our business prospects, financial condition or results of operations. Readers are cautioned not to
place undue reliance on these forward-looking statements in making any
investment decision. Forward-looking statements made in this report apply only as of the date of this report. While we
may elect to update forward-looking statements from time to time, we
specifically disclaim any obligation to do so, even if internal estimates change, unless otherwise required by applicable
securities laws.
The forward-looking statements contained in this report are intended to
qualify for the safe harbor provisions of Section 27A of the Securities Act of 1933, as amended, and Section 21E of the
Securities Exchange Act of 1934, as amended. |
 GAAP Disclaimer
PSEG presents Operating Earnings in addition to its Income from Continuing
Operations/Net Income reported in accordance with accounting principles
generally accepted in the United States (GAAP). Operating Earnings is a
non- GAAP financial measure that differs from Income from Continuing
Operations/Net Income because it excludes gains or losses associated
with Nuclear Decommissioning Trust (NDT), Mark-to-Market (MTM)
accounting, and other material one-time items. PSEG presents
Operating Earnings because management believes that it is appropriate
for investors to consider results excluding these items in addition to
the results reported in accordance with GAAP. PSEG believes that the
non-GAAP financial measure of Operating Earnings provides a
consistent and comparable measure of performance of its businesses to
help shareholders understand performance trends. This information is
not intended to be viewed as an alternative to GAAP information.
Slides A and B at the end of this presentation include a list of
items excluded
from Income from Continuing Operations/Net Income to reconcile to Operating
Earnings, with a reference to that slide included on each of the
slides where the
non-GAAP information appears.
These materials and other financial releases can be found on the
pseg.com
website under the investor tab, or at http://investor.pseg.com/
3 |
 PSEG 2014 Operating Earnings expected
to be at the upper end of guidance range
$2.44
$2.58
$2.55
-
$2.75E
Reflects increased level of utility investment, pension savings and assumes
normal weather and unit operations for the rest of year
8
2012
2013
2014 Guidance
SEE SLIDE A FOR ITEMS EXCLUDED FROM INCOME FROM CONTINUING
OPERATIONS/NET INCOME TO RECONCILE TO OPERATING
EARNINGS.
E = ESTIMATE.
|
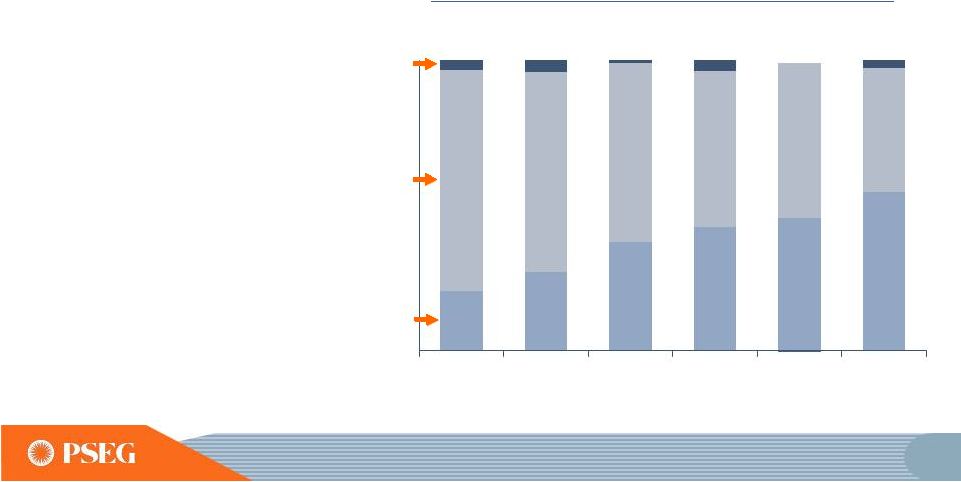 Operating Earnings Mix
Long term investment program has driven increased earnings
contribution from stable, regulated business
*SEE SLIDE A FOR ITEMS EXCLUDED FROM INCOME FROM
CONTINUING OPERATIONS/ NET INCOME TO RECONCILE TO OPERATING EARNINGS;
DISCONTINUED OPERATIONS REFLECT TEXAS. E=ESTIMATE ** 2014
PERCENTS USE MIDPOINT OF EARNINGS GUIDANCE. Power’s
diverse
fuel
mix
and dispatch flexibility
continues to generate
earnings and free cash flow
PSE&G’s
investment
in
transmission has
diversified its asset base
and, coupled with other
investments
and cost controls,
supported compound
annual earnings growth of
~18% over 2009 –
2013
Operating
Earnings*
Contribution
by
Subsidiary
(%)
PSE&G
Power
Other
$2.44
$2.58
$2.55 -
$2.75E
$3.12
$2.74
$3.09
2009
2010
2011
2012
2013
2014E**
9
20%
27%
38%
43%
47%
54%
76%
69%
62%
54%
54%
43% |
 PSEG Q2 2014 Financial Highlights
*SEE SLIDE B FOR ITEMS EXCLUDED FROM NET INCOME TO RECONCILE TO OPERATING
EARNINGS Earnings on Track
Operating earnings of $0.49 vs. $0.48 per share in Q2 2013
Increased earnings contribution from PSE&G’s investment in
Transmission Expect 2014 Operating Earnings to be at the upper end of the
$2.55 to $2.75 per share guidance
range
–
assuming
normal
weather
and
plant
operations
for
the
balance
of
the
year
Operating Review
PSEG Power output down 5% vs. Q2 2013 from Linden and Salem 2 outages,
partially offset by improvement in coal generation
PSE&G placed the 230 kV North Central Reliability transmission project in
service Power’s fleet fully restored from storm outages
PSEG Disciplined Capital Investment
BPU approved $1.22 billion investment in PSE&G’s Energy Strong
infrastructure program PJM
deferred
a
final
decision
on
its
recommended
solution,
to
be
built
by
PSE&G,
for
the
Artificial Island project via FERC 1000 competitive bidding process
Market Developments
Recent EPA actions on 316(b) and GHGs
16 |
 PSE&G’s existing major transmission
investment program remains on schedule and on budget
Major Transmission Projects
Approved
ROE
Inclusion
of CWIP in
Rate Base
100%
Recovery
of Costs
Due to
Abandonment
Project
Estimate
Up To
($ Millions)
Expected
In-service
Date
Susquehanna-Roseland
12.93%
$790
June 2014 /
June 2015
Northeast Grid Reliability
11.93%
$907
June 2015
North Central Reliability
11.68%
$390
Completed
Burlington–Camden 230kV
11.68%
$399
Completed
Mickleton–Gloucester–Camden 230kV
11.68%
$435
June 2015
32 |
 Susquehanna-Roseland consists of constructing
150 miles of 500kV circuit (46 miles in NJ) with two new 500kV
GIS switching stations at Roseland and Hopatcong
Project
Estimate
Up To*
Through
Year-end 2013
Expected
In-service Date
$790M
$661M
June 2014
/ June 2015
•
PJM RTEP project b0489
•
ROE of 12.93% (including 1.25% incentive)
•
100% CWIP in rate base during development
•
100% recovery of prudently incurred costs due to abandonment
Customer Benefit: Improves reliability and reduces congestion
*PROJECT IS SHARED WITH PPL. PROJECT ESTIMATE REPRESENTS
PSE&G’S CONSTRUCTION RESPONSIBILITY FOR THE NJ
PORTION. 33
Project Status: The eastern part of line from Hopatcong to Roseland,
NJ in service April 2014; NJ construction planned to be completed in
Q3 2014. PA portion outside plant construction in progress.
Western portion in NJ and the PA portion is planned to go in service
June 2015. |
 North Central Reliability consists of upgrading
55 circuit miles of 138kV transmission line to 230kV, and
converting six existing stations to 230kV operation
Project Estimate
Up To
Through Year-end
2013
Expected
In-service Date
$390M
$349M
Completed
•
PJM RTEP project b1154
•
ROE of 11.68%
•
100% CWIP in rate base during development
•
100% recovery of prudently incurred costs due to abandonment
Customer Benefit: Improves power quality and increases transfer
Project Status: In service April 2014
35
capability
|
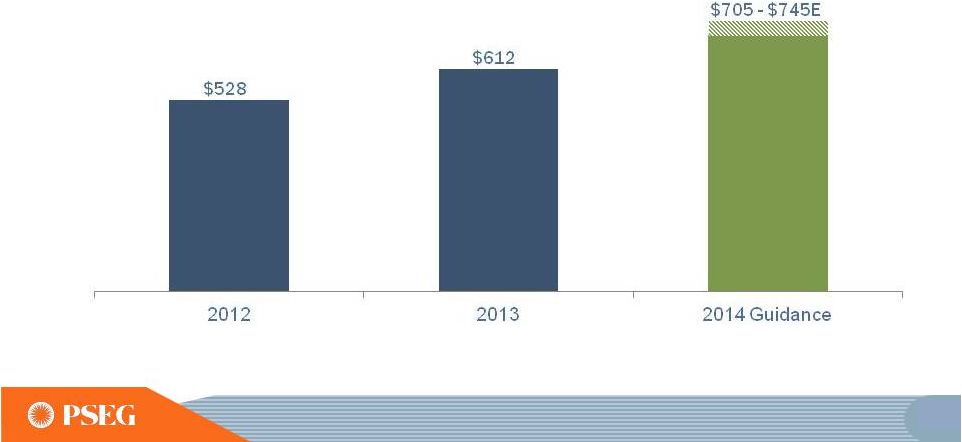 PSE&G’s 2014 operating earnings
to benefit from increased investment in transmission and
on-going cost control
E=ESTIMATE
PSE&G Operating Earnings*
($ Millions)
42
*SEE SLIDE A FOR ITEMS
EXCLUDED FROM INCOME FROM CONTINUING
OPERATIONS/NET INCOME TO RECONCILE TO OPERATING EARNINGS. |
 Hope Creek
Operated by PSEG Nuclear
PSEG Ownership: 100%
Technology: Boiling Water
Reactor
Total Capacity: 1,178 MW
Owned
Capacity:
1,178
MW
License Expiration: 2046
Next Refueling
Spring 2015
Salem
Units 1 and 2
Operated by PSEG Nuclear
PSEG Ownership: 57%
Technology:
Pressurized
Water
Reactor
Total Capacity: 2,365 MW
Owned Capacity: 1,358 MW
License Expiration: 2036
and 2040
Next Refueling
Unit 1 --
Fall 2014
Unit 2 –
Fall 2015
Peach Bottom
Units 2 and 3
Operated by Exelon
PSEG Ownership: 50%
Technology: Boiling Water
Reactor
Total Capacity: 2,251 MW
Owned Capacity:
1,125 MW
License Expiration: 2033
and 2034
Next Refueling
Unit 2 –
Fall 2014
Unit 3 –
Fall 2015
Uprate: 130 MW in
2015/2016
56
PSEG Power Nuclear
is a critical element
of our success |
 PSEG Power Nuclear is core to the fleet and
has competitive advantages
*STRATEGY
KNOWN
AS
THE
“DIVERSE
AND
FLEXIBLE
MITIGATION
CAPABILITY”
OR
FLEX,
ADDRESSES
RECOMMENDATIONS OF THE NUCLEAR REGULATORY COMMISSION’S FUKUSHIMA TASK
FORCE. Continued strong nuclear operations:
nine consecutive years of >90%
capacity factor through 2013
Significant earnings contributor
Top quartile of cost performance/MWh
One third new staff, recruitment of the
best new and experienced talent, and
attractive training
program
Fukushima action plan
in response to NRC staff review
FLEX* plan submitted with implementation
starting with Fall outage
Peach Bottom extended power uprate,
130 MW Power’s share, scheduled in
service 2015/2016
Active and influential participation at
INPO, NEI, EPRI, USA Alliance
57 |
 Shasta A & B
California (4 MW)
COD March 2014
Polycrystalline -
single axis tracker
Investment $13 million
20 year PPAs with PG&E
Hackettstown (Mars)
New Jersey (2 MW)
COD September 2009
Thin film panels –
fixed tilt
Investment $13 million
15 year PPA with Mars, Inc.
Wyandot
Ohio (12 MW)
COD May 2010
Investment $45 million
20 year PPA with AEP
JEA
Florida (15 MW)
Thin film panels –
fixed tilt
Investment $59 million
30 year PPA with JEA
Queen Creek
Arizona (25 MW)
COD October 2012
Polycrystalline -
single axis tracker
Investment $79 million
20 year PPA with SRP
Milford
Delaware (15 MW)
COD December 2012
Polycrystalline -
fixed tilt
Investment $49 million
20 year PPA with DEMEC
Badger I
Arizona (19 MW)
COD November 2013
Polycrystalline -
single axis tracker
Investment $50 million
30 year PPA with APS
PSEG Solar Source owns ~110 MW
of solar facilities with long term contracted revenues*
In Construction
Texas (13 MW)/COD YE 2014E
Polycrystalline -
single axis tracker
Investment $22 million
30 year PPA with El Paso Electric
In Construction
Vermont (4 MW)/COD Oct 2014E
Polycrystalline -
single axis tracker
Investment $10 million
25 year PPA with VT Electric
*PROJECT SIZE IN MEGAWATTS SHOWN IN DC (DIRECT CURRENT).
E=ESTIMATE 65
Thin film panels – fixed tilt
Power Producers, Inc.
COD September 2010 |
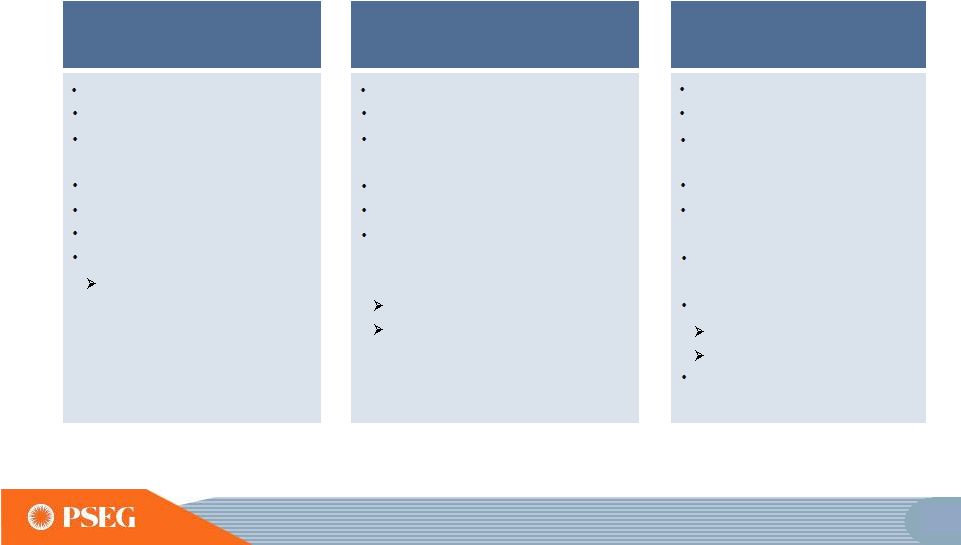
 Environmental restrictions may
tighten market
Insufficient gas infrastructure
continues to place upward pressure on
fuel prices during seasonal peaks
Market liquidity remains weak beyond
2015
F=FORWARDS AS OF 7/25/2014, 2014F INCLUDES HISTORY AND FORWARDS
$-
$1
$2
$3
$4
$5
$6
1/1/2011
1/1/2012
1/1/2013
1/1/2014
1/1/2015
1/1/2016
1/1/2017
1/1/2018
Historical
Forward
$10
$14
$18
$22
$26
$30
$34
$38
2011
2012
2013
2014 F
2015 F
2016 F
2017 F
2018 F
$20
$25
$30
$35
$40
$45
$50
$55
$60
2011
2012
2013
2014F
2015F
2016F
2017F
2018F
NYMEX Natural Gas Price
69
PJM West RTC
PJM West Spark Spreads
Market Review:
Long-term fundamentals remain sound |
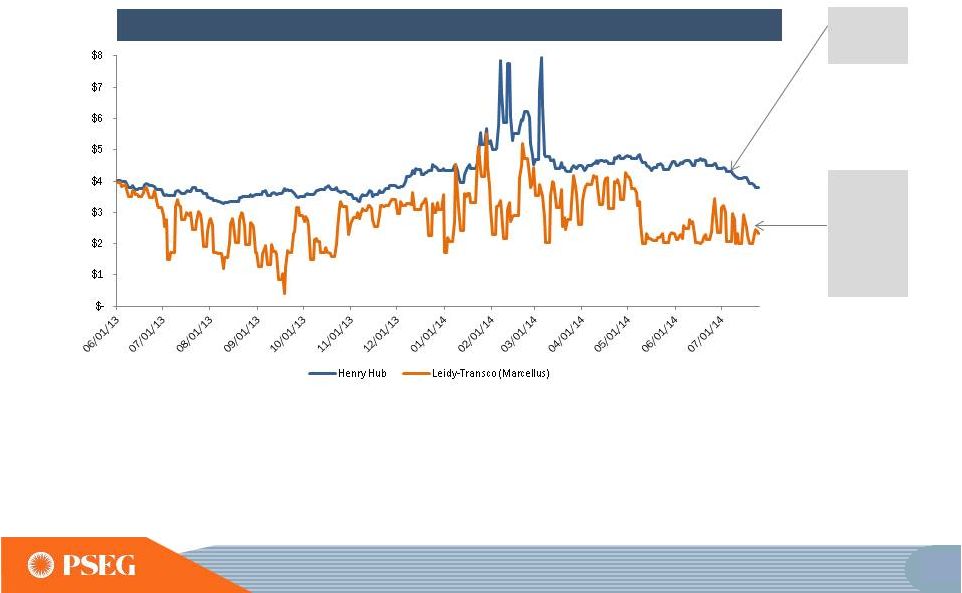 Competitive Advantage:
~25% of Power’s gas
for generation comes from Marcellus
•
Our combined cycle and peaking assets have been able to take advantage of
locational gas price volatility driven by production and logistical
constraints •
Lower cost shale supply provides additional savings during periods of lower
residential gas demand *AS OF 7/25/2014
Spot Natural Gas Prices: June 2013 –
July 2014*
Market
Prices for
Natural Gas
Access
to Lower
Cost Shale
Gas in
Marcellus
and Utica
74 |
 Competitive Advantage:
Locational advantage
from short term basis volatility
$56
-
$58
ANNUAL FORWARD (F) BASIS TO PJM-WEST AS OF 12/31/2013.
Annual basis benefits baseload
units
Intermediate units flexible to
seasonal opportunities
Combined Cycle and Peaking
units positioned to optimize daily
and hourly volatility
PS Zone Annual Basis to PJM-W
PS Zone Day Ahead On Peak Monthly Basis to PJM-W
PS Zone Real Time On Peak Hourly Basis to PJM-W
75 |
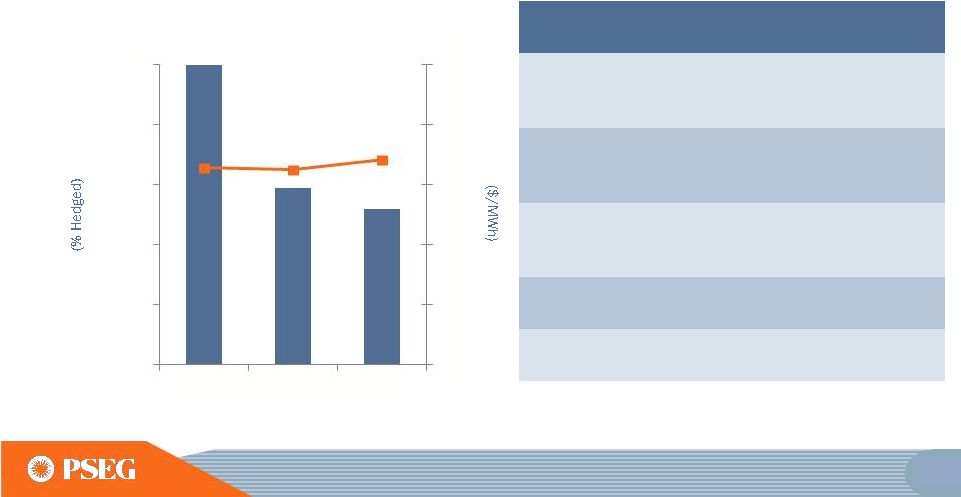
 Sustainable Advantage: Hedging strategy
designed to protect gross margin while leveraging the portfolio
77
HEDGE PERCENTAGES AND PRICES AS OF JUNE 30, 2014. REVENUES OF FULL REQUIREMENT
LOAD DEALS BASED ON CONTRACT PRICE, INCLUDING RENEWABLE ENERGY CREDITS,
ANCILLARY, AND TRANSMISSION COMPONENTS BUT EXCLUDING CAPACITY. HEDGES INCLUDE POSITIONS WITH MTM
ACCOUNTING TREATMENT AND OPTIONS. EXCLUDES SOLAR AND
KALAELOA. Jul-Dec
2014
2015
2016
Base Load
Intermediate Coal, Combined
Cycle, Peaking
Total
(Nuclear and Base Load Coal)
% Hedged
100%
100%
45
-
50%
Volume TWh
17
36
36
Price $/MWh
$50
$50
$51
Volume TWh
13
21
19
% Hedged
35
-
40%
5
-
10%
0%
Price $/MWh
$50
$50
$51
Volume TWh
30
55
-
57
55
-
57
% Hedged
70
-
75%
65
-
70%
30
-
35%
Price $/MWh
$50
$50
$51 |
 Improving Operating Earnings
and increased contribution from PSE&G
PSEG Operating Earnings
$ Millions (except EPS)
2012
2013
2014E
PSE&G
$528
$612
$705 -
$745
PSEG Power
$663
$710
$550 -
$610
Enterprise/Other
$45
($13)
$35 -
$40
Operating Earnings*
$1,236
$1,309
$1,290 -
$1,395
Operating EPS*
$2.44
$2.58
$2.55
-
$2.75
Regulated % of Earnings
43%
47%
53%
-
55%
*
SEE SLIDE A FOR ITEMS EXCLUDED FROM INCOME FROM CONTINUING OPERATIONS/NET
INCOME TO RECONCILE TO OPERATING EARNINGS.
NOTE: 2012 OPERATING EARNINGS RE-STATED FOR TRANSFER OF ASSETS FROM PSEG
HOLDINGS TO PSEG POWER. E=ESTIMATE.
93 |
 Power’s coal hedging reflects 2014 supply
matched with 2014 sales
Station
Coal Type
Pricing
($/MWh)*
Comments
Bridgeport
Harbor
Adaro
Low $40’s
Higher price,
lower BTU,
enviro coal
Hudson
CAPP
Mid $40’s
Coal/Gas
Fuel
Flexibility
Mercer
Metallurgical
CAPP/NAPP
Low $40’s
More limited
segment of
coal market
Keystone
NAPP
Mid $20’s
Prices
steady
Conemaugh
NAPP
Mid $20’s
Prices
steady
% Hedged
(left scale)
$/MWh
(right scale)
102
$0
$10
$20
$30
$40
$50
0%
20%
40%
60%
80%
100%
2014
2015
2016
Contracted Coal
*COMMODITY PLUS TRANSPORTATION. |
 Q2 Operating Earnings by Subsidiary
Operating Earnings
Earnings per Share
$ millions (except EPS)
2014
2013
2014
2013
PSE&G
$ 151
$ 121
$ 0.30
$ 0.24
PSEG Power
87
120
0.17
0.24
PSEG Enterprise/Other
7
2
0.02
-
Operating Earnings*
$ 245
$ 243
$ 0.49
$ 0.48
Quarter ended June 30
* SEE SLIDE
B
FOR
ITEMS
EXCLUDED FROM
NET
INCOME
TO RECONCILE
TO OPERATING EARNINGS.
105 |
 PSEG EPS Reconciliation
–
Q2 2014 vs. Q2 2013
Q2 2014
Operating
Earnings*
Q2 2013
Operating
Earnings*
PSEG Power
PSE&G
PSEG
Enterprise/
Other
$0.48
0.06
0.02
$0.49
(0.07)
0.00
0.10
0.20
0.30
0.40
0.50
0.60
Capacity 0.04
Re-Contracting &
Market Pricing (0.04)
Lower Volume (0.03)
O&M (0.04)
D&A (0.01)
Taxes & Other 0.01
Transmission
Net Earnings 0.03
Gas Volume &
Other Revenue 0.01
Weather (0.01)
O&M 0.02
Lower Interest
Expense 0.01
PSEG
Long Island
and Other
106
* SEE SLIDE B FOR ITEMS EXCLUDED FROM NET INCOME TO RECONCILE TO OPERATING
EARNINGS. |
 First Half Operating Earnings by Subsidiary
Operating Earnings
Earnings per Share
$ millions (except EPS)
2014
2013
2014
2013
PSE&G
$ 365
$ 300
$ 0.72
$ 0.59
PSEG Power
380
374
0.75
0.74
PSEG Enterprise/Other
15
2
0.03
-
Operating Earnings*
$ 760
$ 676
$ 1.50
$ 1.33
Six months ended June 30
107
* SEE SLIDE B FOR ITEMS EXCLUDED FROM NET INCOME TO RECONCILE TO OPERATING
EARNINGS. |
 PSEG EPS Reconciliation
–
YTD 2014 vs. YTD 2013
YTD 2014
Operating
Earnings*
YTD 2013
Operating
Earnings*
PSEG Power
PSE&G
PSEG
Enterprise/
Other
$1.50
0.03
0.01
0.13
$1.33
0.00
0.25
0.50
0.75
1.00
1.25
1.50
1.75
Capacity 0.15
Re-Contracting
& Market Pricing
(0.04)
Lower Volume (0.01)
O&M (0.08)
D&A (0.01)
Transmission
Net Earnings 0.06
Gas Volume,
Demand & Other
Revenue 0.03
Distribution
O&M 0.02
Lower Interest
Expense 0.01
Taxes & Other 0.01
PSEG Long
Island and
Other
108
* SEE SLIDE B FOR ITEMS EXCLUDED FROM NET INCOME TO RECONCILE TO OPERATING
EARNINGS. |
 June
30, 2014 $ Billions
PSEG
PSE&G
Power
Cash and Cash Equivalents
$0.6
$0.3
$0.0
Short Term Debt
$0.0
$0.0
N/A
Long
Term
Debt
8.6
6.1
2.5
Common Equity
11.8
6.4
5.5
Total Capitalization
$20.4
$12.5
$8.0
Total Debt / Capitalization
42%
49%
32%
PSE&G
Regulated
Equity
Ratio
51%
Our balance sheet remains strong
109
(2)
(1)
REGULATED EQUITY RATIO INCLUDES CUSTOMER DEPOSITS OF ~$97 MILLION AND EXCLUDES
SHORT-TERM DEBT..
DOES NOT INCLUDE SECURITIZATION DEBT OF $385 MILLION. (2)
(1) |
 PSEG Liquidity as of June 30, 2014
$235
110
Expiration
Total
Available
Company
Facility
Date
Facility
Usage
Liquidity
($Millions)
PSE&G
5-year Credit Facility
Mar-18
$600
1
$13
$587
5-Year Credit Facility (Power)
Apr-19
$1,600
$114
$1,486
5-Year Credit Facility (Power)
Mar-18
$1,000
2
$0
$1,000
5-Year Bilateral (Power)
Sep-15
$100
$100
$0
5-year Credit Facility (PSEG)
Apr-19
$500
$8
$492
5-year Credit Facility (PSEG)
Mar-18
$500
3
$0
$500
Total
$4,300
$4,065
1 PSE&G Facility to be reduced by $29M on April 15, 2016
$278
2 Power Facility to be reduced by $48M on April 15, 2016
PSE&G ST Investment
$224
3 PSEG Facility to be reduced by $23M on April 15, 2016
Total Liquidity Available
$4,567
Total Parent / Power Liquidity
$3,756
PSEG /
Power
PSEG Money Pool ST Investment |
 PSEG Energy Holdings
Investment Portfolio
*BOOK BALANCE EXCLUDING DEFERRED TAX ACCOUNTS.
**EME AND ITS SUBSIDIARIES FILED CHAPTER 11 BANKRUPTCY ON 12/17/2012.
ON APRIL 1,2014, EME WAS ACQUIRED BY NRG; ALL MONETARY DEFAULTS WERE CURED AT
CLOSING WITH NO CHANGE TO HOLDINGS’
STATED EQUITY VALUE.
111
Merchant Energy Leases
NRG REMA
Keystone, Conemaugh & Shawville (PA)
3 coal-fired plants (1,162 equity MW)
$345
NRG Energy/Midwest Gen **
Powerton & Joliet Generating Stations
(IL)
2 coal-fired generating facilities (1,640 equity MW)
$218
Regulated Energy Leases
Merrill Creek
Reservoir in NJ (PECO, MetEd, Delmarva Power & Light)
$195
Grand Gulf
Nuclear station in Mississippi (175 equity MW)
Real Estate Leveraged Leases
GM Renaissance Center; Wal-Marts; E-D (shopping) Centers
$73
Real Estate Operating Leases
Office Towers, Shopping Centers -
28 properties
$57
Generation Legacy Assets
GWF (in wind down stage), Bridgewater, GSOE
$4
Other
Land & Receivables
$7
Total Holdings Investments
$899
Equipment
Investment Balance
*
at 6/30/14
($millions) |
 Items Excluded from Income from Continuing
Operations/Net Income to Reconcile to Operating Earnings
PLEASE SEE PAGE 3 FOR AN EXPLANATION OF PSEG’S USE OF OPERATING EARNINGS
AS A NON-GAAP FINANCIAL MEASURE AND HOW IT DIFFERS FROM NET
INCOME. Includes the financial impact from positions with forward
delivery months. A
2013
2012
2011
2010
2009
2008
Earnings Impact ($ Millions)
Operating Earnings
1,309
$
1,236
$
1,389
$
1,584
$
1,567
$
1,478
$
Gain (Loss) on Nuclear Decommissioning Trust (NDT)
Fund Related Activity (PSEG Power)
40
52
50
46
9
(71)
Gain
(Loss)
on
Mark-to-Market
(MTM)
(a)
(PSEG
Power)
(74)
(10)
107
(1)
(11)
14
Lease Transaction Activity (PSEG Enterprise/Other)
-
36
(173)
-
29
(490)
Storm O&M (PSEG Power)
(32)
(39)
-
-
-
-
Market Transition Charge Refund (PSE&G)
-
-
-
(72)
-
-
Gain (Loss) on Asset Sales and Impairments (PSEG Enterprise/Other)
-
-
34
-
-
(13)
Income from Continuing Operations
1,243
$
1,275
$
1,407
$
1,557
$
1,594
$
918
$
Discontinued Operations
-
-
96
7
(2)
270
Net Income
1,243
$
1,275
$
1,503
$
1,564
$
1,592
$
1,188
$
Fully Diluted Average Shares Outstanding (in Millions)
508
507
507
507
507
508
Per Share Impact (Diluted)
Operating Earnings
2.58
$
2.44
$
2.74
$
3.12
$
3.09
$
2.91
$
Gain (Loss) on NDT Fund Related Activity (PSEG Power)
0.08
0.10
0.10
0.09
0.02
(0.14)
Gain
(Loss)
on
MTM
(a)
(PSEG
Power)
(0.14)
(0.02)
0.21
-
(0.02)
0.03
Lease Transaction Activity (PSEG Enterprise/Other)
-
0.07
(0.34)
-
0.05
(0.96)
Storm O&M (PSEG Power)
(0.07)
(0.08)
-
-
-
-
Market Transition Charge Refund (PSE&G)
-
-
-
(0.14)
-
-
Gain (Loss) on Asset Sales and Impairments (PSEG Enterprise/Other)
-
-
0.06
-
-
(0.03)
Income from Continuing Operations
2.45
$
2.51
$
2.77
$
3.07
$
3.14
$
1.81
$
Discontinued Operations
-
-
0.19
0.01
-
0.53
Net Income
2.45
$
2.51
$
2.96
$
3.08
$
3.14
$
2.34
$
For the Year Ended
December 31,
(Unaudited)
PUBLIC SERVICE ENTERPRISE GROUP INCORPORATED
Reconciling Items, net of tax
(a) |
 Items Excluded from Income from Continuing
Operations/Net Income to Reconcile to Operating Earnings
PLEASE SEE PAGE 3 FOR AN EXPLANATION OF PSEG’S USE OF OPERATING EARNINGS
AS A NON-GAAP FINANCIAL MEASURE AND HOW IT DIFFERS FROM NET
INCOME. B
2014
2013
2014
2013
2013
2012
Earnings Impact ($ Millions)
Operating Earnings
245
$
243
$
760
$
676
$
1,309
$
1,236
$
Gain (Loss) on Nuclear Decommissioning Trust (NDT)
Fund Related Activity (PSEG Power)
14
8
23
17
40
52
Gain (Loss) on Mark-to-Market (MTM)
(a)
(PSEG Power)
(42)
80
(174)
(25)
(74)
(10)
Lease Related Activity (PSEG Enterprise/Other)
-
-
-
-
-
36
Storm O&M, net of insurance recoveries (PSEG Power)
(5)
2
(11)
(15)
(32)
(39)
Net Income
212
$
333
$
598
$
653
$
1,243
$
1,275
$
Fully Diluted Average Shares Outstanding (in Millions)
508
507
508
507
508
507
Per Share Impact (Diluted)
Operating Earnings
0.49
$
0.48
$
1.50
$
1.33
$
2.58
$
2.44
$
Gain (Loss) on NDT Fund Related Activity (PSEG Power)
0.02
0.02
0.04
0.04
0.08
0.10
Gain (Loss) on MTM
(a)
(PSEG Power)
(0.08)
0.16
(0.34)
(0.05)
(0.14)
(0.02)
Lease Related Activity (PSEG Enterprise/Other)
-
-
-
-
-
0.07
Storm O&M, net of insurance recoveries (PSEG Power)
(0.01)
-
(0.02)
(0.03)
(0.07)
(0.08)
Net Income
0.42
$
0.66
$
1.18
$
1.29
$
2.45
$
2.51
$
(a) Includes the financial impact from positions with forward delivery months.
June 30,
June 30,
December 31,
(Unaudited)
PUBLIC SERVICE ENTERPRISE GROUP INCORPORATED
Reconciling Items, net of tax
Three Months Ended
Six Months Ended
Year Ended |