Attached files
| file | filename |
|---|---|
| EX-5.1 - EX-5.1 - Jason Industries, Inc. | d755966dex51.htm |
Table of Contents
As filed with the Securities and Exchange Commission on August 4, 2014
Registration No. 333-197412
UNITED STATES
SECURITIES AND EXCHANGE COMMISSION
Washington, D.C. 20549
Amendment No. 1
to
FORM S-1
REGISTRATION STATEMENT
UNDER
THE SECURITIES ACT OF 1933
Jason Industries, Inc.
(Exact Name of Registrant as Specified in its Charter)
| Delaware | 3990 | 46-2888322 | ||
| (State or Other Jurisdiction of Incorporation or Organization) |
(Primary Standard Industrial Classification Code Number) |
(I.R.S. Employer Identification No.) |
411 East Wisconsin Avenue
Suite 2100
Milwaukee, WI 53202
(414) 277-9300
(Address, Including Zip Code, and Telephone Number, Including Area Code, of Registrant’s Principal Executive Offices)
William P. Schultz
General Counsel
411 East Wisconsin Avenue, Suite 2100
Milwaukee, WI 53202
(414) 277-9300
(Name, Address, Including Zip Code, and Telephone Number, Including Area Code, of Agent for Service)
Copies to:
| Robert H. Friedman, Esq. Kenneth A. Schlesinger, Esq. Olshan Frome Wolosky LLP 65 East 55th Street New York, New York 10022 (212) 451-2300 |
Christian O. Nagler Kirkland & Ellis LLP 601 Lexington Avenue New York, New York 10022 (212) 446-4800 |
Approximate date of commencement of proposed sale to the public: From time to time after the effective date of this Registration Statement.
If any of the securities being registered on this Form are to be offered on a delayed or continuous basis pursuant to Rule 415 under the Securities Act of 1933, check the following box. x
If this Form is filed to register additional securities for an offering pursuant to Rule 462(b) under the Securities Act, check the following box and list the Securities Act registration statement number of the earlier effective registration statement for the same offering. ¨
If this Form is a post-effective amendment filed pursuant to Rule 462(c) under the Securities Act, check the following box and list the Securities Act registration statement number of the earlier effective registration statement for the same offering. ¨
If this Form is a post-effective amendment filed pursuant to Rule 462(d) under the Securities Act, check the following box and list the Securities Act registration statement number of the earlier effective registration statement for the same offering. ¨
Indicate by check mark whether the registrant is a large accelerated filer, an accelerated filer, a non-accelerated filer, or a smaller reporting company. See the definitions of “large accelerated filer,” “accelerated filer” and “smaller reporting company” in Rule 12b-2 of the Exchange Act. (Check one):
| Large accelerated filer | ¨ | Accelerated filer | ¨ | |||
| Non-accelerated filer | x (Do not check if a smaller reporting company) | Smaller reporting company | ¨ | |||
Table of Contents
CALCULATION OF REGISTRATION FEE
|
| ||||||||
| Title of each class of securities to be registered |
Amount to be registered |
Proposed maximum offering price per unit |
Proposed maximum aggregate offering price |
Amount of registration fee | ||||
| Common Stock, par value $0.0001 per share, underlying Warrants |
13,993,773(1) | $12.00(2) | $167,925,276 | $21,629 | ||||
| Common Stock, par value $0.0001 per share |
3,485,623(3) | $10.40(4) | $36,250,480 | $4,670 | ||||
| Common Stock, par value $0.0001 per share |
7,283,333(5) | $10.40(6) | $75,746,664 | $9,757 | ||||
| Common Stock, par value $0.0001 per share |
3,653,100(7) | — (8) | — (8) | — (8) | ||||
| Warrants to purchase Common Stock |
1,150,000(9) | — (10) | — (10) | — (10) | ||||
| 8.0% Series A Convertible Perpetual Preferred Stock, par value $0.0001 per share |
66,868(11) | $1,000(12) | $66,868,000 | $8,613 | ||||
| TOTAL | $346,790,420 | $44,669(13) | ||||||
|
| ||||||||
|
| ||||||||
| (1) | Represents the issuance by the Registrant of (i) 17,250,000 shares of common stock underlying warrants originally sold as part of units in the Registrant’s initial public offering and (ii) 1,150,000 shares of common stock underlying warrants sold as part of the units issued in a private placement that closed simultaneously with the consummation of the Registrant’s initial public offering. Pursuant to Rule 416, there are also being registered such indeterminable additional shares of common stock as may be issued to prevent dilution as a result of stock splits, stock dividends or similar transactions. |
| (2) | Based on the exercise price of a warrant in accordance with Rule 457(g) under the Securities Act. |
| (3) | Represents the resale of shares of common stock that can be issued by the Registrant from time to time to the holders of an equivalent number of shares of common stock of JPHI Holdings Inc., a subsidiary of the Registrant (“JPHI”), upon the exchange by such holders of their shares of JPHI common stock for shares of common stock of the Registrant. |
| (4) | Estimated at $10.40 per share, the average of the high and low prices of the Registrant’s common stock as reported on The NASDAQ Stock Market on July 10, 2014, solely for the purpose of calculating the registration fee in accordance with Rule 457(f)(1) under the Securities Act. |
| (5) | Represents the resale of (i) 6,133,333 shares of common stock issued prior to our initial public offering and (ii) 1,150,000 shares of common stock sold as part of units issued in a private placement that closed simultaneously with the consummation of our initial public offering. |
| (6) | Estimated at $10.40 per share, the average of the high and low prices of the Registrant’s common stock as reported on The NASDAQ Stock Market on July 10, 2014, solely for the purpose of calculating the registration fee in accordance with Rule 457(c) under the Securities Act. |
| (7) | Represents the resale of 3,653,100 shares of common stock that can be issued upon conversion of the Registrant’s 8.0% Series A Convertible Perpetual Preferred Stock. |
| (8) | No fee pursuant to Rule 457(i) under the Securities Act. |
| (9) | Represents the resale of warrants to purchase common stock sold as part of units issued in a private placement that closed simultaneously with the consummation of our initial public offering. |
| (10) | No fee pursuant to Rule 457(g) under the Securities Act. |
| (11) | Represents the resale of (i) 45,000 shares of 8.0% Series A Convertible Perpetual Preferred Stock sold pursuant to a private placement which closed simultaneously with our initial business combination plus, (ii) as of July 10, 2014, an additional 21,868 shares of 8.0% Series A Convertible Perpetual Preferred Stock potentially issuable over the next five years as dividends. Pursuant to Rule 416, there are also being registered such indeterminable additional shares of common stock as may be issued to prevent dilution as a result of stock splits, stock dividends or similar transactions. |
| (12) | Calculated in accordance with Rule 457(i) under the Securities Act. |
| (13) | The Registrant previously paid a filing fee of $51,480 in connection with the initial filing of this Form S-1 Registration Statement. |
The Registrant hereby amends this Registration Statement on such date or dates as may be necessary to delay its effective date until the Registrant shall file a further amendment which specifically states that this Registration Statement shall thereafter become effective in accordance with Section 8(a) of the Securities Act, or until the Registration Statement shall become effective on such date as the Securities and Exchange Commission acting pursuant to said Section 8(a), may determine.
Table of Contents
The information contained in this prospectus is not complete and may be changed. No securities may be sold until the registration statement filed with the Securities and Exchange Commission is effective. This prospectus is not an offer to sell these shares, and it is not soliciting an offer to buy these securities in any state where the offer or sale is not permitted.
Subject to Completion, dated August 4, 2014
Preliminary Prospectus
JASON INDUSTRIES, INC.
13,993,773 Shares of Common Stock Issuable upon Exercise of Outstanding Warrants
14,422,056 Shares of Common Stock
1,150,000 Warrants to Purchase Common Stock
66,868 Shares of 8.0% Series A Convertible Perpetual Preferred Stock
This prospectus relates to the issuance by us of (i) 12,843,773 shares of our common stock, par value $0.0001 per share (the “Common Stock”) upon the exercise of warrants which were originally issued as part of units in our initial public offering (the “Public Warrants”), and (ii) 1,150,000 shares of Common Stock upon the exercise of warrants, which were originally issued as part of units in a private placement that closed simultaneously with the consummation of our initial public offering (the “IPO Placement Warrants” and, together with the Public Warrants, the “Warrants”). Each Warrant entitles the holder to purchase one share of our Common Stock at an exercise price of $12.00 per share. We will receive the proceeds from the exercise of the Warrants, but not from the sale of the underlying Common Stock.
This prospectus also relates to the resale of 14,422,056 shares of our Common Stock, 1,150,000 IPO Placement Warrants, and 66,868 shares of our 8.0% Series A Convertible Perpetual Preferred Stock, par value $0.0001 per share (the “Series A Convertible Preferred Stock”), by the selling security holders named in this prospectus or their permitted transferees. The shares of Common Stock being offered by the selling security holders consists of (i) 3,485,623 shares of Common Stock that can be issued from time to time to the holders of an equivalent number of shares of common stock (the “JPHI stock”) of our subsidiary, JPHI Holdings Inc., a Delaware corporation (“JPHI”), upon the exchange by such holders of JPHI stock for shares of our Common Stock (the “Rollover Shares”), (ii) 6,133,333 shares of Common Stock issued prior to our initial public offering (the “founder shares”), (iii) 1,150,000 shares of Common Stock sold as part of units issued in a private placement that closed simultaneously with the consummation of our initial public offering (the “IPO Placement Shares”), and (iv) 3,653,100 shares of Common Stock that can be issued upon conversion of our Series A Convertible Preferred Stock, which Series A Convertible Preferred Stock was issued in a private placement that closed simultaneously with our initial business combination (the “PIPE Investment”).
The selling security holders may offer, sell or distribute all or a portion of their securities publicly or through private transactions at prevailing market prices or at negotiated prices. We will not receive any of the proceeds from the sale of the securities owned by the selling security holders. We will bear all costs, expenses and fees in connection with the registration of these securities, including with regard to compliance with state securities or “blue sky” laws. The selling security holders will bear all commissions and discounts, if any, attributable to their sale of securities. See “Plan of Distribution” beginning on page 147 of this prospectus.
Our Common Stock and Warrants are quoted on The NASDAQ Stock Market under the symbols “JASN,” and “JASNW.” There is no established trading market for the Series A Convertible Preferred Stock. On August 1, 2014, the closing price of our Common Stock and Warrants was $10.41 and $1.40, respectively. As of August 1, 2014, we had 21,990,666 shares of Common Stock, 13,993,773 Warrants and 45,000 shares of Series A Convertible Preferred Stock issued and outstanding.
Our principal executive offices are located at 411 East Wisconsin Avenue, Suite 2100, Milwaukee, Wisconsin 53202, and our telephone number is (414) 277-9300.
INVESTING IN THESE SECURITIES INVOLVES CERTAIN RISKS. SEE “RISK FACTORS” ON PAGE 8.
Neither the Securities and Exchange Commission nor any state securities commission has approved or disapproved of these securities or determined if this prospectus is truthful or complete. Any representation to the contrary is a criminal offense.
Our securities are not being offered in any jurisdiction where the offer is not permitted under applicable local laws.
The date of this prospectus is , 2014
Table of Contents
| 2 | ||||
| 8 | ||||
| 32 | ||||
| 33 | ||||
| 33 | ||||
| 34 | ||||
| RATIO OF EARNINGS TO FIXED CHARGES AND TO FIXED CHARGES AND PREFERENCE DIVIDENDS |
35 | |||
| 36 | ||||
| UNAUDITED PRO FORMA CONDENSED COMBINED FINANCIAL INFORMATION |
39 | |||
| 54 | ||||
| MANAGEMENT’S DISCUSSION AND ANALYSIS OF FINANCIAL CONDITION AND RESULTS OF OPERATIONS |
67 | |||
| 108 | ||||
| 115 | ||||
| 136 | ||||
| SECURITY OWNERSHIP OF CERTAIN BENEFICIAL OWNERS AND MANAGEMENT |
139 | |||
| 143 | ||||
| 148 | ||||
| 151 | ||||
| 159 | ||||
| 165 | ||||
| 165 | ||||
| 165 | ||||
| F-1 |
You should rely only on the information contained in this prospectus. We have not authorized anyone to provide you with different information from that contained in this prospectus. We are not making an offer of these securities in any jurisdiction where the offer is not permitted. You should not assume that the information contained in this prospectus is accurate as of any date other than the date on the front cover of this prospectus.
i
Table of Contents
This summary highlights certain information appearing elsewhere in this prospectus. For a more complete understanding of this offering, you should read the entire prospectus carefully, including the risk factors and the financial statements. Unless the context indicates otherwise, the terms “Jason,” “the Company,” “we,” “us” and “our” refer to Jason Industries, Inc., a Delaware corporation and its subsidiaries.
Background
We were originally formed in May 2013 as a blank check company under the name Quinpario Acquisition Corp. (“QPAC”) for the purpose of effecting a merger, capital stock exchange, asset acquisition, stock purchase, reorganization or similar business combination involving QPAC and one or more businesses. Until the consummation of the Business Combination (as defined below), QPAC’s securities were traded on The NASDAQ Stock Market (“Nasdaq”) under the ticker symbols “QPAC,” “QPACU” and “QPACW.”
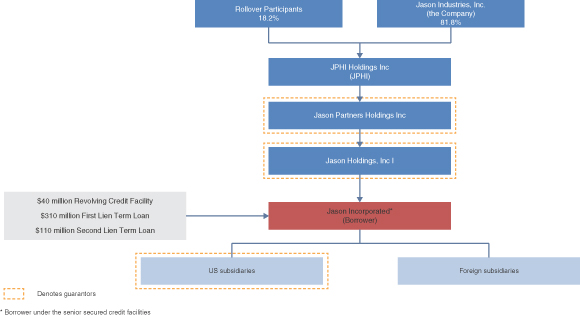
On June 30, 2014, we completed our initial business combination (the “Business Combination”) with Jason Incorporated pursuant to a stock purchase agreement dated as of March 16, 2014 (the “Purchase Agreement”) that provided for the acquisition of all of the capital stock of Jason Partners Holdings Inc., the indirect parent company of Jason Incorporated, by JPHI from Jason Partners Holdings LLC (“Seller”) and certain members of Seller. In connection with the Business Combination, we entered into new senior secured credit facilities with a syndicate of lenders led by Deutsche Bank AG New York Branch, as administrative agent, in the aggregate amount of approximately $460.0 million, which was primarily used to refinance Jason Incorporated’s existing indebtedness, pay transaction fees and expenses and pay a portion of the purchase price under the Purchase Agreement. The purchase price under the Purchase Agreement was also funded with cash held in our trust account, the contribution of Jason Partners Holdings Inc. common stock to JPHI by certain members of Seller and certain directors and management of Jason, including each of our named executive officers (collectively, the “Rollover Participants”) in exchange for JPHI stock, and the proceeds from the sale of Series A Convertible Preferred Stock in a private placement that closed simultaneously with the Business Combination, which we refer to as the PIPE Investment.
Following the Business Combination, Jason Incorporated became an indirect majority-owned subsidiary of ours and our only significant asset, with the Rollover Participants indirectly owning approximately 18.2% of Jason Incorporated and the Company indirectly owning approximately 81.8% of Jason Incorporated. Upon the closing of the Business Combination, we increased the size of our board of directors from six to nine directors and Jason Incorporated’s executive officers became our executive officers. We also changed our name from “Quinpario Acquisition Corp.” to “Jason Industries, Inc.” and continued the listing of our Common Stock and Warrants on Nasdaq under the symbols “JASN” and “JASNW,” respectively, effective July 1, 2014.
2
Table of Contents
Organizational Chart
Presentation of Financial and Operating Data
The Business Combination will be accounted for using the acquisition method of accounting under the provisions of Accounting Standards Codification 805, “Business Combinations”. Accordingly, we are treated as the legal and accounting acquirer and Jason Partners Holdings Inc. is treated as the legal and accounting acquiree. However, Jason Partners Holdings Inc. is considered to be our accounting predecessor, and therefore unless otherwise indicated, the financial information and operating data presented in this prospectus is that of Jason Partners Holdings Inc. The historical financial statements of Quinpario Acquisition Corp. (a development stage company) for the year ended December 31, 2013 (audited) and the interim period ended March 31, 2014 (unaudited) are not included in this registration statement, but were included in the definitive proxy statement of Quinpario Acquisition Corp. filed with the Securities and Exchange Commission on June 16, 2014.
Our Company
We are a global industrial manufacturing company operating in the following industry sectors: agricultural, construction and industrial manufacturing. We operate in these sectors through four businesses: finishing, seating, acoustics and components. Jason Incorporated was founded in 1985 and today provides critical components and manufacturing solutions to customers across a wide range of end markets, industries and geographies through a global network of 33 manufacturing facilities and 16 sales offices, warehouses and joint venture facilities throughout the United States and 14 foreign countries. We are led by a corporate and business management team with an average of 25 years of experience and have embedded relationships with long standing customers, superior scale and resources and industry leading capability to design and manufacture specialized products on which our customers rely.
Our goal is to focus on markets with sustainable growth characteristics and where we believe we are, or have the opportunity to become, the industry leader. Our finishing business focuses on the production of industrial brushes, buffing wheels and buffing compounds that are used in a broad range of industrial and infrastructure applications. While our finishing business competes with numerous domestic and international companies across numerous product lines, the market is highly fragmented with most participants having single
3
Table of Contents
or limited product lines and serving specific geographic markets. We believe that resurgence in demand from the manufacturing, industrial and energy markets is driving demand for finishing products. In the long-term, the finishing market is closely tied to overall growth in industrial production, which we believe has fundamental and significant long-term growth potential. Our seating business supplies seating solutions to equipment manufacturers in the motorcycle, lawn and turf care, industrial, agricultural, construction and power sports end markets and is the sole supplier of original equipment manufacturer (“OEM”) seating to a major U.S.-based manufacturer of heavy motorcycles. The market for seating products is dominated by several large domestic and international participants who are often awarded contracts as the sole supplier for a particular product. Production and demand for motorcycles, lawn and garden equipment and construction equipment has rebounded since the recession and we expect activity to continue to improve in these sectors. The acoustics business manufactures engineered non-woven, fiber-based acoustical products for the North American auto industry. The market for automotive acoustical products is dominated by several large domestic and international participants who are often awarded contracts as the sole supplier for a particular automotive platform based on innovative styling, price or acoustical performance of their products. The components business is a diversified manufacturer of stamped, formed, expanded and perforated metal components and subassemblies for rail and filtration applications, outdoor power equipment, small gas engines and smart utility meters. Demand in the components market is influenced by the broader industrial manufacturing market, which we believe has fundamental and significant long-term growth potential, as well as trends in the perforated and expanded metal, smart meter, rail and outdoor power equipment industries. The market for component products is highly fragmented with most participants having single or limited product lines, serving specific geographic markets or providing niche capabilities applicable to a limited customer base.
We employ approximately 4,000 employees and manufacture products in 33 locations around the world. For the three months ended March 28, 2014 and year ended December 31, 2013, we generated net sales of $186.5 million and $680.8 million, respectively, income from operations of $11.8 million and $53.7 million, respectively, and adjusted EBITDA of $22.1 million and $79.8 million, respectively.
Additional Information
Our principal executive offices are located at 411 East Wisconsin Avenue, Suite 2100, Milwaukee, Wisconsin 53202, and our telephone number is (414) 277-9300. Our website is www.jasoninc.com.
Recent Developments
On May 6, 2014, we commenced a tender offer to purchase up to 9,200,000 of the Public Warrants at a purchase price of $0.75 per Warrant, which was subsequently increased to $1.00 per warrant on June 18, 2014 and $1.50 per Warrant on July 7, 2014, subject to certain conditions, including the consummation of the Business Combination. The Warrant Tender Offer expired on July 18, 2014 and a total of 4,406,277 warrants were validly tendered and not properly withdrawn for a total purchase price of approximately $6,609,000.
4
Table of Contents
The Offering
We are registering (i) the offer and sale by us of 13,993,773 shares of Common Stock underlying Warrants previously issued by the Company as Public Warrants and IPO Placement Warrants and (ii) the resale of 14,422,056 shares of Common Stock, 1,150,000 IPO Placement Warrants, and 66,868 shares of Series A Convertible Preferred Stock by the selling security holders named in this prospectus or their permitted transferees.
Issuance of Common Stock Underlying Warrants
| Shares to be issued upon exercise of Warrants |
13,993,773 shares of Common Stock underlying our Warrants. |
| Shares outstanding prior to exercise of Warrants |
21,990,666 shares of Common Stock as of July 11, 2014. |
| Shares to be outstanding assuming exercise of all Warrants |
35,984,439 shares of Common Stock. |
| Terms of Warrants |
Each Warrant entitles the holder to purchase one share of our Common Stock at an exercise price of $12.00 per share, subject to adjustment, at any time commencing on August 14, 2014, which is 12 months from the consummation of our initial public offering (“IPO”). The Warrants will expire at 5:00 p.m., New York time, on June 30, 2019 (which is five years after the completion of our initial business combination) or earlier upon redemption or liquidation. |
| Use of Proceeds |
We expect to receive $167,925,276 in net proceeds assuming the exercise of all of our Warrants at the exercise price of $12.00 per share. We intend to use these net proceeds for working capital and general corporate purposes. |
| Trading market and ticker symbol |
Our Warrants are quoted on Nasdaq under the symbol “JASNW.” |
Resale of Common Stock, IPO Placement Warrants and Series A Convertible Preferred Stock by Selling Security Holders
| Common Stock offered by the selling security holders |
We are registering 14,422,056 shares of Common Stock to be offered by the selling security holders named herein, which includes 3,485,623 Rollover Shares, 6,133,333 founder shares, 1,150,000 IPO Placement Shares and 3,653,100 shares of Common Stock that can be issued upon conversion of our Series A Convertible Preferred Stock. |
| IPO Placement Warrants offered by the selling security holders |
We are registering 1,150,000 IPO Placement Warrants to be offered by the selling security holder named herein. Each IPO Placement Warrant entitles the holder to purchase one share of our Common |
5
Table of Contents
| Stock at an exercise price of $12.00 per share, subject to adjustment, at any time commencing on August 14, 2014. The IPO Placement Warrants will expire at 5:00 p.m., New York time, on June 30, 2019 or earlier upon redemption or liquidation. |
| Series A Convertible Preferred Stock offered by the selling security holders |
We are registering 66,868 shares of Series A Convertible Preferred Stock to be offered by the selling security holders, including 21,868 shares of Series A Convertible Preferred Stock potentially issuable over the next five years as dividends. |
| Conversion of Series A Convertible Preferred Stock |
Each share of Series A Convertible Preferred Stock is convertible, at the holder’s option at any time, initially into 81.18 shares of our Common Stock (which is equivalent to an initial conversion price of approximately $12.32 per share), subject to specified adjustments as set forth in the Certificate of Designations, Preferences, Rights and Limitations of the Series A Convertible Preferred Stock (the “Certificate of Designations”). |
| In addition, the Company has the right, at its option, to cause all outstanding shares of the Series A Convertible Preferred Stock to be automatically converted into shares of Common Stock under certain circumstances and, if the Company undergoes certain fundamental changes, the Series A Convertible Preferred Stock will automatically be converted into Common Stock on the effective date of such fundamental change, in each case, as more fully described in “Description of Capital Stock—Series A Convertible Preferred Stock.” |
| Dividends on Series A Convertible Preferred Stock |
Holders of the Series A Convertible Preferred Stock are entitled to receive, when, as and if declared by the Company’s board of directors, cumulative dividends at the rate of 8.0% per annum (the dividend rate) on the $1,000 liquidation preference per share of the Series A Convertible Preferred Stock, payable quarterly in arrears on each dividend payment date. Dividends are paid in cash or, at the Company’s option, in additional shares of Series A Convertible Preferred Stock or a combination thereof. For more information, please read “Description of Capital Stock—Series A Convertible Preferred Stock.” |
| Terms of the offering |
The selling security holders will determine when and how they will dispose of the Common Stock, IPO Placement Warrants and Series A Convertible Preferred Stock registered under this prospectus for resale. |
| Securities outstanding prior to this offering |
21,990,666 shares of our Common Stock and 45,000 shares of our Series A Convertible Preferred Stock are issued and outstanding as of |
6
Table of Contents
| July 31, 2014. In addition, as of July 31, 2014, 13,993,773 shares of Common Stock are issuable upon exercise of 13,993,773 outstanding Warrants. |
| Securities outstanding after this offering |
43,123,162 shares of our Common Stock, which assumes the exercise of all Warrants, exchange of all JPHI stock into Common Stock, and the conversion of all shares of Series A Convertible Preferred Stock. The number of shares of Common Stock outstanding after this offering excludes the 3,473,435 shares of Common Stock available for future issuance under the Jason Industries, Inc. 2014 Omnibus Incentive Plan. |
| Use of Proceeds |
We will not receive any of the proceeds from the sale of shares of Common Stock, IPO Placement Warrants or Series A Convertible Preferred Stock by the selling security holders. However, we will receive proceeds from the exercise of IPO Placement Warrants if they are exercised by the selling security holder. We intend to use any proceeds for working capital and general corporate purposes. |
| Trading market and ticker symbol |
Our Common Stock and Warrants are quoted on Nasdaq under the symbols “JASN,” and “JASNW,” respectively. There has been no market for our Series A Convertible Preferred Stock and a public market may not develop, or, if any market does develop, it may not be sustained. Our Series A Convertible Preferred Stock is not listed on any exchange or quoted on the OTC Bulletin Board. |
For additional information concerning the offering, see “Plan of Distribution” beginning on page 147.
Risk Factors
Before investing in our securities, you should carefully read and consider the information set forth in “Risk Factors” beginning on page 8.
7
Table of Contents
Investing in our securities involves a high degree of risk. You should consider carefully the risks and uncertainties described below, together with all of the other information in this prospectus, including our consolidated financial statements and related notes, before deciding whether to purchase any of our securities. Any of these risks may have a material adverse effect on our business, financial condition, results of operations and cash flows and our prospects could be harmed. In that event, the price of our securities could decline and you could lose part or all of your investment.
Risk Factors Relating to Our Business
Jason is affected by developments in the industries in which its customers operate.
Jason derives its revenues largely from customers in the following industry sectors: agricultural, construction and industrial manufacturing. Factors affecting any of these industries in general, or any of its customers in particular, could adversely affect Jason because its revenue growth largely depends on the continued growth of its customers’ businesses in their respective industries. These factors include:
| • | seasonality of demand for Jason’s customers’ products which may cause its manufacturing capacity to be underutilized for periods of time; |
| • | its customers’ failure to successfully market their products, to gain or retain widespread commercial acceptance of their products or to compete effectively in their industries; |
| • | loss of market share for Jason’s customers’ products, which may lead its customers to reduce or discontinue purchasing Jason’s products and to reduce prices, thereby exerting pricing pressure on Jason; |
| • | economic conditions in the markets in which Jason’s customers operate, in particular, the United States and Europe, including recessionary periods such as the global economic downturn; and |
| • | product design changes or manufacturing process changes that may reduce or eliminate demand for the components Jason supplies. |
Jason expects that future sales will continue to depend on the success of its customers. If economic conditions and demand for its customers’ products deteriorate, Jason may experience a material adverse effect on its business, operating results and financial condition.
Some of Jason’s business segments are cyclical. A downturn or weakness in overall economic activity can have a material negative impact on Jason.
Historically, sales of products that Jason manufactures have been subject to cyclical variations caused by changes in general economic conditions. During recessionary periods, such as the recent global economic recession, Jason has been adversely affected by reduced demand for its products. In addition, the strength of the economy generally may affect the rates of expansion, consolidation, renovation and equipment replacement in the industries Jason serves.
Volatility in the prices of raw materials and energy prices and our ability to pass along increased costs to our customers could adversely affect Jason’s results of operations.
The prices of raw materials critical to Jason’s business and performance, such as steel, are based on global supply and demand conditions. Certain raw materials used by Jason, including polyurethane foam, vinyl, plastics, steel, polyester fiber, bicomponent fiber and machined fiber are only available from a limited number of suppliers, and it may be difficult to find alternative suppliers at the same or similar costs. Although our contracts and long term arrangements with our customers generally do not expressly allow us to pass through increases in
8
Table of Contents
our raw materials, energy costs and other inputs to our customers, we endeavor to discuss price adjustments with our customers on a case by case basis where it makes business sense. While Jason strives to pass through the price of raw materials to its customers (other than increases in order amounts which are subject to negotiation), Jason may not be able to do so in the future, and volatility in the prices of raw materials may affect customer demand for certain products. In addition, Jason, along with its suppliers and customers, rely on various energy sources for a number of activities connected with its business, such as the transportation of raw materials and finished products. Energy and utility prices, including electricity and water prices, and in particular prices for petroleum-based energy sources, are volatile and have been on an upward trend. Increased supplier and customer operating costs arising from volatility in the prices of energy sources, such as increased energy and utility costs and transportation costs, could be passed through to Jason and it may not be able to increase its product prices sufficiently or at all to offset such increased costs. The impact of any volatility in the prices of energy or the raw materials on which Jason relies, including the reduction in demand for certain products caused by such price volatility, could result in a loss of revenue and profitability and adversely affect Jason’s results of operations.
Jason competes with numerous other manufacturers in each of its segments and competition from these providers may affect the profitability of Jason’s business.
The industries Jason serves are highly competitive. Jason competes with numerous companies that manufacture finishing, seating, automotive acoustics and components products. Many of Jason’s competitors have international operations and significant financial resources and some have substantially greater manufacturing, research and design and marketing resources than Jason. These competitors may, among others:
| • | respond more quickly to new or emerging technologies; |
| • | have greater name recognition, critical mass or geographic market presence; |
| • | be better able to take advantage of acquisition opportunities; |
| • | adapt more quickly to changes in customer requirements; |
| • | devote greater resources to the development, promotion and sale of their products; |
| • | be better positioned to compete on price for their products, due to any combination of low-cost labor, raw materials, components, facilities or other operating items, or willingness to make sales at lower margins than Jason; |
| • | consolidate with other competitors in the industry which may create increased pricing and competitive pressures on Jason’s business; and |
| • | be better able to utilize excess capacity which may reduce the cost of their products or services. |
Competitors with lower cost structures may have a competitive advantage when bidding for business with Jason’s customers. Jason also expects its competitors to continue to improve the performance of their current products or services, to reduce prices of their existing products or services and to introduce new products or services that may offer greater performance and improved pricing. Additionally, Jason may face competition from new entrants to the industry in which Jason operates. Any of these developments could cause a decline in sales and average selling prices, loss of market share of Jason’s products or profit margin compression.
Jason may not be able to manage the expansion of its operations effectively in order to achieve projected levels of growth.
Jason’s business plan calls for further expansion over the next several years. Jason anticipates that further development of its infrastructure and an increase in the number of its employees will be required to achieve Jason’s planned broadening of its product offerings and client base, improvements in its machines and materials used in its machines, and its planned international growth. In particular, Jason must increase its marketing and services staff to support new marketing and service activities and to meet the needs of both new and existing
9
Table of Contents
customers. Jason’s future success will depend in part upon the ability of its management to manage its growth effectively. If Jason’s management is unsuccessful in meeting these challenges, it may not be able to achieve its anticipated level of growth which would adversely affect Jason’s results of operations.
Jason may not be able to maintain its engineering, technological and manufacturing expertise.
The markets for Jason’s products are characterized by changing technology and evolving process development. The continued success of Jason’s business will depend upon its ability to:
| • | hire, retain and expand its pool of qualified engineering and technical personnel; |
| • | maintain technological leadership in its industry; |
| • | successfully anticipate or respond to changes in manufacturing processes in a cost-effective and timely manner; and |
| • | successfully anticipate or respond to changes in cost to serve in a cost-effective and timely manner. |
Jason cannot be certain that it will develop the capabilities required by its customers in the future. The emergence of new technologies, industry standards or customer requirements may render Jason’s equipment, inventory or processes obsolete or uncompetitive. Jason may have to acquire new technologies and equipment to remain competitive. The acquisition and implementation of new technologies and equipment may require Jason to incur significant expense and capital investment, which could reduce its margins and affect its operating results. When Jason establishes or acquires new facilities, it may not be able to maintain or develop its engineering, technological and manufacturing expertise due to a lack of trained personnel, effective training of new staff or technical difficulties with machinery. Failure to anticipate and adapt to customers’ changing technological needs and requirements or to hire and retain a sufficient number of engineers and maintain engineering, technological and manufacturing expertise may have a material adverse effect on Jason’s business.
Jason may encounter difficulties in completing or integrating acquisitions, which could adversely affect its operating results.
Jason expects to expand its presence in new end markets, expand its capabilities and acquire new customers, some of which may occur through acquisitions. These transactions may involve acquisitions of entire companies, portions of companies, the entry into joint ventures and acquisitions of businesses or selected assets. Potential challenges related to Jason’s acquisitions and joint ventures include:
| • | paying an excessive price for acquisitions and incurring higher than expected acquisition costs; |
| • | difficulty in integrating acquired operations, systems, assets and businesses; |
| • | difficulty in implementing financial and management controls, reporting systems and procedures; |
| • | difficulty in maintaining customer, supplier, employee or other favorable business relationships of acquired operations and restructuring or terminating unfavorable relationships; |
| • | ensuring sufficient due diligence prior to an acquisition and addressing unforeseen liabilities of acquired businesses; |
| • | making acquisitions in new end markets, geographies or technologies where Jason’s knowledge or experience is limited; |
| • | failing to realize the benefits from goodwill and intangible assets resulting from acquisitions which may result in write-downs; |
| • | failing to achieve anticipated business volumes; and |
| • | making acquisitions which force Jason to divest other businesses. |
10
Table of Contents
Any of these factors could prevent Jason from realizing the anticipated benefits of an acquisition, including additional revenue, operational synergies and economies of scale. Jason’s failure to realize the anticipated benefits of acquisitions could adversely affect its business and operating results.
Acquisitions, expansions or infrastructure investments may require Jason to increase its level of indebtedness or issue additional equity.
Should Jason desire to consummate significant additional acquisition opportunities, undertake significant additional expansion activities or make substantial investments in its infrastructure, Jason’s capital needs would increase and it may need to increase available borrowings under its credit facilities or access public or private debt and equity markets. There can be no assurance, however, that Jason will be successful in raising additional debt or equity on terms that it would consider acceptable.
An increase in the level of indebtedness could, among other things:
| • | make it difficult for Jason to obtain financing in the future for acquisitions, working capital, capital expenditures, debt service requirements or other purposes; |
| • | limit Jason’s flexibility in planning for or reacting to changes in its business; |
| • | affect Jason’s ability to pay dividends; |
| • | make Jason more vulnerable in the event of a downturn in its business; and |
| • | affect certain financial covenants with which Jason must comply in connection with its credit facilities. |
Additionally, a further non pro rata equity issuance would dilute your ownership interest.
If Jason fails to develop new and innovative products or if customers in its markets do not accept them, Jason’s results would be negatively affected.
Jason’s products must be kept current to meet its customers’ needs. To remain competitive, Jason therefore must develop new and innovative products on an ongoing basis. If Jason fails to make innovations or the market does not accept Jason’s new products, its sales and results would suffer. Jason invests significantly in the research and development of new products. These expenditures do not always result in products that will be accepted by the market. To the extent they do not, whether as a function of the product or the business cycle, Jason will have increased expenses without significant sales to benefit it. Failure to develop successful new products may also cause potential customers to purchase competitors’ products, rather than invest in products manufactured by Jason.
The potential impact of failing to deliver products on time could increase the cost of the products.
In most instances, Jason guarantees that it will deliver a product by a scheduled date. If Jason subsequently fails to deliver the product as scheduled, Jason may be held responsible for cost impacts and/or other damages resulting from any delay. To the extent that these failures to deliver may occur, the total damages for which Jason could be liable could significantly increase the cost of the products; as such, Jason could experience reduced profits or, in some cases, a loss for that contract. Additionally, failure to deliver products on time could result in damage to customer relationships, the potential loss of customers, and reputational damage which could impair Jason’s ability to attract new customers.
Increasing costs of doing business in many countries in which Jason operates may adversely affect its business and financial results.
Increasing costs such as labor and overhead costs in the countries in which Jason operates may erode its profit margins and compromise its price competitiveness. Historically, the low cost of labor in certain of the countries in which Jason operates had been a competitive advantage but labor costs in these countries, such as
11
Table of Contents
China, have been increasing. Jason’s profitability also depends on its ability to manage and contain its other operating expenses such as the cost of utilities, factory supplies, factory space costs, equipment rental, repairs and maintenance and freight and packaging expenses. In the event Jason is unable to manage any increase in its labor and other operating expenses in an environment where revenue does not increase proportionately, Jason’s financial results would be adversely affected.
Jason’s international scope will require it to obtain financing in various jurisdictions.
Jason operates manufacturing facilities in the United States and 11 foreign countries, which creates financing challenges for it. These challenges include navigating local legal and regulatory requirements associated with obtaining debt or equity financing in the respective foreign jurisdictions in which Jason operates. In the event that Jason is not able to obtain financing on satisfactory terms in any of these jurisdictions, it could significantly impair its ability to run its foreign operations on a cost effective basis or to grow such operations. Failure to manage such challenges may adversely affect Jason’s business and results of operations.
Security breaches and other disruptions could compromise Jason’s information and expose it to liability, which would cause its business and reputation to suffer.
In the ordinary course of business, Jason collects and stores sensitive data, including its proprietary business information and that of its customers, suppliers and business partners, as well as personally identifiable information of its customers and employees, in its data centers and on its networks. The secure processing, maintenance and transmission of this information is critical to Jason’s operations and business strategy. Despite Jason’s security measures, its information technology and infrastructure may be vulnerable to malicious attacks or breached due to employee error, malfeasance or other disruptions, including as a result of rollouts of new systems. Any such breach could compromise Jason’s networks and the information stored there could be accessed, publicly disclosed, lost or stolen. Any such access, disclosure or other loss of information could result in legal claims or proceedings and/or regulatory penalties, disrupt Jason’s operations, damage its reputation, and/or cause a loss of confidence in its products and services, which could adversely affect its business.
Jason has operations in many countries and such operations may be subject to a number of risks specific to these countries.
Jason’s international operations across many different jurisdictions may be subject to a number of risks specific to these countries, including:
| • | less flexible employee relationships which can be difficult and expensive to terminate; |
| • | labor unrest; |
| • | political and economic instability (including war and acts of terrorism); |
| • | inadequate infrastructure for its operations (i.e. lack of adequate power, water, transportation and raw materials); |
| • | health concerns and related government actions; |
| • | risk of governmental expropriation of its property; |
| • | less favorable, or relatively undefined, intellectual property laws; |
| • | unexpected changes in regulatory requirements and laws; |
| • | longer customer payment cycles and difficulty in collecting trade accounts receivable; |
| • | export duties, tariffs, import controls and trade barriers (including quotas); |
| • | adverse trade policies or adverse changes to any of the policies of either the United States or any of the foreign jurisdictions in which Jason operates; |
12
Table of Contents
| • | adverse changes in tax rates or regulations; |
| • | legal or political constraints on its ability to maintain or increase prices; |
| • | burdens of complying with a wide variety of labor practices and foreign laws, including those relating to export and import duties, environmental policies and privacy issues; |
| • | inability to utilize net operating losses incurred by Jason’s foreign operations against future income in the same jurisdiction; |
| • | economies that are emerging or developing, that may be subject to greater currency volatility, negative growth, high inflation, limited availability of foreign exchange and other risks; and |
| • | ability to repatriate cash on a tax effective basis. |
These factors may harm Jason’s results of operations, and any measures that Jason may implement to reduce the effect of volatile currencies and other risks of its international operations may not be effective. In Jason’s experience, entry into new international markets requires considerable management time as well as start-up expenses for market development, hiring and establishing office facilities before any significant revenue is generated. As a result, initial operations in a new market may operate at low margins or may be unprofitable.
Jason’s international sales and operations are subject to applicable laws relating to trade, export controls and foreign corrupt practices, the violation of which could adversely affect its operations.
Jason must comply with all applicable international trade, customs, export controls and economic sanctions laws and regulations of the United States and other countries. Jason is also subject to the Foreign Corrupt Practices Act and other anti-bribery laws that generally bar bribes or unreasonable gifts to foreign governments or officials. Changes in trade sanctions laws may restrict Jason’s business practices, including cessation of business activities in sanctioned countries or with sanctioned entities, and may result in modifications to compliance programs. Violation of these laws or regulations could result in sanctions or fines and could have a material adverse effect on Jason’s financial condition, results of operations and cash flows.
Failure to successfully complete or integrate joint ventures into Jason’s existing operations could have an adverse impact on its business, financial condition and results of operations.
Jason regularly evaluates its joint ventures. Potential issues associated with these joint ventures could include, among other things, Jason’s ability to realize the full extent of the benefits or cost savings that it expects to realize as a result of the formation of a joint venture within the anticipated time frame, or at all; receipt of necessary consents, clearances and approvals in connection with a joint venture; and diversion of management’s attention from base strategies and objectives. In Jason’s joint ventures, it shares ownership and management responsibility of a company with one or more parties who may or may not have the same goals, strategies, priorities or resources as Jason does and joint ventures are intended to be operated for the benefit of all co-owners, rather than for Jason’s exclusive benefit. In addition, joint ventures outside of the United States increase exposure to risks associated with operations outside of the United States, including fluctuations in exchange rates and compliance with laws and regulations outside the United States. If a joint venture is not successfully completed or integrated into Jason’s existing operations, financial condition and results of operations could be adversely impacted.
Jason is subject to risks of currency fluctuations and related hedging operations, and the appreciation of the currencies of countries in which Jason conducts its manufacturing operations, particularly the Euro, may negatively affect the profitability of its business.
Jason reports its financial results in U.S. dollars. Approximately 20% of Jason’s net sales are in currencies other than the U.S. dollar. Changes in exchange rates among other currencies, especially the Euro, to the U.S. dollar may negatively affect Jason’s net sales, cost of sales, gross profit and net income where Jason’s expenses
13
Table of Contents
and revenues are denominated in different currencies. Jason cannot predict the effect of future exchange rate fluctuations. Jason may from time to time use financial instruments, primarily short-term forward contracts, to hedge Euro and other currency commitments arising from foreign currency obligations. Jason does not have a fixed hedging policy currently. Where possible, Jason endeavors to match its non-functional currency exchange requirements to its receipts. If Jason’s hedging activities are not successful or if Jason changes or reduces these hedging activities in the future, it may experience significant unexpected expenses from fluctuations in exchange rates.
Jason depends on its key executive officers, managers and skilled personnel and may have difficulty retaining and recruiting qualified employees.
Jason’s success depends to a large extent upon the continued services of its executive officers, senior management personnel, managers and other skilled personnel and its ability to recruit and retain skilled personnel to maintain and expand its operations. Jason could be affected by the loss of any of its executive officers who are responsible for formulating and implementing Jason’s business plan and strategy, and who have been instrumental in its growth and development. In addition, in order to manage Jason’s growth, it will need to recruit and retain additional management personnel and other skilled employees. However, competition is high for skilled technical personnel among companies that rely on engineering and technology, and the loss of qualified employees or an inability to attract, retain and motivate additional skilled employees required for the operation and expansion of its business could hinder Jason’s ability to conduct design, engineering and manufacturing activities successfully and develop marketable products. Jason may not be able to attract the skilled personnel it requires or retain those whom it has trained at its own cost. If Jason is not able to do so, its business and its ability to continue to grow could be negatively affected.
Many of Jason’s customers do not commit to long-term production schedules, which makes it difficult for Jason to schedule production accurately and achieve maximum efficiency of its manufacturing capacity.
Generally, Jason’s customers do not commit to long-term contracts. Many of its customers do not commit to firm production schedules and Jason continues to experience reduced lead-times in customer orders. Additionally, customers may change production quantities or delay production with little lead-time or advance notice. Therefore, Jason relies on and plans its production and inventory levels based on its customers’ advance orders, commitments or forecasts, as well as Jason’s internal assessments and forecasts of customer demand. The volume and timing of sales to Jason’s customers may vary due to, among others:
| • | variation in demand for or discontinuation of its customers’ products; |
| • | its customers’ attempts to manage their inventory; |
| • | design changes; |
| • | changes in Jason’s customers’ manufacturing strategies; and |
| • | acquisitions of or consolidation among customers. |
The variations in volume and timing of sales make it difficult to schedule production and optimize utilization of manufacturing capacity. This uncertainty may require Jason to increase staffing and incur other expenses in order to meet an unexpected increase in customer demand, potentially placing a significant burden on Jason’s resources. Additionally, an inability to respond to such increases may cause customer dissatisfaction, which may negatively affect Jason’s customers’ relationships.
Further, in order to secure sufficient production scale, Jason may make capital investments in advance of anticipated customer demand. Such investments may lead to low utilization levels if customer demand forecasts change and Jason is unable to utilize the additional capacity. Because fixed costs make up a large proportion of Jason’s total production costs, a reduction in customer demand can have a significant adverse impact on its gross profits and operating results. Additionally, Jason orders materials and components based on customer forecasts
14
Table of Contents
and orders and suppliers may require it to purchase materials and components in minimum quantities that exceed customer requirements, which may have an adverse impact on Jason’s gross profits and operating results. In the past, anticipated orders from some of Jason’s customers have failed to materialize and delivery schedules have been deferred as a result of changes in its customers’ business needs. Jason has also allowed long-term customers to delay orders to absorb excess inventory. Such order fluctuations and deferrals may have an adverse effect on Jason’s business, operating results and financial conditions.
Jason may incur additional expenses and delays due to technical problems or other interruptions at its manufacturing facilities.
Disruptions in operations due to technical problems or other interruptions such as floods or fire could adversely affect the manufacturing capacity of Jason’s facilities. Such interruptions could cause delays in production and cause it to incur additional expenses such as charges for expedited deliveries for products that are delayed. Additionally, Jason’s customers have the ability to cancel purchase orders in the event of any delays in production and may decrease future orders if delays are persistent. Additionally, to the extent that such disruptions do not result from damage to Jason’s physical property, these may not be covered by its business interruption insurance. Any such disruptions may adversely affect Jason’s operations and its financial results.
The operations of Jason’s manufacturing facilities may be disrupted by union activities and other labor-related problems.
Jason has labor unions at certain of its facilities. As of March 28, 2014, Jason had approximately 630 unionized personnel in the United States. For such employees, Jason has entered into collective bargaining agreements with the respective labor unions. In the future, such agreements may limit Jason’s ability to contain increases in its labor costs as its ability to control future labor costs depends partly on the outcome of wage negotiations with its employees. Any future collective bargaining agreements may lead to further increases in Jason’s labor costs. Although Jason’s employees in certain other facilities are currently not unionized, there can be no assurance that they will continue to remain as such.
Union activities and other labor-related problems not linked to union activities may disrupt Jason’s operations and adversely affect its business and results of operations. Jason cannot provide any assurance that it will not be affected by any such labor unrest, or increase in labor cost, or interruptions to the operations of its existing manufacturing plants or new manufacturing plants that Jason may set up in the future. Any disruptions to Jason’s manufacturing facilities as a result of labor-related disturbances could affect its ability to meet delivery and efficiency targets resulting in an adverse effect on Jason’s customer relationships and its financial results. Such disruptions may not be covered by Jason’s business interruption insurance.
Any disruption in Jason’s information systems could disrupt its operations and would be adverse to its business and financial operations.
Jason depends on various information systems to support its customers’ requirements and to successfully manage its business, including managing orders, supplies, accounting controls and payroll. Any inability to successfully manage the procurement, development, implementation or execution of Jason’s information systems and back-up systems, including matters related to system security, reliability, performance and access, as well as any inability of these systems to fulfill their intended purpose within Jason’s business, could have an adverse effect on its business and financial performance. Such disruptions may not be covered by Jason’s business interruption insurance.
Natural disasters, epidemics and other events outside Jason’s control, and the ineffective management of such events, may harm its business.
Some of Jason’s facilities are located in areas that may be affected by natural disasters such as hurricanes, earthquakes, water shortages, tsunamis and floods. All facilities are subject to other natural or man-made
15
Table of Contents
disasters such as fires, acts of terrorism, failures of utilities and epidemics. If such an event were to occur, Jason’s business could be harmed due to the event or its inability to effectively manage the effects of the particular event. Potential harms include the loss of business continuity, the loss of business data and damage to infrastructure.
Jason’s production could be severely affected if its employees or the regions in which its facilities are located are affected by a significant outbreak of any disease or epidemic. For example, a facility could be closed by government authorities for a sustained period of time, some or all of its workforce could be unavailable due to quarantine, fear of catching the disease or other factors, and local, national or international transportation or other infrastructure could be affected, leading to delays or loss of production. In addition, Jason’s suppliers and customers are subject to similar risks, which could lead to a shortage of components or a reduction in Jason’s customers’ demand for its services.
Jason relies on a variety of common carriers to transport its materials from its suppliers, and to transport products from Jason to its customers. Problems suffered by any of these common carriers, whether due to a natural disaster, labor problem, act of terrorism, increased energy prices or some other issue, could result in shipping delays, increased costs or some other supply chain disruption and could therefore have a material adverse effect on Jason’s operations.
In addition, some of Jason’s facilities possess certifications, machinery, equipment or tooling necessary to work on specialized products that its other locations lack. If work is disrupted at one of these facilities, it may not be practicable or feasible to transfer such specialized work to another facility without significant costs and delays. Thus, any disruption in operations at a facility possessing specialized certifications, machinery, equipment or tooling could adversely affect Jason’s ability to provide products to its customers and thus negatively affect its relationships and financial results.
Political and economic developments could adversely affect Jason’s business.
Increased international political instability and social unrest, evidenced by the threat or occurrence of terrorist attacks, enhanced national security measures and the related decline in consumer confidence may hinder Jason’s ability to do business. Any escalation in these events or similar future events may disrupt its operations or those of its customers and suppliers and could affect the availability of raw materials and components needed to manufacture Jason’s products or the means to transport those materials to manufacturing facilities and finished products to customers. These events have had and may continue to have an adverse effect, generally, on the world economy and consumer confidence and spending, which could adversely affect Jason’s revenue and operating results. The effect of these events on the volatility of the world financial markets could in future lead to volatility of the market price of Jason’s securities and may limit the capital resources available to Jason, its customers and suppliers.
Sales of Jason’s products may result in exposure to product liability, intellectual property infringement and other claims.
Jason’s manufactured products can expose it to potential liabilities. For instance, Jason’s manufacturing businesses expose it to potential product liability claims resulting from injuries caused by defects in products it designs or manufactures, as well as potential claims that products Jason designs or processes it uses infringe on third-party intellectual property rights. Such claims could subject Jason to significant liability for damages, subject the infringing portion of its business to injunction and, regardless of their merits, could be time-consuming and expensive to resolve. Jason may also have greater potential exposure from warranty claims and product recalls due to problems caused by product design. Although Jason has product liability insurance coverage, it may not be sufficient to cover the full extent of its product liability, if at all, and may also be subject to the satisfaction of a deductible amount of up to $250,000. A successful product liability claim in excess or outside of Jason’s insurance coverage or any material claim for which insurance coverage was denied or limited and for which indemnification was not available could have a material adverse effect on Jason’s business, results of operations and/or financial condition.
16
Table of Contents
Jason may experience work-related accidents that may expose it to liability claims.
Due to the nature of its operations, Jason is subject to the risks of its employees being exposed to industrial-related accidents at its premises. If such accidents occur in the future, Jason may be required to pay compensation and may also suffer reputational harm. Under such circumstances, Jason’s business and financial performance could be adversely affected.
If Jason’s manufacturing processes and products do not comply with applicable statutory and regulatory requirements, or if Jason manufactures products containing design or manufacturing defects, demand for its products may decline and Jason may be subject to liability claims.
Jason’s designs, manufacturing processes and facilities need to comply with applicable statutory and regulatory requirements. Jason may also have the responsibility to ensure that products it designs satisfy safety and regulatory standards including those applicable to its customers and to obtain any necessary certifications. In addition, Jason’s customers’ products and the manufacturing processes that Jason uses to produce them are often highly complex. As a result, products that Jason manufactures may at times contain manufacturing or design defects, and its manufacturing processes may be subject to errors or not be in compliance with applicable statutory and regulatory requirements or demands of its customers. Defects in the products Jason manufactures or designs, whether caused by a design, manufacturing or component failure or error, or deficiencies in its manufacturing processes, may result in delayed shipments to customers, replacement costs or reduced or cancelled customer orders. If these defects or deficiencies are significant, Jason’s business reputation may also be damaged. The failure of the products that Jason manufactures or its manufacturing processes and facilities to comply with applicable statutory and regulatory requirements may subject Jason to legal fines or penalties and, in some cases, require Jason to shut down or incur considerable expense to correct a manufacturing process or facility. In addition, these defects may result in liability claims against Jason or expose it to liability to pay for the recall of a product or to indemnify its customers for the costs of any such claims or recalls which they face as a result of using items manufactured by Jason in their products. Even if Jason’s customers are responsible for the defects, they may not assume, or may not have resources to assume, responsibility for any costs or liabilities arising from these defects, which could expose Jason to additional liability claims.
Compliance or the failure to comply with regulations and governmental policies could cause Jason to incur significant expense.
Jason is subject to a variety of local and foreign laws and regulations including those relating to labor and health and safety concerns and import/export duties and customs. Such laws may require Jason to pay mandated compensation in the event of workplace accidents and penalties in the event of incorrect payments of duties or customs. Additionally, Jason may need to obtain and maintain licenses and permits to conduct business in various jurisdictions. If Jason or the businesses or companies it acquires have failed or fail in the future to comply with such laws and regulations, then Jason could incur liabilities and fines and its operations could be suspended. Such laws and regulations could also restrict Jason’s ability to modify or expand its facilities, could require it to acquire costly equipment, or could impose other significant expenditures.
If Jason’s products are subject to warranty claims, its business reputation may be damaged and it may incur significant costs.
Jason generally provides warranties to its customers for manufacturing defects where Jason’s products do not conform to the specifications stipulated by its customers. A successful claim for damages arising as a result of such defects or deficiencies may affect Jason’s business reputation. In addition, a successful claim for which Jason is not insured or where the damages exceed insurance coverage, or any material claim for which insurance coverage is denied or limited and for which indemnification is not available, could have a material adverse effect on Jason’s business, operating results and financial condition. In addition, as Jason pursues new end-markets, warranty requirements will vary and Jason may be less effective in pricing its products to appropriately capture the warranty costs.
17
Table of Contents
Jason is or may be required to obtain and maintain quality or product certifications for certain markets.
In some countries, Jason’s customers require or prefer that it obtain certain certifications for its products and testing facilities with regard to specifications/quality standards. For example, Jason is required to obtain American Railroad Association approval for certain of its products. Consequently, Jason needs to obtain and maintain the relevant certifications so that its customers are able to sell their products, which are manufactured by Jason, in these countries. If Jason is unable to meet and maintain the requirements needed to secure or renew such certifications, it may not be able to sell its products to certain customers and its financial results may be adversely affected.
Jason’s income tax returns are subject to review by taxing authorities, and the final determination of its tax liability with respect to tax audits and any related litigation could adversely affect its financial results.
Although Jason believes that its tax estimates are reasonable and that it prepares its tax filings in accordance with all applicable tax laws, the final determination with respect to any tax audits, and any related litigation, could be materially different from Jason’s estimates or from its historical income tax provisions and accruals. The results of an audit or litigation could have a material effect on operating results and/or cash flows in the periods for which that determination is made. In addition, future period earnings may be adversely impacted by litigation costs, settlements, penalties, and/or interest assessments. Jason is undergoing tax audits in various jurisdictions and it regularly assesses the likelihood of an adverse outcome resulting from such examinations to determine the adequacy of its tax reserves.
Failure of Jason’s customers to pay the amounts owed to it in a timely manner may adversely affect its financial condition and operating results.
Jason generally provides payment terms ranging from 30 to 50 days. As a result, Jason generates significant accounts receivable from sales to its customers, representing 47% and 38% of current assets as of March 28, 2014 and December 31, 2013, respectively. Accounts receivable from sales to customers were $110.4 million and $77.0 million as of March 28, 2014 and December 31, 2013, respectively. As of March 28, 2014, the largest amount owed by a single customer was approximately 10% of total accounts receivable. As of March 28, 2014, Jason’s allowance for doubtful accounts was approximately $2.2 million. If any of Jason’s significant customers have insufficient liquidity, Jason could encounter significant delays or defaults in payments owed to it by such customers, and Jason may need to extend its payment terms or restructure the receivables owed to it, which could have a significant adverse effect on its financial condition. Any deterioration in the financial condition of Jason’s customers will increase the risk of uncollectible receivables. Global economic uncertainty could also affect Jason’s customers’ ability to pay its receivables in a timely manner or at all or result in customers going into bankruptcy or reorganization proceedings, which could also affect Jason’s ability to collect its receivables.
New regulations related to conflict minerals may force Jason to incur additional expenses and affect the manufacturing and sale of its products.
The Dodd-Frank Wall Street Reform and Consumer Protection Act (the “Dodd-Frank Act”), signed into law on July 21, 2010, includes Section 1502, which requires the SEC to adopt additional disclosure requirements related to certain minerals sourced from the Democratic Republic of Congo and surrounding countries, or “conflict minerals,” for which such conflict minerals are necessary to the functionality of a product manufactured, or contracted to be manufactured, by an SEC reporting company. The metals covered by the final rules, adopted on August 22, 2012, are commonly referred to as “3TG” and include tin, tantalum, tungsten and gold. Implementation of the new disclosure requirements could affect the sourcing and availability of some of the minerals used in the manufacture of Jason’s products. Jason’s supply chain is complex, and if Jason is not able to conclusively verify the origins for all conflict minerals used in its products or that its products are “conflict free,” Jason may face reputational challenges with its customers or investors. Furthermore, Jason may also encounter challenges to satisfy customers who require that its products be certified as “conflict free,” which could place Jason at a competitive disadvantage if it is unable to do so. Additionally, as there may be only a limited number
18
Table of Contents
of suppliers offering “conflict free” metals, Jason cannot be sure that it will be able to obtain necessary metals from such suppliers in sufficient quantities or at competitive prices. Jason could incur significant costs related to the compliance process, including potential difficulty or added costs in satisfying the disclosure requirements. Jason’s first report thereon is expected to be required in 2015.
Jason’s failure to comply with environmental laws could adversely affect its business and financial condition.
Jason is subject to various federal, state, local and foreign environmental laws and regulations, including regulations governing the use, storage, discharge and disposal of hazardous substances used in its manufacturing processes.
Jason is also subject to laws and regulations governing the recyclability of products, the materials that may be included in products, and its obligations to dispose of these products after end-users have finished with them. Additionally, Jason may be exposed to liability to its customers relating to the materials that may be included in the components that Jason procures for its customers’ products. Any violation or alleged violation by Jason of environmental laws could subject it to significant costs, fines or other penalties.
Jason is also required to comply with an increasing number of product environmental compliance regulations focused on the restriction of certain hazardous substances. Non-compliance could result in significant costs and penalties.
In addition, increasing governmental focus on climate change may result in new environmental regulations that may negatively affect Jason, its suppliers and its customers by requiring Jason to incur additional direct costs to comply with new environmental regulations, as well as additional indirect costs as a result of its customers or suppliers passing on additional compliance costs. These costs may adversely affect Jason’s operations and financial condition.
Environmental liabilities that may arise in the future could be material to Jason.
Jason’s operations, facilities and properties are subject to extensive and evolving laws and regulations pertaining to air emissions, wastewater discharges, the handling and disposal of solid and hazardous materials and wastes, the remediation of contamination, and otherwise relating to health, safety and the protection of the environment. As a result, Jason is involved from time to time in administrative or legal proceedings relating to environmental and health and safety matters, and have in the past and will continue to incur capital costs and other expenditures relating to such matters. Jason also cannot be certain that identification of presently unidentified environmental conditions, more vigorous enforcement by regulatory authorities or other unanticipated events will not arise in the future and give rise to additional environmental liabilities, compliance costs and/or penalties that could be material. Further, environmental laws and regulations are constantly evolving and it is impossible to predict accurately the effect they may have upon Jason’s financial condition, results of operations or cash flows.
Changes in laws or regulations, or a failure to comply with any laws and regulations, may adversely affect our business, investments and results of operations.
We are subject to laws and regulations enacted by national, regional and local governments, including non-U.S. governments. In particular, we are required to comply with certain SEC and other legal requirements. Compliance with, and monitoring of, applicable laws and regulations may be difficult, time consuming and costly. Those laws and regulations and their interpretation and application may also change from time to time and those changes could have a material adverse effect on our business, investments and results of operations. In addition, a failure to comply with applicable laws or regulations, as interpreted and applied, could have a material adverse effect on our business and results of operations.
19
Table of Contents
Pursuant to the Jumpstart Our Business Startups Act of 2012 (the “JOBS Act”), our independent registered public accounting firm will not be required to attest to the effectiveness of our internal control over financial reporting pursuant to Section 404 of the Sarbanes-Oxley Act for so long as we are an “emerging growth company.”
Section 404 of the Sarbanes-Oxley Act requires annual management assessments of the effectiveness of our internal control over financial reporting, and generally requires in the same report a report by our independent registered public accounting firm on the effectiveness of our internal control over financial reporting. We will be required to provide management’s attestation on internal controls effective December 31, 2015. However, under the JOBS Act, our independent registered public accounting firm will not be required to attest to the effectiveness of our internal control over financial reporting pursuant to Section 404 of the Sarbanes-Oxley Act until we are no longer an “emerging growth company”. We will be an “emerging growth company” until the earlier of (1) the last day of the fiscal year (a) following August 14, 2018, the fifth anniversary of our IPO, (b) in which we have total annual gross revenue of at least $1.0 billion or (c) in which we are deemed to be a large accelerated filer, which means the market value of our Common Stock that is held by non-affiliates exceeds $700 million as of the last business day of our prior second fiscal quarter, and (2) the date on which we have issued more than $1.0 billion in non-convertible debt during the prior three-year period.
In addition, Section 107 of the JOBS Act also provides that an “emerging growth company” can take advantage of the extended transition period provided in Section 7(a)(2)(B) of the Securities Act for complying with new or revised accounting standards. An “emerging growth company” can therefore delay the adoption of certain accounting standards until those standards would otherwise apply to private companies. However, we have chosen to “opt out” of such extended transition period and, as a result, we must comply with new or revised accounting standards on the relevant dates on which adoption of such standards is required for non-emerging growth companies. Section 107 of the JOBS Act provides that our decision to opt out of the extended transition period for complying with new or revised accounting standards is irrevocable.
Risk Factors Relating to Our Indebtedness
Jason has a substantial amount of indebtedness, which may limit our operating flexibility and could adversely affect our results of operations and financial condition.
Jason has approximately $432.0 million of indebtedness as of June 30, 2014, consisting of $420.0 million in term loans, borrowings outstanding under our $40.0 million revolver and borrowings under existing non-U.S. debt agreements.
Jason’s indebtedness could have important consequences to our investors, including, but not limited to:
| • | increasing our vulnerability to, and reducing our flexibility to respond to, general adverse economic and industry conditions; |
| • | requiring the dedication of a substantial portion of our cash flow from operations to the payment of principal of, and interest on, our indebtedness, thereby reducing the availability of such cash flow to fund working capital, capital expenditures, acquisitions, joint ventures or other general corporate purposes; |
| • | limiting our flexibility in planning for, or reacting to, changes in our business, the competitive environment and the industry in which we operate; |
| • | placing us at a competitive disadvantage as compared to our competitors that are not as highly leveraged; and |
| • | limiting our ability to borrow additional funds and increasing the cost of any such borrowing. |
A breach of a covenant or restriction contained in our senior secured credit facilities could result in a default that could in turn permit the affected lenders to accelerate the repayment of principal and accrued interest on our
20
Table of Contents
outstanding loans and terminate their commitments to lend additional funds. If the lenders under such indebtedness accelerate the repayment of our borrowings, we cannot assure you that we will have sufficient assets to repay those borrowings as well as other indebtedness.
The interest rate per annum applicable to the loans under the New Credit Facilities (defined below) will be based on a fluctuating rate of interest determined by reference, upon the election by Jason Incorporated to either (i) a base rate determined by reference to the higher of (a) the “prime rate” of Deutsche Bank AG New York Branch (b) the federal funds effective rate plus 0.50% and (c) the Eurocurrency rate applicable for an interest period of one month plus 1.00%, plus an applicable margin equal to (x) 3.50%, in the case of the First Lien Term Loans (defined below), (y) 2.25% in the case of the Revolving Credit Facility (defined below) or (z) 7.00% in the case of the Second Lien Term Loans (defined below) or (ii) a Eurocurrency rate determined by reference to LIBOR, adjusted for statutory reserve requirements, plus an applicable margin equal to (x) 4.50%, in the case of the First Lien Term Loans, (y) 3.25% in the case of the Revolving Credit Facility or (z) 8.00% in the case of the Second Lien Term Loans (defined below). Borrowings under the First Lien Term Facility (defined below) and Second Lien Term Facility (defined below) will be subject to a floor of 1.00% in the case of Eurocurrency loans. The applicable margin for loans under the Revolving Credit Facility will be adjusted after the completion of Jason Incorporated’s first full fiscal quarter after the closing of the Business Combination based upon Jason Incorporated’s consolidated first lien net leverage ratio. An increase in interest rates would adversely affect our profitability. To the extent that our access to credit is restricted because of our own performance or conditions in the capital markets generally, our financial condition would be materially adversely affected. Our level of indebtedness may make it difficult to service our debt and may adversely affect our ability to obtain additional financing, use operating cash flow in other areas of our business or otherwise adversely affect our operations.
Our New Credit Facilities contain restrictive covenants that may impair our ability to conduct business.
The New Credit Facilities contain a number of customary affirmative and negative covenants that, among other things, will limit or restrict the ability of Jason Incorporated and its Restricted Subsidiaries (defined below) to: incur additional indebtedness (including guaranty obligations); incur liens; engage in mergers, consolidations, liquidations and dissolutions (other than pursuant to the transactions contemplated by the Purchase Agreement); sell assets; pay dividends and make other payments in respect of capital stock; make acquisitions, investments, loans and advances; pay and modify the terms of certain indebtedness; engage in certain transactions with affiliates; enter into negative pledge clauses and clauses restricting subsidiary distributions; and change its line of business, in each case, subject to certain limited exceptions. In addition, under the Revolving Credit Facility, if the aggregate outstanding amount of all Revolving Loans (defined below), swingline loans and certain letter of credit obligations exceed 25% of the revolving credit commitments at the end of any fiscal quarter, Jason Incorporated and its Restricted Subsidiaries will be required to not exceed a specified consolidated first lien leverage ratio. As a result of these covenants and restrictions, we are limited in how we conduct our business and we may be unable to raise additional debt or other financing to compete effectively or to take advantage of new business opportunities. The terms of any future indebtedness we may incur could include more restrictive covenants. Failure to comply with such restrictive covenants may lead to default and acceleration under our New Credit Facilities and may impair our ability to conduct business. We may not be able to maintain compliance with these covenants in the future and, if we fail to do so, we may not be able to obtain waivers from the lenders and/or amend the covenants, which may adversely affect our financial condition.
Upon the occurrence of an event of default under our New Credit Facilities, the lenders could elect to accelerate payments due and terminate all commitments to extend further credit. Consequently, we may not have sufficient assets to repay the New Credit Facilities, as well as other secured and unsecured indebtedness.
Upon the occurrence of an event of default under our New Credit Facilities, the lenders thereunder could elect to declare all amounts outstanding under the New Credit Facilities to be immediately due and payable and terminate all commitments to extend further credit. If we were unable to repay those amounts, the lenders under the New Credit Facilities could proceed against the collateral granted to them to secure that indebtedness. The
21
Table of Contents
Company has pledged a significant portion of our assets as collateral under the New Credit Facilities. If the lenders under our New Credit Facilities accelerate the repayment of borrowings, we cannot assure you that we will have sufficient assets to repay the New Credit Facilities, as well as other secured and unsecured indebtedness.
An adverse change in the interest rates for our borrowings could adversely affect our financial condition.
We pay interest on outstanding borrowings under our New Credit Facilities at interest rates that fluctuate based upon changes in certain short term prevailing interest rates. An adverse change in these rates could have a material adverse effect on our financial position, results of operations and cash flows and our ability to borrow money in the future. At times, we will enter into interest rate swaps to hedge some of this risk. If the duration of interest rate swaps exceeds one month, we will have to mark-to-market the value of such swaps which could cause us to recognize losses.
Risk Factors Relating to Our Securities and Capital Structure
The market price of our securities may decline.
Fluctuations in the price of our securities could contribute to the loss of all or part of your investment. Prior to the announcement of the Business Combination, trading in our Common Stock and Warrants had been limited. There is also currently no market for our Series A Convertible Preferred Stock and it is unclear whether one will develop. If an active market for our securities develops and continues, the trading price of our securities could be volatile and subject to wide fluctuations in response to various factors, some of which are beyond our control. Any of the factors listed below could have a material adverse effect on your investment and our securities may trade at prices significantly below the price you paid for them. In such circumstances, the trading price of our securities may not recover and may experience a further decline.
Factors affecting the trading price of our securities may include:
| • | actual or anticipated fluctuations in our quarterly financial results or the quarterly financial results of companies perceived to be similar to us; |
| • | changes in the market’s expectations about our operating results; |
| • | success of competitors; |
| • | our operating results failing to meet the expectation of securities analysts or investors in a particular period; |
| • | changes in financial estimates and recommendations by securities analysts concerning the Company or its markets in general; |
| • | operating and stock price performance of other companies that investors deem comparable to the Company; |
| • | our ability to market new and enhanced products on a timely basis; |
| • | changes in laws and regulations affecting our business; |
| • | commencement of, or involvement in, litigation involving the Company; |
| • | changes in the Company’s capital structure, such as future issuances of securities or the incurrence of additional debt; |
| • | the volume of securities available for public sale; |
| • | any major change in our board or management; |
| • | sales of substantial amounts of our securities by our directors, executive officers or significant stockholders or the perception that such sales could occur; and |
22
Table of Contents
| • | general economic and political conditions such as recession; interest rate, fuel price, and international currency fluctuations; and acts of war or terrorism. |
In addition, the market price of our Common Stock could also be affected by possible sales of our Common Stock by investors who view the Series A Convertible Preferred Stock as a more attractive means of equity participation in us and by hedging or arbitrage trading activity that we expect to develop involving our Common Stock. The hedging or arbitrage could, in turn, affect the trading price of the Series A Convertible Preferred Stock or any Common Stock that holders receive upon conversion of the Series A Convertible Preferred Stock.
Many of the factors listed above are beyond our control. In addition, broad market and industry factors may materially harm the market price of our securities irrespective of our operating performance. The stock market in general, and Nasdaq have experienced price and volume fluctuations that have often been unrelated or disproportionate to the operating performance of the particular companies affected. The trading prices and valuations of these stocks, and of our Common Stock and Warrants which trade on Nasdaq, may not be predictable. A loss of investor confidence in the market for retail stocks or the stocks of other companies which investors perceive to be similar to the Company could depress the price of our securities regardless of our business, prospects, financial conditions or results of operations. A decline in the market price of our securities also could adversely affect our ability to issue additional securities and our ability to obtain additional financing in the future.
Additionally, if our Common Stock and Warrants are not listed on, or become delisted from, Nasdaq for any reason, and are quoted on the OTC Bulletin Board, an inter-dealer automated quotation system for equity securities that is not a national securities exchange, the liquidity and price of our securities may be more limited than if we were quoted or listed on Nasdaq or another national securities exchange. You may be unable to sell your securities unless a market can be established or sustained.
If securities or industry analysts do not publish or cease publishing research or reports about the Company, its business, or its market, or if they change their recommendations regarding our securities adversely, the price and trading volume of our securities could decline.
The trading market for our securities will be influenced by the research and reports that industry or securities analysts may publish about us, our business, our market, or our competitors. Securities and industry analysts do not currently, and may never, publish research on the Company. If no securities or industry analysts commence coverage of the Company, our stock price and trading volume would likely be negatively impacted. If any of the analysts who may cover the Company change their recommendation regarding our securities adversely, or provide more favorable relative recommendations about our competitors, the price of our securities would likely decline. If any analyst who may cover the Company were to cease coverage of the Company or fail to regularly publish reports on it, we could lose visibility in the financial markets, which could cause our stock price or trading volume to decline.
Our public stockholders may experience dilution as a consequence of, among other transactions, the exercise of Warrants, the issuance of Rollover Shares, and the conversion of shares of Series A Convertible Preferred Stock into shares of Common Stock. Having a minority share position may reduce the influence that our current stockholders have on the management of the Company.
As of July 31, 2014, our public stockholders currently hold an ownership interest of approximately 65.9% in Jason and our initial stockholders and affiliates hold an ownership interest of approximately 34.1% in Jason, excluding Warrants. Our outstanding Warrants to purchase an aggregate of 13,993,773 shares of our Common Stock will become exercisable 12 months from the consummation of our IPO (August 14, 2014) and expire at 5:00 p.m., New York time, five years after the completion of the Business Combination (June 30, 2019), or earlier upon redemption or liquidation. To the extent any such Warrants are exercised, additional shares of our Common Stock will be issued, which will result in dilution to the then existing holders of Common Stock of the Company and increase the number of shares eligible for resale in the public market.
23
Table of Contents
In addition, (i) 3,485,623 shares of Common Stock can be issued from time to time to the Rollover Participants upon the exchange by such holders of JPHI stock for shares of our Common Stock, (ii) 5,428,344 shares of Common Stock can be issued upon conversion of our Series A Convertible Preferred Stock, which includes 1,775,244 shares of Common Stock potentially issuable upon conversion of additional shares of Series A Convertible Preferred Stock received as dividends and assumes that the conversion ratio is not adjusted, and (iii) 3,473,435 shares of Common Stock are available for future issuance under the Jason Industries, Inc. 2014 Omnibus Incentive Plan. To the extent any of such shares are issued, current stockholders may experience substantial dilution. Such dilution could, among other things, limit the ability of our current stockholders to influence management of the Company through the election of directors. Sales of substantial numbers of such shares in the public market could also adversely affect the market price of our Common Stock.
There is no guarantee that the Warrants will ever be in the money, and they may expire worthless and the terms of our Warrants may be amended.
The exercise price for our Warrants is $12.00 per share. There is no guarantee that the Public Warrants will ever be in the money prior to their expiration, and as such, the Warrants may expire worthless.
In addition, the warrant agreement between Continental Stock Transfer & Trust Company, as warrant agent, and us provides that the terms of the Warrants may be amended without the consent of any holder to cure any ambiguity or correct any defective provision, but requires the approval by the holders of at least 65% of the then outstanding Public Warrants to make any change that adversely affects the interests of the registered holders. Accordingly, we may amend the terms of the Warrants in a manner adverse to a holder if holders of at least 65% of the then outstanding Public Warrants approve of such amendment. Although our ability to amend the terms of the Warrants with the consent of at least 65% of the then outstanding Public Warrants is unlimited, examples of such amendments could be amendments to, among other things, increase the exercise price of the Warrants, shorten the exercise period or decrease the number of shares of our Common Stock purchasable upon exercise of a Warrant.
We may redeem the Public Warrants prior to their exercise at a time that is disadvantageous to warrantholders, thereby making their Warrants worthless.
We have the ability to redeem the outstanding Public Warrants at any time after they become exercisable and prior to their expiration at a price of $0.01 per warrant, provided that (i) the last reported sale price of our Common Stock equals or exceeds $18.00 per share for any 20 trading days within the 30 trading-day period ending on the third business day before we send the notice of such redemption and (ii) on the date we give notice of redemption and during the entire period thereafter until the time the Warrants are redeemed, there is an effective registration statement under the Securities Act covering the shares of our Common Stock issuable upon exercise of the Public Warrants and a current prospectus relating to them is available. Redemption of the outstanding Public Warrants could force holders of Public Warrants:
| • | to exercise their Warrants and pay the exercise price therefor at a time when it may be disadvantageous for them to do so; |
| • | to sell their Warrants at the then-current market price when they might otherwise wish to hold their Warrants; or |
| • | to accept the nominal redemption price which, at the time the outstanding Warrants are called for redemption, is likely to be substantially less than the market value of their Warrants. |
24
Table of Contents
Anti-takeover provisions contained in our certificate of incorporation and bylaws, as well as provisions of Delaware law, could impair a takeover attempt.
The Company’s certificate of incorporation and bylaws contain provisions that could have the effect of delaying or preventing changes in control or changes in our management without the consent of our board of directors. These provisions include:
| • | no cumulative voting in the election of directors, which limits the ability of minority stockholders to elect director candidates; |
| • | the exclusive right of our board of directors to elect a director to fill a vacancy created by the expansion of the board of directors or the resignation, death, or removal of a director, which prevents stockholders from being able to fill vacancies on our board of directors; |
| • | the ability of our board of directors to determine whether to issue shares of our preferred stock and to determine the price and other terms of those shares, including preferences and voting rights, without stockholder approval, which could be used to significantly dilute the ownership of a hostile acquirer; |
| • | a prohibition on stockholder action by written consent, which forces stockholder action to be taken at an annual or special meeting of our stockholders; |
| • | the requirement that an annual meeting of stockholders may be called only by the chairman of the board of directors, the chief executive officer, or the board of directors, which may delay the ability of our stockholders to force consideration of a proposal or to take action, including the removal of directors; |
| • | limiting the liability of, and providing indemnification to, our directors and officers; |
| • | controlling the procedures for the conduct and scheduling of stockholder meetings; |
| • | providing that directors may be removed prior to the expiration of their terms by stockholders only for cause; and |
| • | advance notice procedures that stockholders must comply with in order to nominate candidates to our board of directors or to propose matters to be acted upon at a stockholders’ meeting, which may discourage or deter a potential acquirer from conducting a solicitation of proxies to elect the acquirer’s own slate of directors or otherwise attempting to obtain control of the Company. |
These provisions, alone or together, could delay hostile takeovers and changes in control of the Company or changes in our board of directors and management.
As a Delaware corporation, we are also subject to provisions of Delaware law, including Section 203 of the DGCL, which prevents some stockholders holding more than 15% of our outstanding Common Stock from engaging in certain business combinations without approval of the holders of substantially all of our outstanding Common Stock. Any provision of our certificate of incorporation or bylaws or Delaware law that has the effect of delaying or deterring a change in control could limit the opportunity for our security holders to receive a premium for their securities and could also affect the price that some investors are willing to pay for our securities.
Our only significant asset is our indirect ownership of 81.8% of Jason Incorporated and such ownership may not be sufficient to pay dividends or make distributions or loans to enable us to pay any dividends on our Common Stock or preferred stock or satisfy our other financial obligations.
As of June 30, 2014, we have no direct operations and no significant assets other than the indirect ownership of 81.8% of Jason Incorporated. We will depend on Jason Incorporated for distributions, loans and other payments to generate the funds necessary to meet our financial obligations, including our expenses as a publicly traded company, and to pay any dividends with respect to our preferred stock and Common Stock. Legal and contractual restrictions in agreements governing our senior secured credit facilities and future indebtedness of
25
Table of Contents
Jason Incorporated, as well as the financial condition and operating requirements of Jason Incorporated, and the fact that we may be required to obtain the consent from the other stockholders of Jason Incorporated, may limit our ability to obtain cash from Jason Incorporated. The earnings from, or other available assets of, Jason Incorporated may not be sufficient to pay dividends or make distributions or loans to enable us to pay any dividends on our Common Stock or satisfy its other financial obligations. In addition, the terms of our Series A Convertible Preferred Stock may from time to time prevent us from paying cash dividends on our Common Stock.
The Series A Convertible Preferred Stock ranks junior to all of our indebtedness and other liabilities.
In the event of our bankruptcy, liquidation, reorganization or other winding-up, our assets will be available to pay obligations on the Series A Convertible Preferred Stock only after all of our indebtedness and other liabilities have been paid. In addition, we are a holding company and the Series A Convertible Preferred Stock will effectively rank junior to all existing and future indebtedness and other liabilities (including trade payables) of our subsidiaries and any capital stock of our subsidiaries not held by us. The rights of holders of the Series A Convertible Preferred Stock to participate in the distribution of assets of our subsidiaries will rank junior to the prior claims of that subsidiary’s creditors and any other equity holders. Consequently, if we are forced to liquidate our assets to pay our creditors, we may not have sufficient assets remaining to pay amounts due on any or all of the Series A Convertible Preferred Stock then outstanding. We and our subsidiaries may incur substantial amounts of additional debt and other obligations that will rank senior to the Series A Convertible Preferred Stock.
We currently have no preferred stock outstanding and no other capital stock outstanding that is senior to or on parity with the Series A Convertible Preferred Stock. As of June 30, 2014, we had approximately $432.0 million of total indebtedness.
We are not obligated to pay dividends on the Series A Convertible Preferred Stock if prohibited by law and will not be able to pay cash dividends if we have insufficient cash to do so.
Under Delaware law, dividends on capital stock may only be paid from “surplus” or, if there is no “surplus,” from the corporation’s net profits for the then-current or the preceding fiscal year. Unless we operate profitably, our ability to pay dividends on the Series A Convertible Preferred Stock would require the availability of adequate “surplus,” which is defined as the excess, if any, of our net assets (total assets less total liabilities) over our capital.
Further, even if adequate surplus is available to pay dividends on the Series A Convertible Preferred Stock, we may not have sufficient cash to pay cash dividends on the Series A Convertible Preferred Stock. We may elect to pay dividends on the Series A Convertible Preferred Stock in shares of additional Series A Convertible Preferred Stock; however, our ability to pay dividends in shares of our Series A Convertible Preferred Stock may be limited by the number of shares of Series A Convertible Preferred Stock we are authorized to issue under our second amended and restated certificate of incorporation (the “certificate of incorporation”). As of June 30, 2014, we had issued 45,000 shares of our Series A Convertible Preferred Stock out of 100,000 authorized shares.
The terms of our financing agreements may limit our ability to pay dividends on the Series A Convertible Preferred Stock.
Financing agreements, whether ours or those of our subsidiaries and whether in place now or in the future may contain restrictions on our ability to pay cash dividends on our capital stock, including the Series A Convertible Preferred Stock. These limitations may cause us to be unable to pay dividends on the Series A Convertible Preferred Stock unless we can refinance amounts outstanding under those agreements. Since we are not obligated to declare or pay cash dividends, we do not intend to do so to the extent we are restricted by any of our financing agreements.
26
Table of Contents
Recent regulatory actions may adversely affect the trading price and liquidity of the Series A Convertible Preferred Stock.
We expect that many investors in, and potential purchasers of, the Series A Convertible Preferred Stock may employ, or seek to employ, a convertible arbitrage strategy with respect to the Series A Convertible Preferred Stock. Investors that employ a convertible arbitrage strategy with respect to convertible instruments typically implement that strategy by selling short the common stock underlying the convertible instruments and dynamically adjusting their short position while they hold the convertible instruments. Investors may also implement this strategy by entering into swaps on our Common Stock in lieu of or in addition to short selling the Common Stock. As a result, any specific rules regulating equity swaps or short selling of securities or other governmental action that interferes with the ability of market participants to effect short sales or equity swaps with respect to our Common Stock could adversely affect the ability of investors in, or potential purchasers of, the Series A Convertible Preferred Stock to conduct the convertible arbitrage strategy that we believe they will employ, or seek to employ, with respect to the Series A Convertible Preferred Stock. This could, in turn, adversely affect the trading price and liquidity of the Series A Convertible Preferred Stock.
Indeed, the SEC and other regulatory and self-regulatory authorities have recently implemented various rules and may adopt additional rules in the future that may impact those engaging in short selling activity involving equity securities (including our Common Stock) and thus that could, in turn, adversely affect the trading price and liquidity of the Series A Convertible Preferred Stock.
The Series A Convertible Preferred Stock is a recent issuance that does not have an established trading market, which may negatively affect its market value and the ability to transfer or sell such shares.
The shares of Series A Convertible Preferred Stock is a recent issue of securities with no established trading market. Since the Series A Convertible Preferred Stock has no stated maturity date, investors seeking liquidity will be limited to selling their shares in the secondary market or converting their shares and selling in the secondary market. We do not intend to list the Series A Convertible Preferred Stock on any securities exchange. We cannot assure you that an active trading market in the Series A Convertible Preferred Stock will develop or, even if it develops, we cannot assure you that it will last. In either case, the trading price of the Series A Convertible Preferred Stock could be adversely affected and your ability to transfer your shares of Series A Convertible Preferred Stock will be limited. We are not aware of any entity making a market in the shares of our Series A Convertible Preferred Stock which we anticipate may further limit liquidity.
Upon conversion of the Series A Convertible Preferred Stock, holders may receive less valuable consideration than expected because the value of our Common Stock may decline after such holders exercise their conversion right but before we settle our conversion obligation.
Under the Series A Convertible Preferred Stock, a converting holder will be exposed to fluctuations in the value of our Common Stock during the period from the date such holder surrenders shares of Series A Convertible Preferred Stock for conversion until the date we settle our conversion obligation. Upon conversion, we will be required to deliver the shares of our Common Stock, together with a cash payment for any fractional share, on the third business day following the relevant conversion date. Accordingly, if the price of our Common Stock decreases during this period, the value of the shares of Common Stock that you receive will be adversely affected and would be less than the conversion value of the Series A Convertible Preferred Stock on the conversion date.
The conversion rate of the Series A Convertible Preferred Stock may not be adjusted for all dilutive events.
The number of shares of our Common Stock that you are entitled to receive upon conversion of the Series A Convertible Preferred Stock is subject to adjustment for certain specified events, including, but not limited to, the issuance of certain stock dividends on our Common Stock, the issuance of certain rights or warrants,
27
Table of Contents
subdivisions, combinations, distributions of capital stock, indebtedness, or assets, cash dividends and certain issuer tender or exchange offers, as set forth in the Certificate of Designations. However, the conversion rate may not be adjusted for other events, such as the exercise of stock options held by our employees or offerings of our Common Stock or securities convertible into Common Stock (other than those set forth in the Certificate of Designations) for cash or in connection with acquisitions, which may adversely affect the market price of our Common Stock. Further, if any of these other events adversely affects the market price of our Common Stock, we expect it to also adversely affect the market price of our Series A Convertible Preferred Stock. In addition, the terms of our Series A Convertible Preferred Stock do not restrict our ability to offer Common Stock or securities convertible into Common Stock in the future or to engage in other transactions that could dilute our Common Stock. We have no obligation to consider the interests of the holders of our Series A Convertible Preferred Stock in engaging in any such offering or transaction. If we issue additional shares of Common Stock, those issuances may materially and adversely affect the market price of our Common Stock and, in turn, those issuances may adversely affect the trading price of the Series A Convertible Preferred Stock.
The additional shares of our Common Stock deliverable for shares of Series A Convertible Preferred Stock converted in connection with a fundamental change may not adequately compensate holders of our Series A Convertible Preferred Stock.
If a “fundamental change” (as defined in the Certificate of Designations) occurs, we will under certain circumstances increase the conversion rate by a number of additional shares of our Common Stock for shares of Series A Convertible Preferred Stock converted in connection with such fundamental change as described in the Certificate of Designations. While this feature is designed to, among other things, compensate you for lost option time value of your shares of Series A Convertible Preferred Stock as a result of the fundamental change, it may not adequately compensate you for your loss as a result of such transaction. In addition, the conversion rate as adjusted will not exceed the $1,000 liquidation preference, divided by 66 2/3% of the closing sale price of our Common Stock on June 30, 2014.
In addition, you will have no additional rights upon a fundamental change, and will have no right not to convert the Series A Convertible Preferred Stock into shares of our Common Stock. Any shares of Common Stock you receive upon a fundamental change may be worth less than the liquidation preference per share of Series A Convertible Preferred Stock.
Our obligation to satisfy the additional shares requirement could be considered a penalty, in which case the enforceability thereof would be subject to general principles of reasonableness and equitable remedies.
In some limited circumstances, we may not have reserved a sufficient number of shares of our Common Stock to issue the full amount of shares of Common Stock issuable upon conversion following a fundamental change.
Some significant restructuring transactions may not constitute a fundamental change but may nevertheless result in holders of the Series A Convertible Preferred Stock being adversely affected.
Upon the occurrence of a “fundamental change” (as defined in the Certificate of Designations), there may be an increase in the conversion rate as described in the Certificate of Designations. However, these provisions will not afford protection to holders of Series A Convertible Preferred Stock in the event of other transactions that could adversely affect the value of the Series A Convertible Preferred Stock. For example, transactions such as leveraged recapitalizations, refinancings, restructurings, or acquisitions initiated by us may not constitute a fundamental change. In the event of any such transaction, holders would not have the protection afforded by the provisions applicable to a fundamental change even though each of these transactions could increase the amount of our indebtedness, or otherwise adversely affect our capital structure or any credit ratings, thereby adversely affecting the holders of Series A Convertible Preferred Stock.
28
Table of Contents
Upon a conversion in connection with a fundamental change, holders of our Series A Convertible Preferred Stock may receive consideration worth less than the $1,000 liquidation preference per share of Series A Convertible Preferred Stock, plus any accumulated and unpaid dividends thereon.
If a “fundamental change” (as defined in the Certificate of Designations) occurs, and regardless of the price paid (or deemed paid) per share of our Common Stock in such fundamental change, then the conversion rate may be adjusted to increase the number of the shares of our Common Stock deliverable upon conversion of each share of Series A Convertible Preferred Stock to the $1,000 liquidation preference per share of Series A Convertible Preferred Stock, plus any accumulated and unpaid dividends thereon. However, if the adjustment is based on an amount per share that is less than the floor of 66 2/3% of the closing sale price of our Common Stock on June 30, 2014, holders will likely receive a number of shares of Common Stock worth less than the $1,000 liquidation preference per share of Series A Convertible Preferred Stock, plus any accumulated and unpaid dividends thereon. You will have no claim against us for the difference between the value of the consideration you receive upon a conversion in connection with a fundamental change and the $1,000 liquidation preference per share of Series A Convertible Preferred Stock, plus any accumulated and unpaid dividends thereon.
We have reserved a number of shares of our Common Stock for issuance upon the conversion of the Series A Convertible Preferred Stock equal to the aggregate conversion rate, which, under limited circumstances, is less than the maximum number of shares of Common Stock that we might be required to issue upon such conversion.
On issuance of the Series A Convertible Preferred Stock, we reserved, and are obligated under the terms of the Series A Convertible Preferred Stock to keep reserved at all times, a number of shares of our Common Stock equal to the aggregate liquidation preference divided by the closing sale price of our Common Stock on the date of the closing of our issuance of the Series A Convertible Preferred Stock. This is less than the maximum number of shares of our Common Stock issuable upon conversion of the Series A Convertible Preferred Stock in connection with a fundamental change where we could, depending on the stock price at the time, be required to issue upon conversion of the Series A Convertible Preferred Stock, shares of Common Stock representing the $1,000 liquidation preference per share divided by 66 2/3% of the closing sale price of our Common Stock on June 30, 2014. In that circumstance, we would not have reserved the full amount of shares of our Common Stock issuable upon conversion of the Series A Convertible Preferred Stock. While we may satisfy our obligation to issue shares upon conversion of the Series A Convertible Preferred Stock by utilizing authorized, unreserved and unissued shares of Common Stock, if any, or by redesignating reserved shares or purchasing shares in the open market, there can be no assurance that we would be able to do so at that time.
We may issue additional series of preferred stock that rank equally to the Series A Convertible Preferred Stock as to dividend payments and liquidation preference.
Neither our certificate of incorporation nor the Certificate of Designations for the Series A Convertible Preferred Stock prohibits us from issuing additional series of preferred stock that would rank equally to the Series A Convertible Preferred Stock as to dividend payments and liquidation preference. Our certificate of incorporation provides that we have the authority to issue up to 5,000,000 shares of preferred stock, including up to 100,000 shares of Series A Convertible Preferred Stock. The issuances of other series of preferred stock could have the effect of reducing the amounts available to the Series A Convertible Preferred Stock in the event of our liquidation, winding-up or dissolution. It may also reduce cash dividend payments on the Series A Convertible Preferred Stock if we do not have sufficient funds to pay dividends on all Series A Convertible Preferred Stock outstanding and outstanding parity preferred stock.
29
Table of Contents
Holders of our Series A Convertible Preferred Stock will have no rights with respect to the shares of our Common Stock underlying the Series A Convertible Preferred Stock until you convert your Series A Convertible Preferred Stock, but you may be adversely affected by certain changes made with respect to our Common Stock.
You will have no rights with respect to the shares of our Common Stock underlying your Series A Convertible Preferred Stock, including voting rights, rights to respond to Common Stock tender offers, if any, and rights to receive dividends or other distributions on our Common Stock, if any (in each case, other than through a conversion rate adjustment), prior to the conversion date with respect to a conversion of your Series A Convertible Preferred Stock, but your investment in our Series A Convertible Preferred Stock may be negatively affected by these events. Upon conversion, you will be entitled to exercise the rights of a holder of Common Stock only as to matters for which the relevant record date occurs on or after the conversion date. For example, in the event that an amendment is proposed to our certificate of incorporation or bylaws requiring stockholder approval and the record date for determining the stockholders of record entitled to vote on the amendment occurs prior to the conversion date, you will not be entitled to vote on the amendment, although you will nevertheless be subject to any changes in the powers, preferences or special rights of our Common Stock.
Holders of our Series A Convertible Preferred Stock will have no voting rights except under limited circumstances.
Except with respect to certain material and adverse changes to the Series A Convertible Preferred Stock as described in the Certificate of Designations, you do not have voting rights and will have no right to vote for any members of our board of directors, except as may be required by Delaware law.
Future issuances of preferred stock may adversely affect the market price for our Common Stock.
Additional issuances and sales of preferred stock, or the perception that such issuances and sales could occur, may cause prevailing market prices for our Common Stock to decline and may adversely affect our ability to raise additional capital in the financial markets at times and prices favorable to us.
The increased conversion rate triggered by a fundamental change could discourage a potential acquiror.
The increased conversion rate triggered by a “fundamental change” (as defined in the Certificate of Designations) could discourage a potential acquiror, including potential acquirors that otherwise seek a transaction with us that would be attractive to you.
We may not have sufficient earnings and profits in order for dividends on the Series A Convertible Preferred Stock to be treated as dividends for U.S. federal income tax purposes.
The dividends payable by us on the Series A Convertible Preferred Stock may exceed our current and accumulated earnings and profits, as calculated for U.S. federal income tax purposes. If that occurs, it will result in the amount of the dividends that exceed such earnings and profits being treated for U.S. federal income tax purposes first as a return of capital to the extent of the beneficial owner’s adjusted tax basis in the Series A Convertible Preferred Stock, and the excess, if any, over such adjusted tax basis as capital gain. Such treatment will generally be unfavorable for corporate beneficial owners and may also be unfavorable to certain other beneficial owners. See “Material U.S. Federal Income Tax Considerations—Consequences to U.S. Holders of Series A Convertible Preferred Stock or Common Stock.”
Holders of our Series A Convertible Preferred Stock may be subject to tax if we make or fail to make certain adjustments to the conversion rate of the Series A Convertible Preferred Stock even though you do not receive a corresponding cash distribution.
The conversion rate of the Series A Convertible Preferred Stock is subject to adjustment in certain circumstances, including the payment of cash dividends. If the conversion rate is adjusted as a result of a
30
Table of Contents
distribution that is taxable to our common stockholders, such as a cash dividend, you may be deemed to have received a dividend subject to U.S. federal income tax without the receipt of any cash. In addition, a failure to adjust (or to adjust adequately) the conversion rate after an event that increases your proportionate interest in us could be treated as a deemed taxable dividend to you. If a “fundamental change” (as defined in the Certificate of Designations) occurs, under some circumstances, we will increase the conversion rate for shares of Series A Convertible Preferred Stock converted in connection with such fundamental change. Such increase may also be treated as a distribution subject to U.S. federal income tax as a dividend. See “Material U.S. Federal Income Tax Considerations.” If you are a non-U.S. holder (as defined in “Material U.S. Federal Income Tax Considerations”), any deemed dividend may be subject to U.S. federal withholding tax at a 30% rate, or such lower rate as may be specified by an applicable treaty, which may be set off against subsequent payments on the Series A Convertible Preferred Stock. See “Material U.S. Federal Income Tax Considerations.”
If you are a non-U.S. holder, dividends on our Series A Convertible Preferred Stock that are paid in shares may be subject to U.S. federal withholding tax in the same manner as a cash dividend, which the withholding agent might satisfy through a sale of a portion of the shares you receive as a dividend or through withholding of other amounts payable to you.
We may elect to pay dividends on our Series A Convertible Preferred Stock in shares of Series A Convertible Preferred Stock rather than in cash. Any such stock dividends paid to you will be taxable in the same manner as cash dividends and, if you are a non-U.S. holder (as defined in “Material U.S. Federal Income Tax Considerations”), may be subject to U.S. federal withholding tax (at a 30% rate, or lower treaty rate, if applicable). Any required withholding tax might be satisfied by the withholding agent through a sale of a portion of the shares you receive as a dividend or might be withheld from cash dividends or sales proceeds subsequently paid or credited to you.
31
Table of Contents
CAUTIONARY NOTE REGARDING FORWARD-LOOKING STATEMENTS
This prospectus contains forward-looking statements within the meaning of the “safe harbor” provisions of the Private Securities Litigation Reform Act of 1995. Specifically, forward-looking statements may include statements relating to:
| • | our future financial performance; |
| • | changes in the market for our products; |
| • | our expansion plans and opportunities; and |
| • | other statements preceded by, followed by or that include the words “estimate,” “plan,” “project,” “forecast,” “intend,” “expect,” “anticipate,” “believe,” “seek,” “target” or similar expressions. |
These forward-looking statements are based on information available as of the date of this prospectus and current expectations, forecasts and assumptions, and involve a number of judgments, risks and uncertainties. Accordingly, forward-looking statements should not be relied upon as representing our views as of any subsequent date, and we do not undertake any obligation to update forward-looking statements to reflect events or circumstances after the date they were made, whether as a result of new information, future events or otherwise, except as may be required under applicable securities laws.
As a result of a number of known and unknown risks and uncertainties, our actual results or performance may be materially different from those expressed or implied by these forward-looking statements. Some factors that could cause actual results to differ include:
| • | the level of demand for our products; |
| • | competition in our markets; |
| • | our ability to grow and manage growth profitably; |
| • | our ability to access additional capital; |
| • | changes in applicable laws or regulations; |
| • | our ability to attract and retain qualified personnel; |
| • | the possibility that we may be adversely affected by other economic, business, and/or competitive factors; and |
| • | other risks and uncertainties indicated in this prospectus, including those under “Risk Factors.” |
32
Table of Contents
Issuance of Common Stock Underlying Warrants
We will receive the proceeds from the exercise of Warrants, but not from the sale of the underlying Common Stock. We intend to use any proceeds for working capital and general corporate purposes.
Resale of Common Stock, IPO Placement Warrants and Series A Convertible Preferred Stock by Selling Security Holders
We will not receive any of the proceeds from the sale of Common Stock, IPO Placement Warrants or Series A Convertible Preferred Stock by the selling security holders named herein. However, we will receive proceeds from the exercise of the IPO Placement Warrants if they are exercised by the selling security holder. We intend to use any proceeds for working capital and general corporate purposes.
DETERMINATION OF OFFERING PRICE
Issuance of Common Stock Underlying Warrants
The offering price of the shares of Common Stock underlying the Warrants offered hereby is determined by reference to the exercise price of the Warrants of $12.00 per share.
Resale of Common Stock, IPO Placement Warrants and Series A Convertible Preferred Stock by Selling Security Holders
Our Common Stock and Warrants are quoted on Nasdaq under the symbols “JASN,” and “JASNW,” respectively. The actual offering price by the selling security holders of the shares of Common Stock and IPO Placement Warrants covered by this prospectus will be determined by prevailing market prices at the time of sale, by private transactions negotiated by the selling security holders or as otherwise described in the section entitled “Plan of Distribution.”
Since the Series A Convertible Preferred Stock is not listed or quoted on any exchange or quotation system, there is no established trading market for our Series A Convertible Preferred Stock and no assurance that an active trading market for our Series A Convertible Preferred Stock will develop, or, if developed, that it will be sustained. In the absence of a trading market or an active trading market, investors may be unable to liquidate their investment or make any profit from the investment. The facts considered in determining the conversion price of the Series A Convertible Preferred Stock at the time of the PIPE Investment were our financial condition and prospects and the general condition of the securities market. In determining the conversion price, management also considered such factors as the prospects, if any, for similar companies undertaking a business combination, anticipated results of operations, present financial resources and the likelihood of acceptance of the PIPE Investment. The conversion price bears no relationship to the book value, assets or earnings of our Company or any other recognized criteria of value.
33
Table of Contents
PRICE RANGE OF SECURITIES AND DIVIDENDS
The Company’s Common Stock and Warrants are currently quoted on Nasdaq under the symbols “JASN” and “JASNW,” respectively. Through June 30, 2014, our Common Stock, Warrants and Units were quoted under the symbols “QPAC,” “QPACW,” and “QPACU,” respectively. Upon the consummation of the Business Combination, we separated our Units, which were sold in our IPO, into their component securities of one share of Common Stock and one Warrant, and the Units ceased public trading. There is no established trading market for the Series A Convertible Preferred Stock.
The following table sets forth for the periods indicated, the reported high and low closing bid quotations per share for our Common Stock and Warrants.
| Common Stock | Warrants | |||||||||||||||
| Period |
High | Low | High | Low | ||||||||||||
| 2014: |
||||||||||||||||
| First Quarter |
$ | 12.00 | $ | 9.85 | $ | 0.74 | $ | 0.40 | ||||||||
| Second Quarter(1) |
$ | 11.16 | $ | 10.10 | $ | 1.45 | $ | 0.50 | ||||||||
| Third Quarter(2) |
$ | 10.95 | $ | 10.25 | $ | 1.94 | $ | 1.27 | ||||||||
| 2013: |
||||||||||||||||
| Third Quarter(3) |
$ | 10.25 | $ | 9.80 | $ | 1.25 | $ | 0.25 | ||||||||
| Fourth Quarter |
$ | 10.50 | $ | 9.31 | $ | 1.00 | $ | 0.25 | ||||||||
| (1) | In connection with the Business Combination, we changed our fiscal quarter end date from June 30, 2014 to June 27, 2014. |
| (2) | Period commenced June 28, 2014 and is through August 1, 2014. |
| (3) | Trading commenced September 30, 2013 with respect to our Common Stock and Warrants. Trading in our Units commenced August 9, 2013. |
On August 1, 2014, the closing price of our Common Stock and Warrants was $10.41 and $1.40, respectively. As of August 1, 2014, there were 21,990,666 shares of Common Stock outstanding, held of record by 319 holders, and 45,000 shares of Series A Convertible Preferred Stock outstanding, held of record by 11 holders. In addition, 13,993,773 shares of Common Stock are issuable upon exercise of 13,993,773 Warrants, held of record by 2 holders. The number of record holders of our Common Stock, Series A Convertible Preferred Stock and Warrants does not include DTC participants or beneficial owners holding shares through nominee names.
Dividend Policy
The Company has not paid any dividends on its Common Stock to date. It is the present intention of the Company to retain any earnings for use in its business operations and, accordingly, the Company does not anticipate the board of directors declaring any dividends in the foreseeable future on our Common Stock. In addition, certain of our loan agreements restrict the payment of dividends and the terms of our Series A Convertible Preferred Stock may from time to time prevent us from paying cash dividends on our Common Stock.
34
Table of Contents
RATIO OF EARNINGS TO FIXED CHARGES AND TO FIXED CHARGES AND PREFERENCE DIVIDENDS
The following table shows our unaudited ratios of earnings to (a) fixed charges and (b) fixed charges and preference dividends for the periods presented:
| (Unaudited) | ||||||||||||||||||||||||||||||
| Predecessor | Successor | |||||||||||||||||||||||||||||
| Year Ended December 25, |
Period from December 26, 2009 to September 21, |
Period from September 22, 2010 to December 31, |
Year Ended December 31, |
Three Months Ended March 28, 2014 |
||||||||||||||||||||||||||
| 2009 | 2010 | 2010 | 2011 | 2012 | 2013 | |||||||||||||||||||||||||
| Ratio of earnings to fixed charges(1) |
— | (2) | 3.5 | — | (2) | 1.6 | 1.9 | 3.2 | 3.8 | |||||||||||||||||||||
| Ratio of earnings to fixed charges and preference dividends(1) |
— | (2) | 3.5 | — | (2) | 1.3 | 1.3 | 2.6 | 3.8 | |||||||||||||||||||||
| Amount (in thousands) of deficiency in earnings to fixed charges |
$ | 44,576 | — | $ | 2,103 | — | — | — | — | |||||||||||||||||||||
| Amount (in thousands) of deficiency in earnings to fixed charges and preference dividends |
$ | 44,576 | — | $ | 11,700 | — | — | — | — | |||||||||||||||||||||
| 1) | For purposes of calculating the ratios of consolidated earnings to fixed charges and to fixed charges and preference dividends: |
| • | “earnings” consist of income (loss) before income taxes and equity income (loss) of investees, plus fixed charges and distributed income of equity investees; |
| • | “fixed charges” represent interest expensed and capitalized, and amortization of deferred financing costs and accretion of debt discount; and |
| • | “preference dividends” refers to the amount of pre-tax earnings that is required to pay the cash dividends on outstanding preference securities and is computed as the amount of (a) the dividend divided by (b) the result of 1 minus the effective income tax rate applicable to continuing operations. |
The ratios of earnings to fixed charges and to fixed charges and preference dividends are ratios that we are required to present in this prospectus and have been calculated in accordance with Commission rules and regulations. These ratios have no application to our credit and lease facilities and preferred shares and we believe they are not ratios used by investors to evaluate our overall operating performance.
| 2) | The ratio of earnings to fixed charges and to fixed charges and preference dividends for this period was less than 1.0x. |
35
Table of Contents
SELECTED HISTORICAL FINANCIAL INFORMATION
The consolidated statement of operations data for the years ended December 31, 2013, 2012 and 2011 and the balance sheet data as of December 31, 2013 and 2012 have been derived from Jason’s audited consolidated financial statements included elsewhere in this prospectus. The consolidated statements of operations data for the three months ended March 28, 2014 and March 29, 2013 and balance sheet data as of March 28, 2014 have been derived from Jason’s unaudited condensed consolidated financial statements included elsewhere in this prospectus. The consolidated statements of operations data for the period September 22, 2010 to December 31, 2010, the period December 26, 2009 to September 21, 2010, and for the year ended December 25, 2009 and the consolidated balance sheet data as of December 31, 2011 and 2010 and as of December 25, 2009 has been derived from Jason’s historical consolidated financial statements not included in this prospectus.
Effective September 21, 2010, Jason effectuated a balance sheet recapitalization of Jason (the “2010 Recapitalization”). Jason reflected the 2010 Recapitalization as a business combination reflecting a new accounting and reporting basis as of September 22, 2010. Accordingly, the consolidated statements of operations data, consolidated statements of comprehensive income data and consolidated balance sheet data for the period December 26, 2009 to September 21, 2010 and for the year ended December 25, 2009 (“Predecessor” periods) are not comparable to the same information presented for periods after September 21, 2010 (“Successor” periods) due to the significant change in the reporting basis. The 2010 Recapitalization was necessitated by the fact that the obligations outstanding under Jason’s then existing debt agreements matured (or were maturing) in April 2010 and November 2010 and the lenders associated with those debt agreements required a substantial equity infusion as a condition precedent to entering into new agreements with Jason with the proceeds from the equity infusion used to reduce debt outstanding under the debt agreements. As a result of the 2010 Recapitalization, Jason’s financial results are not comparable across the periods presented herein primarily due to the change in depreciation and amortization expense that results from the new accounting basis of its property plant and equipment and intangible assets. The changes in these expenses affect the comparability of cost of sales, gross profit and selling and administrative expense between Predecessor and Successor periods.
As a result of the 2010 Recapitalization, Jason expensed $12.4 million in the predecessor period related to advisor services, legal advice, and other professional fees to effectuate the 2010 Recapitalization. In addition, Jason recognized cancellation of debt income related to the restructuring of its debt obligations of $77.4 million. Both items have been included as separate line items in the consolidated statements of operations for the period from December 26, 2009 to September 21, 2010.
Prior to the 2010 Recapitalization, Jason operated on a 52 or 53 week fiscal year ending on the Friday closest to December 31. Following the 2010 Recapitalization, Jason operates on a calendar year basis. Fiscal year 2009 ended on the Friday closest to the end of the year which was December 25, 2009. The period from December 26, 2009 to September 21, 2010 therefore began on the last Saturday of 2009, whereas the period from September 22, 2010 to December 31, 2010 ends on Jason’s new fiscal year end date being the last day of the calendar year.
36
Table of Contents
The historical results presented below are not necessarily indicative of the results to be expected for any future period. This information should be read in conjunction with “Risk Factors,” “Management’s Discussion and Analysis of Financial Condition and Results of Operations,” and Jason’s consolidated financial statements and the related notes included elsewhere in this prospectus.
| Predecessor | Successor | |||||||||||||||||||||||||||||||||
| Year Ended December 25, |
Period from December 26, 2009 to September 21, |
Period from September 22, 2010 to December 31, |
Year Ended December 31, | Three Months Ended | ||||||||||||||||||||||||||||||
| 2009 | 2010 | 2010 | 2011 | 2012 | 2013 | March 29, 2013 |
March 28, 2014 |
|||||||||||||||||||||||||||
| (in thousands, except per share data) | ||||||||||||||||||||||||||||||||||
| Consolidated Statement of Operations Data: |
||||||||||||||||||||||||||||||||||
| Net sales |
$ | 437,630 | $ | 416,548 | $ | 141,672 | $ | 600,557 | $ | 655,020 | $ | 680,845 | $ | 179,669 | $ | 186,536 | ||||||||||||||||||
| Cost of goods sold |
367,351 | 331,253 | 114,465 | 469,943 | 515,154 | 527,371 | 139,255 | 144,492 | ||||||||||||||||||||||||||
|
|
|
|
|
|
|
|
|
|
|
|
|
|
|
|
|
|||||||||||||||||||
| Gross profit |
70,279 | 85,295 | 27,207 | 130,614 | 139,866 | 153,474 | 40,414 | 42,044 | ||||||||||||||||||||||||||
| Selling and administrative expenses |
74,728 | 61,340 | 24,438 | 96,302 | 99,139 | 109,962 | 26,976 | 29,453 | ||||||||||||||||||||||||||
| Newcomerstown fire costs, net of recoveries |
— | — | — | 2,947 | 4,736 | (12,483 | ) | 1,719 | — | |||||||||||||||||||||||||
| Impairment of long-lived assets |
9,457 | — | — | 1,288 | 544 | — | — | — | ||||||||||||||||||||||||||
| Loss (gain) on disposals of fixed assets—net |
518 | (343 | ) | 68 | 62 | 472 | 22 | 5 | 123 | |||||||||||||||||||||||||
| Restructuring |
9,348 | 1,938 | — | 710 | 1,631 | 2,950 | 72 | 647 | ||||||||||||||||||||||||||
| Advisory, legal and professional fees |
3,104 | 12,436 | 547 | — | — | — | — | — | ||||||||||||||||||||||||||
| Multiemployer pension plan withdrawal expense |
— | — | — | — | 3,395 | (696 | ) | — | — | |||||||||||||||||||||||||
|
|
|
|
|
|
|
|
|
|
|
|
|
|
|
|
|
|||||||||||||||||||
| Operating income |
(26,876 | ) | 9,924 | 2,154 | 29,305 | 29,949 | 53,719 | 11,642 | 11,821 | |||||||||||||||||||||||||
| Interest expense—long-term debt |
(27,482 | ) | (23,489 | ) | (4,228 | ) | (17,011 | ) | (18,612 | ) | (20,716 | ) | (9,780 | ) | (3,495 | ) | ||||||||||||||||||
| Cancellation of debt income |
— | 77,358 | — | — | — | — | — | — | ||||||||||||||||||||||||||
| Interest income—common stock purchase warrants |
7,961 | — | — | — | — | — | — | — | ||||||||||||||||||||||||||
| Equity income |
468 | 773 | 410 | 865 | 1,510 | 2,345 | 225 | 315 | ||||||||||||||||||||||||||
| Gain from sale of joint ventures |
— | — | — | — | — | — | — | 3,508 | ||||||||||||||||||||||||||
| Gain from involuntary conversion of equipment |
— | — | — | 6,103 | 6,351 | 1,927 | — | |||||||||||||||||||||||||||
| Other income (expense)—net |
204 | 81 | (29 | ) | 266 | 543 | 636 | 47 | 78 | |||||||||||||||||||||||||
|
|
|
|
|
|
|
|
|
|
|
|
|
|
|
|
|
|||||||||||||||||||
| Income (loss) before income taxes |
(45,725 | ) | 64,647 | (1,693 | ) | 13,425 | 19,493 | 42,335 | 4,061 | 12,227 | ||||||||||||||||||||||||
| Tax provision (benefit) |
5,995 | 2,845 | (1,021 | ) | 4,117 | 4,828 | 18,247 | 1,420 | 4,492 | |||||||||||||||||||||||||
|
|
|
|
|
|
|
|
|
|
|
|
|
|
|
|
|
|||||||||||||||||||
| Net income (loss) |
$ | (51,720 | ) | $ | 61,802 | $ | (672 | ) | $ | 9,308 | $ | 14,665 | $ | 24,088 | $ | 2,641 | $ | 7,735 | ||||||||||||||||
| Accretion of preferred stock and redemption premium |
— | — | 9,597 | 3,733 | 6,312 | 2,405 | 986 | — | ||||||||||||||||||||||||||
|
|
|
|
|
|
|
|
|
|
|
|
|
|
|
|
|
|||||||||||||||||||
| Net income (loss) available to common shareholders |
$ | (51,720 | ) | $ | 61,802 | $ | (10,269 | ) | $ | 5,575 | $ | 8,353 | $ | 21,683 | $ | 1,655 | $ | 7,735 | ||||||||||||||||
|
|
|
|
|
|
|
|
|
|
|
|
|
|
|
|
|
|||||||||||||||||||
| Earnings (loss) per share: |
||||||||||||||||||||||||||||||||||
| Basic and diluted |
$ | (2.93 | ) | $ | 3.50 | $ | (10,269.00 | ) | $ | 5,575.00 | $ | 8,353.00 | $ | 21,683.00 | $ | 1,655.00 | $ | 7,735.00 | ||||||||||||||||
|
|
|
|
|
|
|
|
|
|
|
|
|
|
|
|
|
|||||||||||||||||||
| Weighted-average shares outstanding: |
||||||||||||||||||||||||||||||||||
| Basic and diluted |
17,656,923 | 17,656,923 | 1,000 | 1,000 | 1,000 | 1,000 | 1,000 | 1,000 | ||||||||||||||||||||||||||
| Cash dividends paid per common share |
$ | — | $ | — | $ | — | $ | — | $ | — | $ | 43,055 | $ | 24,962 | $ | — | ||||||||||||||||||
37
Table of Contents
| Predecessor | Successor | |||||||||||||||||||||||||
| As of December 25, | As of December 31, | As of March 29, | ||||||||||||||||||||||||
| 2009 | 2010 | 2011 | 2012 | 2013 | 2014 | |||||||||||||||||||||
| (in thousands) | ||||||||||||||||||||||||||
| Consolidated Balance Sheet Data: |
||||||||||||||||||||||||||
| Cash and cash equivalents |
$ | 27,145 | $ | 23,704 | $ | 14,734 | $ | 29,557 | $ | 16,318 | $ | 21,800 | ||||||||||||||
| Total assets |
$ | 307,377 | $ | 376,770 | $ | 411,091 | $ | 431,354 | $ | 423,017 | $ | 457,115 | ||||||||||||||
| Total liabilities |
$ | 431,284 | $ | 303,896 | $ | 331,557 | $ | 336,428 | $ | 392,545 | $ | 419,264 | ||||||||||||||
| Redeemable preferred stock |
$ | — | $ | 35,965 | $ | 39,698 | $ | 46,010 | $ | — | $ | — | ||||||||||||||
| Total stockholders’ equity (deficit) |
$ | (123,907 | ) | $ | 36,909 | $ | 39,836 | $ | 48,916 | $ | 30,472 | $ | 37,851 | |||||||||||||
38
Table of Contents
UNAUDITED PRO FORMA CONDENSED COMBINED FINANCIAL INFORMATION
For purposes of this section and the related Notes thereto, the term “Quinpario” refers to Quinpario Acquisition Corp., “Quinpario Sub” refers to JPHI Holdings Inc., and “Jason” refers to Jason Partners Holdings Inc., in each case prior to the Business Combination.
The following unaudited pro forma condensed combined balance sheet as of March 31, 2014 and the unaudited pro forma condensed combined statements of operations for the three months ended March 31, 2014 and for the year ended December 31, 2013 are based on the historical financial statements of Jason and Quinpario after giving effect to the Business Combination and the related financing transactions.
The unaudited pro forma condensed combined statement of operations for the three months ended March 31, 2014 and for the year ended December 31, 2013 give pro forma effect to (1) the Business Combination, (2) the related financing transactions, and (3) the redemption of warrants tendered upon expiration of the Company’s warrant tender offer on July 18, 2014, as if they had occurred on January 1, 2013. The unaudited pro forma condensed combined balance sheet as of March 31, 2014 assumes that the Business Combination and the related financing transactions were completed on March 31, 2014.
The unaudited pro forma condensed combined balance sheet as of March 31, 2014 was derived from Jason’s unaudited consolidated balance sheet as of March 28, 2014 and Quinpario’s unaudited consolidated balance sheet as of March 31, 2014. The unaudited pro forma condensed combined statement of operations for the three months ended March 31, 2014 was derived from Jason’s unaudited consolidated statement of operations for the three months ended March 28, 2014 and Quinpario’s unaudited consolidated statement of income for the three months ended March 31, 2014. The unaudited pro forma condensed combined statement of operations for the year ended December 31, 2013 was derived from Jason’s audited consolidated statement of operations for the year ended December 31, 2013 and Quinpario’s audited consolidated statement of income for the period May 31, 2013 (inception) to December 31, 2013.
The Business Combination is accounted for using the acquisition method of accounting under the provisions of Accounting Standards Codification (“ASC”) 805, “Business Combinations,” (“ASC 805”). The pro forma adjustments are based on the information currently available and the assumptions and estimates underlying the pro forma adjustments are described in the accompanying notes. Actual results may differ materially from the assumptions within the accompanying unaudited pro forma condensed combined financial information.
The unaudited pro forma condensed combined statements of operations are not necessarily indicative of what the actual results of operations would have been had the Business Combination taken place on the date indicated, nor is it indicative of the future consolidated results of operations of the post-combination company. The unaudited pro forma condensed combined financial information should be read in conjunction with the accompanying notes and the sections in this prospectus entitled “Management’s Discussion and Analysis of Financial Condition and Results of Operations” and the historical consolidated financial statements and notes thereto of Quinpario and Jason.
The unaudited pro forma condensed combined financial information has been prepared to illustrate the effect of the Business Combination and has been prepared for informational purposes only. The historical consolidated financial statements have been adjusted in the unaudited pro forma condensed combined financial information to give effect to pro forma events that are (1) directly attributable to the Business Combination, (2) factually supportable and (3) with respect to the statement of operations, expected to have a continuing impact on the results of the post-combination company.
The unaudited pro forma condensed combined financial statements have been prepared based on (1) 2,542,667 shares of Common Stock redeemed, reflecting the final level of stockholders exercising their redemption rights with respect to their shares, and (2) 4,406,227 warrants tendered, reflecting the final level of warrant holders validly tendering their warrants under the Company’s tender offer that expired on July 18, 2014.
39
Table of Contents
On June 30, 2014, we raised gross proceeds of $45 million from the sale of Series A Convertible Preferred Stock to consummate the Business Combination. The Series A Convertible Preferred Stock is convertible into the Common Stock at the option of the holder at any time. For further information regarding the pro forma impact of the conversion of Series A Convertible Preferred Stock to Common Stock refer to notes 3 (o) and 5 (d) of the notes to unaudited pro forma condensed financial information.
On May 6, 2014, we commenced an offer to purchase up to 9,200,000 of our Public Warrants at a purchase price of $0.75 per public warrant in a proposed tender offer that expired on July 18, 2014 (the “Warrant Tender Offer”). On June 18, 2014 and July 7, 2014, we increased the purchase price of the Warrant Tender Offer to $1.00 and $1.50 per Warrant, respectively. The purpose of the Warrant Tender Offer was to provide holders of Public Warrants that may not wish to retain their Public Warrants following the Business Combination the possibility of receiving cash for their Public Warrants. For further information regarding the pro forma impact of the warrant tender refer to note 3 (t) of the notes to unaudited pro forma condensed financial information.
40
Table of Contents
Unaudited Pro Forma Condensed Combined Balance Sheet
As of March 31, 2014
(in thousands)
| Quinpario Acquisition Corp. |
Jason Partners Holdings Inc. |
Pro Forma Adjustments for the Business Combination |
Footnote Reference |
Pro Forma Adjustments for Refinancing |
Footnote Reference |
Pro Forma Adjustments for Tender of Common Stock and Warrants |
Footnote Reference |
Pro Forma Combined |
||||||||||||||||||||||||||||
| ASSETS |
||||||||||||||||||||||||||||||||||||
| Current assets: |
||||||||||||||||||||||||||||||||||||
| Cash and cash equivalents |
$ | 129 | $ | 21,800 | $ | (258,798 | ) | 3a | $ | 177,111 | 3k | $ | (26,101 | ) | 3s | $ | 73,329 | |||||||||||||||||||
| (17,500 | ) | 3b | 399,400 | 3m | (6,609 | ) | 3t | |||||||||||||||||||||||||||||
| (6,120 | ) | 3p | (244,400 | ) | 3n | |||||||||||||||||||||||||||||||
| (2,908 | ) | 3n | ||||||||||||||||||||||||||||||||||
| 42,500 | 3o | |||||||||||||||||||||||||||||||||||
| (5,175 | ) | 3q | ||||||||||||||||||||||||||||||||||
| Accounts receivable—net |
— | 110,443 | — | — | — | 110,443 | ||||||||||||||||||||||||||||||
| Inventories |
— | 76,668 | 3,868 | 3d | — | — | 80,536 | |||||||||||||||||||||||||||||
| Other current assets |
88 | 28,034 | (1,377 | ) | 3h | — | — | 26,745 | ||||||||||||||||||||||||||||
|
|
|
|
|
|
|
|
|
|
|
|
|
|||||||||||||||||||||||||
| Total current assets |
217 | 236,945 | (279,927 | ) | 366,528 | (32,710 | ) | 291,053 | ||||||||||||||||||||||||||||
|
|
|
|
|
|
|
|
|
|
|
|
|
|||||||||||||||||||||||||
| Investments held in trust account |
177,111 | — | — | (177,111 | ) | 3k | — | — | ||||||||||||||||||||||||||||
| Property, plant, and equipment—net |
— | 125,419 | 71,977 | 3e | — | — | 197,396 | |||||||||||||||||||||||||||||
| Goodwill |
— | 34,198 | 142,015 | 3i | — | — | 176,213 | |||||||||||||||||||||||||||||
| Other intangible assets—net |
— | 47,765 | 135,558 | 3f, 3g | — | — | 183,323 | |||||||||||||||||||||||||||||
| Other assets—net |
— | 12,788 | (3,524 | ) | 3n | 12,450 | 3m | — | 21,714 | |||||||||||||||||||||||||||
|
|
|
|
|
|
|
|
|
|
|
|
|
|||||||||||||||||||||||||
| Total long-term assets |
177,111 | 220,170 | 346,026 | (164,661 | ) | — | 578,646 | |||||||||||||||||||||||||||||
|
|
|
|
|
|
|
|
|
|
|
|
|
|||||||||||||||||||||||||
| TOTAL ASSETS |
$ | 177,328 | $ | 457,115 | $ | 66,099 | $ | 201,867 | $ | (32,710 | ) | $ | 869,699 | |||||||||||||||||||||||
|
|
|
|
|
|
|
|
|
|
|
|
|
|||||||||||||||||||||||||
| LIABILITIES AND STOCKHOLDERS’ EQUITY |
||||||||||||||||||||||||||||||||||||
| Current liabilities: |
||||||||||||||||||||||||||||||||||||
| Current portion of long-term debt |
$ | — | $ | 6,453 | $ | — | $ | 3,100 | 3m | $ | — | $ | 7,203 | |||||||||||||||||||||||
| (2,350 | ) | 3n | ||||||||||||||||||||||||||||||||||
| Accounts payable and accrued expenses |
2,992 | 100,046 | — | (2,908 | ) | 3n | — | 100,130 | ||||||||||||||||||||||||||||
| Other current liabilities |
— | 20,505 | — | — | — | 20,505 | ||||||||||||||||||||||||||||||
|
|
|
|
|
|
|
|
|
|
|
|
|
|||||||||||||||||||||||||
| Total current liabilities |
2,992 | 127,004 | — | (2,158 | ) | — | 127,838 | |||||||||||||||||||||||||||||
|
|
|
|
|
|
|
|
|
|
|
|
|
|||||||||||||||||||||||||
| Long-term liabilities: |
||||||||||||||||||||||||||||||||||||
| Deferred underwriters’ fee |
5,175 | — | — | (5,175 | ) | 3q | — | — | ||||||||||||||||||||||||||||
| Long-term debt |
— | 250,497 | 408 | 3n | 411,850 | 3m | — | 417,605 | ||||||||||||||||||||||||||||
| (242,050 | ) | 3n | ||||||||||||||||||||||||||||||||||
| (3,100 | ) | 3m | ||||||||||||||||||||||||||||||||||
| Deferred income taxes |
— | 25,399 | 73,882 | 3h | — | — | 99,281 | |||||||||||||||||||||||||||||
| Other long-term liabilities |
— | 16,364 | — | — | — | 16,364 | ||||||||||||||||||||||||||||||
|
|
|
|
|
|
|
|
|
|
|
|
|
|||||||||||||||||||||||||
| Total long-term liabilities |
5,175 | 292,260 | 74,290 | 161,525 | — | 533,250 | ||||||||||||||||||||||||||||||
|
|
|
|
|
|
|
|
|
|
|
|
|
|||||||||||||||||||||||||
| TOTAL LIABILITIES |
8,167 | 419,264 | 74,290 | 159,367 | — | 661,088 | ||||||||||||||||||||||||||||||
|
|
|
|
|
|
|
|
|
|
|
|
|
|||||||||||||||||||||||||
41
Table of Contents
Unaudited Pro Forma Condensed Combined Balance Sheet (Continued)
As of March 31, 2014
(in thousands)
| Quinpario Acquisition Corp. |
Jason Partners Holdings Inc. |
Pro Forma Adjustments for the Business Combination |
Footnote Reference |
Pro Forma Adjustments for Refinancing |
Footnote Reference |
Pro Forma Adjustments for Tender of Common Stock and Warrants |
Footnote Reference |
Pro Forma Combined |
||||||||||||||||||||||||||||
| Redeemable securities |
164,161 | — | — | (164,161 | ) | 3r | — | — | ||||||||||||||||||||||||||||
| EQUITY |
||||||||||||||||||||||||||||||||||||
| CONTROLLING INTEREST STOCKHOLDERS’ EQUITY (DEFICIT) |
||||||||||||||||||||||||||||||||||||
| Convertible perpetual preferred stock |
— | — | — | 42,500 | 3o | — | 42,500 | |||||||||||||||||||||||||||||
| Common stock |
1 | — | — | 2 | 3r | (1 | ) | 3s | 2 | |||||||||||||||||||||||||||
| Additional paid-in capital |
4,999 | 25,407 | (25,407 | ) | 3j | 164,159 | 3r | (26,100 | ) | 3s | 136,449 | |||||||||||||||||||||||||
| (6,609 | ) | 3t | ||||||||||||||||||||||||||||||||||
| Retained earnings (accumulated deficit) |
— | 12,375 | (12,375 | ) | 3j | — | — | (6,120 | ) | |||||||||||||||||||||||||||
| (6,120 | ) | 3p | ||||||||||||||||||||||||||||||||||
| Accumulated other comprehensive income |
— | 69 | (69 | ) | 3j | — | — | — | ||||||||||||||||||||||||||||
|
|
|
|
|
|
|
|
|
|
|
|
|
|||||||||||||||||||||||||
| TOTAL STOCKHOLDERS’ EQUITY (DEFICIT) FOR CONTROLLING INTEREST |
5,000 | 37,851 | (43,971 | ) | 206,661 | (32,710 | ) | 172,831 | ||||||||||||||||||||||||||||
| NONCONTROLLING INTEREST |
n/a | n/a | 35,780 | 3l | — | — | 35,780 | |||||||||||||||||||||||||||||
|
|
|
|
|
|
|
|
|
|
|
|
|
|||||||||||||||||||||||||
| TOTAL EQUITY |
5,000 | 37,851 | (8,191 | ) | 206,661 | (32,710 | ) | 208,611 | ||||||||||||||||||||||||||||
|
|
|
|
|
|
|
|
|
|
|
|
|
|||||||||||||||||||||||||
| TOTAL LIABILITIES AND STOCKHOLDERS’ EQUITY (DEFICIT) |
$ | 177,328 | $ | 457,115 | $ | 66,099 | $ | 201,867 | $ | (32,710 | ) | $ | 869,699 | |||||||||||||||||||||||
|
|
|
|
|
|
|
|
|
|
|
|
|
|||||||||||||||||||||||||
42
Table of Contents
Unaudited Pro Forma Condensed Combined Statement of Operations
For the Quarterly Period Ended March 31, 2014
(in thousands, except share and per share information)
| Quinpario Acquisition Corp. (Period for the three months ended March 31, 2014) |
Jason Partners Holdings Inc. (Period for the three months ended March 28, 2014) |
Pro Forma Adjustments for the Business Combination |
Footnote Reference |
Pro Forma Adjustments for Refinancing |
Footnote Reference |
Pro Forma Adjustments for Tender of Common Stock and Warrants |
Footnote Reference |
Pro Forma Combined |
Footnote Reference | |||||||||||||||||||||||||||
| Revenue |
$ | — | $ | 186,536 | $ | — | $ | — | $ | — | $ | 186,536 | ||||||||||||||||||||||||
| Cost of sales |
— | 144,492 | (4,406 | ) | 4a | — | — | 145,933 | ||||||||||||||||||||||||||||
| 5,847 | 4b | |||||||||||||||||||||||||||||||||||
|
|
|
|
|
|
|
|
|
|
|
|
|
|||||||||||||||||||||||||
| Gross profit |
— | 42,044 | (1,441 | ) | — | — | 40,603 | |||||||||||||||||||||||||||||
|
|
|
|
|
|
|
|
|
|
|
|
|
|||||||||||||||||||||||||
| Operating expenses Selling and administrative expenses |
3,546 | 29,453 | (554 | ) | 4a | — | — | 31,985 | ||||||||||||||||||||||||||||
| 865 | 4b | |||||||||||||||||||||||||||||||||||
| (1,364 | ) | 4c | ||||||||||||||||||||||||||||||||||
| 3,271 | 4d | |||||||||||||||||||||||||||||||||||
| (3,232 | ) | 4g | ||||||||||||||||||||||||||||||||||
| Newcomerstown fire gain |
— | — | — | — | — | — | ||||||||||||||||||||||||||||||
| Restructuring |
— | 647 | — | — | — | 647 | ||||||||||||||||||||||||||||||
| Other net charges (gains) |
— | 123 | — | — | — | 123 | ||||||||||||||||||||||||||||||
|
|
|
|
|
|
|
|
|
|
|
|
|
|||||||||||||||||||||||||
| Total operating expense |
3,546 | 30,223 | (1,014 | ) | — | — | 32,755 | |||||||||||||||||||||||||||||
|
|
|
|
|
|
|
|
|
|
|
|
|
|||||||||||||||||||||||||
| Operating income (loss) |
(3,546 | ) | 11,821 | (427 | ) | — | — | 7,848 | ||||||||||||||||||||||||||||
|
|
|
|
|
|
|
|
|
|
|
|
|
|||||||||||||||||||||||||
| Other income (expenses) |
||||||||||||||||||||||||||||||||||||
| Interest (expense) |
— | (3,495 | ) | — | 3,026 | 4e | — | (7,942 | ) | |||||||||||||||||||||||||||
| (7,473 | ) | 4f | ||||||||||||||||||||||||||||||||||
| Interest income |
14 | — | — | — | — | 14 | ||||||||||||||||||||||||||||||
| Gain from sale of joint ventures |
— | 3,508 | — | — | — | 3,508 | ||||||||||||||||||||||||||||||
| Other income |
— | 393 | — | — | — | 393 | ||||||||||||||||||||||||||||||
|
|
|
|
|
|
|
|
|
|
|
|
|
|||||||||||||||||||||||||
| Total other income (expense) |
14 | 406 | — | (4,447 | ) | — | (4,027 | ) | ||||||||||||||||||||||||||||
|
|
|
|
|
|
|
|
|
|
|
|
|
|||||||||||||||||||||||||
| Pre-tax income (loss) |
(3,532 | ) | 12,227 | (427 | ) | (4,447 | ) | — | 3,821 | |||||||||||||||||||||||||||
| Tax provision (benefit) |
— | 4,492 | (152 | ) | 4h | (1,703 | ) | 4h | — | 2,637 | ||||||||||||||||||||||||||
|
|
|
|
|
|
|
|
|
|
|
|
|
|||||||||||||||||||||||||
| Net income (loss) |
(3,532 | ) | 7,735 | (275 | ) | (2,744 | ) | — | 1,184 | |||||||||||||||||||||||||||
| Less: Net income attributable to the noncontrolling interest |
— | — | — | (215 | ) | 4i | — | (215 | ) | |||||||||||||||||||||||||||
|
|
|
|
|
|
|
|
|
|
|
|
|
|||||||||||||||||||||||||
| Net income (loss) attributable to controlling interest |
(3,532 | ) | 7,735 | (275 | ) | (2,959 | ) | — | 969 | |||||||||||||||||||||||||||
| Accretion of preferred stock dividends and redemption premium |
— | — | — | (900 | ) | 5c | — | (900 | ) | |||||||||||||||||||||||||||
|
|
|
|
|
|
|
|
|
|
|
|
|
|||||||||||||||||||||||||
43
Table of Contents
Unaudited Pro Forma Condensed Combined Statement of Operations (Continued)
For the Quarterly Period Ended March 31, 2014
(in thousands, except share and per share information)
| Quinpario Acquisition Corp. (Period for the three months ended March 31, 2014) |
Jason Partners Holdings Inc. (Period for the three months ended March 28, 2014) |
Pro Forma Adjustments for the Business Combination |
Footnote Reference |
Pro Forma Adjustments for Refinancing |
Footnote Reference |
Pro Forma Adjustments for Tender of Common Stock and Warrants |
Footnote Reference |
Pro Forma Combined |
Footnote Reference |
|||||||||||||||||||||||||||||
| Net income (loss) attributable to common shareholders of controlling interest |
$ | (3,532 | ) | $ | 7,735 | $ | (275 | ) | $ | (3,859 | ) | $ | — | $ | 69 | |||||||||||||||||||||||
|
|
|
|
|
|
|
|
|
|
|
|
|
|||||||||||||||||||||||||||
| Earnings (loss) per share available to common shareholders of controlling interest—basic |
$ | (0.43 | ) | $ | 0.01 | |||||||||||||||||||||||||||||||||
| Earnings (loss) per share available to common shareholders of controlling interest—diluted |
$ | (0.43 | ) | $ | 0.01 | |||||||||||||||||||||||||||||||||
| Weighted average shares outstanding— basic |
8,267,875 | — | 16,265,458 | 5a | — | (2,542,667 | ) | 3s | 21,990,666 | 5a | ||||||||||||||||||||||||||||
| Weighted average shares outstanding—diluted |
8,267,875 | — | 16,265,458 | 5a | — | (2,542,667 | ) | 3s | 21,990,666 | 5a,5b | ||||||||||||||||||||||||||||
44
Table of Contents
Unaudited Pro Forma Condensed Combined Statement of Operations
For the Fiscal Year Ended December 31, 2013
(in thousands, except share and per share information)
| Quinpario Acquisition Corp. (Period from May 31, 2013 (Inception) to December 31, 2013) |
Jason Partners Holdings Inc. (Period from January 1, 2013 to December 31, 2013) |
Pro Forma Adjustments for the Business Combination |
Footnote Reference |
Pro Forma Adjustments for Refinancing |
Footnote Reference |
Pro Forma Adjustments for Tender of Common Stock and Warrants |
Footnote Reference |
Pro Forma Combined |
Footnote Reference | |||||||||||||||||||||||||||
| Revenue |
$ | — | $ | 680,845 | $ | — | $ | — | $ | — | $ | 680,845 | ||||||||||||||||||||||||
| Cost of sales |
— | 527,371 | (19,889 | ) | 4a | — | — | 530,867 | ||||||||||||||||||||||||||||
| 23,385 | 4b | |||||||||||||||||||||||||||||||||||
|
|
|
|
|
|
|
|
|
|
|
|
|
|||||||||||||||||||||||||
| Gross profit |
— | 153,474 | (3,496 | ) | — | — | 149,978 | |||||||||||||||||||||||||||||
|
|
|
|
|
|
|
|
|
|
|
|
|
|||||||||||||||||||||||||
| Operating expenses: |
||||||||||||||||||||||||||||||||||||
| Selling and administrative expenses |
536 | 109,962 | (1,692 | ) | 4a | — | — | 119,929 | ||||||||||||||||||||||||||||
| 3,462 | 4b | |||||||||||||||||||||||||||||||||||
| (5,424 | ) | 4c | ||||||||||||||||||||||||||||||||||
| 13,085 | 4d | |||||||||||||||||||||||||||||||||||
| Newcomerstown fire gain |
— | (12,483 | ) | — | — | — | (12,483 | ) | ||||||||||||||||||||||||||||
| Restructuring |
— | 2,950 | — | — | — | 2,950 | ||||||||||||||||||||||||||||||
| Other net charges (gains) |
— | (674 | ) | — | — | — | (674 | ) | ||||||||||||||||||||||||||||
|
|
|
|
|
|
|
|
|
|
|
|
|
|||||||||||||||||||||||||
| Total operating expense |
536 | 99,755 | 9,431 | — | — | 109,722 | ||||||||||||||||||||||||||||||
|
|
|
|
|
|
|
|
|
|
|
|
|
|||||||||||||||||||||||||
| Operating income (loss) |
(536 | ) | 53,719 | (12,927 | ) | — | — | 40,256 | ||||||||||||||||||||||||||||
|
|
|
|
|
|
|
|
|
|
|
|
|
|||||||||||||||||||||||||
| Other income (expenses): |
||||||||||||||||||||||||||||||||||||
| Interest (expense) |
— | (20,716 | ) | — | 18,896 | 4e | — | (31,713 | ) | |||||||||||||||||||||||||||
| (29,893 | ) | 4f | ||||||||||||||||||||||||||||||||||
| Interest income |
22 | — | — | — | — | 22 | ||||||||||||||||||||||||||||||
| Gain from involuntary conversion of property, plant and equipment |
— | 6,351 | — | — | — | 6,351 | ||||||||||||||||||||||||||||||
| Other income |
— | 2,981 | — | — | — | 2,981 | ||||||||||||||||||||||||||||||
|
|
|
|
|
|
|
|
|
|
|
|
|
|||||||||||||||||||||||||
| Total other income (expense) |
22 | (11,384 | ) | — | (10,997 | ) | — | (22,359 | ) | |||||||||||||||||||||||||||
|
|
|
|
|
|
|
|
|
|
|
|
|
|||||||||||||||||||||||||
| Pre-tax income (loss) |
(514 | ) | 42,335 | (12,927 | ) | (10,997 | ) | — | 17,897 | |||||||||||||||||||||||||||
| Tax provision (benefit) |
— | 18,247 | (4,602 | ) | 4h | (4,212 | ) | 4h | — | 9,433 | ||||||||||||||||||||||||||
|
|
|
|
|
|
|
|
|
|
|
|
|
|||||||||||||||||||||||||
| Net income (loss) |
(514 | ) | 24,088 | (8,325 | ) | (6,785 | ) | — | 8,464 | |||||||||||||||||||||||||||
| Less: Net income attributable to the noncontrolling interest |
— | — | — | (1,540 | ) | 4i | — | (1,540 | ) | |||||||||||||||||||||||||||
|
|
|
|
|
|
|
|
|
|
|
|
|
|||||||||||||||||||||||||
45
Table of Contents
Unaudited Pro Forma Condensed Combined Statement of Operations (Continued)
For the Fiscal Year Ended December 31, 2013
(in thousands, except share and per share information)
| Quinpario Acquisition Corp. (Period from May 31, 2013 (Inception) to December 31, 2013) |
Jason Partners Holdings Inc. (Period from January 1, 2013 to December 31, 2013) |
Pro Forma Adjustments for the Business Combination |
Footnote Reference |
Pro Forma Adjustments for Refinancing |
Footnote Reference |
Pro Forma Adjustments for Tender of Common Stock and Warrants |
Footnote Reference |
Pro Forma Combined |
Footnote Reference |
|||||||||||||||||||||||||||||||
| Net income (loss) attributable to controlling interest |
(514 | ) | 24,088 | (8,325 | ) | (8,325 | ) | — | 6,924 | |||||||||||||||||||||||||||||||
| Accretion of preferred stock dividends and redemption premium |
— | (2,405 | ) | 2,405 | 3j | (3,600 | ) | 5c | — | (3,600 | ) | |||||||||||||||||||||||||||||
|
|
|
|
|
|
|
|
|
|
|
|
|
|||||||||||||||||||||||||||||
| Net income (loss) attributable to common shareholders of controlling interest |
$ | (514 | ) | $ | 21,683 | $ | (5,920 | ) | $ | (11,925 | ) | $ | — | $ | 3,324 | |||||||||||||||||||||||||
|
|
|
|
|
|
|
|
|
|
|
|
|
|||||||||||||||||||||||||||||
| Earnings (loss) per share available to common shareholders of controlling interest—basic |
$ | (0.07 | ) | $ | 0.15 | |||||||||||||||||||||||||||||||||||
| Earnings (loss) per share available to common shareholders of controlling interest—diluted |
$ | (0.07 | ) | $ | 0.15 | |||||||||||||||||||||||||||||||||||
| Weighted average shares outstanding—basic |
7,526,526 | — | 17,006,807 | 5a | — | (2,542,667 | ) | 3s | 21,990,666 | 5a | ||||||||||||||||||||||||||||||
| Weighted average shares outstanding—diluted |
7,526,526 | — | 17,006,807 | 5a | — | (2,542,667 | ) | 3s | 21,990,666 | 5a, 5b | ||||||||||||||||||||||||||||||
46
Table of Contents
NOTES TO UNAUDITED PRO FORMA CONDENSED COMBINED FINANCIAL INFORMATION
1. Description of Transactions
On June 30, 2014, pursuant to the Purchase Agreement, Quinpario acquired Jason through the acquisition of the outstanding shares of Jason’s common stock by Quinpario Sub (the “Business Combination”). Pursuant to the Purchase Agreement, upon the effectiveness of the Business Combination, shares of common stock of Jason were exchanged for cash, in the case of Seller, and validly issued shares of Quinpario Sub’s common stock in the case of the “Rollover Participants.” The Business Combination purchase price of $538.65 million is subject to working capital and other customary adjustments to be determined at the closing of the Business Combination in accordance with the terms of the Purchase Agreement. Assuming the Business Combination occurred on March 31, 2014, the consideration that would have been paid to Seller and the Rollover Participants for their respective shares of Jason common stock would have been $294.6 million, consisting of $258.8 million in cash (the “Cash Consideration”) and $35.8 million in common equity issued by Quinpario Sub (“Quinpario Sub Shares”) in exchange for the contribution of shares of Jason common stock by such members of Seller (“rollover”). Such consideration reflects an increase of $19.5 million representing the working capital adjustment based on a target working capital level of $80.0 million and a $17.5 million reduction for estimated transaction expenses paid on behalf of Seller by Jason. The Cash Consideration was comprised of funds held in our trust account and through a redemption by Jason of the remaining shares of its common stock held by Seller using the proceeds of the debt financing. The remainder of such debt financing was used by Jason to pay certain of its existing indebtedness and for general corporate purposes after closing. Such borrowed funds were assumed by the Company at closing.
On May 6, 2014, Quinpario commenced an offer to purchase up to 9,200,000 of our Public Warrants at a purchase price of $0.75 per public warrant in a proposed tender offer that expired on July 18, 2014 (the “Warrant Tender Offer”). On June 18, 2014 and July 7, 2014, Quinpario increased the purchase price of the Warrant Tender Offer to $1.00 and $1.50 per Warrant, respectively. On July 18, 2014, warrant holders validly tendered 4,406,227 warrants, resulting in a total purchase price of $6.6 million for warrants tendered.
2. Basis of Presentation
The unaudited pro forma condensed combined balance sheet as of March 31, 2014 assumes that the Business Combination,the related proposed financing transactions, and the Warrant Tender Offer were completed on March 31, 2014. The unaudited pro forma condensed combined statements of operations for the three months ended March 31, 2014 and for the year ended December 31, 2013 give pro forma effect to the Business Combination and the related financing transactions as if they had occurred on January 1, 2013. The unaudited pro forma condensed combined balance sheet as of March 31, 2014 was derived from Jason’s unaudited consolidated balance sheet as of March 28, 2014 and Quinpario’s unaudited consolidated balance sheet as of March 31, 2014. The unaudited pro forma condensed combined statement of operations for the three months ended March 31, 2014 was derived from Jason’s unaudited consolidated statement of operations for the three months ended March 28, 2014 and Quinpario’s unaudited consolidated statement of income for the three months ended March 31, 2014. The unaudited pro forma condensed combined statement of operations for the year ended December 31, 2013 was derived from Jason’s audited consolidated statement of operations for the year ended December 31, 2013 and Quinpario’s audited consolidated statement of income for the period May 31, 2013 (inception) to December 31, 2013.
Jason’s audited consolidated statement of operations for the year ended December 31, 2013 includes certain insurance gains related to the resolution of insurance claims for a fire that destroyed its Newcomerstown, Ohio facility in 2011. These gains include $12.4 million associated with business interruption activities and $6.4 million associated with the involuntary conversion of property, plant and equipment. These gains are more fully described in Note 18 of Jason’s audited consolidated financial statements.
The unaudited pro forma condensed combined financial information was prepared using the acquisition method of accounting and was based on the historical financial information of Jason and Quinpario. The acquisition method of accounting, based on ASC 805, uses the fair value concepts defined in ASC 820, “Fair Value Measurement” (“ASC 820”). The historical consolidated financial information has been adjusted in the
47
Table of Contents
accompanying unaudited pro forma condensed combined financial information to give effect to pro forma events that are (i) directly attributable to the Business Combination, (ii) factually supportable, and (iii) with respect to the unaudited pro forma condensed combined statements of operations, expected to have a continuing impact on the consolidated results. Unless indicated otherwise, all amounts presented in the unaudited pro forma condensed combined financial information section are in thousands, except per share information.
ASC 820 defines fair value, establishes the framework for measuring fair value for any asset acquired or liability assumed under U.S. GAAP, expands disclosures about fair value measurements and specifies a hierarchy of valuation techniques based on the nature of the inputs used to develop the fair value measures. Fair value is defined in ASC 820 as “the price that would be received to sell an asset or paid to transfer a liability in an orderly transaction between market participants at the measurement date”. This is an exit price concept for the valuation of an asset or liability. Market participants are assumed to be buyers or sellers in the most advantageous market for the asset or liability. Fair value measurement for an asset assumes the highest and best use by these market participants, and as a result, assets may be required to be recorded which are not intended to be used or sold and/or to value assets at a fair value measurement that do not reflect management’s intended use for those assets. Fair value measurements can be highly subjective and it is possible the application of reasonable judgment could develop different assumptions resulting in a range of alternative estimates using the same facts and circumstances. ASC 805 requires, among other things, that most assets acquired and liabilities assumed in a business combination be recognized at their fair values as of the acquisition date.
3. Unaudited Pro Forma Condensed Combined Balance Sheet Adjustments
The estimated purchase price and the allocation of the estimated purchase price discussed below are preliminary. An independent third-party valuation firm assisted in performing a preliminary valuation. The final allocation of the purchase price will be determined at a later date and is dependent on a number of factors, including the determination of the final aggregate consideration paid in connection with the Business Combination as a result of all adjustments set forth in the Purchase Agreement and the final evaluation of Jason’s tangible and identifiable intangible assets acquired and liabilities assumed. Such final adjustments, including increases or decreases to depreciation or amortization resulting from the allocation of purchase price to depreciable property, plant and equipment and amortizable intangible assets, respectively, may be material. The allocation is expected to occur within one year of the consummation of the Business Combination.
The preliminary consideration and allocation of the purchase price to the fair value of Jason’s assets acquired and liabilities assumed as if the acquisition date was March 31, 2014 is presented as follows (in thousands):
| Note | Amount | |||||||
| Calculation of consideration |
||||||||
| Purchase price |
3a | $ | 538,650 | |||||
| Purchase price adjustments in accordance with the Purchase Agreement |
||||||||
| Add: Working capital adjustment |
3a | 19,472 | ||||||
| Less: Bank debt, including accrued interest |
3a | (260,344 | ) | |||||
| Add: Cash and cash equivalents |
3a | 14,300 | ||||||
| Less: Seller transaction costs to be paid by Jason |
3b | (17,500 | ) | |||||
|
|
|
|||||||
| Total consideration to be transferred |
3a | $ | 294,578 | |||||
| Recognized amounts of identifiable assets acquired and liabilities assumed |
||||||||
| Book value of Jason’s net assets |
3c | 37,851 | ||||||
| Less: Transaction costs expected to be incurred by Jason |
3b | (17,500 | ) | |||||
| Less: Historical deferred financing costs and debt discount |
3n | (3,932 | ) | |||||
| Less: Historical Jason goodwill |
3i | (34,198 | ) | |||||
|
|
|
|||||||
| $ | (17,779 | ) | ||||||
48
Table of Contents
| Note | Amount | |||||||
| Fair value adjustments of net assets acquired |
||||||||
| Inventories |
3d | 3,868 | ||||||
| Property, plant and equipment |
3e | 71,977 | ||||||
| Identifiable intangible assets |
||||||||
| Patents |
3f | 1,353 | ||||||
| Trademarks and other intangibles |
3f | 36,884 | ||||||
| Customer relationships |
3g | 97,321 | ||||||
| Deferred tax liabilities |
3h | (75,259 | ) | |||||
|
|
|
|||||||
| Goodwill |
3i | $ | 176,213 | |||||
|
|
|
|||||||
| (a) | In accordance with the Purchase Agreement, the purchase price of $538,650 is to be adjusted based on a target net working capital level of $80,000; the purchase price will be increased by the amount that working capital exceeds the target level or will be decreased by the amount that working capital falls below the target level. The purchase price is to be further reduced for transaction expenses of Seller and for the amount of Jason’s net bank debt. Net bank debt refers to total gross bank debt, including accrued interest, less the amount of Jason’s cash and cash equivalents adjusted for the net after tax proceeds received in the recent sale of two joint venture operations. Assuming a March 31, 2014 transaction date, the net purchase price paid to Seller would total $294,578, consisting of $258,798 in cash and $35,780 in common equity as described in note 3l. |
| (b) | Represents the estimated amount of Seller transaction costs to be paid by Jason of $17,500 including investment banking fees of $8,100, fees payable to Saw Mill Capital LLC and Falcon Investment Advisors LLC (Seller’s significant shareholders) in accordance with the Management Services Agreement dated September 21, 2010 of $5,380, fees for legal, accounting, tax and valuation services of $2,700, and other expenses of $1,320. These costs will result in a reduction to Jason’s historical net assets and are not included in the pro forma statement of operations as they are directly related to the Business Combination and will be non-recurring. |
| (c) | Reflects the acquisition of the historical book value of Jason’s net assets as of March 31, 2014. |
| (d) | Represents the write-up of inventories by $3,868 to their estimated fair value of $80,536. Jason carries approximately 50 days of inventory to meet its production requirements and customer orders. Therefore, it is expected that the inventory fair value write-up will result in an increase to cost of goods sold during the period immediately following the Business Combination. The fair value estimate of raw materials was based on the purchase cost of such materials reduced by provisions for estimated obsolescence. The fair value of work-in process inventories was determined by estimating and adding the costs to bring these inventories to a finished state to the book value of such inventories, estimating the selling price of such inventories and then subtracting the cost to complete, disposal costs, holding costs and a normal profit. The fair value of finished goods inventories was determined based on the estimated selling price of such inventories then subtracting disposal costs, holding costs and a normal profit for the selling effort still to be undertaken. |
| (e) | Represents the write-up of property, plant and equipment by $71,977 to their estimated fair value of $197,396. Excluding land, the property, plant and equipment amount is expected to be depreciated over an average period of 7 years. The fair value estimate of property, plant and equipment is preliminary. The fair value of land and buildings was determined using a value-in-use premise of value. The estimated cost to reproduce these assets and the value of recent market exchanges for similar assets were both used to determine an appropriate fair value. The fair value of personal property was determined using the indirect cost approach. In this method, inflation cost index trends were applied to the original costs of the assets to estimate current reproduction or replacement cost. Depreciation was then subtracted to calculate fair value. The indirect cost approach was used because it was believed to most accurately reflect all of the value attributable to an asset valued on an in-use premise, including the freight, engineering and installation costs. |
| (f) | Represents the increase in carrying value of patents by $1,353 to reflect their estimated fair value of $2,660 and the increase in carrying value of trademarks and other intangibles by $36,884 to reflect their estimated fair value of $54,300. The fair value estimates of patents, trademarks and other intangibles are |
49
Table of Contents
| preliminary and were determined using the relief from royalty method, which is a variation of the income approach. The relief from royalty method utilizes the present value of royalty streams to provide an estimate of the fair value of the asset. Patents are expected to be amortized over a period of approximately 7 years and trademarks and other intangibles are expected to be amortized over a period of approximately 13 years. |
| (g) | Represents the increase in carrying value of customer relationships by $97,321 to reflect their estimated fair value of $126,363. The fair value estimate of customer relationships is preliminary and was determined using the income approach. This approach evaluates the present worth of the future economic benefits that accrue to the investors in a business. The present value of expected future cash flows indicates the fair value of the asset. Customer relationships are expected to be amortized over a period of approximately 15 years. |
| (h) | Represents the recording of current and non-current deferred income tax liabilities of $1,377 and $73,882, respectively, resulting from fair value adjustments for inventories, property, plant and equipment and identifiable intangible assets of $3,868, $71,977 and $135,558, respectively. This estimate of deferred tax liabilities was determined based on the excess book basis over the tax basis of the fair value write-ups at a 35.6% weighted average statutory income tax rate taking into account applicable U.S. federal, U.S. state and non U.S. rates. This estimate of deferred income tax liabilities is preliminary and is subject to change based upon management’s final determination of the fair values of tangible and intangible assets acquired and liabilities assumed by jurisdiction. |
| (i) | Prior to the Business Combination, Jason’s historical goodwill totaled $34,198. As a result of the Business Combination, goodwill is calculated as the difference between the fair value of the consideration expected to be transferred and the values assigned to the identifiable tangible and intangible assets acquired and liabilities assumed. The acquisition of Jason by Quinpario as of March 31, 2014 would have resulted in a net increase in goodwill of $142,015 to $176,213. |
| (j) | Represents the elimination of Jason’s historic common stock, additional paid-in capital, accumulated other comprehensive income, retained earnings and accretion of preferred stock dividends and redemption premium. |
| (k) | Represents the reclassification of the cash equivalents in the Quinpario investments held in trust account to cash and cash equivalents to reflect the fact that these investments are available for use in connection with the Business Combination. |
| (l) | The total net purchase price to be paid to Seller’s shareholders has been reduced by $35,780 representing the expected value of the amount to be reinvested by the Rollover Participants. Pursuant to the Purchase Agreement, the Rollover Participants will exchange certain of their existing shares of Seller for Quinpario Sub Shares and will receive the option to exchange all or a portion of their Quinpario Sub Shares into the same number of shares of the Company’s common stock. As a result, Rollover Participants have a 18.2% ownership interest in Quinpario Sub (and thereby Jason). Therefore, a non-controlling interest has been recorded at its estimated fair value. |
| (m) | Represents the issuance of $420,000 of new debt, reduced by the amount of original issue debt discount of $8,150. The new debt is comprised of a seven year $310,000 first lien term loan and an eight year $110,000 second lien term loan. The first lien term loan is to be repaid in the amount of $775 each quarter; therefore, $3,100 of this loan is classified as current portion of long-term debt. The full amount of the second lien term loan is due on the eighth anniversary of the loan. The proceeds from the new debt will be used to retire debt of $244,400 and accrued interest of $2,908 outstanding under Jason’s existing U.S. senior credit facility and to finance a portion of the Purchase Price. Jason’s existing non U.S. debt of $12,958 will remain outstanding. In connection with the incurrence of the new debt, $12,450 of debt issuance costs are expected to be capitalized and amortized over the life of the underlying issuances. |
| (n) | Represents the extinguishment of amounts outstanding under Jason’s existing U.S. senior credit facility, including the short-term and long-term portion of term loans of $2,350 and $242,050, respectively, and accrued interest of $2,908. Capitalized debt issuance costs and debt discount of $3,524 and $408, respectively, will be written off resulting in a reduction to Jason’s historical net assets. These costs are not included in the pro forma statement of operations as they are directly related to the Business Combination and will be non-recurring. |
| (o) | Represents the issuance of 45,000 shares of Series A Convertible Preferred Stock in the amount of $45,000, reduced by issuance costs of $2,500. Each share of Series A Convertible Preferred Stock is |
50
Table of Contents
| convertible into shares of Jason Industries common stock. The unaudited pro forma condensed combined balance sheet does not assume conversion of the Series A Convertible Preferred Stock. If the Series A Convertible Preferred Stock were to be converted into shares of Jason Industries common stock, the impact on the unaudited pro forma condensed combined balance sheet as of March 31, 2014 would be as follows: |
| Line Item |
Currently Reported |
As Adjusted for the Conversion |
||||||
| Convertible perpetual preferred stock |
$ | 42,500 | $ | 0 | ||||
| Common stock |
$ | 2 | $ | 2 | ||||
| Additional paid-in capital |
$ | 136,449 | $ | 178,949 | ||||
| (p) | To record estimated acquisition-related transaction costs of $6,120. In accordance with ASC 805, acquisition-related transaction costs and certain acquisition restructuring and related charges are not included as a component of consideration transferred but are required to be expensed as incurred. The unaudited pro forma condensed combined balance sheet reflects these costs as a reduction of cash with a corresponding decrease in retained earnings. These costs are not included in the pro forma statement of operations as they are directly related to the Business Combination and will be non-recurring. |
| (q) | To record the payment of the deferred underwriters’ fee arising in connection with Quinpario’s initial public offering in the amount of $5,175. This transaction is reflected as a reduction in cash and accrued liabilities. |
| (r) | At March 31, 2014, certain of Quinpario’s common shares were subject to a possible redemption and, as such, an amount of $164,161 was classified outside the equity section in Quinpario’s historical balance sheet. Following consummation of the Business Combination, the shares are no longer redeemable and have been classified as a component of shareholders’ equity. |
| (s) | To record the impact of redemption of 2,542,667 shares by Quinpario shareholders reducing the remaining cash balance on hand following the Business Combination. |
| (t) | To record the impact of redemption of 4,406,227 warrants by Quinpario warrant holders reducing the remaining cash balance on hand following the completion of the warrant tender offer. |
4. Unaudited Pro Forma Condensed Combined Statements of Operations Adjustments
| (a) | Represents the elimination of Jason’s historic depreciation expense, a portion of which was recorded in cost of goods sold and a portion in selling and administrative expenses. |
| (b) | To record pro forma depreciation expense on the portion of the purchase price allocated to property, plant and equipment. Depreciation expense associated with assets used in Jason’s manufacturing operations is recorded in cost of goods sold while depreciation expense associated with assets used in selling, general and administrative activities is recorded in selling and administrative expenses. A summary of the estimated depreciation expense for the year ended December 31, 2013 of $26,847 is set forth in the table below. Depreciation expense for the three months ended March 31, 2014 is estimated to be $6,712. |
| Preliminary Fair Value |
Estimated Useful Life in Years |
Estimated Annual Depreciation |
||||||||||
| Land |
$ | 9,220 | n/a | $ | — | |||||||
| Buildings |
29,450 | 20.0 | 1,473 | |||||||||
| Improvements |
5,640 | 5.0 | 1,128 | |||||||||
| Machinery and Equipment |
117,069 | 8.2 | 14,276 | |||||||||
| Furniture and Fixtures |
5,632 | 5.0 | 1,126 | |||||||||
| Tooling |
12,687 | 3.0 | 4,229 | |||||||||
| Vehicles |
1,238 | 3.0 | 413 | |||||||||
| Computers and Software |
6,390 | 2.0 | 3,195 | |||||||||
| Construction in Progress |
10,070 | 10.0 | 1,007 | |||||||||
|
|
|
|
|
|||||||||
| $ | 197,396 | $ | 26,847 | |||||||||
|
|
|
|
|
|||||||||
| (c) | Represents the elimination of Jason’s historic amortization expense. |
51
Table of Contents
| (d) | To record pro forma amortization expense on the portion of the purchase price allocated to identifiable intangible assets. A summary of the estimated amortization expense for the year ended December 31, 2013 of $13,085 is set forth in the table below. Amortization expense for the three months ended March 31, 2014 is estimated to be $3,271: |
| Preliminary Fair Value |
Estimated Useful Life in Years |
Estimated Annual Amortization |
||||||||||
| Customer Relationships |
$ | 126,363 | 14.8 | $ | 8,541 | |||||||
| Patents |
2,660 | 7.0 | 380 | |||||||||
| Trademarks and Other |
54,300 | 13.0 | 4,164 | |||||||||
|
|
|
|
|
|||||||||
| $ | 183,323 | $ | 13,085 | |||||||||
|
|
|
|
|
|||||||||
| (e) | Represents the elimination of Jason’s historic interest expense associated with the U.S. senior credit facility term loans that will be extinguished in connection with the issuance of new debt as described in note 3n. |
| (f) | To record interest expense of $7,473 and $29,893 for the three months ended March 31, 2014 and for the year ended December 31, 2013, respectively, from the issuance of $420,000 of new debt. Interest expense includes $445 and $1,779 of debt issuance cost amortization for the three months ended March 31, 2014 and for the year ended December 31, 2013, respectively, and $291 and $1,165 of debt discount amortization for the three months ended March 31, 2014 and for the year ended December 31, 2013, respectively. The interest rates under the new financing agreements are expected to be based on LIBOR, with a minimum LIBOR amount (i.e. floor) of 1.00%. First lien term loans totaling $310,000 will carry a margin of 4.50% and second lien term loans totaling $110,000 will carry a margin of 8.00%. Therefore, the total interest rate on the first lien term loans is estimated to be 5.50% and the interest rate on the second lien term loans is estimated to be 9.00%. For the purposes of these unaudited pro forma condensed combined financial statements, the LIBOR floor of 1.00% has been assumed in view of the fact that applicable LIBOR rates are currently less than 1.00%. If the LIBOR interest rate on the first and second lien term loans were to increase by 0.125%, the pro forma interest expense would increase by $525. |
| (g) | Represents the elimination of transaction costs directly related to the Business Combination that were incurred by Quinpario and Jason of $1,655 and $1,577, respectively. These costs are being excluded from the pro forma statement of operations as they are directly related to the Business Combination and will be non-recurring. |
| (h) | Represents the income tax effect of the pro forma adjustments related to the acquisition of Jason calculated using the U.S. statutory income tax rate of 35.0%, U.S. state tax rates, and non U.S. tax rates. The effective tax rate of the combined company could be significantly different depending on the mix of post-acquisition income and other activities. The effective tax rate used to calculate the income tax effect of the purchase accounting adjustments of 35.6% differs from the effective income tax rate of 38.3% used to calculate the income tax effect of the refinancing adjustments due to the mix of U.S. and non U.S. tax jurisdictions impacted by such adjustments. |
| (i) | Reflects the non-controlling interest share of historical net income and related pro forma adjustments. |
5. Earnings per Share
| (a) | The unaudited pro forma condensed combined basic and diluted earnings per share calculations are based on the historic Quinpario weighted average number of shares outstanding of 8,267,875 and 7,526,526 for the three months ended March 31, 2014 and the year ended December 31, 2013, respectively, adjusted by 16,265,458 and 17,006,807 shares, respectively, to increase the weighted average share amount to 24,533,333 at both March 31, 2014 and December 31, 2013, representing the total number of shares outstanding as of those dates inclusive of the shares that would no longer be subject to possible redemption, reduced by 2,542,667 shares redeemed in connection with the Business Combination. Following completion of the warrant tender offer, Quinpario currently has 13,993,773 redeemable common stock purchase warrants as well as Series A Convertible Preferred Stock outstanding. Because the warrants are exercisable and the Series A Convertible Preferred Stock are convertible at per share amounts exceeding the current |
52
Table of Contents
| market price of Quinpario shares and the approximate per share redemption price of $10.26, the warrants and Series A Convertible Preferred Stock are considered antidilutive and any shares that would be issued upon exercise of the warrants or conversion of the Series A Convertible Preferred Stock are not included in the earnings per share calculations. |
| (b) | Pursuant to the Purchase Agreement, the Rollover Participants exchanged certain of their existing membership interests of Seller valued at $35,780 for shares of Jason of equal value, which were contributed to Quinpario Sub in exchange for 3,485,623 shares of Quinpario Sub with the option to exchange all or a portion of Quinpario Sub into the same number of shares of Jason Industries common stock. The pro forma diluted weighted average shares do not give effect to an assumed conversion through the exchange of Quinpario Sub Shares into shares of Jason Industries common stock because the resulting effect would be antidilutive. |
| (c) | Represents the accretion of dividends on the Series A Convertible Preferred Stock at a dividend rate of 8%. |
| (d) | The unaudited pro forma condensed combined basic and diluted earnings per share calculations do not assume conversion of the Series A Convertible Preferred Stock. If the Series A Convertible Preferred Stock were to be converted into shares of the Company’s common stock, the impact on the unaudited pro forma condensed combined basic and diluted earnings per share calculations for the quarterly period ended March 31, 2014 and the fiscal year ended December 31, 2013 would be as follows: |
For the quarterly period ended March 31, 2014:
| Line Item |
Currently Reported | As Adjusted for the Conversion |
||||||
| Accretion of preferred stock dividends and redemption premium |
$ | (900 | ) | $ | 0 | |||
| Net income (loss) attributable to common shareholders of controlling interest |
$ | 69 | $ | 969 | ||||
| Earnings (loss) per share available to common shareholders of controlling interest—basic |
$ | 0.01 | $ | 0.04 | ||||
| Earnings (loss) per share available to common shareholders of controlling interest—diluted |
$ | 0.01 | $ | 0.04 | ||||
| Weighted average shares outstanding—basic |
21,990,666 | 25,643,766 | ||||||
| Weighted average shares outstanding—diluted |
21,990,666 | 25,643,766 | ||||||
For the fiscal year ended December 31, 2013:
| Line Item |
Currently Reported | As Adjusted for the Conversion |
||||||
| Accretion of preferred stock dividends and redemption premium |
$ | (3,600 | ) | $ | 0 | |||
| Net income (loss) attributable to common shareholders of controlling interest |
$ | 3,324 | $ | 6,924 | ||||
| Earnings (loss) per share available to common shareholders of controlling interest—basic |
$ | 0.15 | $ | 0.27 | ||||
| Earnings (loss) per share available to common shareholders of controlling interest—diluted |
$ | 0.15 | $ | 0.27 | ||||
| Weighted average shares outstanding—basic |
21,990,666 | 25,643,766 | ||||||
| Weighted average shares outstanding—diluted |
21,990,666 | 25,643,766 | ||||||
53
Table of Contents
Corporate History
We were originally incorporated in Delaware on May 31, 2013 as a blank check company under the name Quinpario Acquisition Corp. (“QPAC”) for the purpose of effecting a merger, capital stock exchange, asset acquisition, stock purchase, reorganization or similar business combination involving QPAC and one or more businesses.
On August 14, 2013, we consummated our IPO of 17,250,000 units (including 2,250,000 units sold pursuant to the underwriters’ exercise in full of their over-allotment option) at $10.00 per unit, generating gross proceeds of $172,500,000, with each unit consisting of one share of our Common Stock and one Warrant to purchase one share of our Common Stock at an exercise price of $12.00 per share. Prior to the consummation of our IPO, in May 2013, Quinpario Partners I LLC, our sponsor (the “Sponsor”), purchased 6,208,333 shares of Common Stock, which are referred to herein as “founder shares,” for an aggregate purchase price of $25,000, or approximately $0.004 per share, 75,000 of which were forfeited at the closing of our Business Combination since no extension units were required to be purchased. Subsequently, on July 24, 2013, our Sponsor transferred an aggregate of 269,000 of these founder shares to James P. Heffernan, Walter Thomas Jagodinski, Edgar G. Hotard, Dr. John Rutledge and Ilan Kaufthal, our independent directors, as well as 200,000 founder shares to employees of Quinpario Partners LLC, an affiliate of our Sponsor. The Sponsor’s investment and voting decisions are determined by Quinpario Partners LLC, as its managing manager. Jeffry N. Quinn, our Chairman of the Board, is the managing member of Quinpario Partners LLC.
Simultaneously with the consummation of our IPO, we consummated the private sale of 1,150,000 placement units, each consisting of one share of Common Stock and one Warrant to purchase one share of Common Stock with an exercise price of $12.00, to our Sponsor at a price of $10.00 per unit, generating gross proceeds of $11,500,000. After the payment of approximately $545,939 in expenses relating to our IPO (other than underwriting commissions), approximately $177,075,000 of the net proceeds of our IPO and the private placement of the units (or approximately $10.26 per unit sold in our IPO) was placed in a trust account with Continental Stock Transfer & Trust Company as trustee.
From the consummation of our IPO until March 16, 2014, we were searching for a suitable target business to effect a business combination. On March 16, 2014, we entered into the Purchase Agreement that provided for the acquisition of all of the capital stock of Jason Partners Holdings Inc., the indirect parent company of Jason Incorporated, by JPHI. On June 30, 2014, we held a special meeting of stockholders in lieu of an annual meeting, at which our stockholders approved the Purchase Agreement and Business Combination, among other things. On the same date, we closed the Business Combination, whereby Jason Incorporated became our indirect majority-owned subsidiary and our only significant asset, with the Company indirectly owning approximately 81.8% of Jason Incorporated and the Rollover Participants indirectly owning approximately 18.2% of Jason Incorporated.
Upon the closing of the Business Combination, we changed our name from “Quinpario Acquisition Corp.” to “Jason Industries, Inc.” Jason Partners Holdings Inc. is considered our accounting predecessor and hence the historical financial statements for the three years ended December 31, 2013 and the interim period ended March 31, 2014 are included elsewhere in this registration statement. The historical financial statements of Quinpario Acquisition Corp. (a development stage company) for the year ended December 31, 2013 (audited) and the interim period ended March 31, 2014 (unaudited) are not included in this registration statement, but were included in the definitive proxy statement of Quinpario Acquisition Corp. filed with the Securities and Exchange Commission on June 16, 2014.
Jason Incorporated History
The formation of Jason Incorporated’s platform began in 1985 when Vincent Martin and Mark Train completed the management buyout of three businesses, collectively generating $71.6 million of revenue from AMCA International, a manufacturing conglomerate that served a variety of industries. The acquired businesses
54
Table of Contents
consisted of (i) Osborn Manufacturing, the largest manufacturer of industrial brushes in the United States; (ii) Janesville Products, the largest manufacturer of automotive acoustical fiber insulation in the United States; and (iii) Jackson Buff, the largest manufacturer of industrial buffs in the United States, each of which has a history spanning decades.
In 1987, Jason Incorporated completed an initial public offering and listed its common equity on Nasdaq. In 1993, we launched our Components business with the acquisition of the Koller Group, and we entered the Seating business in 1995 with the acquisition of Milsco Manufacturing. In 2000, Jason Incorporated was acquired by Saw Mill Capital LLC and management in a going private transaction. In 2009, along with most other global manufacturing companies, we experienced a significant decline in revenues and profitability as a result of the global recession. As a result of this decline, we were re-capitalized in 2010, at which time affiliates of Falcon Investment Advisors, LLC and Hamilton Lane Advisors joined as investors.
Our Business
Jason is a global industrial manufacturing company operating in the following industry sectors: agricultural, construction and industrial manufacturing. We operate in these sectors through four businesses: finishing, seating, acoustics and components. Jason was founded in 1985 and today provides critical components and manufacturing solutions to customers across a wide range of end markets, industries and geographies through a global network of 33 manufacturing facilities and 16 sales offices, warehouses and joint venture facilities throughout the United States and 14 foreign countries. Jason is led by a corporate and business management team with an average of 25 years of experience and has embedded relationships with long standing customers, superior scale and resources and industry leading capability to design and manufacture specialized products on which our customers rely.
Jason’s goal is to focus on markets with sustainable growth characteristics and where we believe we are, or have the opportunity to become, the industry leader. Jason’s finishing business focuses on the production of industrial brushes, buffing wheels and buffing compounds that are used in a broad range of industrial and infrastructure applications. Jason’s seating business supplies seating solutions to equipment manufacturers in the motorcycle, lawn and turf care, industrial, agricultural, construction and power sports end markets and is the sole supplier of original equipment manufacturer (“OEM”) seating to a major US-based manufacturer of heavyweight motorcycles. The acoustics business manufactures engineered non-woven, fiber-based acoustical products for the North American auto industry. The components business is a diversified manufacturer of stamped, formed, expanded and perforated metal components and subassemblies for rail and filtration applications, outdoor power equipment, small gas engines and smart utility meters.
Jason employs approximately 4,000 employees and manufactures products in 33 locations around the world. For the three months ended March 28, 2014 and year ended December 31, 2013, we generated net sales of $186.5 million and $680.8 million, respectively, income from operations of $11.8 million and $53.7 million, respectively, and adjusted EBITDA of $22.1 million and $79.8 million, respectively. For an explanation of adjusted EBITDA see “Management’s Discussion and Analysis of Financial Condition and Results of Operations,” below.
Our Philosophy
Jason is strategically organized and aligned through the Jason Business System (“JBS”). JBS is a continuous improvement business philosophy that provides a consistent and effective strategic deployment process for executing growth, operational and performance initiatives across its organization. The key tenets of this strategy include driving revenue growth, improving productivity, maximizing capital efficiency and enhancing profitability in order to maximize cash flow. Over the past eight years, Jason’s management team has developed and institutionalized JBS throughout its organization and has hired experienced business leaders at all levels with a goal of optimizing the deployment of its strategic initiatives.
55
Table of Contents
Business Segments
Jason’s global industrial platform encompasses a diverse group of industries, geographies and end markets. Through its four businesses, we deliver an array of industrial consumables and critical manufactured components to a number of industries, including industrial equipment, motorcycles, outdoor lawn and power equipment, rail, automotive and smart meters. The highly fragmented nature of Jason’s end markets creates unique growth opportunities given our established global footprint and leading share position. Jason’s businesses serve multiple industries, which we believe, based on our market research, together represent a global market of more than $20.0 billion and can be categorized under four businesses: finishing, seating, acoustics and components.
Finishing
Market/Industry Overview
Within the overall market for finishing products, we estimate that the addressable North American and global (including North America) markets for our primary product offerings are approximately $510 million and $1.2 billion per year, respectively. In addition to our primary markets, which comprise approximately 95% of our finishing revenue, we offer abrasives products to a number of key customers. The abrasives market has been deemed to be strategically important to Jason and is a targeted growth market. We estimate that the global market size increases to $7.0 billion when abrasives products are included. The market for finishing products is highly fragmented with most participants having single or limited product lines and serving specific geographic markets. While the finishing business competes with numerous domestic and international companies across numerous product lines, we do not believe that any one competitor directly competes with us on all of our product lines. We believe we are the only market participant that reaches all regions of the world. End users of finishing products are broadly diversified across many sectors of the economy. We believe that resurgence in demand from the manufacturing, industrial and energy markets is driving demand for finishing products. In the long-term, the finishing market is closely tied to overall growth in industrial production, which we believe has fundamental and significant long-term growth potential.
The finishing market is also characterized by the need for sophisticated manufacturing equipment, the ability to produce a broad number of niche products and the flexibility in manufacturing operations to adapt to ever-changing customer demands and schedules. Jason believes entry into markets by competitors with lower labor costs, including foreign competitors, will be limited because labor is a relatively small portion of total manufacturing costs. The cost of labor, manufacturing, shipping and logistics is dramatically rising in countries such as China and customers continue to have increasing demand for shorter lead times and lower inventory and carrying costs.
Key Products
Through the finishing business, which represented 26% of Jason’s 2013 revenue, Jason produces and supplies industrial brushes, buffing wheels and buffing compounds. Jason established the finishing business, which is headquartered in Burgwald, Germany, in 1985 by acquiring the business of Osborn, which has been in operation since 1889. Our products are used in a variety of applications with no single customer or industry accounting for a significant portion of business revenue. Jason has strategic facilities located globally, including labor-intensive production sites in low-cost locations such as Brazil, China, Portugal, Romania, Mexico and Taiwan.
The finishing business is a one-stop provider of over 10,000 standard and 100,000 customized brush, buffing wheel and buffing compound products used across multiple industries, including aerospace, engineering, plastic, finishing, building, leisure, steel, hardware, welding and naval, among others. For some of the product lines, such as snow protect brushes and brushes for the power generation market, Jason is the only provider in the industry. Jason’s broad product suite is composed of brush types used for a variety of applications, including power, maintenance, strip, punch, and roller brushes. These products are marketed under leading brand names
56
Table of Contents
that include Osborn®, Sealeze®, Sinjet® and Dendix®. Our buff products are sold under the Jackson®, Lea®, JacksonLea®, Langsol® and Unipol® brands and are comprised of industrial buffs and abrasives used primarily to finish parts requiring a high degree of luster and/or a satin or textured surface. In addition to manufacturing buffs, Jason also produces the industry’s broadest product line of buffing compounds available in liquid or bar form that are customized to specific end use requirements. Jason also services customers with a wide variety of products complementing its brush and polishing lines, including Sinjet® honing and brushing machines, highly-specialized coated and non-woven abrasives tools and loadrunners.
Jason has representatives who reach more than 30,000 customers in approximately 100 countries worldwide. During 2013, Jason derived approximately 46% of finishing sales from North America and the majority of the remaining revenue from Europe and South America. We service our diverse customer base through U.S. facilities in Ohio, Indiana, California and Virginia and 13 foreign countries, including joint ventures in China and Taiwan. Our manufacturing and service locations allow us to work on a regional and local basis with customers to develop custom products and provide significant technical support, resulting in strong relationships with top customers that average 24 years. In addition, Jason invested approximately $1.0 million in 2011 to build identical state-of-the-art laboratories in Richmond, Indiana and Burgwald, Germany to provide further technical design capabilities for its North American and European customers.
Seating
Market/Industry Overview
Within the overall market for seating products, we estimate that the addressable North American and global (including North America) markets for our current product offerings are approximately $450 million and $1.2 billion per year, respectively. Jason estimates that the global market size increases to $2.5 billion when bus, rail and other transportation industry seating is included. Jason’s seating segment does not currently serve the bus, rail and other transportation industries, which provides opportunity for future growth. Jason’s product line includes motorcycle seats; operator seats for the construction, agriculture, lawn and garden and other industrial equipment markets; and seating for the power sports market. The market for seating products is dominated by several large domestic and international participants, who are often awarded contracts as the sole supplier for a particular motorcycle, lawn mower or other construction, agriculture or material handling platform. Jason believes that competition is based mostly on innovative styling, manufacturing flexibility, quality, prices and delivery.
Motorcycle production has experienced a rebound since the recession, and Jason believes growth in the global motorcycle market to remain strong in the coming years. Demand for power lawn and garden equipment is primarily dependent on weather and trends in personal consumption expenditures, recreational and leisure activities, and residential and commercial real estate construction and sales. The market for lawn and garden equipment has rebounded since the recent global recession and we expect it to mirror general economic conditions. Jason expects to experience demand growth for tractor, backhoe and forklift truck operator seats, as global construction activity continues to improve.
Key Products
Through the seating business, which represented 24% of Jason’s 2013 revenue, Jason provides seating solutions for a variety of applications, including motorcycle, agricultural, construction, industrial, lawn and turf care, and power sports. Jason established the seating business in 1995 through the acquisition of Milsco, which has provided high-quality seats since 1934. The seating business operates under the Milsco brand, which was originally established as a harness maker in 1924 and, early in its history, gained notice as the first company to put padded seating on tractors and farm equipment.
Headquartered in Milwaukee, Wisconsin, the seating business offers a distinct vertically integrated operating model, which includes a full range of functions, such as research and development, design and engineering, manufacturing of components and final assembly. Through our broad manufacturing capabilities and high quality products, we have established longstanding relationships with top customers, which average 31 years.
57
Table of Contents
Acoustics
Market/Industry Overview
Within the overall market for automotive acoustical products, Jason estimates that the addressable North American and global (including North America) markets for current product offerings are approximately $1.9 billion per year and $10.0 billion per year, respectively. The market for automotive acoustical products is dominated by several large domestic and international participants. These participants are often awarded contracts as the sole supplier for a particular automotive platform. Competition includes manufacturers of mechanically bonded non-woven products, resin-bonded products and urethane foam. Competition is based on innovative styling, price, acoustical performance and weight. Engineering, design and innovation are key distinguishing factors because acoustical products represent a small percentage of the total cost to manufacture an automobile.
Growth in the automotive acoustics market is driven by increasing demand for enhanced acoustics and improved noise, vibration and harshness characteristics within the automotive market. As overall vehicle quality has improved, consumers have increasingly equated quality with the acoustic performance of a vehicle. As a result, car manufacturers have recently expended significant capital for sophisticated acoustical testing systems and laboratories. In addition, an increasing regulatory focus on reducing vehicle mass, increasing fuel-efficiency and stringent End of Vehicle Life recycling standards have driven the penetration of non-woven materials that are lighter than other acoustical products. The replacement of interior products previously served by plastic-based materials has created a trend in new vehicle designs to substitute structured non-woven acoustical products with vehicle manufacturers, which has helped to expand non-woven acoustical content per vehicle.
Key Products
Through the acoustics business, which represented 30% of Jason’s 2013 revenue, Jason manufactures engineered non-woven, fiber-based acoustical products to the automotive industry. Jason established the acoustics business in 1985 through the acquisition of Janesville Products, which has developed extensive design and manufacturing expertise over its 138 year history that allows it to provide custom acoustical solutions for each vehicle platform it serves. We market our products as lighter, improving acoustical performance, enhancing aesthetics, and easier to install than other acoustical products manufactured by our competitors. As a result, our products are used in approximately 70% of light vehicles manufactured in North America today, including 13 of 2013’s top 15 models.
Headquartered in Southfield, Michigan, the acoustics business believes we offer the broadest product line of value-added, higher margin components used in a wide range of vehicles, including automobiles, sport utility vehicles and light trucks (collectively, “light vehicles”), as well as in the industrial and transportation markets. Jason has focused on developing premier lightweight fiber-based solutions that provide competitive or superior acoustical properties. Our production of non-woven fiber-based products is organized by the form in which it is supplied: (i) die cut, (ii) molded, (iii) rolls and blanks, and (iv) other non-woven products.
The acoustics business operates principally as an automotive OEM and Tier-1 supplier. Recently, Jason has focused on increasing sales directly to automotive OEMs, which allows us to integrate our technology and value-added capabilities within OEM organizations. These efforts have shifted sales to a more desirable balance between OEMs and Tier-1 suppliers while also broadening the number of vehicle platforms that utilize Jason’s products. Additionally, over the past three years, Jason has increased the content per vehicle on a CAGR of approximately 13%. Substantially all automotive products are sole sourced by customers for a particular vehicle and are used for the life of the platform.
Components
Market/Industry Overview
Within the overall market for component products, Jason estimates that the addressable North American and global (including North America) markets for current product offerings are approximately $800 million per year
58
Table of Contents
and $2.0 billion per year, respectively. The market for component products is highly fragmented with most participants having single or limited product lines, serving specific geographic markets or providing niche capabilities applicable to a limited customer base. While there are numerous competitors with limited product offerings, there are only a few national and international competitors of a size comparable to Jason. While Jason competes with certain domestic and international competitors across a portion of product lines, we believe that no one competitor directly competes with us across all product lines. End users of component products are broadly diversified across many sectors of the economy.
Demand in the components market is influenced by the broader industrial manufacturing market, which Jason believes has fundamental and significant long-term growth potential, as well as trends in the perforated and expanded metal, smart meter, rail and outdoor power equipment industries. The best gauge of domestic industrial production is the U.S. Industrial Production Index, which measures the monthly level of output arising from the manufacturing, mining and gas and electric utility sectors.
In addition to industrial production, demand for new freight cars is expected to be an important growth driver. The rail industry is expected to experience significant growth as the current fleet reaches the end of its useful life and replacement freight cars are needed. Currently, based on Jason’s market analysis, over 45% of U.S. railcars have been in service for more than 25 years and the average useful life of these railcars is generally considered to be 30 years.
Key Products
Through the components business, which represented 20% of Jason’s 2013 revenue, Jason manufactures a broad range of stamped, formed, expanded and perforated metal components and subassemblies. Jason is a provider of components that are used in a broad array of products, including small gas engines, smart meters, outdoor equipment, hardware, railcars and off-road equipment. The components business was originally acquired in 1993 through the purchase of the Koller Group, a producer of metal formed components such as stampings, subassemblies, wire forms and expanded metal products. Today, Jason operates through the Assembled Products, Metalex and Morton brands.
Within each of the components business product categories, Jason’s strategy is to have engineers work alongside customers to create value-added components and solutions for various end products. Our engineering resources, manufacturing capabilities and low cost production availability through our operations in China provide opportunities to deliver value to customers. These characteristics drive long-standing relationships with customers that average 21 years.
The most recent addition to the components business was Jason’s 2011 acquisition of Morton Manufacturing Company (“Morton”), a manufacturer of OEM and aftermarket anti-slip walking surfaces for railcars as well as other products for the agricultural, heavy equipment and general industrial end markets. This acquisition provided direct entry into the rail industry, which was a new market for Jason. We view this end market to be an opportunity for growth and operational and revenue synergies from the integration of Morton into our platform. As a result of continued new product development, a rebound in the small gas engine market and the expected growth of the North American rail industry, we expect steady demand for our products.
Competitive Strengths
Jason believes the following key characteristics provide a competitive advantage and position for future growth:
Established Industry Leader Across Four Businesses
Jason’s businesses have developed leading positions across various niche markets. For example, in our turf care seats, buffing wheels and buffing compounds and automotive acoustical insulation product lines, we believe we are more than twice the size of the next largest direct competitor. Jason’s market share positions have created
59
Table of Contents
a stable platform with strong profitability upon which to grow. Our products’ significant brand recognition helps to sustain our market share positions. Jason products are often viewed as the brand of choice for quality, dependability, value and continuous innovation. In several niche markets, Jason is the only provider of certain products or manufacturing capabilities. We have served many of our customers for over 25 years. Additionally, our significant market share within highly fragmented niche businesses offers potential attractive acquisition opportunities. Despite Jason’s leading positions in many of our markets, we face competitive challenges in others. In Jason’s finishing and components segments, we believe certain of our competitors are small and family-owned, operate with lower operating expenses, have lower profit expectations and/or supply lower cost commodity products, which allows such competitors to provide lower cost products and compete with us on pricing. In our seating segment, specifically with respect to highly technical seats for the agricultural and construction vehicle markets, the cost to customers of switching from a current supplier’s products to ours is high, and we believe certain of our competitors have established long-term and entrenched relationships with such customers. Such costs and relationships make it challenging to convince such customers to purchase such products from us instead of from their existing supplier.
Superior Design & Manufacturing Solutions
Jason has a proven track record of providing customers with innovative, customized solutions through production flexibility and collaboration with their design and manufacturing teams. Jason has consistently refined manufacturing processes to incorporate design technologies that improve design capabilities, breadth of product offering, product quality and manufacturing efficiency.
Across Jason’s businesses, we maintain teams of designers and a diverse product selection in numerous geographic regions, which allows us to respond quickly to real-time customer needs. Our versatile design and manufacturing capabilities enable us to deliver differentiated and highly-customized solutions for customers by leveraging experienced engineering staff and technologically advanced manufacturing equipment. We believe our diverse product offerings and customized design and manufacturing capabilities have made us a preferred choice within many industries and an entrenched key solutions provider to customers. Some of Jason’s competitors focus on commodity products and lower-value-added products that appeal to certain end users and markets.
We believe we have become a trusted thought partner at each stage in product development, which has deepened our relationships with an already entrenched customer base and driven revenue growth from existing accounts and new customers.
Scalable and Highly Effective Business Philosophy
We use JBS to link our businesses through a consistent strategy and focus and to deploy capital and resources across these businesses on strategies to improve three elements of our business: operational excellence, revenue growth and people. Through corporate strategic planning initiatives, we annually assess our three-year outlook and goals, which are codified using a policy deployment matrix and disseminated throughout the organization. Jason’s management utilizes the strategic plan and resulting policy deployment matrix to develop an annual budget and profit plan and monitor progress through the collaboration promoted by JBS.
In addition to enhancing performance, Jason believes JBS also enhances product innovation, efficiency, global accessibility and competitiveness. Shared best practices serve to continually improve the processes and products that Jason’s customers depend on by delivering customized, value-added solutions across the platform. This global reach offers customers a consistent and fully integrated manufacturing partner capable of serving their needs on a global, regional and local basis.
Proven Acquisition Platform
We believe we have a strong pipeline of acquisition opportunities. Since Jason Incorporated’s inception in 1985, we have successfully completed 38 acquisitions and integrated the acquired companies into our existing
60
Table of Contents
platform. Jason continually reviews potential acquisitions and we believe we have a well-established pipeline of opportunities to expand our market leading position and proven methodology to incorporate acquisitions into Jason. However, there is no certainty in the expectation of future acquisitions. Jason return expectations or purchase price expectations and integration risk may impact the ability to complete successful acquisitions.
By leveraging Jason’s established global footprint, manufacturing capabilities and sourcing expertise, we proved our ability to realize significant synergies from acquired businesses. Our management team is experienced in targeting, closing and successfully integrating meaningful acquisitions, as evidenced most recently in the October 2011 purchase of Morton. This acquisition added $46.8 million in annualized revenue and $8.9 million in annualized Adjusted EBITDA to Jason’s results in 2012. During 2012, we integrated Morton with our existing Metalex business to form Jason’s Metals conversion business. Jason expects this combination to produce $2.0 million in executable annualized synergies. Acquisitions are a core competency for Jason and have allowed it to continue to expand its global presence and product suite, benefit from increased economies of scale, grow revenue, enter new markets and improve profitability.
Diverse, Global Footprint with Growing Presence in Emerging Markets
Jason maintains 33 global manufacturing locations, consisting of 16 in the United States and 17 in foreign countries, giving each business a strong international presence. Approximately 28% of Jason’s 2013 revenue was generated from products manufactured outside of the United States. In addition, our global presence enables us to take advantage of low-cost manufacturing at our facilities in China, India, Romania, Brazil, Mexico, Portugal and other countries and to meet the needs of local customers with operations in those regions although we lack significant scale in Asian markets which we intend to strategically address in the coming years. Jason continues to build upon its established presence in low-cost production locations through the expansion of owned operations and the development of joint ventures and sourcing relationships in Asia, Europe and South America. Our management believes that this global footprint also provides channels of organic growth through the introduction of products into new markets. Our management frequently evaluates our manufacturing, warehouse, distribution and sales locations to identify revenue enhancement opportunities, optimize production costs and ensure proximity to key customers.
Experienced, Proven Management Team
Central to Jason’s platform is our senior management team, which will position us to (i) outperform the competition, (ii) execute numerous strategic initiatives, (iii) substantially grow revenue through the execution of a global organic growth plan, and (iv) identify, execute and integrate value-enhancing acquisitions. Jason’s Chief Executive Officer, David C. Westgate, and current management team have a tenured history in industrial manufacturing and have overseen several milestone initiatives, including the execution of several acquisitions. Jason’s management has brought discipline and entrepreneurship to Jason, which allows for strong, focused teamwork and innovation.
To effectively utilize the collective strengths of our platform, Jason created an Executive Committee consisting of Mr. Westgate, Stephen Cripe (Chief Financial Officer), Florestan von Boxberg (President of the finishing business), Srivas Prasad (President of the seating business) and David Cataldi (President of the acoustics and components businesses) to provide a forum for corporate leadership to identify opportunities to leverage Jason’s scale and develop corporate strategy. Each business president maintains close communication with the corporate office on matters of long-term and strategic importance. All functional areas within a business report directly to the relevant business president, with the finance function maintaining a regular dialogue with Mr. Cripe. Treasury, insurance, legal services, human resources, tax planning, business development and benefit plan administration are provided from the corporate office.
61
Table of Contents
Growth Strategies
Jason is focused on delivering sustained profitable growth through a number of avenues. Our growth initiatives are developed based on strategic plans conducted on an annual basis within each business. These plans are regularly reviewed and updated by our Executive Committee and business leadership. As a result, we have a uniform strategy that focuses all of our resources on the following key initiatives:
Further Geographic Expansion and Penetration
Through Jason’s established global footprint, we look to further penetrate key customers and end markets. Since approximately one-third of our total 2013 revenue was derived from foreign manufacturing, our management believes significant opportunity exists for the continued penetration of target international markets. Jason has identified several emerging markets throughout South America and Asia as strong opportunities for new customer growth. Jason finishing has led Jason’s growth into attractive, untapped markets and spearheaded the development of 17 manufacturing facilities throughout 11 countries and 2 joint venture operations in Asia.
The successful global expansion into new markets and continued penetration of existing markets by the finishing business have paved the way for Jason’s other businesses to capitalize on international growth opportunities. The seating business, for example, has leveraged the finishing business’s customer base to expand our presence in India by taking advantage of finishing’s supply chain, human resources, sales force and facility capacity to quickly and economically expand production with limited new capital expenditures. Since entering India, the seating business has been awarded the seating supply relationship for a major US-based manufacturer of heavyweight motorcycles and has been awarded the prototype development program for the skid-steer program of a major US-based manufacturer of construction equipment. Jason anticipates getting a production supply contract with respect to such program in the third quarter of 2014. Currently, Jason is in negotiations with several other leading equipment manufacturers to supply seats for their Indian operations.
Disciplined, Proven Acquisition Strategy
Since inception, Jason Incorporated has successfully acquired and integrated 38 businesses. Management’s opinion is that this extensive history of acquisitions gives Jason a deep competency that can be leveraged for further acquisitions that drive our position in the markets we serve. Due to the diverse target markets and highly fragmented competition, our leading market positions make us the most natural and often the only potential acquirer. We believe that we can execute acquisitions and integrate them in an optimal manner. Although our focus in recent years has been on executing add-on acquisitions, we believe our acquisition integration expertise creates a tremendous opportunity for the addition of new product portfolios, which could significantly upsize the revenue growth potential and resultant earnings potential of our business.
Margin Growth
We are focused on continuous improvement in our profit margins through the development of higher-margin products, continued operational improvements and by leveraging our existing platform to grow revenue in each market. Jason’s gross profit margins have improved from 21.7% in 2011 to 22.5% in 2013 and our adjusted EBITDA margins have improved from 9.7% in 2011 to 11.7% in 2013 as a result of volume recovery across our businesses following the recession, operational restructuring initiatives and the relocation of manufacturing facilities to strategically located, lower cost regions.
We anticipate our strategy of shifting toward innovative higher-value engineered products will continue to improve our pricing, power and profitability. Jason’s scalable operating platform will allow us to grow revenue in each market with limited fixed operating costs and capital investment. We believe that as our volumes continue to increase from new markets, new customers and the continuing economic recovery, the operating leverage we have created through our platform will continue to have a positive impact on profitability. Among other initiatives, Jason is focused on redesigning products to reduce materials costs, continuing to relocate labor-intensive manufacturing processes to lower cost regions and reducing logistics costs, which have traditionally been a significant component of overall costs and an important consideration when choosing its strategic manufacturing locations.
62
Table of Contents
Market Share Gains
While our four businesses pursue growth within new and existing markets through customized strategies targeted for the markets we serve, all businesses are tasked with identifying and pursuing key growth opportunities through new products, end markets, geographies and sales channels. Management believes we have the potential to significantly increase market share due to the highly fragmented nature of our end markets. Each business has identified specific opportunities to expand market share, with associated incremental revenue targets.
Product Innovation
Management believes that Jason’s strategy of developing innovative products will position us for continued growth. Working in collaboration with key customers, the design and manufacture of customized products that deliver value will support this growth. We believe that developing new products will allow us to deepen our value-added relationships with customers, open new opportunities for revenue generation, improve pricing power and enhance profitability. Jason has a focused and dedicated strategy for continuous innovation, which is supported by sophisticated manufacturing capabilities and engineering expertise. This continued focus on innovation has driven many successful new product introductions, which Jason believes will enable continued growth.
Customers
Jason has an entrenched base of blue chip customers that are leaders in their respective markets. Jason’s customer relationships often span decades in each business. Additionally, our customer base is diversified. In our finishing segment, no customer accounts for more than 10% of the revenues of such segment. In each of our seating, acoustics and components segments, only two customers, three customers and one customer, respectively, account for more than 10% of the revenues of such segment. Across all of Jason, no customer accounts for more than 10% of the revenues of Jason, with the largest customer accounting for only 7% of 2013 revenues. Jason’s next four largest customers represent a combined 21% of 2013 revenues.
Suppliers and Raw Materials
Polyurethane foam, vinyl, plastics, steel, polyester fiber, bicomponent fiber and machined fiber are the primary raw materials that we use to manufacture our products. There are a limited number of domestic and foreign suppliers of these raw materials. Jason generally orders supplies on a purchase order basis. Although our contracts and long term arrangements with our customers generally do not expressly allow us to pass through increases in our raw materials, energy costs and other inputs to our customers, we endeavor to discuss price adjustments with our customers on a case by case basis where it makes business sense. For the year ended December 31, 2013, the spend with the top 3 suppliers accounted for less than 10% of total material spend and no single supplier accounted for greater than 3% of total spend. Jason makes an ongoing effort to reduce and contain raw material costs. We do not engage in raw material commodity hedging contracts. Jason attempts to reflect raw material price changes in the sale price of our products.
63
Table of Contents
Properties
Our corporate headquarters are located at 411 E. Wisconsin Avenue, Suite 2100, Milwaukee, Wisconsin with approximately 8,600 square feet of office space that it leases, the term of which expires on June 30, 2016. Our executive offices are located at this facility, along with our treasury, insurance, in-house legal services, human resources, tax planning, business development and benefit plan administration personnel. Jason has entered into a lease for approximately 9,000 square feet of office space in an office building that is going to be built near its current corporate headquarters. Construction of such building began in June 2014 and is expected to be substantially completed by the spring of 2016, with our lease to commence on July 1, 2016. As of March 28, 2014, Jason owned or leased the following additional facilities:
Finishing:
| Facility Location |
Product / Use |
Approximate Size (square feet) |
Owned / Leased | |||||
| North America |
||||||||
| Brooklyn Heights, OH |
Office | 14,000 | Leased | |||||
| Hamilton, OH |
Manufacturing | 50,000 | Leased | |||||
| Richmond, IN |
Manufacturing | 120,000 | Leased | |||||
| North Chesterfield, VA |
Manufacturing | 44,600 | Owned | |||||
| Santa Fe Springs, CA |
Warehouse | 31,800 | Leased | |||||
| Nogales, Mexico |
Manufacturing | 44,000 | Leased | |||||
| Tlalnepantla, Mexico |
Manufacturing | 57,750 | Leased | |||||
| Europe |
||||||||
| Guimarães, Portugal |
Manufacturing | 30,000 | Owned | |||||
| Burgwald, Germany |
HQ/Manufacturing | 108,000 | Owned | |||||
| Chepstow, UK |
Sales/Distribution | 72,000 | Leased | |||||
| Garges Lés Gonesse, France |
Sales Office | 2,800 | Leased | |||||
| Gura Humorului, Romania |
Manufacturing | 52,500 | Owned | |||||
| Haan, Germany |
Manufacturing | 36,000 | Leased | |||||
| Huskvarna, Sweden |
Manufacturing | 35,000 | Leased | |||||
| Valencia, Spain |
Manufacturing | 20,000 | Leased | |||||
| South America |
||||||||
| Sao Paulo, Brazil |
Manufacturing | 30,000 | Leased | |||||
| Asia |
||||||||
| Aurangabad, India |
Manufacturing | 21,000 | Leased | |||||
| Beijing, China |
Sales Office | 500 | Leased | |||||
| Jiangmen, China |
Manufacturing | 35,000 | JV-Owned | |||||
| Shanghai, China |
Manufacturing | 35,500 | JV-Leased | |||||
| Taipei, Taiwan |
Manufacturing | 11,130 | JV-Leased | |||||
| Singapore, Singapore |
Sales/Distribution | 7,000 | Leased | |||||
64
Table of Contents
Seating:
| Facility Location |
Product / Use |
Approximate Size (square feet) |
Owned / Leased | |||||
| North America |
||||||||
| Milwaukee, WI |
Headquarters/Sales office | 154,800 | Owned | |||||
| Dothan, AL |
Warehouse | 32,500 | Leased | |||||
| Jackson, MI |
Manufacturing | 194,000 | Leased | |||||
| Jackson, MI |
Warehouse | 61,000 | Leased | |||||
| Redgranite, WI |
Manufacturing | 104,000 | Leased | |||||
| Redgranite, WI |
Manufacturing | 56,000 | Leased | |||||
| Thomson, GA |
Manufacturing | 40,000 | Owned | |||||
| Merida, Mexico |
Manufacturing | 130,000 | Leased | |||||
| Europe |
||||||||
| Nuneaton, UK |
Manufacturing | 36,000 | Owned | |||||
| Limerick, Ireland |
Sales Office | 400 | Leased | |||||
Automotive Acoustics:
| Facility Location |
Product / Use |
Approximate Size (square feet) |
Owned / Leased | |||||
| North America |
||||||||
| Milan, OH |
R&D/Warehouse/Office | 41,000 | Leased | |||||
| Norwalk, OH |
Manufacturing | 135,800 | Leased | |||||
| Old Fort, NC |
Manufacturing | 105,100 | Leased | |||||
| Battle Creek, MI |
Manufacturing | 308,730 | Leased | |||||
| Southfield, MI |
HQ/Sales Office | 7,500 | Leased | |||||
| Columbus, MS |
Manufacturing | 65,000 | Owned | |||||
| Columbus, MS |
Warehouse | 20,000 | Leased | |||||
| Warrensburg, MO |
Manufacturing | 195,000 | Leased | |||||
| Uruapan, Mexico |
Manufacturing | 132,000 | Leased | |||||
| Uruapan, Mexico |
Warehouse | 43,056 | Leased | |||||
| Celaya, Mexico |
Manufacturing | 87,500 | Leased | |||||
| Europe |
||||||||
| Sulzbach-Rosenberg, Germany |
Manufacturing | 161,400 | Owned | |||||
Components:
| Facility Location |
Product / Use |
Approximate Size (square feet) |
Owned / Leased | |||||
| North America |
||||||||
| Addison, IL |
Idle (sub-leased) | 87,000 | Leased | |||||
| Addison, IL |
Manufacturing | 33,000 | Leased | |||||
| Buffalo Grove, IL |
Manufacturing | 86,000 | Leased | |||||
| Libertyville, IL |
Manufacturing | 150,000 | Leased | |||||
| Libertyville, IL |
Manufacturing | 171,425 | Owned | |||||
| Asia |
||||||||
| Shanghai, China |
Manufacturing | 40,000 | Leased | |||||
Corporate:
| Facility Location |
Product / Use |
Approximate Size (square feet) |
Owned / Leased | |||||
| North America |
||||||||
| Milwaukee, WI |
Corporate Office | 8,600 | Leased | |||||
65
Table of Contents
Seasonality
We experience seasonality of demand for our products, which is limited to the seating business. Due to our experience in this market, we have adapted our business operations to manage this seasonality.
The business also depends upon general economic conditions and other market factors beyond our control, and Jason serves customers in cyclical industries. As a result, Jason’s operating results could be negatively affected during economic downturns. See further information within “Risk Factors—Risks Relating to Our Business.”
Employees
As of December 31, 2013, Jason had approximately 4,000 employees. Approximately 19% of the acoustics segment’s hourly employees, 53% of the seating segment’s hourly employees, and 39% of the components segment’s hourly employees are unionized. Contracts are negotiated on a local basis, significantly mitigating the risk of a company-wide or segment level work stoppage. Additionally, approximately 800 of Jason’s employees reside in Europe, where trade union membership is common. We believe we have a strong relationship with our employees, including those represented by labor unions.
Environmental Matters
Jason’s operations and facilities are subject to extensive federal, state, local and foreign laws and regulations related to pollution and the protection of the environment, health and safety and natural resources, including those governing, among other things, emissions to air, discharges to water, the use, generation, handling, storage, treatment and disposal of hazardous substances and wastes and other materials and the remediation of contaminated sites. The operation of manufacturing plants entails risks in these areas, and a failure by Jason to comply with applicable environmental laws and regulations, or to obtain and comply with the permits required for its operations, could result in civil or criminal fines, penalties, enforcement actions, third party claims for property damage and personal injury, requirements to clean up property or to pay for the capital or operating costs of cleanup, or regulatory or judicial orders enjoining or curtailing operations or requiring corrective measures, including the installation of pollution control equipment or remedial actions. Moreover, if applicable environmental, health and safety laws and regulations, or the interpretation or enforcement thereof, become more stringent in the future, Jason could incur capital or operating costs beyond those currently anticipated.
Compliance with environmental laws has not historically had a material adverse effect on Jason’s capital expenditures, earnings or competitive position, and Jason anticipates that such compliance will not have a material effect on its business or financial condition in the future.
Legal Proceedings
Jason is currently not a party to any legal proceedings that would be expected to have a material adverse effect on its business or financial condition. From time to time, Jason is subject to litigation incidental to its business, as well as other litigation of a non-material nature in the ordinary course of business. Jason believes that the outcome of any existing litigation, either individually or in the aggregate, will not have a material adverse effect on its business or financial condition.
66
Table of Contents
MANAGEMENT’S DISCUSSION AND ANALYSIS OF FINANCIAL CONDITION AND RESULTS OF OPERATIONS
The following discussion and analysis of financial condition and results of operations of Jason should be read in conjunction with “Selected Consolidated Historical Financial Information” and the audited financial statements and related notes appearing elsewhere in this prospectus. Jason’s actual results may not be indicative of future performance. This discussion and analysis contains forward-looking statements and involves numerous risks and uncertainties, including, but not limited to, those discussed in “Cautionary Note Regarding Forward-Looking Statements” and “Risk Factors.” Actual results may differ materially from those contained in any forward-looking statements.
This Management’s Discussion and Analysis of Financial Condition and Results of Operations contains certain financial measures, in particular the presentation of EBITDA and Adjusted EBITDA, which are not presented in accordance with GAAP. These non-GAAP financial measures are being presented because they provide readers of this prospectus with additional insight into Jason’s operational performance relative to earlier periods and relative to its competitors. EBITDA and Adjusted EBITDA are key measures used by Jason to evaluate its performance. Jason does not intend for these non-GAAP financial measures to be a substitute for any GAAP financial information. Readers of this prospectus should use these non-GAAP financial measures only in conjunction with the comparable GAAP financial measures. Reconciliations of EBITDA and Adjusted EBITDA to net income, the most comparable GAAP measure, are provided in this Management’s Discussion and Analysis of Financial Condition and Results of Operations.
Jason’s year ends on December 31. Throughout the year, Jason reports its results using a fiscal calendar whereby each three month quarterly reporting period is approximately thirteen weeks in length and ends on a Friday. The exceptions are the first quarter, which begins on January 1, and the fourth quarter, which ends on December 31. For 2013, Jason’s fiscal quarters are comprised of the three months ended March 29, June 28, September 27 and December 31. In 2014, Jason’s first quarter is comprised of the three months ended March 28.
Overview
Jason is a global industrial manufacturing company with leading market share positions across each of its four industry-leading segments: finishing, seating, acoustics and components. Jason was founded in 1985 and today provides critical components and manufacturing solutions to customers across a wide range of end markets, industries and geographies through its global network of 33 manufacturing facilities and 16 sales offices, warehouses and joint venture facilities throughout the United States and 14 foreign countries.
Jason focuses on markets with sustainable growth characteristics and where it is, or has the opportunity to become, the industry leader. Jason’s finishing segment focuses on the production of industrial brushes, buffing wheels and buffing compounds that are used in a broad range of industrial and infrastructure applications. Jason’s seating segment supplies seating solutions to equipment manufacturers in the motorcycle, lawn and turf care, industrial, agricultural, construction and power sports end markets. The acoustics segment manufactures engineered non-woven, fiber-based acoustical products for the automotive industry. The components segment is a diversified manufacturer of stamped, formed, expanded and perforated metal components and subassemblies for rail and filtration applications, outdoor power equipment, small gas engines and smart utility meters.
During both the year ended December 31, 2013 and the three months ended March 28, 2014, approximately 28% of Jason’s sales were derived from customers outside the United States. As a diversified, global business, Jason’s operations are affected by worldwide, regional and industry-specific economic and political factors. Jason’s geographic and industry diversity, as well as the wide range of its products helps mitigate the impact of industry or economic fluctuations. Given the broad range of products manufactured and industries and geographies served, management does not use any indices other than general economic trends to predict the overall outlook for the Company. Jason’s individual businesses monitor key competitors and customers, including to the extent possible their sales, to gauge relative performance and the outlook for the future.
67
Table of Contents
General Market Conditions and Trends; Business Performance and Outlook
While differences exist among its businesses, on an overall basis, demand for most of the Company’s products increased in the first quarter of 2014 when compared with the same period in 2013 and also increased for the full year 2013 when compared to 2012 resulting in sales growth from existing businesses.
Demand in Jason’s finishing segment is largely dependent upon overall industrial production levels in the markets it serves. Jason management believes that gross domestic product (“GDP”) and industrial production levels in such markets will continue to grow modestly in the near term. However, if there is no growth, or if GDP or production levels do not increase or shrink, reduced demand for the finishing segment’s products could have a material negative impact on the finishing segment’s net sales and/or income from continuing operations.
The seating segment is principally impacted by demand from U.S. based original equipment manufacturers serving the motorcycle, lawn and turf care, construction, agricultural and power sports market segments. In recent years, motorcycle and power sports production and the lawn and turf care equipment market have rebounded from recent declines, and global construction activity has improved. Jason management believes that, in the near term, the motorcycle, power sports and construction equipment industries will continue to show strength, while the lawn and turf care industries will experience normal seasonal demand, and the agricultural equipment industry will soften. However, if such industries weaken (or, in the case of agricultural equipment, soften more than anticipated), reduced demand for the seating segment’s products could have a material negative impact on the seating segment’s net sales and/or income from continuing operations.
Demand for products manufactured by Jason’s acoustics segment is primarily influenced by production levels in the North American automobile industry. Jason management believes that the North American automotive industry production, which has greatly increased over the last two years, will level off but show continued moderate strength in the near term and that the trend of increasing demand for enhanced vehicle acoustical performance using lighter weight recyclable materials will continue. However, if such industry weakens or such trend dissipates, reduced demand for the acoustics segment’s products could have a material negative impact on the acoustics segment’s net sales and/or income from continuing operations.
Sales levels for the components segment are dependent upon new railcar, small gas engine and smart utility production levels in the U.S., as well as general U.S. industrial production levels. In recent years, the rail industry has experienced strong growth in the wake of a need to upgrade an aging fleet. Jason management believes that in the near term the North American rail industry will continue to be strong and grow significantly, the small gas engine market will have normal seasonal demand, the demand for smart meter assemblies for the electric utility industry will remain at current levels and U.S. GDP and industrial production will grow modestly. However, if the North American rail industry is flat or declines, demand for such small gas engines or smart meter assemblies is weaker than anticipated and/or U.S. GDP is flat or shrinks, reduced demand for the components segment’s products could have a material negative impact on the components segment’s net sales and/or income from continuing operations.
In addition to the trends discussed above, the Company’s continued investments in sales growth initiatives and the other business-specific factors discussed below contributed to year-over-year sales and profit growth. Geographically, year-over-year sales growth during 2013 occurred in the United States and higher-growth markets such as Mexico, Brazil and Asia. Western Europe did grow slightly in the latter part of 2013 on a year-over-year basis, but sales were down on a full year basis. Jason expects overall market conditions to remain challenging due to macro-economic uncertainties and monetary and fiscal policies of countries where we do business. While individual businesses and end markets continue to experience volatility, Jason expects to benefit as general economic conditions in North America and Western Europe are expected to experience modest growth. Regarding economic conditions, as discussed above, we expect the following in the near term:
| • | modest global GDP growth; |
| • | continued strength in key sectors such as the North American automotive, motorcycle, rail and construction industries; |
68
Table of Contents
| • | lower demand in the agricultural equipment industry; |
| • | normal seasonal demand in the turf care and small gas engine markets; and |
| • | flat demand for smart meter assemblies for the electric utility industry. |
Strategic Initiatives
Continued footprint rationalization—Jason serves its customers through a global network of manufacturing facilities, sales offices, warehouses and joint venture facilities throughout the United States and 14 foreign countries. Jason’s geographic footprint has evolved over time with a focus on maximizing geographic coverage while optimizing costs. Over the past several years, Jason has closed several facilities in higher cost, mature markets and replaced them with facilities in higher growth, lower cost regions such as Mexico, India and Singapore. The Company believes that geographic proximity to existing and potential customers provides logistical efficiencies as well as important strategic and cost advantages and has also taken steps to realign its footprint within the United States During 2013, Jason began the discontinuation of manufacturing operations at its acoustics segment facility in Norwalk, Ohio and will complete the closure in 2014 as production is shifted to existing acoustics segment facilities in Michigan and Mississippi and a new facility in the Kansas City, Missouri area that will open in 2014, for the primary purpose of manufacturing acoustical components for a nearby automotive assembly plant. The Company anticipates that costs associated with rationalization activities as well as the capital required for any new facilities will be funded by cash generated from operating activities.
Expanding into new geographical regions—Jason believes that significant opportunity for growth exists in regions that are not currently served by its existing businesses and has identified several target markets throughout South America and Asia that it expects will provide best opportunities for new customer growth. As developing markets continue to grow and mature, Jason would expect to see a trend toward increases in the cost of labor, manufacturing, shipping and logistics; therefore, it is important that it establish a local presence to cost effectively serve those markets. Historically, the Company has approached its entry into new geographic markets by establishing low cost sales offices and warehousing operations which are then expanded to include manufacturing activities once a certain business level is achieved. This approach was used when Jason entered new markets in Mexico, Brazil and Singapore. As business segments expand into regions where other Jason businesses currently operate, our strategy is to utilize a “campus” approach where the business segment entering the market can leverage existing supply chains, human resources, sales personnel and facility capacity to quickly and economically expand production with limited new capital expenditures.
Acquisitions—Jason leverages acquisitions to continually drive its position in the markets it serves. Since its inception, Jason Incorporated has successfully acquired and integrated 38 businesses. Jason has a well-defined, disciplined acquisition and post acquisition integration process and maintains a strong pipeline of acquisition opportunities. Due to the diverse target markets and highly fragmented competition, Jason’s leading market positions make it the logical potential acquirer for many of its competitors. Although its focus in recent years has been on executing add-on acquisitions, Jason believes its acquisition integration expertise creates a potential opportunity for the addition of new product portfolios, which would significantly increase its revenue and earnings growth opportunities. Jason intends to only pursue an acquisition if it is accretive to EBITDA (earnings before interest, income taxes, depreciation and amortization) margins and does not result in a significant increase in the ratio of its total debt to EBITDA. Upon the successful completion of the Business Combination, the Company will benefit from a structure that will provide the necessary capital for acquisition growth and it fully intends to continue to aggressively pursue its acquisition strategy in the upcoming year.
Margin Expansion—Jason is focused on creating operational effectiveness at each of its business segments through deployment of lean principles and implementation of continuous operational improvement initiatives. While many of these activities have focused on implementing shop floor improvements we have also targeted our selling and administrative functions in order to reduce the cost of serving our customers. Additionally, during the past three years, Jason’s research and development activities have placed more focus on developing new products
69
Table of Contents
that are of higher value to our customers, thereby providing customers with a better value proposition. Jason believes that developing new and innovative products will allow it to deepen its value-added relationships with customers, open new opportunities for revenue generation, enhance pricing power and improve margins. This strategy has been particularly effective in Jason’s acoustics segment where new fiber based products have been developed to capitalize on industry trends requiring quieter automobiles and products that meet end of vehicle life recycling standards and lower weight. We would expect to continue the trend of increased spending on product development in the coming year.
Factors that Affect Operating Results
Jason’s results of operations and financial performance are influenced by a number of factors, including the timing of new product introductions, general economic conditions and customer buying behavior. Jason’s business is complex, with multiple segments serving a broad range of industries world-wide. Jason has manufacturing and sales facilities around the world, and it operates in numerous regulatory and governmental environments. Comparability of future results could be impacted by any number of unforeseen issues.
Key Events
In addition to the factors described above, the following strategic and operational events, which occurred during the years ended December 31, 2013, 2012 and 2011, affected Jason’s results of operations:
The Morton acquisition. Results of acquisitions, including the October 13, 2011 acquisition of Morton Manufacturing Company (“Morton”) are included in Jason’s financial statements as of the date of acquisition. The hourly union employees of Morton were covered under a union-sponsored and trusteed multiemployer plan which required Jason to contribute a negotiated amount per hour worked. In connection with Jason’s withdrawal from the plan in 2012, it recorded a multiemployer pension plan withdrawal expense of $3.4 million which is presented as a separate line item in the accompanying consolidated statements of operations for the year ended December 31, 2012. The 2012 expense represented Jason’s best estimate of the present value of the withdrawal obligation. During 2013, the plan administrator provided Jason with the actual amount of the obligation which resulted in a $0.7 million reduction to the obligation that Jason recorded in 2012. Jason’s consolidated net sales for the years ended December 31, 2013, 2012 and 2011 include net sales of $34.1 million, $46.8 million and $10.4 million, respectively, relating to Morton. Morton is the leading manufacturer of slip-resistant walking surfaces for railcars, both for original equipment manufacturers (“OEM’s”) and aftermarket repair customers. Morton also supplies OEM’s and aftermarket customers in the agricultural, heavy equipment and general industrial space. The net sales decline in 2013 was a direct result of a change in the mix of the railcars produced by OEM’s. Morton has higher product content on covered hopper cars and during 2013 OEM’s produced fewer covered hopper cars in favor of tank cars which contain less of Morton’s product. The acquisition of Morton and other acquisitions impact the comparability of Jason’s financial results across periods. One of Jason’s key business strategies is to grow through acquisitions, and as such, it is likely that future comparability will continue to be impacted by acquisitions.
Newcomerstown Fire costs, net of recoveries. On November 27, 2011, Jason experienced a fire at its acoustics segment facility located in Newcomerstown, Ohio (the “Newcomerstown Fire”). The facility was comprised of approximately 93,000 square feet in one leased building with an additional 38,000 square foot expansion in process and employed 103 employees prior to the accident. The fire destroyed the entire leased facility and its contents. The fire created a business interruption as it affected production and shipments at the facility, operational costs, and business results. During the period after the fire, Jason worked closely with its insurance carriers to determine the amounts and timing of payment of insurance proceeds recoverable under its property and business interruption coverage. Although Jason expected to ultimately recover a majority of these charges and impairments under its insurance coverage, pursuant to GAAP, Jason recorded expenses associated with property, business interruption and deductibles, net of estimated recoveries. Jason recorded net losses of $2.9 million and $4.7 million during 2011 and 2012, respectively, and a net gain of $7.6 million was recorded in 2013 representing the recovery of costs incurred in 2011 and 2012 related to material and labor inefficiencies,
70
Table of Contents
outsourcing, facility start-up costs and professional fees. A gain of $4.9 million was also recorded in 2013 representing compensation received for lost margins caused by the fire. Jason also recorded gains of $6.1 million and $6.4 million during 2012 and 2013, respectively, from involuntary conversion of property, plant and equipment and a gain during 2013 associated with lost margins from business interruption caused by the fire. In September 2013, Jason settled its claims with insurance carriers for a total amount of $61.9 million and received the final settlement payment in October 2013 which enabled Jason to reflect the final accounting for the fire in the 2013 financial statements. The financial and operational impact from the fire affects comparability of Jason’s financial results across periods.
During 2013, Jason opened a new facility in Battle Creek, Michigan as a replacement to the Newcomerstown, Ohio location and was able to reach pre-fire production levels at this location during the third quarter of 2013. Jason did not experience significant losses of customer business or any long-term negative implications to its acoustics segment as a result of the fire.
The 2013 refinancing transactions. On February 28, 2013, Jason entered into a $260.0 million credit agreement with a syndicate of lenders. The new agreement includes a six-year, $225.0 million senior secured term loan and a five-year, $35.0 million revolving loan facility. The credit agreement was amended on November 14, 2013 to, among other things, increase the term loan by $10.0 million. The proceeds from the February 2013 borrowings, along with $14.2 million of existing cash, were used to retire borrowings outstanding under Jason’s previous U.S. credit agreement in the amount of $178.5 million, pay accrued interest of $0.9 million, pay related transaction fees and other expenses of $10.0 million and pay a dividend to its equityholders and redeem preferred stock in the aggregate amount of $49.8 million. The proceeds from the November 2013 borrowings, along with $23.4 million of existing cash, were used to pay related transaction fees and other expenses of $3.5 million and pay a dividend to equityholders and redeem preferred stock in the aggregate amount of $29.9 million. During June 2013, Jason used existing cash to pay a dividend to its equityholders and redeem preferred stock in the aggregate amount of $11.8 million. Upon completion of these transactions, Jason no longer had any preferred stock outstanding (the “2013 Refinancing Transactions”). In view of the changes to its capital structure, as well as the transaction costs and fees incurred and changes in interest rates resulting from the 2013 Refinancing Transactions, Jason’s interest expense, income before income taxes and net income for 2013 will not be comparable with prior periods.
Key Financial Definitions
Net sales. Net sales reflect Jason’s sales of its products net of allowances for returns and discounts. Several factors affect net sales in any period, including general economic conditions, weather conditions, the timing of acquisitions and the purchasing habits of its customers.
Cost of goods sold. Cost of goods sold includes all costs of manufacturing the products Jason sells. Such costs include direct and indirect materials, direct and indirect labor costs, including fringe benefits, supplies, utilities, depreciation, facility rent, insurance, pension benefits and other manufacturing related costs. The largest component of cost of goods sold is the cost of materials, which typically represents approximately 50% of net sales. Fluctuations in cost of goods sold are caused primarily by changes in sales levels, changes in the mix of products sold, and changes in the cost of raw materials. In addition, following acquisitions, cost of goods sold will be impacted by step-ups in the value of inventories required in connection with the accounting for acquired businesses.
Selling and administrative expenses. Selling and administrative expenses primarily include the cost associated with Jason’s sales and marketing, finance and administration, engineering and technical services functions. Certain corporate level administrative expenses such as payroll and benefits, incentive compensation, travel, marketing, accounting, auditing and legal fees and certain other expenses are kept within its corporate results and not allocated to its business segments.
71
Table of Contents
As a result of the Purchase Agreement, Jason will become a public company and its securities will be listed on a public exchange. Consequently, Jason will need to comply with laws, regulations, and requirements that it did not need to comply with as a private company, including certain provisions of the Sarbanes-Oxley Act and related SEC regulations, as well as the listing requirements. Compliance with the requirements of being a public company will require Jason to increase operating expenses in order to pay employees, legal counsel, and accountants to assist Jason in, among other things, external reporting, instituting and monitoring a more comprehensive compliance and board governance function, establishing and maintaining internal control over financial reporting in accordance with Section 404 of the Sarbanes-Oxley Act, and preparing and distributing periodic public reports in compliance with its obligations under the federal securities laws. In addition, being a public company will make it more expensive for Jason to obtain director and officer liability insurance. Jason also expects to incur stock based compensation expense in order to incent key employees. Jason estimates that incremental annual public company costs will be between $2.5 million and $3.5 million.
Newcomerstown fire loss (gain), net. Refer to discussion under “Newcomerstown Fire costs, net of recoveries” above.
Impairment of long-lived assets. As required by GAAP, when certain conditions or events occur, Jason recognizes impairment losses to reduce the carrying value of goodwill, other intangible assets and property, plant and equipment to their estimated fair values. During the years ended December 31, 2012 and 2011, Jason recognized impairment losses with respect to idle manufacturing facilities located in Kolding, Denmark, Milwaukee, Wisconsin and Cleveland, Ohio.
Loss (gain) on disposals of fixed assets—net. In the ordinary course of business, Jason disposes of fixed assets that are no longer required in its day to day operations with the intent of generating cash from those sales.
Restructuring. In the past several years, Jason has made changes to its worldwide manufacturing footprint to reduce its fixed cost base. These actions have resulted in employee severance and other related charges, changes in its operating cost structure, movement of manufacturing operations and product lines between facilities, exit costs for consolidation and closure of plant facilities, employee relocation and lease termination costs, and impairment charges. It is likely that Jason will incur such costs in future periods as well. These operational changes and restructuring costs affect comparability between periods and segments.
Interest expense. Interest expense consists of interest paid to Jason’s lenders under its worldwide credit facilities and amortization of deferred financing costs.
Equity income. Jason maintains non-controlling interests in Asian joint ventures that are part of its finishing segment and it records a proportional share in the earnings of these joint ventures as required by GAAP. The amount of equity income recorded is dependent upon the underlying financial results of the joint ventures. During the three months ended March 28, 2014, Jason completed the sale of its equity interests in two of its joint ventures. As a result of the sale, equity income is expected to decrease in the future.
Gain from involuntary conversion of equipment. In connection with the Newcomerstown Fire, Jason has made capital expenditures for the years ended December 31, 2013, 2012 and 2011 to replace machinery, equipment and other assets destroyed in the fire. Under its insurance policies, Jason is entitled to receive cash equal to the replacement value of the assets destroyed in the fire. Because the replacement values are higher than the book values of the assets destroyed, a gain is recorded in accordance with GAAP at the time cash is received.
Other income. Other income is principally comprised of royalty income received from non-U.S. licensees, rental income from subleasing activities and public subsidies received in certain foreign locations.
Tax provision. Jason’s tax provision is impacted by a number of factors, including the amount of taxable earnings derived in foreign jurisdictions with tax rates that are different than U.S. federal statutory rate, state tax rates in the jurisdictions where Jason does business, tax minimization planning and its ability to utilize various tax
72
Table of Contents
credits and net operating loss carryforwards. Income tax expense also includes the impact of provision to return adjustments, changes in valuation allowances and changes in reserve requirements for unrecognized tax benefits.
Gain from sale of joint ventures. During the three months ended March 28, 2014, Jason completed the sale of its 50% equity interests in two Asian joint ventures for a total of $11.5 million and recorded a gain from sale of $3.5 million.
Accretion of preferred stock dividends and redemption premium. Jason records accretion of preferred stock dividends to reflect cumulative, undeclared dividends on its redeemable preferred stock. This recognition increases the preferred stock carrying value to its liquidation value through a charge to retained earnings, or in the absence of retained earnings, a charge to additional contributed capital. The accretion amounts are subtracted from net income to arrive at the net income available to common shareholders for the purposes of calculating Jason’s net income per share available to common shareholders. In addition, a redemption premium was recorded as a charge to retained earnings during the year ended December 31, 2013 as per the terms of the preferred shares.
General Factors Affecting the Results of Continuing Operations
Foreign exchange. Jason has a significant portion of its operations outside of the U.S. As such, the results of Jason’s operations are based on currencies other than the U.S. dollar. Changes in foreign currency exchange rates influence its financial results, and therefore the ability to compare results between periods and segments.
Seasonality. Jason’s seating segment is subject to seasonal variation due to the markets it serves and the stocking requirements of its customers. For Jason, the peak season has historically been during the period from November through May. Sales during these months are typically greater due to the shipments required to fill the inventory at retail stores and customer warehouses. There are, however, variations in the seasonal demands from year to year depending on weather, customer inventory levels, and model year changes. This seasonality and annual variations of this seasonality could impact the ability to compare results between time periods.
Consolidated Results of Operations for the Three Months Ended March 29, 2013 and March 28, 2014
| Three Months Ended | ||||||||||||||||
| March 29, 2013 |
Increase/(Decrease) | March 28, 2014 |
||||||||||||||
| (in millions, except percentages) | $ | % | ||||||||||||||
| Net sales |
$ | 179.7 | $ | 6.8 | 3.8 | % | $ | 186.5 | ||||||||
| Cost of goods sold |
139.3 | 5.2 | 3.8 | % | 144.5 | |||||||||||
|
|
|
|
|
|
|
|
|
|||||||||
| Gross profit |
40.4 | 1.6 | 4.0 | % | 42.0 | |||||||||||
| Selling and administrative expenses |
27.0 | 2.5 | 9.2 | % | 29.5 | |||||||||||
| Newcomerstown fire loss, net |
1.7 | (1.7 | ) | * | — | |||||||||||
| Loss (gain) on disposals of fixed assets—net |
— | 0.1 | * | 0.1 | ||||||||||||
| Restructuring |
0.1 | 0.5 | * | 0.6 | ||||||||||||
|
|
|
|
|
|
|
|
|
|||||||||
| Operating income |
11.6 | 0.2 | 1.5 | % | 11.8 | |||||||||||
| Interest expense |
(9.8 | ) | 6.3 | (64.3 | )% | (3.5 | ) | |||||||||
| Equity income |
0.2 | 0.1 | 40.0 | % | 0.3 | |||||||||||
| Gain from involuntary conversion of equipment |
1.9 | (1.9 | ) | * | — | |||||||||||
| Gain from sale of joint ventures |
— | 3.5 | * | 3.5 | ||||||||||||
| Other income (expense)—net |
0.1 | 0.0 | * | 0.1 | ||||||||||||
|
|
|
|
|
|
|
|
|
|||||||||
| Income before income taxes |
4.0 | 8.2 | 201.1 | % | 12.2 | |||||||||||
| Tax provision |
1.4 | 3.1 | 216.3 | % | 4.5 | |||||||||||
|
|
|
|
|
|
|
|
|
|||||||||
| Net income |
$ | 2.6 | $ | 5.1 | 192.9 | % | $ | 7.7 | ||||||||
|
|
|
|
|
|
|
|
|
|||||||||
| Other financial data:(1) |
||||||||||||||||
| Adjusted EBITDA |
$ | 22.2 | $ | (0.1 | ) | (0.3 | )% | $ | 22.1 | |||||||
| Adjusted EBITDA % of net sales |
12.4 | % | 11.8 | % | ||||||||||||
73
Table of Contents
| * | Not Meaningful |
| (1) | Adjusted EBITDA and Adjusted EBITDA as a % of net sales are financial measures that are not presented in accordance with GAAP. See “—Key Measures Jason Uses to Evaluate Its Performance” for a reconciliation of Adjusted EBITDA to Net Income. |
Three Months Ended March 29, 2013 Compared to Three Months Ended March 28, 2014
Net sales. Net sales were $186.5 million for the three months ended March 28, 2014, an increase of $6.8 million, or 3.8%, compared to $179.7 million for the three months ended March 29, 2013, reflecting increased net sales in the acoustics segment of $4.6 million, increased net sales in the finishing segment of $1.5 million and increased net sales in the components segment of $1.3 million, partially offset by a decline in net sales in the seating segment of $0.6 million. Changes in foreign currency exchange rates compared to the U.S. dollar had a net positive impact of $0.2 million on finishing segment sales due principally to the weakening of the U.S. dollar against the Euro of approximately 3.7% compared to 2013. The impact of exchange rates on the other segments was not significant. Changes in sales levels throughout our segments are principally the result of changes in volume as net price changes were not significant.
The primary reason for the sales increase for the three months ended March 28, 2014 was the strong performance of Jason’s acoustics segment, which achieved a sales increase of $4.6 million due to an increase of approximately 4% in North American automotive industry unit production levels, as well as a full quarter of revenue on new platforms launched in the second half of 2013. Net sales in the finishing segment increased by $1.5 million during the first quarter of 2014 due to strong sales of power brush and buffing compound products from increased sales efforts and improving market conditions in Europe. These sales gains were partially offset by a decline in sales of edge-honing machines. Net sales in the components segment increased by $1.3 million due to higher sales to rail and smart meter customers, totaling $1.3 million and $1.6 million, respectively, partially offset by a $1.4 million decline in net sales of products to small gas engine manufacturers. Railcar production levels remained robust and returned to a more normal mix of covered hopper cars and tank cars during the first quarter of 2014 which had a favorable impact on sales and demand for smart meters increased in the first quarter of 2014 due to the timing of orders. The decline in sales to small gas engine customers was due primarily to an unusually severe winter in the United States in 2013/2014 that resulted in consumers delaying the purchase of products, such as turf care equipment, that contain small gas engines. The weather conditions were the primary factor contributing to the $0.6 million decline in seating segment sales as these conditions delayed consumer purchases of seasonal turf care equipment and motorcycles.
Cost of goods sold. Cost of goods sold was $144.5 million for the three months ended March 28, 2014, an increase of $5.2 million, or 3.8%, compared to $139.3 million for the three months ended March 29, 2013. This increase was primarily attributable to the impact of increased net sales and product mix on our raw material, labor, and overhead costs associated with the increase in net sales, restructuring costs incurred in connection with the closure of the acoustics segment facility in Norwalk, Ohio, and overhead costs associated with the new acoustics facility in Battle Creek, Michigan that opened in the summer of 2013.
Gross profit. Gross profit was $42.0 million for the three months ended March 28, 2014, an increase of $1.6 million, or 4.0%, compared to $40.4 million for the three months ended March 29, 2013. This increase was driven primarily by the increase in net sales. Gross profit as a percent of net sales remained constant at 22.5%. The benefits from leveraging fixed costs on higher overall sales levels along with a favorable mix of sales in the finishing and components segments and lower material costs in the components segment were offset by higher costs in the seating and acoustics segments. Extreme temperatures, heavy snowfalls and ice storms disrupted the flow of goods in the first quarter of 2014, causing unexpected freight costs and overtime expense to meet seating segment customer delivery requirements. Additionally, a seating segment supplier implemented a price increase causing material costs to increase. Gross profit for the quarter was also affected by incremental labor and overhead costs caused by inefficiencies associated with the acceleration of the planned closure of the acoustics segment facility in Norwalk, Ohio.
74
Table of Contents
Selling and administrative expenses. Selling and administrative expenses were $29.5 million for the three months ended March 28, 2014, an increase of $2.5 million, or 9.2%, compared to $27.0 million for the three months ended March 29, 2013. The increase was primarily attributable to increased compensation and benefits for additional employees and for research and development expenses in the acoustics and seating segments and increased compensation and benefits for additional employees in the corporate office; the impact of these items approximated $1.6 million. Selling and administrative expenses also increased $0.4 million in 2014 compared to 2013 due to higher professional fees and expenses, including $0.2 million incurred for activities associated with preparing Jason for becoming a public company upon the successful completion of the Business Combination. Selling and administrative expenses for 2013 include professional fees, expenses and special employee bonuses paid as a direct result of the 2013 Refinancing Transactions of $1.5 million and selling and administrative expenses for 2014 include professional fees and expenses of $1.6 million incurred as a direct result of the 2014 Business Combination.
Newcomerstown fire loss (gain), net. There was no Newcomerstown Fire loss or gain activity recorded for the three months ended March 28, 2014, compared to a $1.7 million loss for the three months ended March 29, 2013. The loss recorded in 2013 represented material and labor inefficiencies, outsourcing, facility start-up costs and professional fees, net of estimated insurance recoveries. The final insurance settlement payment associated with the Newcomerstown Fire was received in October of 2013, which allowed Jason to reflect the final accounting in 2013.
Loss (gain) on disposals of fixed assets—net. For the three months ended March 28, 2014, Jason recognized a net loss on disposals of fixed assets of $0.1 million. For the three months ended March 29, 2013 Jason recognized a small net loss on disposals of fixed assets. Changes in the level of fixed asset disposals are dependent upon a number of factors, including changes in the level of asset sales, operational restructuring activities, and capital expenditure levels.
Restructuring. Restructuring was $0.6 million for the three months ended March 28, 2014, an increase of $0.5 million, compared to $0.1 million for the three months ended March 29, 2013. The increase was primarily due to costs associated with the closure of the acoustics segment manufacturing facility in Norwalk, Ohio. During 2013, Jason began the discontinuation of manufacturing operations in Norwalk and will complete the closure in 2014 as production is shifted to existing acoustics segment facilities in Michigan and Mississippi and a new facility in the Kansas City, Missouri area that will open in 2014. The new facility is being established for the primary purpose of manufacturing acoustical components for a nearby automotive assembly plant.
Interest expense. Interest expense was $3.5 million for the three months ended March 28, 2014, a decrease of $6.3 million, or 64.3%, compared to $9.8 million for the three months ended March 29, 2013. In connection with the 2013 Refinancing Transactions, $1.4 million of deferred financing costs associated with Jason’s previous U.S. credit facility were written off and another $4.2 million of financing related costs were expensed. In 2014, interest expense has returned to normal levels.
Equity income. Equity income was $0.3 million for the three months ended March 28, 2014, an increase of $0.1 million, or 40.0%, compared to $0.2 million for the three months ended March 29, 2013. The income is primarily generated from Jason’s Asian joint ventures and such income did not change significantly in 2014 as compared to 2013. During the three months ended March 28, 2014, Jason completed the sale of its 50% equity interests in two of its joint ventures for a total of $11.5 million and recorded a gain on sale of $3.5 million. As a result of the sale of the joint ventures, equity income is expected to decrease in the future.
Gain from involuntary conversion of equipment. There was no gain from involuntary conversion of equipment recorded for the three months ended March 28, 2014, compared to the $1.9 million gain recorded for the three months ended March 29, 2013. During 2013, Jason received cash equal to the replacement value of assets destroyed in the Newcomerstown Fire. Because the replacement values are higher than the book values of the assets destroyed, Jason recorded gains, in accordance with GAAP, at the time the cash was received.
75
Table of Contents
Gain from sale of joint ventures. During the three months ended March 28, 2014, Jason completed the sale of its 50% equity interests in two Asian joint ventures for a total of $11.5 million and recorded a gain on sale of $3.5 million. Terms of the sale include a supply agreement which will allow Jason to purchase product at established prices over the three-year term of the agreement.
Other income (expense)—net. Other income was $0.1 million for the three months ended March 28, 2014, consistent with the amount of other income recorded for the three months ended March 29, 2013.
Income before income taxes. Income before income taxes was $12.2 million for the three months ended March 28, 2014, an increase of $8.2 million, or 201.1%, compared to $4.0 million for the three months ended March 29, 2013. The increase was primarily due to improved gross profit from higher net sales, a reduction of interest expense and the 2014 gain arising from the sale of two Asian joint ventures. The positive impact of these items was partially offset by higher selling and administrative expenses.
Tax provision. Tax provision was $4.5 million for the three months ended March 28, 2014, an increase of $3.1 million, or 216.3%, compared to $1.4 million for the three months ended March 29, 2013. The increase is primarily due to an increase in income before income taxes. The effective income tax rates were 36.7% and 35.0% for the three months ended March 28, 2014 and March 29, 2013, respectively. The lower effective income tax rate for the three months ended March 29, 2013 is primarily the result of the tax benefit recorded during that period to give effect to the retroactive extension of the U.S. research activities credit for tax year 2012. The effective income tax rate for the three months ended March 28, 2014 was higher than the U.S. statutory rate of 35% principally due to the impact of U.S. state income taxes partially offset by lower foreign income tax rates.
Net income. For the reasons described above, net income was $7.7 million for the three months ended March 28, 2014, an increase of $5.1 million, or 192.9%, compared to $2.6 million for the three months ended March 29, 2013.
Adjusted EBITDA. Adjusted EBITDA was $22.1 million or 11.8% of net sales for the three months ended March 28, 2014, a decrease of $0.1 million, or 0.3%, compared to $22.2 million, or 12.4% of net sales, for the three months ended March 29, 2013. The decrease was primarily due to those factors discussed above, including higher gross profit from increased sales, improved gross profit margins (after exclusion of restructuring costs), offset by higher selling and administrative costs.
76
Table of Contents
Consolidated Results of Operations for the Years Ended December 31, 2011, 2012 and 2013
| Year Ended December 31, | ||||||||||||||||||||||||||||
| 2011 | Increase/(Decrease) | 2012 | Increase/(Decrease) | 2013 | ||||||||||||||||||||||||
| $ | % | $ | % | |||||||||||||||||||||||||
| (in millions, except percentages) | ||||||||||||||||||||||||||||
| Net sales |
$ | 600.6 | $ | 54.4 | 9.1 | % | $ | 655.0 | $ | 25.8 | 3.9 | % | $ | 680.8 | ||||||||||||||
| Cost of goods sold |
470.0 | 45.1 | 9.6 | % | 515.1 | 12.2 | 2.4 | % | 527.3 | |||||||||||||||||||
|
|
|
|
|
|
|
|
|
|
|
|
|
|
|
|||||||||||||||
| Gross profit |
130.6 | 9.3 | 7.1 | % | 139.9 | 13.6 | 9.7 | % | 153.5 | |||||||||||||||||||
| Selling and administrative expenses |
96.3 | 2.9 | 2.9 | % | 99.2 | 10.8 | 10.9 | % | 110.0 | |||||||||||||||||||
| Newcomerstown fire loss (gain), net |
2.9 | 1.8 | 60.7 | % | 4.7 | (17.2 | ) | * | (12.5 | ) | ||||||||||||||||||
| Impairment of long-lived assets |
1.3 | (0.7 | ) | (57.8 | )% | 0.6 | (0.6 | ) | (100.0 | )% | — | |||||||||||||||||
| Loss (gain) on disposals of fixed assets—net |
0.1 | 0.4 | * | 0.5 | (0.5 | ) | (100.0 | )% | — | |||||||||||||||||||
| Restructuring |
0.7 | 0.9 | 129.7 | % | 1.6 | 1.4 | 80.9 | % | 3.0 | |||||||||||||||||||
| Multiemployer pension plan withdrawal expense (gain) |
— | 3.4 | * | 3.4 | (4.1 | ) | * | (0.7 | ) | |||||||||||||||||||
|
|
|
|
|
|
|
|
|
|
|
|
|
|
|
|||||||||||||||
| Operating income |
29.3 | 0.6 | 2.2 | % | 29.9 | 23.8 | 79.4 | % | 53.7 | |||||||||||||||||||
| Interest expense |
(17.0 | ) | (1.6 | ) | 9.4 | % | (18.6 | ) | (2.1 | ) | 11.3 | % | (20.7 | ) | ||||||||||||||
| Equity income |
0.9 | 0.6 | 74.6 | % | 1.5 | 0.8 | 55.3 | % | 2.3 | |||||||||||||||||||
| Gain from involuntary conversion of equipment |
— | 6.1 | * | 6.1 | 0.3 | 4.1 | % | 6.4 | ||||||||||||||||||||
| Other income (expense)—net |
0.2 | 0.4 | 104.1 | % | 0.6 | — | * | 0.6 | ||||||||||||||||||||
|
|
|
|
|
|
|
|
|
|
|
|
|
|
|
|||||||||||||||
| Income before income taxes |
13.4 | 6.1 | 45.2 | % | 19.5 | 22.8 | 117.2 | % | 42.3 | |||||||||||||||||||
| Tax provision |
4.1 | 0.7 | 17.3 | % | 4.8 | 13.4 | 277.9 | % | 18.2 | |||||||||||||||||||
|
|
|
|
|
|
|
|
|
|
|
|
|
|
|
|||||||||||||||
| Net income |
$ | 9.3 | $ | 5.4 | 57.6 | % | $ | 14.7 | $ | 9.4 | 64.3 | % | $ | 24.1 | ||||||||||||||
|
|
|
|
|
|
|
|
|
|
|
|
|
|
|
|||||||||||||||
| Other financial data:(1) |
||||||||||||||||||||||||||||
| Adjusted EBITDA |
$ | 58.0 | $ | 12.5 | 21.5 | % | $ | 70.5 | $ | 9.3 | 13.2 | % | $ | 79.8 | ||||||||||||||
| Adjusted EBITDA % of net sales |
9.7 | % | 10.8 | % | 11.7 | % | ||||||||||||||||||||||
| * | Not Meaningful |
| (1) | Adjusted EBITDA and Adjusted EBITDA as a % of net sales are financial measures that are not presented in accordance with GAAP. See “—Key Measures Jason Uses to Evaluate Its Performance” for a reconciliation of Adjusted EBITDA to Net Income. |
Year Ended December 31, 2013 Compared to Year Ended December 31, 2012
Net sales. Net sales were $680.8 million for the year ended December 31, 2013, an increase of $25.8 million, or 3.9%, compared to $655.0 million for the year ended December 31, 2012, reflecting increased net sales in the acoustics segment of $32.2 million and in the seating segment of $2.7 million partially offset by declines in net sales in the finishing segment of $3.9 million and the components segment of $5.2 million. Changes in foreign currency exchange rates compared to the U.S. dollar had a net positive impact of $1.6 million on finishing segment sales due principally to the weakening of the U.S. dollar against the Euro of approximately 3.0% during 2013. The impact of exchange rates on the other segments was not significant. Changes in sales levels throughout our segments are principally the result of changes in volume as net price changes were not significant.
The primary reason for the sales increase for the year ended December 31, 2013 was the strong performance of Jason’s acoustics segment, which achieved a sales increase of $32.2 million due to an increase of approximately 4% in North American automotive industry unit production levels combined with new automotive platform awards secured during 2013 as well the impact of a full year of revenue on new platforms launched in 2012. Net sales in the seating segment increased by $2.7 million during 2013 as sales increased to customers in the power sports, turf care and agricultural and construction industries from new product launches. These sales gains were partially offset by lower finishing segment sales due to lower sales by that segment’s European
77
Table of Contents
operations. The finishing segment’s European revenues, which declined $7.6 million on a constant currency basis, are mostly generated in the northern European countries, which have seen their economies stagnate as a result of the debt crisis in southern Europe. Finishing segment sales in North America and in other parts of the world improved $2.1 million during 2013. Net sales in the components segment were down $5.2 million year over year, with lower sales to the rail market partially offset by strong sales to the meter industry.
Cost of goods sold. Cost of goods sold was $527.3 million for the year ended December 31, 2013, an increase of $12.2 million, or 2.4%, compared to $515.1 million for the year ended December 31, 2012. This increase was primarily attributable to the impact of increased net sales and product mix on our raw material, labor, and overhead costs associated with the increase in net sales as well as the overhead costs associated with the new acoustics segment facility in Battle Creek, Michigan that opened in 2013.
Gross profit. Gross profit was $153.5 million for the year ended December 31, 2013, an increase of $13.6 million, or 9.7%, compared to $139.9 million for the year ended December 31, 2012. This increase was driven primarily by the increase in net sales. Gross profit as a percent of net sales increased to 22.5% from 21.4% in 2012 due to a number of factors including increased sales of higher value products particularly in the acoustics segment, lower material costs in the acoustics and seating segments, labor cost reductions in the seating segment, and overhead cost reductions in the finishing segment. The labor and overhead cost reductions are largely the result of improving plant layouts and streamlining processes in the seating segment, reducing the number of facilities in the finishing segment and moving higher labor content production activities from the U.S. and Germany to lower cost countries such as Mexico, Portugal and Romania in the finishing segment. These improvements were partially offset by the impact of higher sales of lower margin polishing products in the finishing segment and the start-up costs incurred by the components segment for a new product line being developed for internal supply to the seating segment.
Selling and administrative expenses. Selling and administrative expenses were $110.0 million for the year ended December 31, 2013, an increase of $10.8 million, or 10.9%, compared to $99.2 million for the year ended December 31, 2012. The increase was primarily attributable to increased research and development expenses in the acoustics and seating segments and costs incurred to support higher sales levels and future growth including investments in a larger team of sales representatives needed to achieve sales growth objectives in the finishing segment and increased compensation and benefits for additional employees primarily in the acoustics segment and in the corporate office; the impact of these items approximated $5 million. Selling and administrative expenses for 2013 also include professional fees, expenses and special employee bonuses paid in connection with the 2013 Refinancing Transactions of $4.9 million.
Newcomerstown fire loss (gain), net. Jason recorded a net gain of $12.5 million for the year ended December 31, 2013, compared to a $4.7 million loss for the year ended December 31, 2012. A final insurance settlement payment was received in October of 2013, which allowed Jason to reflect the final accounting in 2013. A net gain of $7.6 million was recorded in 2013 representing the recovery of costs incurred in 2011 and 2012 related to material and labor inefficiencies, outsourcing, facility start-up costs and professional fees. A gain of $4.9 million was also recorded in 2013 representing compensation received for lost margins caused by the fire.
Impairment of long-lived assets. For the year ended December 31, 2013, Jason did not recognize any impairment losses. During 2012, Jason recognized impairment losses on idle facilities in Cleveland, Ohio and Kolding, Denmark of $0.5 million and $0.1 million, respectively, to reduce the carrying value of those facilities to their fair values.
Loss (gain) on disposals of fixed assets—net. For the year ended December 31, 2013, Jason did not recognize any net loss or gain on disposals of fixed assets compared to a gain of $0.5 million for the year ended December 31, 2012. Year to year changes in the level of fixed asset disposals are dependent upon a number of factors, including changes in the level of asset sales, operational restructuring activities, and capital expenditure levels. During 2013, no significant disposals of fixed assets occurred.
78
Table of Contents
Restructuring. Restructuring was $3.0 million for the year ended December 31, 2013, an increase of $1.4 million, or 80.9%, compared to $1.6 million for the year ended December 31, 2012. The increase was primarily due to the commencement of a plant closure in Norwalk, Ohio. During 2013, Jason began the discontinuation of manufacturing operations in Norwalk and will complete the closure in 2014 and also incurred costs for the discontinuance of manufacturing at its Chepstow, UK facility. During 2012, Jason incurred restructuring costs to complete the closure of its Cleveland, Ohio manufacturing operations and transfer production to Richmond, Indiana while also consolidating three facilities in France.
Multiemployer pension plan withdrawal expense (gain). Multiemployer pension plan withdrawal gain was $0.7 million for the year ended December 31, 2013 compared to an expense of $3.4 million for the year ended December 31, 2012. The 2012 expense amount represented Jason’s best estimate of the present value of the obligation with respect to the multiemployer pension plan it acquired in connection with the acquisition of Morton. The expense was recorded in connection with Jason’s decision to withdraw from the plan on August 12, 2012. During 2013, Jason was provided with its actual withdrawal obligation by the plan administrator which was $0.7 million lower than the estimated liability recorded in 2012.
Interest expense. Interest expense was $20.7 million for the year ended December 31, 2013, an increase of $2.1 million, or 11.3%, compared to $18.6 million for the year ended December 31, 2012. In connection with the 2013 Refinancing Transactions, Jason wrote off $1.4 million of deferred financing costs associated with its previous U.S. credit facility and incurred another $4.5 million of financing related costs; the increased interest expense resulting from these items was partially offset by the reduction in interest cost resulting from lower interest rates (ranging from 2.75% to 3.25%) on the new U.S. credit facility.
Equity income. Equity income was $2.3 million for the year ended December 31, 2013, an increase of $0.8 million, or 55.3%, compared to $1.5 million for the year ended December 31, 2012. The increase was due to increased profitability at Jason’s Asian joint ventures principally from new Polishing industry projects in China.
Gain from involuntary conversion of equipment. Gain from involuntary conversion of equipment was $6.4 million for the year ended December 31, 2013, an increase of $0.3 million, or 4.1%, compared to $6.1 million for the year ended December 31, 2012. During both 2013 and 2012, Jason received cash equal to the replacement value of assets destroyed in the Newcomerstown Fire. Because the replacement values are higher than the book values of the assets destroyed, Jason recorded gains, in accordance with GAAP, at the time the cash was received.
Other income (expense)—net. Other income was $0.6 million for the year ended December 31, 2013, the same level as achieved in the year ended December 31, 2012. During 2013, Jason realized a $0.5 million gain on the settlement of a contractual dispute related to the Morton acquisition. This gain was partially offset by lower subsidies primarily due to reduced research and development expenses at Jason’s Mexican subsidiary in its acoustics segment, resulting in other income of approximately the same amount as the prior year.
Income before income taxes. Income before income taxes was $42.3 million for the year ended December 31, 2013, an increase of $22.8 million, or 117.2%, compared to $19.5 million for the year ended December 31, 2012. The increase was primarily due to improved operating performance from higher sales, the impact of the Newcomerstown Fire ($12.5 million gain was recorded in 2013 compared with a $4.7 million loss in 2012), and the change in the liability associated with Morton’s withdrawal from the multiemployer pension plan ($3.4 million expense in 2012 and a $0.7 million gain in 2013).
Tax provision. Tax provision was $18.2 million for the year ended December 31, 2013, an increase of $13.4 million, or 277.9%, compared to $4.8 million for the year ended December 31, 2012. The increase is primarily due to an increase in income before income taxes, the recognition of a $2.2 million deferred tax provision on foreign earnings that were no longer considered permanently reinvested and the impact of favorable tax rulings on the tax provision in 2012. The effective income tax rates were 43.1% and 24.8% for the years ended December 31, 2013 and 2012, respectively. The difference between the effective income tax rate and the
79
Table of Contents
U.S. statutory rate of 35% for the year ended December 31, 2013 is primarily due to the recognition of a $2.2 million deferred tax provision on foreign earnings that were no longer considered permanently reinvested and the impact of state income taxes. The difference between the effective income tax rate and the U.S. statutory rate of 35% for the year ended December 31, 2012 is primarily due to the release of the valuation allowance and adjustment of deferred tax balances related to operating loss carryforwards at Jason’s primary German subsidiary. This was also the reason the effective income tax rate was lower in 2012 as compared with 2013.
Net income. For the reasons described above, net income was $24.1 million for the year ended December 31, 2013, an increase of $9.4 million, or 64.3%, compared to $14.7 million for the year ended December 31, 2012.
Adjusted EBITDA. Adjusted EBITDA was $79.8 million or 11.7% of net sales for the year ended December 31, 2013, an increase of $9.3 million, or 13.2%, compared to $70.5 million or 10.8% of net sales for the year ended December 31, 2012. The increase was primarily due to those factors discussed above, including net sales growth of 3.9% and increased gross profit margins due to increased sales of higher value products and lower material, labor and overhead costs.
Year Ended December 31, 2012 Compared to Year Ended December 31, 2011
Net sales. Net sales were $655.0 million for the year ended December 31, 2012, an increase of $54.4 million, or 9.1%, compared to $600.6 million for the year ended December 31, 2011, reflecting increased net sales in the components segment of $36.2 million and in the acoustics segment of $27.0 million, partially offset by declines in net sales in the finishing segment of $6.4 million and the seating segment of $2.4 million. Changes in foreign currency exchange rates compared to the U.S. dollar had a net negative impact of $9.5 million on finishing segment sales and a net negative impact of $2.4 million on acoustics segment sales due principally to the strengthening of the U.S. dollar against the Euro of approximately 8.0% during 2012. The impact of exchange rate changes on the other segments was not significant. Changes in sales levels throughout our segments are principally the result of changes in volume as net price changes were not significant.
The primary reason for the sales increase for the year ended December 31, 2012 was the performance of Jason’s components and acoustics segments. The components segment increase in net sales was due primarily to a $36.4 million increase in revenues from the integration of Morton (acquired on October 13, 201l) for the full year. Net sales increased by $27.0 million in the acoustics segment, primarily driven by strong automotive markets in both North America and Europe with North American automotive industry unit production levels increasing approximately 17% and from new platform awards that went into production with the new automotive model year in the second half of 2012. The most notable new platform gains were for the Ford Fusion and Chevrolet Malibu automobiles. These gains were partially offset by a net sales decline in the finishing segment, resulting principally from a negative currency translation impact of $9.5 million, and a net sales decline in the seating segment. On a constant currency basis finishing segment revenues increased by $3.1 million driven by a $6.4 million increase in North America and a $0.5 million increase in emerging markets resulting from market share gains, partially offset by a $3.8 million decline in Europe caused by weakness in the southern European economy. The seating segment net sales decrease was due to market declines in the turf care industry. 2012 was a challenging year for the turf care industry due to discretionary spending remaining weak and the drought that impacted much of the U.S. during the summer of 2012.
Cost of goods sold. Cost of goods sold was $515.1 million for the year ended December 31, 2012, an increase of $45.1 million, or 9.6%, compared to $470.0 million for the year ended December 31, 2011. This increase was primarily attributable to the impact of increased net sales and product mix on our raw material, labor and overhead costs associated with the Morton acquisition and increases in base business net sales in the acoustics and finishing segments along with the overhead costs associated with the new acoustics segment facility in Celaya, Mexico that opened in 2012.
Gross profit. Gross profit was $139.9 million for the year ended December 31, 2012, an increase of $9.3 million, or 7.1%, compared to $130.6 million for the year ended December 31, 2011. This increase was driven
80
Table of Contents
primarily by the integration of Morton for the full year, supplemented by the net increase in net sales from Jason’s base businesses, primarily in the acoustics segment. Gross profit as a percent of sales declined slightly to 21.4% from 21.7% in 2011 due to the increased sales in the acoustics segment, which carry a lower gross profit percent when compared to the other segments, increased sales of smart meter assemblies which carry a slightly lower gross profit when compared to other product lines in the components segment, and a full year of material cost increases that occurred in 2011 in the acoustics and seating segments. These negative effects were partially offset by improved product margins in the finishing segment from a favorable mix of products sold and from the benefit of relocating high labor content products from the U.S. and Germany to lower cost countries such as Mexico, Portugal and Romania.
Selling and administrative expenses. Selling and administrative expenses were $99.2 million for the year ended December 31, 2012, an increase of $2.9 million, or 2.9%, compared to $96.3 million for the year ended December 31, 2011. The increase was primarily due to the addition of selling and administrative expenses associated with the October 13, 2011 acquisition of Morton. Excluding the increases associated with Morton, Jason held selling and administrative expenses constant in 2012 when compared to 2011.
Newcomerstown fire loss (gain), net. Newcomerstown fire loss, net was $4.7 million for the year ended December 31, 2012, an increase of $1.8 million, or 60.7%, compared to $2.9 million for the year ended December 31, 2011. The increase was primarily due to the fact that 2012 includes a full year of costs associated with fire recovery activities, including business interruption costs, compared with only two months in 2011.
Impairment of long-lived assets. Impairment of long-lived assets totaled $0.6 million for the year ended December 31, 2012, a decrease of $0.7 million, or 57.8%, compared to $1.3 million for the year ended December 31, 2011. During 2012, Jason recognized impairment losses on idle facilities in Cleveland, Ohio and Kolding, Denmark of $0.5 million and $0.1 million, respectively, to reduce the carrying value of those facilities to their fair values. During 2011, Jason recognized impairment losses on idle facilities in Milwaukee, Wisconsin and Kolding, Denmark of $0.9 million and $0.4 million, respectively.
Loss (gain) on disposals of fixed assets—net. Loss on disposals of fixed assets—net was $0.5 million for the year ended December 31, 2012, an increase of $0.4 million compared to $0.1 million for the year ended December 31, 2011. Year to year changes in the level of fixed asset disposals are dependent upon a number of factors, including changes in the level of asset sales, operational restructuring activities, and capital expenditure levels. During 2012, Jason experienced a higher level of fixed asset sales generating cash proceeds of $0.8 million compared to $0.4 million in 2011.
Restructuring. Restructuring was $1.6 million for the year ended December 31, 2012, an increase of $0.9 million, or 129.7%, compared to $0.7 million for the year ended December 31, 2011. The increase was primarily due to increased restructuring activity in 2012. During 2012, Jason incurred restructuring costs to complete the closure of its Cleveland, Ohio manufacturing operations and transfer production to Richmond, Indiana while also consolidating three facilities in France. During 2011, Jason incurred the initial costs associated with the Cleveland facility closure as well as future lease costs relating to its former manufacturing operation in Addison, Illinois.
Multiemployer pension plan withdrawal expense. Multiemployer pension plan withdrawal expense was $3.4 million for the year ended December 31, 2012, representing management’s best estimate of Jason’s obligation to the multiemployer pension plan it acquired in connection with the acquisition of Morton. The expense was recorded in connection with Jason’s decision to withdraw from the plan on August 12, 2012.
Interest expense. Interest expense was $18.6 million for the year ended December 31, 2012, an increase of $1.6 million, or 9.4%, compared to $17.0 million for the year ended December 31, 2011. The increase was primarily due to interest incurred on the proceeds of a $45.0 million term loan issued under Jason’s credit facility in late 2011 and early 2012 to fund the acquisition of Morton.
81
Table of Contents
Equity income. Equity income was $1.5 million for the year ended December 31, 2012, an increase of $0.6 million, or 74.6%, compared to $0.9 million for the year ended December 31, 2011. The increase was primarily due to increased profitability at Jason’s Asian joint ventures.
Gain from involuntary conversion of equipment. Gain from involuntary conversion of equipment was $6.1 million for the year ended December 31, 2012; there was no gain recorded for the year ended December 31, 2011. During 2012, Jason received cash equal to the replacement value of assets destroyed in the Newcomerstown Fire. Because the replacement values are higher than the book values of the assets destroyed, Jason records a gain, in accordance with GAAP, at the time the cash is received.
Other income (expense)—net. Other income was $0.6 million for the year ended December 31, 2012, an increase of $0.4 million, or 104.1%, compared to $0.2 million for the year ended December 31, 2011. The increase was primarily due to the receipt of higher subsidies of $0.1 million and higher royalties of $0.1 million.
Income before income taxes. Income before income taxes was $19.5 million for the year ended December 31, 2012, an increase of $6.1 million, or 45.2%, compared to $13.4 million for the year ended December 31, 2011. The increase was primarily due to improved operating performance from higher sales, including the benefit from the acquisition of Morton.
Tax provision. Tax provision was $4.8 million for the year ended December 31, 2012, an increase of $0.7 million, or 17.3%, compared to $4.1 million for the year ended December 31, 2011. The increase is primarily due to an increase in income before income taxes, partially offset by the benefit from the release of the valuation allowance and adjustment of deferred tax balances related to operating loss carryforwards at Jason’s primary German subsidiary. The effective income tax rates were 24.8% and 30.7% for the years ended December 31, 2012 and 2011, respectively. The difference between the effective income tax rate and the U.S. statutory rate of 35% for the year ended December 31, 2012 is primarily due to the release of the valuation allowance and adjustment of deferred tax balances related to operating loss carryforwards at Jason’s primary German subsidiary. This also was the reason the effective tax rate decreased from 2011. The difference between the effective income tax rate and the U.S. statutory rate for the year ended December 31, 2011 is primarily due to the release of valuation allowances at Jason’s subsidiaries in Germany and Sweden and foreign rate differences, partly offset by the fact that no tax benefit was recorded on pre-tax losses at certain of its foreign subsidiaries. The release of these valuation allowances was due to improved profitability at Jason’s German and Swedish subsidiaries.
Net income. For the reasons described above, net income was $14.7 million for the year ended December 31, 2012, an increase of $5.4 million, or 57.6%, compared to $9.3 million for the year ended December 31, 2011.
Adjusted EBITDA. Adjusted EBITDA was $70.5 million or 10.8% of net sales for the year ended December 31, 2012, an increase of $12.5 million, or 21.5%, compared to $58.0 million or 9.7% of net sales for the year ended December 31, 2011. The increase was primarily due to factors discussed above, including a $6.8 million increase in year over year results due to the acquisition of Morton, as well as Jason’s increased net sales from base businesses.
Key Measures Jason Uses to Evaluate Its Performance
EBITDA and Adjusted EBITDA. Jason defines EBITDA as net income (loss) before interest expense, provision (benefit) for income taxes, depreciation and amortization and (gain)/loss on disposal of property, plant and equipment. Jason defines Adjusted EBITDA as EBITDA, excluding the impact of operational restructuring charges and non-cash or non-operational losses or gains, including long-lived asset impairment charges, transactional legal fees, other professional fees and special employee bonuses, Newcomerstown fire losses and gains, multiemployer pension plan withdrawal expense (gain), purchase accounting adjustments and sponsor fees and expenses.
82
Table of Contents
Management believes that Adjusted EBITDA provides a clear picture of Jason’s operating results by eliminating expenses and income that are not reflective of the underlying business performance. Jason uses this metric to facilitate a comparison of operating performance on a consistent basis from period to period and to analyze the factors and trends affecting its segments. Jason’s internal plans, budgets and forecasts use Adjusted EBITDA as a key metric and Jason uses this measure to evaluate its operating performance and segment operating performance and to determine the level of incentive compensation paid to its employees.
Under its U.S. credit agreement, the definition of EBITDA was substantially the same as management’s definition of Adjusted EBITDA; the credit agreement definition excludes income of partially owned affiliates, unless such earnings have been received in cash, and stock compensation expense. For the year ended December 31, 2013, EBITDA as defined by the credit agreement, equaled $78.6 million compared with Adjusted EBITDA of $79.8 million. It is expected that the definition of EBITDA in the documents evidencing the Debt Financing will be the same as that in Jason’s existing U.S. credit agreement.
Set forth below is a reconciliation of Adjusted EBITDA to net income (loss) (in millions) (unaudited):
| Year Ended December 31, | Three Months Ended | |||||||||||||||||||
| 2011 | 2012 | 2013 | March 29, 2013 |
March 28, 2014 |
||||||||||||||||
| Net income |
$ | 9.3 | $ | 14.7 | $ | 24.1 | $ | 2.6 | $ | 7.7 | ||||||||||
| Tax provision |
4.1 | 4.8 | 18.2 | 1.4 | 4.5 | |||||||||||||||
| Interest expense |
17.0 | 18.6 | 20.7 | 9.7 | 3.5 | |||||||||||||||
| Depreciation and amortization |
20.2 | 24.2 | 27.0 | 6.8 | 6.3 | |||||||||||||||
| Loss (gain) on disposals of fixed assets—net |
0.1 | 0.5 | — | — | 0.1 | |||||||||||||||
|
|
|
|
|
|
|
|
|
|
|
|||||||||||
| EBITDA |
50.7 | 62.8 | 90.0 | 20.5 | 22.1 | |||||||||||||||
| Adjustments: |
||||||||||||||||||||
| Impairment of long-lived assets(1) |
1.3 | 0.5 | — | — | — | |||||||||||||||
| Restructuring(2) |
0.7 | 1.6 | 4.0 | 0.1 | 1.6 | |||||||||||||||
| Advisory, legal, professional fees and special bonuses(3) |
0.9 | 1.0 | 6.0 | 1.5 | 1.6 | |||||||||||||||
| Newcomerstown net Fire costs (income) and related items(4) |
3.0 | (1.3 | ) | (18.8 | ) | (0.2 | ) | — | ||||||||||||
| Adjustment for non-discrete fire costs(5) |
1.4 | (1.4 | ) | — | — | |||||||||||||||
| Multiemployer pension plan withdrawal expense (gain)(6) |
— | 3.4 | (0.7 | ) | — | — | ||||||||||||||
| Purchase accounting impact of inventory write-up(7) |
0.4 | — | — | — | — | |||||||||||||||
| Gain on claim settlement(8) |
— | — | (0.4 | ) | — | — | ||||||||||||||
| Sponsor fees(9) |
1.0 | 1.1 | 1.1 | 0.3 | 0.3 | |||||||||||||||
| Gain from sale of joint ventures(10) |
— | — | — | — | (3.5 | ) | ||||||||||||||
|
|
|
|
|
|
|
|
|
|
|
|||||||||||
| Total adjustments |
7.3 | 7.7 | (10.2 | ) | 1.7 | — | ||||||||||||||
|
|
|
|
|
|
|
|
|
|
|
|||||||||||
| Adjusted EBITDA |
$ | 58.0 | $ | 70.5 | $ | 79.8 | $ | 22.2 | $ | 22.1 | ||||||||||
|
|
|
|
|
|
|
|
|
|
|
|||||||||||
| (1) | Represents non-cash charges incurred to adjust the carrying value of certain idle and underutilized facilities to their estimated values. |
| (2) | For the year ended December 31, 2013 and three months ending March 28, 2014, restructuring includes $1.0 million and $1.0 million, respectively, of equipment move costs and incremental facility preparation and related costs incurred in connection with the closure of the Norwalk, Ohio facility and the start-up of a new acoustics segment facility in Warrensburg, Missouri; such costs are not included in restructuring for US GAAP purposes. See Note 3, “Restructuring Costs” of the accompanying consolidated financial statements for further information. |
| (3) | Represents professional fees and expenses associated with the 2011 acquisition of Morton ($0.9 million in 2011), other acquisitions and company sale activities ($1.0 million in 2012 and $1.1 million in 2013), and professional fees, expenses and special employee bonuses paid in connection with the 2013 Refinancing Transactions ($4.9 million for the year ended December 31, 2013 and $1.5 million for the three months ended March 29, 2013) and the Business Combination ($1.6 million for the three months ended March 28, 2014). See Note 10, “Revolving Loans and Other Long-Term Debt Instruments” of the accompanying consolidated financial statements for further information regarding the 2013 Refinancing Transactions. |
83
Table of Contents
| (4) | Represents the net loss (gain) relating to incremental costs, operating inefficiencies, business interruption matters and involuntary conversions of equipment associated with the Newcomerstown Fire. See Note 18, “Newcomerstown Fire” of the accompanying consolidated financial statements for further information. |
| (5) | Represents non-discrete operating inefficiencies associated with the Newcomerstown Fire that were incurred in 2012 and recovered from the insurance carrier during 2013. |
| (6) | Represents the expense (income) associated with the August 15, 2012 decision to withdraw from a union-sponsored and trusteed multiemployer pension plan at Morton. See Note 15, “Employee Benefit Plans” of the accompanying consolidated financial statements for further information. |
| (7) | Represents the increase in cost of sales caused by the amortization of the write up of inventory required in connection with the new basis of accounting implemented as part of the October 2011 acquisition of Morton. |
| (8) | Represents the elimination of a one-time gain associated with the settlement of a contractual dispute related to the 2011 acquisition of Morton. |
| (9) | Represents fees and expenses paid by Jason to Saw Mill Capital LLC and Falcon Investment Advisors, LLC under the Management Service Agreement dated September 21, 2010. See Note 4, “Related Party Transactions” of the accompanying consolidated financial statements for further information. |
| (10) | Represents the gain on sale of the 50% equity interests in two joint ventures that was completed during the three months ended March 28, 2014. |
Adjusted EBITDA percentage of sales. Adjusted EBITDA as a percentage of sales is an important metric that Jason uses to evaluate its operational effectiveness and business segments. Each of Jason’s segments has a target Adjusted EBITDA percentage level that it is expected to achieve over the next three to five years which is based on peer group studies and its goals of becoming best in class in profitability and increasing shareholder value.
Segment Financial Data—For the Three Months Ended March 29, 2013 and March 28, 2014
The table below presents Jason’s net sales, Adjusted EBITDA and Adjusted EBITDA as a percentage of net sales for each of its reportable segments for the three months ended March 29, 2013 and March 28, 2014. Jason uses Adjusted EBITDA as the primary measure of profit or loss for purposes of assessing the operating performance of its segments. See “Key Measures Jason Uses to Evaluate Its Performance” for a reconciliation of Adjusted EBITDA to Net Income which is the nearest GAAP measure.
| Three Months Ended | ||||||||
| March 29, 2013 |
March 28, 2014 |
|||||||
| Finishing |
||||||||
| Net sales |
$ | 45.1 | $ | 46.6 | ||||
| Adjusted EBITDA |
4.4 | 6.0 | ||||||
| Adjusted EBITDA % net sales |
9.8 | % | 12.9 | % | ||||
| Seating |
||||||||
| Net sales |
$ | 52.9 | $ | 52.3 | ||||
| Adjusted EBITDA |
9.3 | 8.1 | ||||||
| Adjusted EBITDA % net sales |
17.6 | % | 15.5 | % | ||||
| Acoustics |
||||||||
| Net sales |
$ | 48.4 | $ | 53.0 | ||||
| Adjusted EBITDA |
5.1 | 4.4 | ||||||
| Adjusted EBITDA % net sales |
10.5 | % | 8.3 | % | ||||
| Components |
||||||||
| Net sales |
$ | 33.3 | $ | 34.6 | ||||
| Adjusted EBITDA |
5.4 | 6.5 | ||||||
| Adjusted EBITDA % net sales |
16.2 | % | 18.8 | % | ||||
| Corporate |
||||||||
| Adjusted EBITDA |
(2.0 | ) | (2.9 | ) | ||||
| Consolidated |
||||||||
| Net sales |
$ | 179.7 | $ | 186.5 | ||||
| Adjusted EBITDA |
22.2 | 22.1 | ||||||
| Adjusted EBITDA % net sales |
12.4 | % | 11.8 | % | ||||
84
Table of Contents
Finishing Segment
Net sales in the finishing segment for the three months ended March 28, 2014 were $46.6 million, an increase of $1.5 million, or 3.3%, compared to $45.1 million for the three months ended March 29, 2013. On a constant currency basis (net positive currency impact of $0.2 million), revenues increased by $1.3 million for the three months ended March 28, 2014. Increased sales efforts and improving market conditions in Europe resulted in strong sales in the power brush and buffing compound product lines. These sales gains were partially offset by a decline in sales of edge-honing machines manufactured in Sweden. Edge-honing machine sales can fluctuate when comparing quarter over quarter results, due to timing of large orders. Adjusted EBITDA increased $1.6 million in 2014 to $6.0 million (12.9% of net sales) from $4.4 million (9.8% of net sales) in 2013 as a result of higher net sales, a favorable mix of products sold and direct labor productivity. Material as a percentage of net sales was 38.3% for the first quarter of 2014, compared to 39.4% for the first quarter 2013, due primarily to increased sales of higher margin power brush products. Direct labor as a percentage of net sales was 5.1% for the first quarter of 2014, compared to 5.8% for the first quarter of 2013, due principally to the benefits of shifting higher labor content production activities from the United States and Western Europe to lower labor cost manufacturing facilities in Mexico and Romania, respectively, and to a sales mix shift during 2014 to a higher percentage of lower labor content products. The finishing segment was also able to effectively leverage its selling and administrative expense cost base which contributed to the improvement in Adjusted EBITDA as a percentage of net sales. Selling and administrative expenses totaled $11.5 million for the first quarter of 2014, an increase of 0.6% compared to $11.4 million for the first quarter 2013, increasing by less than the 3.3% net sales increase during the same period.
Seating Segment
Net sales in the seating segment for the three months ended March 28, 2014 were $52.3 million, a decrease of $0.6 million, or 1.1%, compared to $52.9 million for the three months ended March 29, 2013. The business of the seating segment is more seasonal than Jason’s other segments mainly due to the fact that approximately 38% of its net sales are to customers operating in the turf care industry, which has a typical peak season from November through April/May of the following year. Net sales to customers in the turf care industry were down $1.2 million in 2014 as compared to 2013. This decrease is attributable to an unusually severe winter in the United States in 2013/2014 that has resulted in consumers delaying the purchase of turf care equipment. The severe weather also adversely affected net sales of motorcycle aftermarket seats and related products which declined by $0.6 million in 2014. Net sales in the power sports product category were strong due to new product launches, resulting in an increase of $1.3 million in the first quarter of 2014 as compared to 2013. Adjusted EBITDA for the three months ended March 28, 2014 decreased $1.2 million to $8.1 million (15.5% of net sales) from $9.3 million (17.6% of net sales) for the three months ended March 29, 2013. The Adjusted EBITDA decrease as a percent of net sales was primarily due to the impact of lower net sales, supplier price increases, unexpected weather-related costs and higher selling and administrative expenses. Material and freight cost as a percentage of net sales increased to 57.0% for the three months ended March 28, 2014 compared to 56.1% for the three months ended March 29, 2014 primarily caused by unexpected weather-related freight costs and supplier price increases. Extreme temperatures, heavy snowfalls and ice storms disrupted the flow of goods in the first quarter of 2014, causing unexpected freight costs and overtime expense to meet customer delivery requirements. A supplier price increase caused material costs as a percentage of sales to increase in 2014 as compared to 2013. The seating segment is currently working with alternate suppliers in an effort to mitigate the impact of this increase. Selling and administrative expenses increased by $0.5 million in 2014 as compared to 2013. The increase was primarily attributable to wages, benefits and new product development activities.
Acoustics Segment
Net Sales in the acoustics segment for the three months ended March 28, 2014 were $53.0 million, an increase of $4.6 million, or 9.5%, compared to $48.4 million for the three months ended March 29, 2013. The increase in net sales was driven by an increase of approximately 4% in North American automotive industry unit production levels, as well as a full quarter of revenue on new platforms launched in the second half of 2013.
85
Table of Contents
Once a new car platform is awarded, it typically results in a consistent revenue stream for two to five years, depending on the platform model. The impact of exchange rate changes did not have a significant impact on net sales for the first quarter of 2014 when compared to the first quarter of 2013. Adjusted EBITDA was $4.4 million (8.3% of net sales) in the three months ended March 28, 2014 compared to $5.1 million (10.5% of net sales) in the three months ended March 29, 2013. The decline in Adjusted EBITDA performance quarter over quarter was caused primarily by a $0.6 million reduction in net sales in Mexico, which carry a higher margin than sales in the United States and Europe, and the incremental labor and overhead costs caused by inefficiencies associated with the acceleration of the planned closure of the acoustics segment manufacturing facility in Norwalk, Ohio. During 2013, the acoustics segment began the discontinuation of manufacturing operations at its Norwalk, Ohio facility and will complete the closure in 2014 as production is shifted to existing facilities in Michigan and Mississippi and a new facility in the Kansas City, Missouri area that will open in 2014. The new facility is being established for the primary purpose of manufacturing acoustical components for a nearby automotive assembly plant. The closure activities caused direct labor and variable overhead as a percentage of sales to increase by 1.7% in 2014 as compared to 2013. Selling and administrative expenses increased by $0.6 million in 2014 compared to 2013, caused by additional salaries and benefits for new employees hired to support revenue growth.
Components Segment
Net sales in the components segment for the three months ended March 28, 2014 were $34.6 million, an increase of $1.3 million, or 3.9%, compared to $33.3 million for the three months ended March 29, 2013. The net sales increase was primarily due to higher net sales to rail and smart meter customers totaling $1.3 million and $1.6 million, respectively, partially offset by a $1.4 million decline in net sales of products to small gas engine manufacturers. While the overall rail industry remained robust, the rail car production mix shifted away from covered hopper cars to tank cars in 2013 due to the increased demand for oil transportation. There is less of Jason’s metal formed anti-slip running boards, walkways and ladders on tank cars and more competition in the market which caused a decrease in demand for its products in 2013. The rail market reverted to the production of a more normal mix of covered hopper cars and tank cars during the first quarter of 2014. Demand for smart meters increased in the first quarter of 2014 compared to the first quarter of 2013 due to the timing of orders. The decline in sales to small gas engine customers was due primarily to an unusually severe winter in the United States in 2013/2014 that resulted in consumers delaying the purchase of products, such as turf care equipment, that contain small gas engines. Adjusted EBITDA increased to $6.5 million (18.8% of net sales) compared to $5.4 million (16.2% of net sales) in the three months ended March 28, 2014 primarily due to a combination of higher net sales, a favorable product mix and lower commodity prices (primarily steel). Additionally, 2013 results include costs of $0.1 million related to the start up of a new product line; similar costs were not incurred in 2014.
Corporate
Corporate expense is principally comprised of the costs of Jason’s corporate operations including the compensation and benefits of Jason’s Chief Executive Officer and Chief Financial Officer, as well as personnel responsible for treasury, insurance, in-house legal, human resources, tax planning and the administration of employee benefits. Corporate expense also includes third party legal, audit, tax and other professional fees and expenses and the operating costs of the corporate office. The increase in expense in 2014 primarily resulted from additional compensation and benefits costs attributable to the hiring of additional personnel of $0.5 million and additional professional fees of $0.4 million, including $0.2 million for activities associated with preparing Jason for becoming a public company upon the successful completion of the Business Combination.
86
Table of Contents
Segment Financial Data—For the Years Ended December 31, 2011, 2012 and 2013
The table below presents Jason’s net sales, Adjusted EBITDA and Adjusted EBITDA as a percentage of net sales for each of its reportable segments for the years ended December 31, 2011, 2012 and 2013. Jason uses Adjusted EBITDA as the primary measure of profit or loss for purposes of assessing the operating performance of its segments. See “Key Measures Jason Uses to Evaluate Its Performance” for a reconciliation of Adjusted EBITDA to Net Income which is the nearest GAAP measure.
| Year Ended December 31, | ||||||||||||
| 2011 | 2012 | 2013 | ||||||||||
| (in millions, except percentages) | ||||||||||||
| Finishing |
||||||||||||
| Net sales |
$ | 190.7 | $ | 184.3 | $ | 180.4 | ||||||
| Adjusted EBITDA |
14.8 | 18.4 | 17.6 | |||||||||
| Adjusted EBITDA % net sales |
7.8 | % | 9.9 | % | 9.8 | % | ||||||
| Seating |
||||||||||||
| Net sales |
$ | 164.9 | $ | 162.5 | $ | 165.2 | ||||||
| Adjusted EBITDA |
24.4 | 22.6 | 25.6 | |||||||||
| Adjusted EBITDA % net sales |
14.8 | % | 13.9 | % | 15.5 | % | ||||||
| Acoustics |
||||||||||||
| Net sales |
$ | 145.3 | $ | 172.3 | $ | 204.5 | ||||||
| Adjusted EBITDA |
9.1 | 13.4 | 23.4 | |||||||||
| Adjusted EBITDA % net sales |
6.3 | % | 7.8 | % | 11.4 | % | ||||||
| Components |
||||||||||||
| Net sales |
$ | 99.7 | $ | 135.9 | $ | 130.7 | ||||||
| Adjusted EBITDA |
18.6 | 25.1 | 22.9 | |||||||||
| Adjusted EBITDA % net sales |
18.7 | % | 18.4 | % | 17.6 | % | ||||||
| Corporate |
||||||||||||
| Adjusted EBITDA |
(8.9 | ) | (9.0 | ) | (9.7 | ) | ||||||
| Consolidated |
||||||||||||
| Net sales |
$ | 600.6 | $ | 655.0 | $ | 680.8 | ||||||
| Adjusted EBITDA |
58.0 | 70.5 | 79.8 | |||||||||
| Adjusted EBITDA % net sales |
9.7 | % | 10.8 | % | 11.7 | % | ||||||
Finishing Segment
Net sales in the finishing segment for the year ended December 31, 2013 were $180.4 million, a decline of $3.9 million, or 2.1%, compared to $184.3 million for the year ended December 31, 2012. On a constant currency basis (net positive currency impact of $1.6 million), revenues decreased by $5.5 million in the year ended December 31, 2013. The decline was due to the weak European economy. The southern European economies have been softening for some time, but the bulk of Jason’s sales are generated from northern Europe, which has experienced recent declines. Finishing segment sales in Europe stabilized in late 2013 despite a full year decline of $7.6 million (constant currency basis) and after a $3.8 million decline (constant currency basis) in 2012. Net sales in North America and in the rest of the world for the year ended December 31, 2013 increased $2.1 million (constant currency basis) compared to the year ended December 31, 2012. Adjusted EBITDA, on a comparative basis, was down $0.8 million in 2013 to $17.6 million from $18.4 million in 2012 as a result of the decline in European revenues and a less favorable mix of sales to lower margin polishing products ($2.8 million impact), and higher selling and administrative expenses due in large part to investments in a larger team of sales representatives needed to achieve sales growth objectives ($0.2 million impact). These additional costs were partially offset by gains in labor productivity and reduced overhead spending in the power brush and polishing product lines resulting from plant relocations and product line transfers to optimize manufacturing footprint and to take advantage of low cost country manufacturing ($1.1 million impact). The finishing segment also benefitted from an increase in equity earnings from partially owned affiliates due to improved performance at the segment’s Asian joint ventures ($0.8 million impact).
87
Table of Contents
Net sales in the finishing segment for the year ended December 31, 2012 were $184.3 million, a decline of $6.4 million compared to $190.7 million for the year ended December 31, 2011. On a constant currency basis (net negative currency impact of $9.5 million), revenues increased by $3.1 million in the year ended December 31, 2012. The revenue increase was driven by a $6.4 million increase (constant currency basis) in North America resulting from market share gains, partially offset by a $3.8 million decline (constant currency basis) in Europe caused by weakness in the southern European economy. Net sales in other markets, primarily Brazil, increased 0.5 million. Adjusted EBITDA improved significantly, from $14.8 million to $18.4 million, during 2012 due to higher sales ($0.5 million impact), increased variable product margins from 43.8% in 2011 to 44.6% in 2012 ($1.5 million impact), and controlled spending resulting in a reduction of fixed overhead of $1.5 million. EBITDA was also favorably impacted by an increase in equity earnings from partially owned affiliates caused by improved performance at the segment’s Asian joint ventures ($0.6 million impact). Adjusted EBITDA as a percentage of net sales grew to 9.9% in 2012, an improvement of 2.1% of net sales.
Seating Segment
Net Sales in the seating segment for the year ended December 31, 2013 were $165.2 million, an increase of $2.7 million, or 1.7%, compared to $162.5 million for the year ended December 31, 2013 when compared to the year ended December 31, 2012. The business of the seating segment is more seasonal than the other segments mainly due to the fact that 38% of its net sales are to customers operating in the turf care industry, which has a typical peak season from November through April/May of the following year. Net sales in the power sports, turf care and agricultural and construction industries were up $2.7 million compared to 2012, as a result of new product launches for existing customers. Net sales in the motorcycle product category in 2013 were at about the same level as the prior year. Adjusted EBITDA for the year ended December 31, 2013 increased $3.0 million in 2013 to $25.6 million (15.5% of net sales) from $22.6 million (13.9% of net sales) for the year ended December 31, 2012. The Adjusted EBITDA increase as a percent of net sales was primarily due to the impact of higher sales and cost reduction efforts, with material productivity being the biggest contributor. Lower costs on commodities such as vinyl, substrate and fasteners as well as material substitutions and lower scrap drove $2.4 million in material savings year over year. Projects to improve plant layout and streamline processes resulted in direct labor cost reductions of another $0.6 million. These benefits were partially offset by a $1.5 million increase in selling and administrative expenses primarily related to wages, benefits and new product development activities.
Net sales for the year ended December 31, 2012 were $162.5 million, a 1% decline over the net sales of $164.9 million for the year ended December 31, 2011. Increased sales due to new products and customers in Jason’s power sports and construction lines were offset by market declines in the turf care industry. 2012 was a soft year for the turf care industry due to discretionary spending remaining weak and the drought that impacted much of the U.S. during the summer of 2012. Adjusted EBITDA for the year ended December 31, 2012 was $22.6 million (13.9% of net sales) compared to $24.4 million (14.8% of net sales) of Adjusted EBITDA for the full year 2011. Material costs in 2012 were slightly higher than for 2011 as the annualized impact of commodity price increases that occurred in 2011 carried into 2012 results ($0.7 million impact). The seating segment also incurred higher costs of approximately $1 million for the development of new products for turf care and heavy industry customers and start-up costs for a dealer support program for a customer in the motor sports industry.
Acoustics Segment
Net Sales in the acoustics segment for the year ended December 31, 2013 were $204.5 million, an increase of $32.2 million, or 18.7%, compared to $172.3 million for the year ended December 31, 2012. The increase in sales was driven by an increase of approximately 4% in North American automotive industry unit production levels, combined with new automotive platform awards for the acoustics business secured during 2013 as well as a full year of revenue on new platforms launched in 2012. Once a new car platform is awarded, it typically results in a consistent revenue stream for two to five years, depending on the platform model. Adjusted EBITDA in the acoustics segment was $23.4 million (11.4% of net sales) in the year ended December 31, 2013 compared to $13.4 million (7.8% of net sales) in the year ended December 31, 2012. The impact of exchange rate changes
88
Table of Contents
did not have a significant impact on net sales for 2013 when compared to 2012. Strong Adjusted EBITDA performance year over year was caused primarily by the profit contribution from the increase in revenues discussed above and our ability to leverage fixed costs on those increased revenues. In addition, improved product margins on new platform awards containing products viewed by our customers to be of higher value, and material cost reductions resulting from decreases in commodity prices, contributed to EBITDA improvement year over year. A $2.2 million increase in selling and administrative expenses, principally comprised of additional salaries and benefits for new employees hired to support current year and future growth, partially offset the profit improvement from higher net sales and lower material costs.
Net sales in the acoustics segment for the year ended December 31, 2012 were $172.3 million, an increase of $27.0 million, or 19.0%, compared to the year ended December 31, 2011 net sales of $145.3 million. The negative currency impact on year over year revenues for the acoustics segment was $2.4 million. Increased sales were primarily driven by strong automotive markets in both North America and Europe with North American automotive industry unit production levels increasing approximately 17%. Net sales also improved as the acoustics segment realized revenues from new platform awards that went into production with the new automotive model year in the second half of 2012. The most notable new platform gains were for the Ford Fusion and Chevrolet Malibu automobiles. Adjusted EBITDA improved to $13.4 million (7.8% of net sales) for the year ended December 31, 2012 from $9.1 million (6.3% of net sales) for the year ended December 31, 2011. Adjusted EBITDA improved mainly as a result of the additional profit contribution from increased revenues. The Adjusted EBITDA benefits of Jason’s increased revenues were partially offset by a $1.4 million increase in selling and administrative expenses, principally comprised of additional salaries and benefits for new employees hired to support current year and future growth. The acoustics segment experienced slightly higher material costs in 2012 as a result of the annualized impact of commodity price spikes (mainly cotton and bi-component fiber). These commodity price spikes began in mid-2011, and continued through much of the 2012 calendar year. Historically, it has been difficult to pass along material price increases to Jason’s automotive customers. Commodity price spikes normalized in the second half of 2012.
Components Segment
Net sales in the components segment for the year ended December 31, 2013 were $130.7 million, a decrease of $5.2 million, or 3.8%, compared to $135.9 million for the year ended December 31, 2012. The sales decline was primarily due to lower sales to the rail market partially offset by increased net sales of smart meters. Sales of smart meters in the year ended December 31, 2012 were lower than years prior to 2011 due to timing of customer projects. By contrast, sales for the year ended December 31, 2013 increased $6.4 million as demand increased and Jason supplied meters for a one-time project. While the overall rail industry remains robust, the rail car product mix shifted away from covered hopper cars to tank cars in 2013 due to the increased demand for oil transportation. There is less of Jason’s metal formed anti-slip running boards, walkways and ladders on tank cars and more competition in the market which caused a decrease in demand for its products. Jason expects that this unfavorable mix shift will revert to normal during 2014. Adjusted EBITDA declined to $22.9 million (17.6% of net sales) compared to $25.1 million (18.4% of net sales) in the year ended December 31, 2012 primarily due to lower net sales and startup costs of $0.6 million for a new product line being developed for internal supply to the seating segment.
Net sales in the components segment for the year ended December 31, 2012 were $135.9 million, an increase of $36.2 million compared to $99.7 million for the year ended December 31, 2011. The increase is primarily due to the acquisition of Morton in October of 2011. Sales attributable to Morton for the year ended December 31, 2012 totaled $46.8 million, an increase of $36.4 million when compared with the $10.4 million in sales generated by Morton in 2011 during the period following the acquisition. In addition to the base Morton volume, net sales at Morton were favorably impacted by synergies with our existing components segment operations. Excluding the impact of Morton, net sales in the components segment operations declined $0.2 million. Adjusted EBITDA improved 35% over 2011 Adjusted EBITDA of $18.6 million to $25.1 million due primarily to the Morton acquisition. Adjusted EBITDA as a percent of net sales declined from 18.7% of net sales in 2011 to 18.4% in 2012 due to a shift in the mix of products sold to a higher percentage of smart meter assemblies.
89
Table of Contents
Corporate
Corporate expense is principally comprised of the costs of Jason’s corporate operations including the compensation and benefits of Jason’s Chief Executive Officer and Chief Financial Officer, as well as personnel responsible for treasury, insurance, in-house legal, human resources, tax planning and the administration of employee benefits. Corporate expense also includes third party legal, audit, tax and other professional fees and expenses and the operating costs of the corporate office. The increase in expense in 2013 primarily resulted from additional compensation and benefits costs attributable to the hiring of additional personnel.
Liquidity and Capital Resources
Background
Jason’s primary sources of liquidity are cash generated from its operations, available cash and borrowings under its U.S. and foreign credit facilities. As of March 28, 2014, Jason had $21.8 million of available cash, $15.5 million of additional borrowings available under the revolving credit facility portion of its U.S. credit agreement, and $9.0 million available under short-term revolving loan facilities that Jason maintains outside the U.S. As of December 31, 2013, Jason had $16.3 million of available cash, $31.4 million of additional borrowings available under the revolving credit facility portion of its U.S. credit agreement, and $7.8 million available under short-term revolving loan facilities that Jason maintains outside the U.S. Jason’s U.S. and foreign revolving loan facilities are available for working capital requirements, capital expenditures and other general corporate purposes. As of March 28, 2014 and December 31, 2013, available borrowings under its U.S. revolving credit facility were reduced by outstanding letters of credit of $3.9 million and $3.6 million, respectively. Included in Jason’s consolidated cash balance of $21.8 million at March 28, 2014 and $16.3 million at December 31, 2013, is cash of $17.8 million and $7.3 million, respectively, held at Jason’s non-U.S. operations. These funds, with some restrictions and tax implications, are available for repatriation as deemed necessary by Jason.
As a result of organic growth initiatives, ongoing operational improvements and disciplined working capital management, all through the application of the key principles embodied in the Jason Business System, Jason has historically generated strong and consistent cash from operating activities. Jason has a stable customer base that provides it with meaningful revenue and cost visibility which, when combined with its scalable and stable cost structure, helps Jason to maximize cash flow and efficiency through economic cycles. Jason’s primary liquidity needs are for financing working capital, investing in capital expenditures and making principal and interest payments on its outstanding debt.
Indebtedness
As of March 28, 2014, Jason’s total outstanding indebtedness of $257.0 million was comprised of amounts outstanding under its U.S. credit agreement of $228.4 million (net of a $0.4 million debt discount), its U.S. revolving loan facility of $15.6 million, various foreign bank term loans and revolving loan facilities of $10.7 million and capital lease obligations of $2.3 million. As of December 31, 2013, Jason’s total outstanding indebtedness of $242.7 million was comprised of amounts outstanding under its U.S. credit agreement of $229.0 million (net of a $0.4 million debt discount), various foreign bank term loans and revolving loan facilities of $11.3 million and capital lease obligations of $2.4 million. On February 28, 2013, Jason entered into a $260.0 million credit agreement with a syndicate of lenders. The new agreement includes a six-year, $225.0 million senior secured term loan and a five-year, $35.0 million revolving loan facility. The credit agreement was amended on November 14, 2013 to, among other things, increase the term loan by $10.0 million. The term loan amortizes in quarterly installments of $0.6 million, with $217.1 million due on February 28, 2019. The revolving loan includes a $12.5 million letter of credit sub-facility and a $10.0 million swing line sub-facility. Term loan borrowings under the agreement totaled $228.8 million as of March 28, 2014 and $229.4 million as of December 31, 2013. Borrowings outstanding under the revolving loan facility totaled $15.6 million at March 28, 2014. No borrowings were outstanding under the revolving loan facility at December 31, 2013. Revolving loan borrowings during the first three months of 2014 were used to fund the seasonal increase in working capital.
90
Table of Contents
The proceeds from the February 2013 borrowings, along with $14.2 million of existing cash, were used to retire borrowings outstanding under its previous U.S. credit agreement in the amount of $178.5 million, pay accrued interest of $0.9 million, pay related transaction fees and other expenses of $10.0 million and pay a dividend to equityholders and redeem preferred stock in the aggregate amount of $49.8 million. During June 2013, Jason used existing cash to pay a dividend to its equityholders and redeem preferred stock in the aggregate amount of $11.8 million. The proceeds from the November 2013 borrowings, along with $23.4 million of existing cash, were used to pay related transaction fees and other expenses of $3.5 million and pay a dividend to equityholders and redeem preferred stock in the aggregate amount of $29.9 million. Upon completion of these transactions, Jason no longer had any preferred stock outstanding. The new credit agreement requires Jason to comply with a financial covenant tied to a maximum total debt to EBITDA ratio, as defined in the agreement, and contains restrictions limiting additional indebtedness, capital expenditures, payment of certain dividends, among others. The credit agreement definition of EBITDA is substantially the same as the Adjusted EBITDA amounts presented in the Key Measures Jason Uses to Evaluate its Performance section above; the credit agreement definition excludes income of partially owned affiliates, unless such earnings have been received in cash, and stock compensation expense. For the year ended December 31, 2013, EBITDA as defined by the credit agreement, equaled $78.6 million compared with Adjusted EBITDA of $79.8 million. Jason was in compliance with the financial covenants contained in its current and predecessor credit agreements for all periods during the three years ended December 31, 2011, 2012 and 2013 and during the three month period ended March 28, 2014.
Jason maintains various bank term loan and revolving loan facilities outside the U.S. for local operating and investing needs. Borrowings under these facilities totaled $10.7 million as of March 28, 2014, including borrowings of $6.3 million and $1.8 million incurred by Jason’s subsidiaries in Germany and Mexico, respectively, and borrowings totaled $11.3 million as of December 31, 2013, including borrowings of $6.8 million and $2.7 million incurred by Jason’s subsidiaries in Germany and Mexico, respectively. There are certain restrictions included in loan agreements with Jason’s wholly-owned German subsidiary, Jason GmbH, that restrict the transfer of assets or payment of dividends to its shareholders. As a result, at December 31, 2012 and December 31, 2013, Jason Partners Holdings Inc. had restricted net assets from consolidated subsidiaries of approximately $34.3 million and $39.8 million, respectively, and had restricted net assets from unconsolidated subsidiaries of $7.5 million and $8.2 million, respectively. The restrictions have had no impact on Jason’s ability to meet its cash obligations. Non U.S. debt will not be repaid in connection with the Business Combination.
In order to ensure that QPAC and Jason could complete the Business Combination, JPHI obtained a Debt Commitment Letter to provide, upon the terms and subject to the conditions set forth in the Debt Commitment Letter, Debt Financing in the aggregate up to $460 million (not all of which is expected to be drawn at the closing of the Business Combination), which, together with the amounts available from the trust account following any redemptions, would be sufficient to refinance Jason Incorporated’s existing indebtedness, pay a portion of the Cash Consideration, as well as for working capital and general corporate purposes. Non U.S. debt will not be repaid in connection with the Business Combination. See the section entitled “New Credit Facilities” for further information.
Senior Secured Credit Facilities
General. On February 28, 2013 (the “Closing Date”), Jason entered into the Senior Secured Credit Facilities with General Electric Capital Corporation (“GE Capital”), as Administrative Agent, L/C Issuer, Swingline Lender and as Lender, CapitalSource Bank and Sumitomo Mitsui Banking Corp, as Lenders (the “Lenders”), and GE Capital Markets, Inc. (“GE Capital Markets”), as Sole Lead Arranger and Bookrunner. The terms of the Senior Secured Credit Facilities are set forth in the credit agreement dated as of February 28, 2013, among Jason, GE Capital, the Lenders, and GE Capital Markets, as amended on November 14, 2013 (the “Credit Agreement”).
The Senior Secured Credit Facilities consist of a term loan facility and a revolving credit facility. The term loan facility was initially issued in the principal amount of $225.0 million; the Credit Agreement was amended on November 14, 2013 to increase the principal amount by $10.0 million. As of March 28, 2014 and December 31, 2013, the total outstanding amounts on the term loan facility were $228.8 million and $229.4
91
Table of Contents
million, respectively. The revolving credit facility has a principal amount of $35.0 million, which includes a $12.5 million sub-facility available for the issuance of letters of credit and a $10.0 million sub-facility available for same-day loans, called swingline loans, from GE Capital. Borrowings outstanding under the revolving loan facility totaled $15.6 million at March 28, 2014. There were no borrowings outstanding as of December 31, 2013. Subject to covenant compliance and certain conditions, Jason’s Senior Secured Credit Facilities permit additional, but uncommitted, loans of up to $90 million.
The revolving credit facility matures on February 28, 2018, and the term loan facility matures on February 28, 2019. Jason may have these maturities extended, subject to certain conditions including the consent of the affected lenders.
Commencing on the last day of the first full calendar quarter beginning 60 days after the Closing Date, the term loan facility will amortize in equal quarterly installments in an amount equal to 1.00% per annum of the original principal amount thereof, with the remaining balance due at final maturity.
Under the Senior Secured Credit Facilities, Jason must maintain a maximum net first lien coverage ratio of 4.50 to 1.00, decreasing gradually to 2.50 to 1.00 by the revolving credit facility’s maturity date. The maximum net first lien coverage ratio is tested quarterly and upon any extension of an incremental term loan or expansion of the amount Jason is allowed to borrow under the revolving credit facility.
The obligations under the Senior Secured Credit Facilities are guaranteed by Jason Partners Holdings Inc., Jason Holdings, Inc. I and each of its existing and subsequently acquired or formed direct and indirect domestic subsidiaries.
Security Interests. The borrowings under the Senior Secured Credit Facilities, all guarantees thereof and certain interest rate protection and other hedging arrangements contemplated thereby are secured by first priority perfected security interests in substantially all existing and after-acquired personal property and domestic real property, including, without limitation, 100% of all outstanding equity interests (or, in the case of first-tier foreign subsidiaries, 66% of the voting and 100% of the non-voting equity interests, if any) in Jason’s and its guarantors’ subsidiaries.
Interest Rates and Fees. Borrowings under the Senior Secured Credit Facilities bear interest at a rate equal to the applicable margin plus, at the borrower’s option, either: (i) a base rate determined by reference to the greatest of (a) the rate last quoted by the Wall Street Journal or another national publication selected by GE Capital, (b) the federal funds rate plus 0.50% and (c) the sum of LIBOR for an interest period of one month (giving effect to the minimum LIBOR rate of 1.25% per annum) plus the excess of the LIBOR applicable margin over the base rate applicable margin; or (ii) LIBOR plus the applicable margin. Interest is payable at the end of the relevant interest period but no less frequently than quarterly.
The applicable margin is a rate 2.75% in the case of loans paid at the base rate, and 3.75% per annum in case of loans paid at the LIBOR rate. If Jason goes into bankruptcy or experiences a payment event of default, its interest rate is increased by 2.00% over whatever it would otherwise be, and such excess interest is payable on demand.
Jason also pays the lenders a commitment fee on the unused commitments under its revolving credit facility, which is payable quarterly in arrears. The commitment fee is 0.50% per annum.
Mandatory Prepayment. Subject to certain conditions, Jason must prepay outstanding amounts under the Senior Credit Facilities under specified circumstances, including (a) excess cash flow, (b) debt issuances and (c) asset sales. Beginning with the fiscal year ended December 31, 2014, Jason will be obligated to make annual prepayments in an amount equal to 50% of excess cash flow (as defined in the Credit Agreement), with a reduction to 25% if Jason maintains a certain total leverage ratio, and subject to certain conditions. Jason will be
92
Table of Contents
obligated to prepay an amount equal to 100% of the net cash proceeds of issuances or incurrences of debt obligations by Jason or its subsidiaries if Jason incurs or issues new debt including as a result of the proceeds received in this transaction. If Jason or its subsidiaries sell any property or assets, Jason is obligated to prepay an amount equal to 100% of the net cash proceeds of such sale or other disposition unless such proceeds are reinvested in a specified timeframe.
Jason may voluntarily prepay loans under the Senior Secured Credit Facilities, subject to breakage costs and certain prepayment premiums (as defined in the Credit Agreement).
All indebtedness under the Credit Agreement will need to be repaid in full in connection with the consummation of the Business Combination. No fees will be incurred as part of the prepayment. However, unamortized deferred financing costs and debt discount associated with such indebtedness will be written off as a result of the prepayment; such amounts totaled $3,524 and $408, respectively, as of March 28, 2014 and $3,721 and $429, respectively, as of December 31, 2013.
Covenants. The Senior Secured Credit Facilities contain negative and affirmative covenants affecting Jason and its existing and future restricted subsidiaries, with certain exceptions set forth in the Credit Agreement. The negative covenants and restrictions include, among others: limitations on liens, dispositions of assets, consolidations and mergers, loans and investments, indebtedness, transactions with affiliates, management fees and compensation, use of proceeds, contingent obligations, compliance with U.S. Employee Retirement Income Security Act of 1974, as amended (“ERISA”), regulations promulgated by the Office of Foreign Assets Control (“OFAC”) and the Uniting and Strengthening America by Providing Appropriate Tools Required to Intercept and Obstruct Terrorism Act of 2001, as amended (the “PATRIOT Act”), dividends, distributions and other restricted payments, changes in business, changes in accounting, name and jurisdiction of organization, amendments to organizational documents and subordinated indebtedness, assumption of negative pledge obligations, sale-and-leaseback transactions, use of hazardous materials and capital expenditures.
The affirmative covenants include, among others: preservation of corporate existence, maintenance of licenses and intellectual property, of property and of insurance, payment of taxes, compliance with laws, inspection of property and books and records, use of proceeds, blocked account agreements, further assurances in respect of collateral matters and use of commercially reasonable efforts to deliver landlord, mortgagee and bailee waivers, environmental matters and maintenance of Moody’s and S&P credit ratings without regard to the level of such ratings.
Events of Default. Events of default include, among others: failure to pay principal, interest or any other amount when due, representations and warranties incorrect in any material respect when made or deemed made, failure to comply with covenants in the Credit Agreement and related documents, cross-default to other indebtedness and certain contingent obligations, failure to satisfy or stay execution of judgments, bankruptcy or insolvency, actual or asserted invalidity or impairment of any part of the Credit Agreement and related documents, and change of ownership or control.
New Credit Facilities
General. On June 30, 2014, Jason Incorporated, as the borrower, entered into (i) the First Lien Credit Agreement, dated as of June 30, 2014, with Jason Partners Holdings Inc., Jason Holdings, Inc. I, a wholly-owned subsidiary of Jason Partners Holdings Inc. (“Intermediate Holdings”), Deutsche Bank AG New York Branch, as administrative agent (the “First Lien Administrative Agent”), the subsidiary guarantors party thereto and the several banks and other financial institutions or entities from time to time party thereto (the “New First Lien Credit Agreement”) and (ii) the Second Lien Credit Agreement, dated as of June 30, 2014, with Jason Partners Holdings Inc., Intermediate Holdings, Deutsche Bank AG New York Branch, as administrative agent (the “Second Lien Administrative Agent”), the subsidiary guarantors party thereto and the several banks and other financial institutions or entities from time to time party thereto (the “New Second Lien Credit Agreement” and, together with the First Lien Credit Agreement, the “New Credit Agreements”).
93
Table of Contents
The New First Lien Credit Agreement provides for (i) term loans in an aggregate principal amount of $310.0 million (the “First Lien Term Facility” and the loans thereunder the “First Lien Term Loans”) and (ii) a revolving loan of up to $40.0 million (including revolving loans, a $10.0 million swingline loan sublimit and a $12.5 million letter of credit sublimit) (the “Revolving Credit Facility”), in each case under the new first lien senior secured loan facilities (the “First Lien Credit Facilities”). The New Second Lien Credit Agreement provides for term loans in an aggregate principal amount of $110.0 million under the new second lien senior secured term loan facility (the “Second Lien Term Facility” and the loans thereunder the “Second Lien Term Loans” and, the Second Lien Term Facility together with the First Lien Credit Facilities, the “New Credit Facilities”). Substantially concurrently with the consummation of the Business Combination, the full amount of the first lien terms loans and second lien term loans were drawn, and no revolving loans were drawn.
Security Interests. In connection with the New Credit Facilities, Jason Partners Holdings Inc., Intermediate Holdings, Jason Incorporated and certain of Jason Incorporated’s subsidiaries (the “Subsidiary Guarantors”), entered into a (i) First Lien Security Agreement (the “First Lien Security Agreement”), dated as of June 30, 2014, in favor of the First Lien Administrative Agent and (ii) a Second Lien Security Agreement (the “Second Lien Security Agreement”, together with the First Lien Security Agreement, the “Security Agreements”), dated as of June 30, 2014, in favor of the Second Lien Administrative Agent. Pursuant to the Security Agreements, amounts borrowed under the New Credit Facilities and any swap agreements and cash management arrangements provided by any lender party to the New Credit Facilities or any of its affiliates are secured (i) with respect to the First Lien Credit Facilities, on a first priority basis and (ii) with respect to the Second Lien Term Facility, on a second priority basis, by a perfected security interest in substantially all of Jason Incorporated’s, Jason Partners Holdings Inc.’s, Intermediate Holdings’ and each Subsidiary Guarantor’s tangible and intangible assets (subject to certain exceptions), including U.S. registered intellectual property and all of the capital stock of each of Jason Incorporated’s direct and indirect wholly-owned material Restricted Subsidiaries, including Jason Incorporated (limited, in the case of foreign subsidiaries, to 65% of the capital stock of first tier foreign subsidiaries). In addition, pursuant to the New Credit Agreements, Jason Partners Holdings Inc., Intermediate Holdings, Jason Incorporated and the Subsidiary Guarantors guaranteed amounts borrowed under the New Credit Facilities.
Interest Rate and Fees. At our election, the interest rate per annum applicable to the loans under the New Credit Facilities will be based on a fluctuating rate of interest determined by reference to either (i) a base rate determined by reference to the higher of (a) the “prime rate” of Deutsche Bank AG New York Branch (b) the federal funds effective rate plus 0.50% and (c) the Eurocurrency rate applicable for an interest period of one month plus 1.00%, plus an applicable margin equal to (x) 3.50%, in the case of the First Lien Term Loans, (y) 2.25% in the case of the Revolving Credit Facility or (z) 7.00% in the case of the Second Lien Term Loans or (ii) a Eurocurrency rate determined by reference to LIBOR, adjusted for statutory reserve requirements, plus an applicable margin equal to (x) 4.50%, in the case of the First Lien Term Loans, (y) 3.25% in the case of the Revolving Credit Facility or (z) 8.00% in the case of the Second Lien Term Loans. Borrowings under the First Lien Term Facility and Second Lien Term Facility will be subject to a floor of 1.00% in the case of Eurocurrency loans. The applicable margin for loans under the Revolving Credit Facility will be adjusted after the completion of Jason Incorporated’s first full fiscal quarter after the closing of the Business Combination based upon Jason Incorporated’s consolidated first lien net leverage ratio.
Mandatory Prepayment. Subject to certain exceptions, the New Credit Facilities are subject to mandatory prepayments in amounts equal to: (1) a percentage of the net cash proceeds from any non-ordinary course sale or other disposition of assets (including as a result of casualty or condemnation) by Jason Incorporated or any of its Restricted Subsidiaries (as defined in the New Credit Agreements) in excess of a certain amount and subject to customary reinvestment provisions and certain other exceptions; (2) 100% of the net cash proceeds from the issuance or incurrence of debt by Jason Incorporated or any of its Restricted Subsidiaries (other than indebtedness permitted by the New Credit Facilities); and (3) 75% (with step-downs to 50%, 25% and 0% based upon achievement of specified consolidated first lien net leverage ratios under the First Lien Credit Facilities and specified consolidated total net leverage ratios under the Second Lien Term Facility) of annual excess cash flow of Jason Incorporated and its Restricted Subsidiaries. With respect to the First Lien Term Loans, prior to the
94
Table of Contents
six-month anniversary of the Closing Date, a 1.00% prepayment premium is payable by Jason Incorporated in connection with certain repricing events. With respect to the Second Lien Term Facility, (i) any prepayments made prior to the one year anniversary of the Closing Date will be subject to a 3.00% prepayment premium, (ii) any prepayments made on or after the first anniversary of the Closing Date, but prior to the second anniversary of the Closing Date, will be subject to a 2.00% prepayment premium and (iii) any prepayments made on or after the second anniversary of the Closing Date, but prior to the third anniversary of the Closing Date, will be subject to a 1.00% prepayment premium. Other than the prepayment premiums and penalties described above and the payment of customary “breakage” costs, Jason Incorporated may voluntarily prepay outstanding loans at any time.
The First Lien Term Loans have a seven-year maturity and the Revolving Credit Facility has a five-year maturity. The Second Lien Term Loans have an eight-year maturity. The principal amount of the First Lien Term Loans amortizes in quarterly installments equal to 0.25% of the original principal amount of the First Lien Term Loans, with the balance payable at maturity. Neither the Revolving Credit Facility nor the Second Lien Term Loans amortize, however each is repayable in full at maturity.
Covenants. The New Credit Facilities contain a number of customary affirmative and negative covenants that, among other things, will limit or restrict the ability of Jason Incorporated and its Restricted Subsidiaries to: incur additional indebtedness (including guarantee obligations); incur liens; engage in mergers, consolidations, liquidations and dissolutions (other than pursuant to the transactions contemplated by the Purchase Agreement); sell assets; pay dividends and make other payments in respect of capital stock; make acquisitions, investments, loans and advances; pay and modify the terms of certain indebtedness; engage in certain transactions with affiliates; enter into negative pledge clauses and clauses restricting subsidiary distributions; and change its line of business, in each case, subject to certain limited exceptions. In addition, under the Revolving Credit Facility, if the aggregate outstanding amount of all Revolving Loans, swingline loans and certain letter of credit obligations exceed 25% of the revolving credit commitments at the end of any fiscal quarter, Jason Incorporated and its Restricted Subsidiaries will be required to not exceed a specified consolidated first lien leverage ratio.
Events of Default. The New Credit Facilities contain customary events of default, including nonpayment of principal, interest, fees or other amounts; material inaccuracy of a representation or warranty when made; violation of a covenant; cross-default to material indebtedness; bankruptcy events; inability to pay debts or attachment; material unsatisfied judgments; actual or asserted invalidity of any security document; and a change of control. Failure to comply with these provisions of the New Credit Facilities (subject to certain grace periods) could, absent a waiver or an amendment from the lenders under such agreement, restrict the availability of the Revolving Credit Facility and permit the acceleration of all outstanding borrowings under the New Credit Agreements.
Seasonality and Working Capital
Jason uses net operating working capital (“NOWC”) as a percentage of the previous twelve months of net sales as a key indicator of working capital management. Jason defines this metric as the sum of trade accounts receivable and inventories less trade accounts payable as a percentage of net sales. NOWC as a percentage of net sales was 14.4%, 13.3% and 13.4% as of December 31, 2011, 2012 and 2013, respectively. NOWC as a percentage of sales was 16.9% as of March 28, 2014. Set forth below is a table summarizing NOWC as of December 31, 2011, 2012 and 2013 and March 28, 2014.
| December 31, | March 28, 2014 |
|||||||||||||||
| 2011 | 2012 | 2013 | ||||||||||||||
| (in millions) | ||||||||||||||||
| Accounts receivable—net |
$ | 66.1 | $ | 70.2 | $ | 77.0 | $ | 110.4 | ||||||||
| Inventories |
67.6 | 72.2 | 72.3 | 76.7 | ||||||||||||
| Accounts payable |
(47.1 | ) | (55.2 | ) | (58.0 | ) | (70.7 | ) | ||||||||
|
|
|
|
|
|
|
|
|
|||||||||
| NOWC |
$ | 86.6 | $ | 87.2 | $ | 91.3 | $ | 116.4 | ||||||||
|
|
|
|
|
|
|
|
|
|||||||||
95
Table of Contents
In overall dollar terms, Jason’s NOWC is generally lower at the end of the calendar year due to reduced sales activity around the holiday season. NOWC peaks at the end of the first quarter as Jason experiences high seasonal demand from certain customers, particularly those serving the motor sports, lawn and garden equipment and small engine markets to fill the supply chain for the spring season. There are, however, variations in the seasonal demands from year to year depending on weather, customer inventory levels, and model year changes. Jason generates approximately 52-55% of sales in the first half of the year.
Jason pays its main suppliers based on credit terms that generally range from 30 to 60 days; at times, Jason will pay faster than 30 days if it is advantageous to do so, based on early payment discounts offered by its suppliers. Jason’s U.S. customers generally pay Jason on terms ranging from 30 to 50 days while terms outside the U.S., especially in certain parts of Europe, can extend beyond 50 days which is customary in these markets. Jason has not experienced any significant bad debts for the three years ended December 31, 2013, which Jason believes is the result of disciplined credit and collection policies and its strong customer base. On average, Jason holds about 50 day’s supply of inventory; however, inventory levels vary by each of Jason’s businesses with higher levels required by its finishing segment and lower levels held by its acoustics segment.
Short-Term and Long-Term Liquidity Requirements
Jason’s ability to make principal and interest payments on borrowings under its U.S. and foreign credit facilities and its ability to fund planned capital expenditures will depend on its ability to generate cash in the future, which, to a certain extent, is subject to general economic, financial, competitive, regulatory and other conditions. Based on current level of operations, Jason believes that its existing cash balances and expected cash flows from operations will be sufficient to meet its operating requirements for at least the next 12 months. However, Jason may require borrowings under its credit facilities and alternative forms of financings or investments to achieve its longer-term strategic plans.
Historically, Jason’s capital expenditures have ranged between 2% and 3% of annual sales with year to year fluctuations caused by the nature and timing of specific capital projects. Capital expenditures in 2013 and 2012 were higher than normal due to the replacement of assets destroyed in the November 2011 fire at Jason’s Newcomerstown, Ohio facility. These expenditures were funded from proceeds under Jason’s property insurance policy; however, the timing of these reimbursements lagged cash outlays due to the time required by the insurance carrier to review, approve and process the reimbursement claim. Capital expenditures for the year ended December 31, 2014 are expected to be approximately $24 million; however, this amount is an estimate and the actual amount of capital expenditures could differ materially. Jason is not anticipating significant capital expenditures in 2014 for replacement of assets lost in the Newcomerstown facility fire. The larger capital projects planned for 2014 include equipment for a new acoustics segment facility in Warrensburg, Missouri, a new metal perforating production line in the components segment, tooling for the launch of new turf care and heavy industry products in the seating segment and the expansion of an existing finishing segment facility in India. The total spending for these projects is expected to approximate $7 million. The Company anticipates spending another $5 to $10 million during 2014 on smaller capital projects to support growth initiatives and productivity improvements and the Company annually incurs replacement capital in the range of $5 to $10 million. The Company finances its annual capital requirements with funds generated from operations. As of December 31, 2013, there were outstanding commitments totaling $1.5 million associated with equipment for the acoustics segment. Jason’s former U.S. credit agreement contained covenants limiting its capital expenditures at levels above its expected capital expenditures for the expected life of the agreement.
Warrant Repurchase
On May 6, 2014, we commenced a tender offer to purchase up to 9,200,000 of the Public Warrants at a purchase price of $0.75 per Warrant, which was subsequently increased to $1.00 per warrant on June 18, 2014 and $1.50 per Warrant on July 7, 2014, subject to certain conditions, including the consummation of the Business
96
Table of Contents
Combination. The Warrant Tender Offer expired on July 18, 2014 and a total of 4,406,277 warrants were validly tendered and not properly withdrawn for a total purchase price of approximately $6,609,000.
Consolidated Condensed Statements of Cash Flows for the Three Months Ended March 29, 2013 and March 28, 2014
| Three Months Ended | ||||||||||||
| (in millions) | March 29, 2013 |
Variance | March 28, 2014 |
|||||||||
| Cash flows used in operating activities |
$ | (10.5 | ) | $ | (5.4 | ) | $ | (15.9 | ) | |||
| Cash flows provided by (used in) investing activities |
(4.8 | ) | 12.0 | 7.2 | ||||||||
| Cash flows provided by (used in) financing activities |
(7.3 | ) | (21.4 | ) | 14.1 | |||||||
| Effect of exchange rate changes on cash and cash equivalents |
(0.1 | ) | 0.2 | 0.1 | ||||||||
|
|
|
|
|
|
|
|||||||
| Net increase (decrease) in cash and cash equivalents |
(22.7 | ) | 28.2 | 5.5 | ||||||||
| Cash and cash equivalents at beginning of period |
29.5 | (13.2 | ) | 16.3 | ||||||||
|
|
|
|
|
|
|
|||||||
| Cash and cash equivalents at end of period |
$ | 6.8 | $ | 15.0 | $ | 21.8 | ||||||
|
|
|
|
|
|
|
|||||||
| Depreciation and amortization |
6.7 | (0.4 | ) | 6.3 | ||||||||
| Capital expenditures, net of insurance proceeds |
5.7 | (1.3 | ) | 4.4 | ||||||||
Three Months Ended March 29, 2013 Compared to Three Months Ended March 28, 2014
Cash Flows Provided by (Used in) Operating Activities
Cash flows used in operating activities totaled $10.5 million and $15.9 million for the three months ended March 29, 2013 and March 28, 2014, respectively.
Operating cash flows decreased $5.4 million in 2014 compared with 2013. Excluding the $3.1 million negative cash flow impact on the three months ended March 29, 2013 relating to the of the Newcomerstown Fire, operating cash flows were $8.5 million lower in 2014. The impact of changes in working capital levels not connected with the Newcomerstown fire activity resulted in a higher use of cash of $4.8 million during 2014. The increase in working capital (as reflected on the statement of cash flows) was attributable to an increase in accounts receivable ($8.3 million) and inventories ($3.3 million), a decrease in accrued interest ($0.9 million) and other net changes ($0.6 million), partially offset by increases in accounts payable ($1.8 million) and accrued income taxes ($6.6 million). The increase in accounts receivable was due to higher sales in 2014, combined with a lower than normal accounts receivable level at the year-end of 2013. The increase in inventories is also attributable to higher sales levels as inventory days on hand are in line with 2013 levels. The change in accrued interest is the result of the timing of interest payments related to the U.S. credit agreement; such payments are normally made at the end of the calendar quarter but this changed in February 2013 in connection with the 2013 Refinancing Transactions; additionally, the payment normally made in the fourth quarter of 2013 was made in January 2014. The accounts payable increase is also the result of higher business levels. The change in accrued income taxes was caused by higher taxable income in 2014 and timing of estimated tax payments. Operating cash flows were also negatively impacted by a $4.1 million change in deferred taxes due to the reversal of certain temporary differences primarily associated with accelerated depreciation and amortization.
Cash Flows Provided by (Used in) Investing Activities
Cash flows used in investing activities totaled $4.8 million for the three months ended March 29, 2013 while cash flows provided by investing activities totaled $7.2 million for the three months ended March 28, 2014.
During the three months ended March 28, 2014, Jason completed the sale of its 50% equity interests in two of its Asian joint ventures for a total of $11.5 million. Cash generated from the sale of the joint ventures and cash
97
Table of Contents
from the sale of assets of $0.1 million were partially offset by capital expenditures totaling $4.4 million. Cash flows used in investing activities for the three months ended March 29, 2013 were comprised of capital expenditures of $5.8 million, partially offset by cash proceeds of $0.2 million received from Jason’s insurance carrier for Newcomerstown replacement asset claims and $0.8 million from asset sales.
Cash Flows Provided by (Used in) Financing Activities
Cash flows used in financing activities totaled $7.3 million for the three months ended March 29, 2013, while cash flows provided by financing activities totaled $14.1 million for the three months ended March 28, 2014.
During 2013, Jason entered into a $260.0 million credit agreement with a syndicate of lenders as described more fully in the “Senior Secured Credit Facilities” section of this Management’s Discussion and Analysis of Financial Condition and Results of Operations. The new agreement included a six-year, $225.0 million senior secured term loan and a five-year, $35.0 million revolving loan facility. The Credit Agreement was subsequently amended in November 2013 to increase the term loan by $10.0 million. The proceeds from these borrowings totaling $235.0 million, along with $49.6 million of existing cash, were used to retire borrowings outstanding under Jason’s previous U.S. credit agreement in the amount of $178.5 million, pay accrued interest of $0.9 million, pay related transaction fees and other expenses of $13.7 million (including $3.7 million of capitalized debt issuance costs during the first quarter of 2013) and pay dividends to equityholders and redeem preferred stock in the aggregate amount of $91.5 million (of which $49.8 million was paid during the first quarter of 2013). In addition to the activity described above, Jason also had net borrowings under its U.S. revolving line of credit of $3.1 million and made net payments of $3.4 million on non U.S. debt facilities during the first quarter of 2013.
During 2014, funds provided by financing activities were comprised of net borrowings under the U.S. revolving line of credit of $15.5 million used to fund the seasonal increase in working capital, partially offset by net payments on U.S. term loans and non U.S. debt facilities of $0.6 million and $0.8 million, respectively.
Depreciation and Amortization
Depreciation and amortization totaled $6.7 million and $6.3 million for the three months ended March 29, 2013 and March 28, 2014, respectively. The $0.4 million decrease in 2014 was primarily caused by a reduction in depreciation expense as a large amount of shorter lived fixed assets became fully depreciated in 2013.
Capital Expenditures
Capital expenditures, net of proceeds from our property insurance carrier, totaled $5.7 million and $4.4 million for the three months ended March 29, 2013 and March 28, 2014, respectively. The decrease in 2014 of $1.3 million was primarily caused by a higher level of capital expenditures made in 2013 to replace assets lost in the Newcomerstown fire.
Consolidated Condensed Statements of Cash Flows for the Years Ended December 31, 2013, 2012 and 2011
| Year Ended December 31, | ||||||||||||||||||||
| (in millions) | 2011 | Variance | 2012 | Variance | 2013 | |||||||||||||||
| Cash flows provided by operating activities |
$ | 18.6 | $ | 8.2 | $ | 26.8 | $ | 31.3 | $ | 58.1 | ||||||||||
| Cash flows used in investing activities |
(49.9 | ) | 32.8 | (17.1 | ) | (1.1 | ) | (18.2 | ) | |||||||||||
| Cash flows provided by (used in) financing activities |
22.5 | (17.5 | ) | 5.0 | (58.3 | ) | (53.3 | ) | ||||||||||||
| Effect of exchange rate changes on cash and cash equivalents |
(0.1 | ) | 0.3 | 0.2 | (0.1 | ) | 0.1 | |||||||||||||
|
|
|
|
|
|
|
|
|
|
|
|||||||||||
| Net increase (decrease) in cash and cash equivalents |
(8.9 | ) | 23.8 | 14.9 | (28.2 | ) | (13.3 | ) | ||||||||||||
| Cash and cash equivalents at beginning of period |
23.7 | (9.0 | ) | 14.7 | 14.9 | 29.6 | ||||||||||||||
|
|
|
|
|
|
|
|
|
|
|
|||||||||||
| Cash and cash equivalents at end of period |
$ | 14.8 | $ | 14.8 | $ | 29.6 | $ | (13.3 | ) | $ | 16.3 | |||||||||
|
|
|
|
|
|
|
|
|
|
|
|||||||||||
| Depreciation and amortization |
20.2 | 4.0 | 24.2 | 2.8 | 27.0 | |||||||||||||||
| Capital expenditures, net of insurance proceeds |
16.3 | 1.5 | 17.8 | 1.3 | 19.1 | |||||||||||||||
| Cash paid for income taxes, net of refunds |
2.3 | 1.4 | 3.7 | 6.4 | 10.1 | |||||||||||||||
98
Table of Contents
Year Ended December 31, 2013 Compared to Year Ended December 31, 2012
Cash Flows Provided by Operating Activities
Cash flows provided by operating activities totaled $58.1 million and $26.8 million for the years ended December 31, 2013 and 2012, respectively.
Operating cash flow increased $31.3 million in 2013 compared with 2012 due to the receipt of higher cash proceeds from Jason’s insurance carrier for Newcomerstown Fire related claims. In 2013 this activity had a $14.3 million favorable impact on cash flows from operating activities compared with a negative $8.8 million impact in 2012 due to the lag in receiving reimbursement from our insurance carrier for incremental operating costs incurred as a result of the fire. Additionally, changes in working capital levels not connected with Newcomerstown Fire activity produced $6.3 million in positive cash flow for 2013 compared with a use of $8.5 million in 2012. The reduction in working capital (as reflected on the statement of cash flows) was attributable to a decrease in other current assets ($0.5 million) and inventories ($0.3 million) and increases in accounts payable ($2.5 million), accrued compensation and employee benefits ($0.5 million), accrued interest ($2.8 million), accrued income taxes ($1.1 million) and other current liabilities ($5.2 million) partially offset by increases in accounts receivable ($6.6 million).
The decrease in other current assets resulted from an increased level of value added tax refunds received in 2013 due to the timing of filing refund claims and lower customer tooling receivables from less tooling activity, both at Jason’s acoustics segment subsidiary in Mexico. The increase in accrued interest was due entirely to the timing of fourth quarter 2013 interest payments under the U.S. credit facility which were made in early January of 2014; interest on this facility was paid prior to the end of the year in 2012. Jason’s profitability has increased over recent years resulting in higher levels of income taxes and a higher accrual at the end of 2013 as compared to 2012. Other current liabilities increased in 2013 due to accruals for restructuring costs, professional fees and value added taxes. The accounts payable increase was in line with higher 2013 business levels. Despite higher overall business levels, inventories did not change significantly during the year which was due in most part to higher than normal inventory levels at the end of 2012 in our seating segment from weak demand for turf care products. The accounts receivable increase of $6.8 million represents a 10% increase over the December 31, 2012 balance and compares favorably with the 13% increase in net sales realized in the last two months of 2013 as compared with the same period in 2012 reflecting strong year end collection activity in our seating segment.
Cash Flows Used in Investing Activities
Cash flows used in investing activities of $18.2 million and $17.1 million for the years ended December 31, 2013 and 2012, respectively, are attributable to capital expenditures, including spending on assets to replace those destroyed in the Newcomerstown Fire less proceeds from the property insurance carrier and asset sales.
Cash flows used in investing activities in 2013 included $25.8 million for the purchase of capital assets and patents of which $5.7 million related to the purchase of assets to replace those destroyed in the Newcomerstown Fire. These outflows were partially offset by cash proceeds of $6.5 million received from our insurance carrier for Newcomerstown replacement asset claims and $1.0 million from asset sales. Cash flows used in investing activities in 2012 included $26.4 million for capital assets and patents of which $8.6 million related to the purchase of assets to replace those destroyed in the Newcomerstown Fire. These outflows were partially offset by cash proceeds of $8.5 million received from our insurance carrier and $0.8 million from asset sales.
Cash Flows Provided by (Used in) Financing Activities
Cash flows used in financing activities totaled $53.3 million for the year ended December 31, 2013, while cash flows provided by financing activities totaled $5.0 million for the year ended December 31, 2012.
During 2013, Jason entered into a $260.0 million credit agreement with a syndicate of lenders as described more fully in the “Senior Secured Credit Facilities” section of this Management’s Discussion and Analysis of Financial Condition and Results of Operations of Jason. The new agreement includes a six-year, $225.0 million
99
Table of Contents
senior secured term loan and a five-year, $35.0 million revolving loan facility. The Credit Agreement was subsequently amended to increase the term loan by $10.0 million. The proceeds from these borrowings totaling $235.0 million, along with $49.6 million of existing cash, were used to retire borrowings outstanding under Jason’s previous U.S. credit agreement in the amount of $178.5 million, pay accrued interest of $0.9 million, pay related transaction fees and other expenses of $13.7 million (including $4.0 million of capitalized debt issuance costs) and pay dividends to equityholders and redeem preferred stock in the aggregate amount of $91.5 million. In addition to the activity described above, Jason also reduced debt by $14.2 million during 2013.
During 2012, Jason received $7.5 million in cash from new term loans representing the final portion of a $45.0 million increase to its then existing credit agreement that was negotiated in 2011. The new loans were principally used to finance the $34.0 million purchase price of Morton and to retire senior subordinated notes of $6.9 million. Excluding the additional loans described above, Jason’s outstanding debt decreased $2.2 million during 2012. No scheduled principal payments on term loans exceeded new borrowings, the most significant of which related to new loans of $4.4 million at our acoustics segment operation in Mexico used to fund the start-up of a new manufacturing facility in Celaya.
Depreciation and Amortization
Depreciation and amortization totaled $27.0 million and $24.2 million for the years ended December 31, 2013 and 2012, respectively. The $2.8 million increase in 2013 was primarily caused by fixed assets being placed into service in 2013, related to prior year capital spending.
Capital Expenditures
Capital expenditures, net of proceeds from our property insurance carrier, totaled $19.1 million and $17.8 million for the years ended December 31, 2013 and 2012, respectively.
Cash Paid for Income Taxes
Cash paid for income taxes totaled $10.1 million and $3.7 million for the years ended December 31, 2013 and 2012, respectively.
The increase in cash paid for income taxes of $6.4 million from $3.7 million paid in 2012 compared to $10.1 million paid in 2013, was primarily attributable to an increase in U.S. taxable income. In 2013, Jason paid U.S. federal and state income taxes of $9.2 million and foreign income taxes of $0.9 million. Cash paid for income taxes in 2012 was comprised of U.S. federal and state income taxes of $2.4 million and foreign income taxes of $1.3 million.
Year Ended December 31, 2012 Compared to Year Ended December 31, 2011
Cash Flows Provided by Operating Activities
Cash flows provided by operating activities totaled $26.8 million and $18.6 million for the years ended December 31, 2012 and 2011, respectively.
Operating cash flow increased $8.2 million in 2012 due to several factors including improved cash profitability due primarily to the favorable impact of the Morton acquisition and higher organic sales. Additionally, working capital levels not connected with Newcomerstown Fire activity resulted in a use of cash of $8.5 million in 2012 and a use of cash of $15.7 million in 2011. In both years the increase in working capital was required to support higher business levels. The impact of the favorable variances described above was partially offset by a $6.5 million negative cash impact in 2012 from the lag in receiving reimbursements from our insurance carrier for claims relating to the Newcomerstown Fire. The increase in working capital (as reflected on the statement of cash flows) was attributable to an increase in accounts receivable ($3.8 million), inventories ($4.3 million), other current assets ($5.6 million) and decreases in accrued compensation and employee benefits ($1.8 million) and other current liabilities ($2.5 million) partially offset by increases in accounts payable ($8.4 million), accrued income taxes ($1.1 million).
100
Table of Contents
The accounts receivable increase of $3.8 million represents a 6% increase over the December 31, 2011 balance and is in line with the 6% increase in net sales experienced in the last two months of 2012 as compared with the same period in 2011. The accounts payable increase of $8.4 million represents a 17% increase over the December 31, 2011 balance; the percentage increase was higher than would be expected based on business levels due to a lower than normal accounts payable balance at the end of 2011 due to the timing of payments to suppliers. Inventories ended 2012 at levels higher than expected due primarily to weak demand for turf care products in our seating segment. The increase in other current assets resulted from high value added tax refunds receivable due to the timing of filing refund claims and higher customer tooling receivables from increased tooling activity, both at Jason’s acoustics segment subsidiary in Mexico. The decrease in accrued compensation and employee benefits occurred from lower incentive compensation accruals at the end of 2012 in the seating and components segments and the 2012 payment of severance accruals made in 2011 of $0.7 million associated with headcount reductions at our German operation in the finishing segment. Other current liabilities decreased in 2012 due to a number of factors including lower accruals for professional fees, pensions and insurance. Jason’s profitability has increased over recent years resulting in higher levels of income taxes and a higher accrual at the end of 2012 as compared to 2011.
Cash Flows Used in Investing Activities
Cash flows used in investing activities of $17.1 million and $49.9 million for the years ended December 31, 2012 and 2011, respectively, are attributable to capital expenditures, including spending on assets to replace those destroyed in the Newcomerstown Fire, and the cost of the 2011 acquisition of Morton, less proceeds from our property insurance carrier and asset sales.
Cash flows used in investing activities in 2012 included $26.4 million for capital assets and patents of which $8.6 million related to the purchase of assets to replace those destroyed in the Newcomerstown Fire. These outflows were partially offset by cash proceeds of $8.5 million received from our insurance carrier for Newcomerstown replacement asset claims and $0.8 million from asset sales. Cash flows used in investing activities during 2011 were comprised of capital expenditures of $16.3 million and cash paid for the acquisition of Morton of $34.0 million, partially offset by cash proceeds from asset sales of $0.4 million.
Cash Flows Provided by (Used in) Financing Activities
Cash flows provided by financing activities totaled $5.0 million and $22.5 million for the years ended December 31, 2012 and 2011, respectively.
During 2012, Jason received $7.5 million representing the final portion of the term loan funding relating to the credit agreement amendment described in the paragraph below. Excluding this increase, Jason’s outstanding debt decreased by $2.2 million principally from new loans of $10.1 million, including loans of $4.4 million at our acoustics segment operation in Mexico used to fund the start-up of a new manufacturing facility in Celaya, reduced by debt payments totaling $12.3 million.
During 2011, Jason amended its U.S. credit agreement to provide up to $45.0 million of new term loan financing, of which $37.5 million was funded in 2011 to partially finance the $34.0 million purchase of Morton and retire senior subordinated notes of $6.9 million. Excluding activity relating to the new term loan and senior subordinated notes, Jason reduced debt in the U.S. and at certain of its foreign locations by a total of $12.4 million and incurred financing costs of $2.6 million.
Depreciation and Amortization
Depreciation and amortization totaled $24.2 million and $20.2 million for the years ended December 31, 2012 and 2011, respectively. The $4.0 million increase for the year ended December 31, 2012 was primarily caused by depreciation and amortization on fixed and intangible assets acquired in connection with the purchase of Morton.
101
Table of Contents
Capital Expenditures
Capital expenditures, net of proceeds from our property insurance carrier, totaled $17.8 million and $16.3 million for the years ended December 31, 2012 and 2011, respectively.
Cash Paid for Income Taxes
Cash paid for income taxes totaled $3.7 million and $2.3 million for the years ended December 31, 2012 and 2011, respectively.
The increase in cash paid for income taxes of $1.4 million from $3.7 million paid in 2012 compared to $2.3 million paid in 2011, was attributable to an increase in U.S. taxable income, partially offset by lower income tax payments in certain foreign locations, most notably Brazil. In 2012, Jason paid U.S. federal and state income taxes of $2.4 million and foreign income taxes of $1.3 million. Cash paid for income taxes in 2011 was comprised of U.S. federal and state income taxes of $0.4 million and foreign income taxes of $1.9 million.
Commitments and Contractual Obligations
The following table presents Jason’s commitments and contractual obligations as of December 31, 2013, as well as its long-term obligations (in thousands):
| Payments Due by Period | ||||||||||||||||||||
| Total | 2014 | 2015-2016 | 2017-2018 | Thereafter | ||||||||||||||||
| Long-term debt obligations under U.S. credit agreement(1) |
$ | 229.4 | $ | 2.9 | $ | 4.7 | $ | 4.7 | $ | 217.1 | ||||||||||
| Other long-term debt obligations |
11.3 | 3.5 | 2.3 | 5.5 | — | |||||||||||||||
| Interest payments on long-term debt obligations(2) |
57.8 | 11.8 | 22.9 | 22.2 | 0.9 | |||||||||||||||
| Capital lease obligations(3) |
3.0 | 0.6 | 1.0 | 0.8 | 0.6 | |||||||||||||||
| Operating lease obligations(4) |
43.3 | 9.6 | 15.6 | 8.7 | 9.4 | |||||||||||||||
| Purchase obligations(5) |
9.7 | 8.2 | 1.5 | — | — | |||||||||||||||
| Other long-term liabilities(6) |
13.7 | — | — | — | — | |||||||||||||||
| Multiemployer and UK pension obligations(7) |
4.8 | 0.4 | 0.8 | 0.8 | 2.8 | |||||||||||||||
|
|
|
|
|
|
|
|
|
|
|
|||||||||||
| Total |
$ | 373.0 | $ | 37.0 | $ | 48.8 | $ | 42.7 | $ | 230.8 | ||||||||||
|
|
|
|
|
|
|
|
|
|
|
|||||||||||
| (1) | During 2013, Jason refinanced amounts outstanding under the U.S. credit agreement. See “Indebtedness” above for further information. |
| (2) | Amounts represent the expected cash payments of interest expense on long-term debt obligations and were calculated using interest rates in place as of December 31, 2013 and assuming that the underlying debt obligations will be repaid in accordance with their terms. |
| (3) | Amounts represent the expected cash payments of capital leases, including the expected cash payments of interest expense of approximately $0.5 million. |
| (4) | Operating leases represent the minimum rental commitments under non-cancelable operating leases. |
| (5) | Jason routinely issues purchase orders to numerous vendors for inventory and other supplies. These purchase orders are generally cancelable with reasonable notice to the vendor, and as such, are excluded from the obligations table. |
| (6) | Other long-term liabilities primarily consist of obligations for uncertain tax positions, pension obligations, postretirement health and other benefits, insurance accruals and other accruals. Other than payments required with respect to the former Morton multiemployer pension plan and a pension plan in the UK (see Note (7) below), Jason is unable to determine the ultimate timing of these liabilities and, therefore, no payment amounts were included in the contractual obligations table. |
| (7) | Represent contributions required with respect to the former Morton multiemployer pension plan as a result of the withdrawal from the plan and required contributions to the pension plan in the UK. |
102
Table of Contents
Off-Balance Sheet Arrangements
Jason leases certain machinery, transportation equipment and office, warehouse and manufacturing facilities under various operating lease agreements. Under most arrangements, Jason pays the property taxes, insurance, maintenance and expenses related to the leased property. See Note 11, “Lease Obligations” in the notes to the consolidated financial statements and the “Contractual Obligations” table above for further information.
Jason had outstanding letters of credit totaling $3.9 million at March 28, 2014 and $3.6 million and $4.6 million at December 31, 2013 and 2012, respectively, the majority of which secure self-insured workers compensation liabilities.
Critical Accounting Policies and Estimates
The preparation of financial statements in conformity with U.S. GAAP requires management to make estimates and assumptions that affect the reported amounts of assets and liabilities at the date of the financial statements and the reported amounts of revenues and expenses during the reporting period. Jason evaluates its estimates on an ongoing basis, based on historical experience and on various other assumptions that are believed to be reasonable under the circumstances. The following policies are considered by management to be the most critical in understanding the judgments that are involved in the preparation of our consolidated financial statements and the uncertainties that could impact our results of operations, financial position and cash flows. Application of these accounting policies involves the exercise of judgment and use of assumptions as to future uncertainties and, as a result, actual results could differ from these estimates. Although Jason has listed a number of accounting policies below which it believes to be the most critical, Jason also believes that all of its accounting policies are important to the reader. Therefore, please see Note 1, “Summary of Significant Accounting Policies” of the accompanying consolidated financial statements of Jason appearing elsewhere in this prospectus.
Inventories: Inventories are valued at the lower of cost or market. The first-in, first-out (FIFO) method is used to determine the cost for all inventories. The valuation of inventories includes material, labor and overhead and requires management to determine the amount of manufacturing variances to capitalize into inventories. Jason capitalizes material, labor and overhead variances into inventories based upon estimates of key drivers, which generally include raw material purchases (for material variances), standard labor (for labor variances) and calculations of inventory turnover (for overhead variances). In some cases, Jason has determined a certain portion of its inventories is excess or obsolete. In those cases, Jason writes down the value of those inventories to their net realizable value based upon assumptions about future demand and market conditions. Jason believes that such estimates are made based on consistent and appropriate methods; however, actual results may differ from estimates under different assumptions or conditions.
Goodwill, Other Intangible Assets and Other Long-Lived Assets: Jason’s goodwill, other intangible assets and tangible fixed assets are held at historical cost, net of depreciation and amortization, less any provision for impairment. Intangible and tangible assets with determinable lives are amortized or depreciated on a straight line basis over estimated useful lives as follows:
| Intangible Assets |
||
| Goodwill |
No amortization | |
| Patents |
Amortized over 7 years | |
| Customer relationships |
Amortized over 14 to 15 years | |
| Trademarks and other intangible assets |
Amortized over 10 years | |
| Tangible Assets |
||
| Land |
No depreciation | |
| Land improvements |
Depreciated over 20 years | |
| Buildings and improvements |
Depreciated over 2 to 40 years | |
| Machinery and equipment |
Depreciated over 7 to 10 years | |
103
Table of Contents
On an annual basis, or more frequently if triggering events occur, Jason compares the estimated fair value of its reporting units to the carrying value to determine if a potential goodwill impairment exists. If the fair value of a reporting unit is less than its carrying value, an impairment loss, if any, is recorded for the difference between the implied fair value and the carrying value of the unit’s goodwill. The estimated fair value represents the amount at which a reporting unit could be bought or sold in a current transaction between willing parties on an arms-length basis. In estimating the fair value, Jason uses a discounted cash flow model, which is dependent on a number of assumptions including estimated future revenues and expenses, weighted average cost of capital, capital expenditures and other variables. Jason also reviews other intangible assets and tangible fixed assets for impairment when events or changes in business circumstances indicate that the carrying amount of the assets may not be fully recoverable. If such indicators are present, Jason performs undiscounted cash flow analyses to determine if an impairment exists. If an impairment is determined to exist, any related impairment loss is calculated based on fair value.
A considerable amount of management judgment and assumptions is required in performing the impairment tests, principally in determining the fair value of each reporting unit and the specifically identifiable intangible and tangible assets. While Jason believes its judgments and assumptions are reasonable, different assumptions could change the estimated fair values and, therefore, additional impairment charges could be required. Refer to Note 8, “Assets Held for Sale” of Jason’s accompanying consolidated financial statements for further discussion on impairment charges.
Employee Benefit Plans: Jason provides a range of benefits to employees and certain former employees, including in some cases pensions and postretirement health care, although the majority of these plans are frozen to new participation. Jason recognizes pension and post-retirement benefit income and expense and assets and obligations that are based on actuarial valuations using a December 31 measurement date and that include key assumptions regarding discount rates, expected returns on plan assets, retirement and mortality rates, future compensation increases, and health care cost trend rates. The approach Jason uses to determine the annual assumptions are as follows:
| • | Discount Rate: Jason’s discount rate assumptions are based on the interest rate of high-quality corporate bonds, with appropriate consideration of our plans’ participants’ demographics and benefit payment terms. |
| • | Expected Return on Plan Assets: Jason’s expected return on plan assets assumptions are based on our expectation of the long-term average rate of return on assets in the pension funds, which is reflective of the current and projected asset mix of the funds and considers the historical returns earned on the funds. |
| • | Compensation Increase: Jason’s compensation increase assumptions reflect our long-term actual experience, the near-term outlook and assumed inflation. |
| • | Retirement and Mortality Rates: Jason’s retirement and mortality rate assumptions are based primarily on actual plan experience and mortality tables. |
| • | Health Care Cost Trend Rates: Jason’s health care cost trend rate assumptions are developed based on historical cost data, near-term outlook and an assessment of likely long-term trends. |
Jason reviews actuarial assumptions on an annual basis and makes modifications based on current rates and trends when appropriate. As required by GAAP, the effects of the modifications are recorded currently or amortized over future periods. Based on information provided by independent actuaries and other relevant sources, Jason believes that the assumptions used are reasonable; however, changes in these assumptions could impact our financial position, results of operations or cash flows. See Note 15, “Employee Benefit Plans” of the accompanying consolidated financial statements for further discussion.
Income Taxes: Jason is subject to income taxes in the United States and numerous foreign jurisdictions. Significant judgment is required in determining our worldwide provision for income taxes and recording the related deferred tax assets and liabilities. Jason assesses its income tax positions and records tax liabilities for all
104
Table of Contents
years subject to examination based upon management’s evaluation of the facts and circumstances and information available at the reporting dates. For those income tax positions where it is more-likely-than-not that a tax benefit will be sustained upon the conclusion of an examination, Jason has recorded the largest amount of tax benefit having a cumulatively greater than 50% likelihood of being realized upon ultimate settlement with the applicable taxing authority assuming that it has full knowledge of all relevant information. For those tax positions that do not meet the more-likely-than-not threshold regarding the ultimate realization of the related tax benefit, no tax benefit has been recorded in the financial statements. Jason recognizes deferred tax assets and liabilities for the future tax consequences attributable to differences between financial statement carrying amounts of existing assets and liabilities and their respective tax bases, net operating losses, tax credit and other carryforwards. Deferred tax assets and liabilities are measured using enacted tax rates expected to apply to taxable income in the years in which those temporary differences are expected to be recovered or settled. Jason regularly reviews its deferred tax assets for recoverability and establishes a valuation allowance based on historical losses, projected future taxable income and the expected timing of the reversals of existing temporary differences. As a result of this review, Jason has established valuation allowances against certain of our deferred tax assets relating to foreign and state net operating loss and credit carryforwards. Future tax authority rulings and changes in tax laws, changes in projected levels of taxable income and future tax planning strategies could affect the actual effective tax rate and tax balances recorded. See Note 14, “Income Taxes” of the accompanying consolidated financial statements for further discussion.
Use of Estimates: Jason records reserves or allowances for returns and discounts, doubtful accounts, inventory, incurred but not reported medical claims, environmental matters, warranty claims, workers compensation claims, product and non-product litigation and incentive compensation. These reserves require the use of estimates and judgment. Jason bases its estimates on historical experience and on various other assumptions that are believed to be reasonable under the circumstances. Jason believes that such estimates are made on a consistent basis and with appropriate assumptions and methods. However, actual results may differ from these estimates.
New Accounting Pronouncements
In July 2012, the Financial Accounting Standards Board (“FASB”) issued amended guidance that simplifies how entities test indefinite-lived intangible assets other than goodwill for impairment. After an assessment of certain qualitative factors, if it is determined to be more likely than not that an indefinite-lived asset is impaired, entities must perform the quantitative impairment test. Otherwise, the quantitative test is optional. The amended guidance is effective for annual and interim impairment tests performed for fiscal years beginning after September 15, 2012, with early adoption permitted. The adoption of this guidance did not have an impact on Jason’s consolidated financial statements.
In February 2013, the FASB issued guidance designed to improve the transparency in reporting amounts that are reclassified out of accumulated other comprehensive income into net income. This new guidance will require presentation of the effects on the line items of net income of significant amounts reclassified out of accumulated other comprehensive income and a cross-reference to other disclosure currently required for the reclassification items. The amended guidance is effective for reporting periods beginning after December 15, 2012. The adoption of this guidance did not have a material impact on Jason’s consolidated financial statements.
In March 2013, the FASB issued amended guidance for cumulative translation adjustments upon derecognition of certain subsidiaries or groups of assets within a foreign entity or of an investment in a foreign entity. These amendments provide guidance on releasing cumulative translation adjustments when a reporting entity ceases to have a controlling financial interest in a subsidiary or group of assets that is a nonprofit activity or a business within a foreign entity. In addition, these amendments provide guidance on the release of cumulative translation adjustment in partial sales of equity method investments and in step acquisitions. The amendments are effective on a prospective basis for fiscal years and interim reporting periods within those years, beginning after December 15, 2013. Early adoption is permitted. The adoption of this guidance is not expected to have a material impact on Jason’s consolidated financial statements.
105
Table of Contents
In July 2013, the FASB issued guidance designed to clarify the financial statement presentation requirements of an unrecognized tax benefit when a net operating loss carryforward, a similar tax loss or a tax credit carryforward exists. This guidance is effective for reporting periods beginning after December 15, 2013, and is not expected to have a material impact on Jason’s consolidated financial statements.
Quantitative and Qualitative Disclosures about Market Risk Interest Rate Risk
Jason is exposed to market risk from changes in foreign currency exchange rates and interest rates and, to a lesser extent, commodities. To reduce such risks, Jason selectively uses financial instruments and other proactive management techniques. All hedging transactions are authorized and executed pursuant to clearly defined policies and procedures, which strictly prohibit the use of financial instruments for trading or speculative purposes.
Currency Risk: Jason has manufacturing, sales and distribution operations around the world; therefore, exchange rates impact the U.S. Dollar (“USD”) value of our reported earnings, our investments in our foreign subsidiaries and the intercompany transactions with these subsidiaries. Approximately $147 million, or 22%, of our sales originated in a currency other than the U.S. dollar in 2013. As a result, fluctuations in the value of foreign currencies against the USD, particularly the Euro, may have a material impact on our reported results. Revenues and expenses denominated in foreign currencies are translated into USD using average exchange rates in effect during the period. Consequently, as the value of the USD changes relative to the currencies of our major markets, our reported results vary. For the year ended December 31, 2013, sales denominated in Euros approximated $102 million. Therefore, with a 10% increase or decrease in the value of the Euro in relation to the USD, our translated net sales (assuming all other factors are unchanged) would increase or decrease by $10.2 million, respectively, and our net income would increase or decrease by approximately $0.4 million, respectively. The net assets and liabilities of our non-U.S. subsidiaries which totaled approximately $44 million as of December 31, 2013 are translated into USD at the exchange rates in effect at year-end. The resulting translation adjustments are recorded in shareholders’ equity as cumulative translation adjustments. The translation adjustments recorded in other comprehensive income at December 31, 2013 resulted in an increase to shareholders’ equity of $0.6 million.
Transactional foreign currency exchange exposure results primarily from the purchase of products, services or equipment from affiliates or third party suppliers where the purchase value is significant, denominated in another currency and to be settled over an extended period, and from the repayment of intercompany loans between subsidiaries using different currencies. Jason periodically identifies areas where it does not have naturally offsetting currency positions and then may purchase hedging instruments to protect against potential currency exposures. As of December 31, 2013, Jason did not have any significant foreign currency hedging instruments in place nor did it have any significant sales or purchase commitments in currencies outside of the functional currencies of the operations responsible for satisfying such commitments. All long-term debt is held in the functional currencies of the operations that are responsible for the repayment of such obligations. As of December 31, 2013, long-term debt denominated in currencies other than the USD totaled approximately $11 million.
Interest Rate Risk: Jason utilizes a combination of short-term and long-term debt to finance our operations and is exposed to interest rate risk on our outstanding floating rate debt instruments that bear interest at rates that fluctuate with changes in certain short-term prevailing interest rates. Borrowings under U.S. credit facilities bear interest at rates tied to the greater of LIBOR or an established floor. During the years ended December 31, 2013, 2012 and 2011, LIBOR rates have been substantially lower than the designated floor in our U.S. credit facilities; therefore, interest rates have not been subject to change. Assuming that the rates remain below the floor, a 25 basis point increase or decrease in the applicable interest rates on our variable rate debt, excluding debt outstanding under the U.S. credit agreement would result in a minor change in interest expense on an annual basis. As of December 31, 2013, Jason did not have any interest rate swap or cap arrangements in place.
106
Table of Contents
Commodity risk: Jason sources a wide variety of materials and components from a network of global suppliers. While such materials are generally available from numerous suppliers, commodity raw materials, such as steel, aluminum, copper, fiber, foam chemicals, plastic resin, vinyl and cotton sheeting are subject to price fluctuations, which could have a negative impact on our results. Jason strives to pass along such commodity price increases to customers to avoid profit margin erosion and utilizes value analysis and value engineering (“VAVE”) initiatives to further mitigate the impact of commodity raw material price fluctuations as improved efficiencies across all locations are achieved. As of December 31, 2013, Jason did not have any commodity hedging instruments in place.
107
Table of Contents
Directors and Executive Officers
Our current directors and executive officers are as follows:
| Name |
Age | Position | ||||
| David C. Westgate |
52 | Chief Executive Officer, Director | ||||
| Stephen L. Cripe |
57 | Chief Financial Officer | ||||
| David A. Cataldi |
57 | President, Acoustics and Components Segments | ||||
| John J. Hengel |
55 | Vice President of Finance, Treasurer and Assistant Secretary | ||||
| William P. Schultz |
39 | General Counsel and Secretary | ||||
| Srivas Prasad |
45 | President, Seating Segment | ||||
| Dr. Florestan von Boxberg |
52 | President, Finishing Segment | ||||
| James P. Heffernan |
68 | Director | ||||
| Edgar G. Hotard |
70 | Director | ||||
| Robert H. Jenkins |
71 | Director | ||||
| Vincent L. Martin |
74 | Director | ||||
| Jeffry N. Quinn |
55 | Director, Chairman of the Board | ||||
| Dr. John Rutledge |
65 | Director | ||||
| James F. Stern |
51 | Director | ||||
| James M. Sullivan |
53 | Director | ||||
David C. Westgate has been our Chief Executive Officer and a director since June 30, 2014. Mr. Westgate has served as Jason Incorporated’s president and chief executive officer since 2004 and its chairman of the board of directors since 2008. Prior to joining Jason Incorporated, Mr. Westgate served as president and chief executive officer at Rieter Automotive Systems, a leading global supplier of systems solutions for the automotive industry, as well as president and chief executive officer at Solvay Automotive, Inc./Inergy Automotive Systems LLC, a leading global supplier of fuel and air management systems for the automotive industry. Mr. Westgate sits on the board of directors of Netshape Technologies, LLC and Boys & Girls Clubs of Greater Milwaukee. He holds an MBA from the University of Notre Dame.
Stephen L. Cripe has served as our Chief Financial Officer since June 30, 2014 and previously served in the same position of Jason Incorporated since 2007. Prior to joining Jason Incorporated, he was Chief Financial Officer of Gear Products at Rexnord Industries from 2005 to 2006. Mr. Cripe served as Group Controller of Manitowoc from 2003 to 2005 (Manitowoc acquired Grove Worldwide in 2002), as Vice President and CFO of Grove Worldwide from 1998 to 2003, and as Vice President-Finance at Tenneco Automotive from 1995 to 1998. Mr. Cripe holds a B.B.A. in accounting from Marquette University, and is a member of the American Institute of Certified Public Accountants.
David A. Cataldi has served as the President of our Acoustics and Components segments since June 30, 2014 and previously served as President of Acoustics since March 2005 and President of Components since May 2011 at Jason Incorporated. Prior to joining Jason Incorporated, he served in various leadership roles at Textron for 18 years. Before that, Mr. Cataldi worked at Sanmina-SCE, developing its automotive business. Mr. Cataldi holds a B.E. in industrial engineering from Youngstown State University and an M.B.A. from Southern New Hampshire College.
John J. Hengel has served as our Vice President of Finance, Treasurer and Assistant Secretary since June 30, 2014 and previously served as Vice President of Finance of Jason Incorporated since 1999. Prior to joining Jason Incorporated, he was a director in the audit and business advisory services practice at PricewaterhouseCoopers LLP from 1992 to 1999. Mr. Hengel is a Certified Public Accountant and a member of both the American and Wisconsin Institutes of Certified Public Accountants. He holds a B.S. in accounting from Carroll University.
108
Table of Contents
William P. Schultz has served as our General Counsel and Secretary since June 30, 2014 and previously served as the General Counsel of Jason Incorporated since June 2007. Prior to joining Jason Incorporated, he was an attorney in the Business Law Department of Reinhart Boerner Van Deuren s.c. from 2000 to May 2007. Mr. Schultz earned a B.A. in political science and philosophy from University of Wisconsin-Madison in 1997 and graduated cum laude from University of Wisconsin Law School in 2000.
Srivas Prasad has served as the President of our Seating segment since June 30, 2014 and previously served in the same position of Jason Incorporated since April 2014. Prior to joining Jason Incorporated, he served as Vice President—Business Development at Jason Incorporated from 2011 to 2014 and held key leadership positions in Jason Incorporated’s Acoustics segment from 2006 to 2010. Mr. Prasad holds a bachelor’s degree in engineering from Bangalore University and a masters in engineering from Lamar University.
Dr. Florestan von Boxberg has served as the President of our Finishing segment since June 30, 2014 and previously served in the same position of Jason Incorporated since 2010 and was president of Osborn Unipol International, where he started in 2006. He holds an MBA and a Ph.D. in economics from the University of Hamburg.
James P. Heffernan has been a director of the Company since August 2013, has served as a member of the Board of Directors of United Natural Foods, Inc. (“United”)(NASDAQ:UNFI), a distributor of natural and organic foods, since December 2000, and as a member of the Board of Directors of Command Security Corp. (“Command”)(AMEX:MOC), a provider of uniformed security officers, aviation security services, and support security services to commercial, financial, industrial, aviation, and governmental customers in the United States, since September 2010. Mr. Heffernan currently serves as Chairman of the Compensation Committee and as a member of the Audit Committee of United and Chairman of the Audit Committee of Command. Previously, Mr. Heffernan served as a member of the Board of Directors of Solutia Inc. (formerly NYSE:SOA), a performance materials specialty chemical manufacturer with global operations, from February 2008 until its acquisition by Eastman Chemical Co. in July 2012. From November 1998 to September 2012, Mr. Heffernan served as Vice Chairman and as a Trustee of the New York Racing Association, the governing body for thoroughbred racing at Belmont, Aqueduct and Saratoga. Prior to that, Mr. Heffernan served as Chief Financial Officer, Chief Operating Officer and as a member of the Board of Directors of Danielson Holding Corporation, which had ownership interests in a number of insurance and trust operations, from June 1990 to September 1996. He also served as a member of the Board of Directors and as Chairman of the Finance Committee of Columbia Energy Group (n/k/a NiSource, Inc.)(formerly NYSE:CG), a vertically integrated gas company with several billion dollars of annual revenues and assets, from January 1993 to November 2000 and as a member of the Board of Directors of Baldwin Piano & Organ Co. from June 2000 to May 2001. Prior to that, Mr. Heffernan served as President of WHR Management Corp., as General Partner of Whitman Heffernan & Rhein Workout Funds and as President of Whitman Heffernan & Rhein & Co., Inc., an investment banking firm specializing in corporate reorganizations, from May 1987 to September 1996. Prior to joining WHR Management Corp., Mr. Heffernan was an attorney with the New York based law firm Anderson, Kill & Olick, PC., where he specialized in corporate reorganizations, from September 1973 to May 1987.
Edgar G. Hotard has been a director of the Company since August 2013. Also, Mr. Hotard is a Venture Partner at ARCH Venture Partners, a provider of seed / early stage venture capital for technology firms in life sciences, physical sciences and advanced materials, since June 2002. He also serves as an Advisor to SIAD Macchine Impianti S.p.A. (“SMI”), a global supplier of compressors and air separation equipment since March 2010, and as Executive Chairman of SIAD Engineering (Hangzhou) Co. Ltd., the China subsidiary of SMI, a position he has held since December 2012, and as a Senior Consultant to Warburg Pincus, a global private equity firm, a position he has held since August 2013. Previously, Mr. Hotard served as an Operating Partner at HAO Capital, a private equity firm based in Beijing and Hong Kong, from November 2010 to December 2013, as an advisor to the Asia practice of Monitor Group, a global strategy-consulting firm and as non-executive Chairman of Monitor Group (China), from June 2000 to November 2010. Prior to that, Mr. Hotard served as President and Chief Operating Officer of Praxair, Inc. (“Praxair”) (NYSE:PX), a worldwide provider of industrial gases,
109
Table of Contents
including atmospheric, process and specialty gases, from July 1992 until his retirement in January 1999. In 1992, he co-led the spin-off of Praxair from Union Carbide Corporation (formerly NYSE:UK), a commodity and specialty chemical and polymers company where he served as Corporate Vice President from July 1990 to July 1992. Mr. Hotard currently serves as a member of the Board of Directors of Albany International Corp. (NYSE:AIN), a global advanced materials processing company serving the paper and aerospace industry, a position he has held since November 2006 and as a member of the Board of Directors of Baosteel Metals, a subsidiary of Baosteel Group Co. Ltd., since January 2013 and as a member of the Board of Directors of SIAD Macchine Impianti S.p.A. since May 2013. Previously, he served as a member of the Board of Directors of various public companies, including Global Industries Inc. (formerly NASDAQ:GLBL), a global offshore oil and gas engineering and construction service company, from 1999 to September 2011; Solutia Inc. (formerly NYSE:SOA), a performance materials specialty chemical manufacturer with global operations, from February 2011 to July 2012 and Shona Energy Company, Inc. (formerly TSX-V:SHO), an oil and natural gas exploration, development and production company, from July 2011 to December 2012. In addition, Mr. Hotard was a founding sponsor of the China Economic and Technology Alliance and a joint MBA program between Renmin University, Beijing, China and the School of Management of the State University of Buffalo, New York.
Robert H. Jenkins has been a director of the Company since June 30, 2014. He is the retired Chairman and Chief Executive Officer of Sundstrand Corporation, a diversified international company and the leading global supplier of aircraft electric generating systems for the aerospace industry. In 1999, Sundstrand merged with United Technologies Corporation. Prior to joining Sundstrand, Mr. Jenkins was Executive Vice President of Illinois Tool Works Inc. where he served for seventeen years in various business leadership roles. Mr. Jenkins began his business career with E.I. du Pont de Nemours & Company in 1966. Mr. Jenkins is the former Chairman of the Board of AK Steel Holding Corporation where he currently serves as Lead Director and Chairman of the Nominating & Governance Committee. He also serves on AK Steel’s Compensation Committee. He is a member of the board of directors for Acco Brands Corporation where he serves as Lead Director and serves on the Audit Committee. Mr. Jenkins also serves on the board of Clarcor, Inc. where he chairs the Compensation Committee and serves on the Nominating & Governance Committee. In 2003, Mr. Jenkins was selected by Board Alert as one of the year’s seven outstanding directors in the United States. He is a past member of the Board of Trustees for the Manufacturers Alliance and the National Association of Manufacturers. He is a member of the Board of Regents for the Milwaukee School of Engineering and a past member of the Economic Club of Chicago.
Vincent L. Martin has been a director of the Company since June 30, 2014 and previously served as a director of Jason Incorporated since co-founding Jason Incorporated in 1985. Mr. Martin previously served as Chairman and CEO of Jason Incorporated until 1999 and as Chairman until 2004, when he retired. Mr. Martin received a B.S. in Industrial Engineering from Stanford and an M.B.A. from Harvard. In addition to being a director of Jason, he serves on the board of directors of Husco International. He is a past board chair of the Milwaukee Repertory Theater, the United Performing Arts Fund, and the United Way of Greater Milwaukee and is currently active with a variety of non-profit organizations.
Jeffry N. Quinn is currently a director and the Chairman of our board of directors. Mr. Quinn was our President, Chief Executive Officer and Chairman from inception in May 2013 until June 30, 2014. He is also the founder, Chairman, Chief Executive Officer and Managing Member of our Sponsor’s managing member, Quinpario Partners LLC, and has served in such role since July 2012. Prior to forming Quinpario Partners LLC, Mr. Quinn was President, Chief Executive Officer and Chairman of the Board of Solutia Inc. (formerly NYSE: SOA), a global specialty chemical and performance materials company. From May 2004 to July 2012, Mr. Quinn served as the President and Chief Executive Officer of Solutia, and served as the Chairman of the Board from February 2006 to July 2012. Mr. Quinn became President and Chief Executive Officer of Solutia shortly after it had filed for bankruptcy. Over eight years as CEO of Solutia, Mr. Quinn oversaw its transformation from a domestically oriented commodity chemical company to one of the world’s leading specialty chemical firms. Solutia was sold to Eastman Chemical in July 2012. Mr. Quinn joined Solutia in 2003 as Executive Vice President, Secretary, and General Counsel. In mid-2003 he added the duties of Chief Restructuring Officer to help prepare the company for its eventual filing for reorganization under Chapter 11. During his tenure at Solutia,
110
Table of Contents
the company completed a number of divestitures and acquisitions as it reshaped its portfolio of businesses. It also completed a number of debt and equity offerings. Prior to joining Solutia, Mr. Quinn was Executive Vice President, Chief Administrative Officer, Secretary and General Counsel for Premcor Inc. (formerly NYSE: PCO), which at the time was one of the nation’s largest independent refiners. At that time Premcor was a portfolio company of Blackstone Capital Partners, a private equity fund. As general counsel of Premcor, Mr. Quinn was involved in the company’s initial public offering and listing on the New York Stock Exchange in 2002. Premcor was eventually sold to Valero Energy Corporation (NYSE: VLO) in 2005. Prior to Premcor, Mr. Quinn was Senior Vice President-Law & Human Resources, Secretary and General Counsel for Arch Coal, Inc. (NYSE: ACI). Mr. Quinn started at Arch Coal in 1986 when it was known as Arch Mineral Corporation. He became General Counsel in 1989. For the next eleven years Mr. Quinn was a member of the executive management team that grew Arch from a small regional coal producer to the nation’s second largest coal company. Mr. Quinn was involved in a number of mergers and acquisitions at Arch Coal, including the 1987 acquisition of the coal business of Diamond Shamrock Corporation, the 1997 merger with Ashland Coal, Inc., the 1998 acquisition of the U.S. business of Atlantic Richfield Company, and many other smaller transactions as well as the company’s initial public offering in 1997 as part of the Ashland Coal merger. Mr. Quinn is currently a member of the board of directors of Tronox Limited (NYSE: TROX), a fully integrated producer and marketer of titanium ore and titanium dioxide pigment, Ferro Corporation (NYSE: FOE), a global supplier of technology-based performance materials and chemicals for manufacturers, and W.R. Grace & Co. (NYSE: GRA), a global supplier of catalysts, engineered and packaging materials and specialty construction chemicals and building materials. Mr. Quinn received both a bachelor’s degree in Mining Engineering and a Juris Doctorate degree from the University of Kentucky.
Dr. John Rutledge has been a director of the Company since August 2013, is the founder of Rutledge Capital, a private equity investment firm that invests in U.S. middle market manufacturing, distribution, and service companies, and has served as its Chairman since 1990. Dr. Rutledge is also Chief Investment Strategist for Safanad SA, an investment firm based in Geneva, Switzerland since its inception in 2008. He also serves as Senior Research Professor at Claremont Graduate University since 2010, where he teaches economics and finance. Dr. Rutledge also serves as a CNBC Contributor since 2009. In addition, Dr. Rutledge is an Honorary Professor at the Chinese Academy of Sciences in Beijing and Chief Advisor for Finance and Investment to the Governor of the Haidian District in Beijing and has served in those capacities since 2007 and 2008, respectively. He is a senior fellow at the Pacific Research Institute and the Heartland Institute. In addition to his many advisory and board roles, Dr. Rutledge has written for Forbes.com and TheStreet.com. He also wrote the Forbes’ Business Strategy column from 1992 to 2002. He also founded Claremont Economics Institute, an economic advisory business, in 1978 and served as its Chairman from January 1979 to 1991. Dr. Rutledge has served as the director of a number of companies, including: American Standard (formerly NYSE: ASD), a manufacturer of plumbing, air conditioning, and automotive products; Earle M. Jorgensen Company (formerly NYSE: JOR), the largest independent distributor of metal products in North America; Lazard Freres Funds, a mutual fund; Amerindo Investment Fund, a mutual fund; CROM Corporation, a designer and manufacturer of prestressed concrete tanks; AdobeAir, a manufacturer of heating and cooling products; StairMaster, a manufacturer of fitness products; Fluidrive, a manufacturer of steerable, hydraulic axles for the agricultural and trucking industries; CST, a manufacturer of paper office products; Ellis Communications, an operator of television and radio companies; General Medical, a supplier of medical products; United Refrigeration, an operator of cold storage warehouses for the food industry; and Framed Picture Enterprise, a retailer in the framed art business. Dr. Rutledge was one of the principal architects of the Reagan economic plan in 1981 and was an adviser to the Bush White House on tax policy from 2001 to 2004. Dr. Rutledge began his career as a professor of economics at Tulane University and Claremont McKenna College. He holds a B.A. from Lake Forest College and a Ph.D. from the University of Virginia.
James F. Stern has been a director of the Company since June 30, 2014. He has served since 2007 as Executive Vice President of A. O. Smith Corporation (NYSE: AOS), a leading global innovator and manufacturer of residential and commercial water heating and treatment equipment. As a member of the executive management team, Mr. Stern focuses on strategy, corporate development activities and operations
111
Table of Contents
oversight; and, as General Counsel and Secretary, is responsible for the legal, compliance, government affairs, securities and governance functions of A. O. Smith. Mr. Stern was instrumental in A. O. Smith’s 2011 repositioning through the divestiture of its electric motor division to Regal Beloit Corporation and redeployment of capital as a focused water technology company. Prior to joining A. O. Smith, he was a partner from 1997 to 2007 with Foley & Lardner LLP, concentrating on mergers and acquisitions for public and private companies and advising corporate clients on a variety of governance, commercial and strategic matters. He also was an attorney with Latham & Watkins LLP and clerked for the Honorable Pasco M. Bowman III of the United States Eight Circuit Court of Appeals. Mr. Stern served as a member of the board of directors of the Polar Ware Company, a privately-held manufacturer of restaurant wares and beverage dispensing machines from 2007 until its sale in 2012, and currently serves on a number of charitable boards, including the Archdiocese of Milwaukee and the Fleck Foundation. Mr. Stern graduated from the University of Notre Dame (BA), Northwestern University School of Law (JD), and the Advanced Management Program at the Harvard Business School.
James M. Sullivan has been a director of the Company since June 30, 2014. He has been Executive Vice President and Chief Financial Officer of Joy Global, Inc. since December 2012, and has global responsibility for the company’s finances and accounting. Mr. Sullivan previously served as Chief Financial Officer of Solutia, Inc. from 2004 until its acquisition by Eastman Chemical Company in July 2012. Mr. Sullivan also served as Solutia’s Executive Vice President from 2009 until his departure and previously served as Senior Vice President from 2004 through 2009 and Treasurer from 2004 through 2011. Mr. Sullivan also served as Solutia’s Vice President and Controller from 1999 through 2004. At the time of his departure, Mr. Sullivan was responsible for Solutia’s finance activities, including controllership, internal audit, investor relations, tax, treasury, risk management, credit and collections, acquisitions and divestitures and information technology. Mr. Sullivan earned a Bachelor of Science in business administration and finance from St. Louis University and his masters of business administration from Washington University.
Classified Board of Directors
Our board of directors is currently classified into three classes, each comprising as nearly as possible one-third of the directors to serve three year terms. Our first class of directors consists of Messrs. Heffernan, Sullivan and Stern, whose terms expire at our 2015 annual meeting of stockholders. Our second class of directors consists of Messrs. Jenkins, Martin and Rutledge, whose terms expire at our 2016 annual meeting of stockholders. Our third class of directors consists of Messrs. Hotard, Quinn and Westgate, whose terms expire at our 2017 annual meeting of stockholders.
Independent Directors
Messrs. Heffernan, Hotard, Jenkins, Martin, Rutledge, Stern, and Sullivan qualify as independent directors in accordance with the listing requirements of Nasdaq. The Nasdaq independence definition includes a series of objective tests, such as that the director is not, and has not been for at least three years, one of our employees and that neither the director, nor any of his family members has engaged in various types of business dealings with us. In addition, as further required by the Nasdaq rules, our board of directors has made a subjective determination as to each independent director that no relationships exist which, in the opinion of our board of directors, would interfere with the exercise of independent judgment in carrying out the responsibilities of a director. In making these determinations, our board of directors reviewed and discussed information provided by the directors and us with regard to each director’s business and personal activities and relationships as they may relate to us and our management.
Board Committees
The standing committees of our board of directors currently consists of an Audit Committee, Compensation Committee and a Corporate Governance and Nominating Committee. Each of the committees report to the board of directors as they deem appropriate and as the board may request. The composition, duties and responsibilities of these committees are set forth below.
112
Table of Contents
Audit Committee
The Audit Committee is responsible for, among other matters: (1) reviewing and discussing with management and the independent auditor the annual audited financial statements, and recommending to the board whether the audited financial statements should be included in our Form 10-K; (2) discussing with management and the independent auditor significant financial reporting issues and judgments made in connection with the preparation of our financial statements; (3) discussing with management major risk assessment and risk management policies; (4) monitoring the independence of the independent auditor; (5) verifying the rotation of the lead (or coordinating) audit partner having primary responsibility for the audit and the audit partner responsible for reviewing the audit as required by law; (6) reviewing and approving all related-party transactions; (7) inquiring and discussing with management our compliance with applicable laws and regulations; (8) pre-approving all audit services and permitted non-audit services to be performed by our independent auditor, including the fees and terms of the services to be performed; (9) appointing or replacing the independent auditor; (10) determining the compensation and oversight of the work of the independent auditor (including resolution of disagreements between management and the independent auditor regarding financial reporting) for the purpose of preparing or issuing an audit report or related work; and (11) establishing procedures for the receipt, retention and treatment of complaints received by us regarding accounting, internal accounting controls or reports which raise material issues regarding our financial statements or accounting policies.
Our Audit Committee consists of Messrs. Heffernan, Rutledge, and Sullivan, with Mr. Sullivan serving as the Chair. We believe that Messrs. Heffernan, Rutledge, and Sullivan qualify as independent directors according to the rules and regulations of the SEC with respect to audit committee membership. We also believe that Mr. Sullivan qualifies as our “audit committee financial expert,” as such term is defined in Item 401(h) of Regulation S-K. Our board of directors has adopted a written charter for the Audit Committee, which is available on our corporate website at www.jasoninc.com.
Compensation Committee
The Compensation Committee is responsible for, among other matters: (1) reviewing key employee compensation goals, policies, plans and programs; (2) reviewing and approving the compensation of our directors, chief executive officer and other executive officers; (3) reviewing and approving employment agreements and other similar arrangements between us and our executive officers; and (4) administering our stock plans and other incentive compensation plans.
Our Compensation Committee consists of Messrs. Heffernan, Jenkins, and Stern, with Mr. Jenkins serving as the Chair. Our board of directors has adopted a written charter for the Compensation Committee, which is available on our corporate website at www.jasoninc.com.
Corporate Governance and Nominating Committee
Our Corporate Governance and Nominating Committee is responsible for, among other matters: (1) identifying individuals qualified to become members of our board of directors, consistent with criteria approved by our board of directors; (2) overseeing the organization of our board of directors to discharge the board’s duties and responsibilities properly and efficiently; (3) identifying best practices and recommending corporate governance principles; and (4) developing and recommending to our board of directors a set of corporate governance guidelines and principles applicable to us.
Our Corporate Governance and Nominating Committee consists of Messrs. Hotard, Jenkins, Martin, and Quinn, with Mr. Quinn serving as the Chair. Our board of directors has adopted a written charter for the Corporate Governance and Nominating Committee, which is available on our corporate website at www.jasoninc.com.
113
Table of Contents
Compensation Committee Interlocks and Insider Participation
During 2013, no officer or employee served as a member of the Company’s Compensation Committee. None of our executive officers serve as a member of the board of directors or compensation committee of any entity that has one or more executive officers serving on our board of directors or Compensation Committee.
Code of Ethics
We have adopted a Code of Ethics that applies to all of our employees, including our chief executive officer, chief financial officer and principal accounting officer. Our Code of Ethics is available on our website at www.jasoninc.com. If we amend or grant a waiver of one or more of the provisions of our Code of Ethics, we intend to satisfy the requirements under Item 5.05 of Form 8-K regarding the disclosure of amendments to or waivers from provisions of our Code of Ethics that apply to our principal executive officer, principal financial officer and principal accounting officer by posting the required information on our website at the above address. Our website is not part of this prospectus.
114
Table of Contents
The following discussion relates to the historical compensation of Jason Incorporated prior to the Business Combination.
Compensation Discussion and Analysis
The purpose of this compensation discussion and analysis section is to provide information about the material elements of compensation that were paid, awarded to, or earned by, our “named executive officers,” who consisted of Jason’s principal executive officer, Jason’s principal financial officer, and the three other most highly compensated Jason executive officers. For fiscal year 2013, such named executive officers, were:
| • | David C. Westgate, Chief Executive Officer; |
| • | Stephen Cripe, Chief Financial Officer; |
| • | David Cataldi, President, Acoustics and Components segments; |
| • | Sean Cummings, President, Seating segment; and |
| • | John Hengel, Vice-President, Finance. |
For purposes of this prospectus, we are including Sean Cummings as one of our named executive officers, who was Jason Incorporated’s President of our Seating segment for fiscal year 2013, however Mr. Cummings separated from Jason Incorporated on March 21, 2014.
Historical Compensation Decisions
Jason’s compensation program was driven in part by the fact that it was a privately-held company. As a result, Jason has not been subject to any stock exchange listing or SEC rules requiring a majority of Jason’s board of directors to be independent or relating to the formation and functioning of board committees, including audit, compensation and nominating committees. Most, if not all, of Jason’s prior compensation policies and determinations, including those made for fiscal year 2013, have been the product of discussions between Jason’s Chief Executive Officer and the compensation committee of the Seller (the “Seller Compensation Committee”) except that in the case of Jason’s Chief Executive Officer, compensation decisions were made primarily by the Seller Compensation Committee.
Compensation Philosophy and Objectives
Jason’s Compensation Philosophy and Objectives
Jason strived to create an executive compensation program that balanced short-term versus long-term payments and awards, cash payments versus equity awards and fixed versus contingent payments and awards in ways that Jason believed were the most appropriate to motivate Jason’s executive officers. Jason’s executive compensation program was designed to:
| • | attract and retain talented and experienced executives in Jason’s industry; |
| • | reward executives whose knowledge, skills and performance were critical to Jason’s success; |
| • | align the interests of Jason’s executive officers and stockholders by motivating executive officers to increase stockholder value and rewarding executive officers when stockholder value increases; |
| • | ensure fairness among the executive management team by recognizing the contributions each executive makes to Jason’s success; |
| • | foster a shared commitment among executives by aligning their individual goals with the goals of the executive management team and Jason; and |
| • | compensate executives in a manner that incentivizes them to manage the business to meet long-range objectives. |
115
Table of Contents
Compensation for the named executives has been based on a variety of factors including, in addition to the factors listed above, Jason’s financial condition and available resources, the need for the applicable position to be filled and the compensation levels of the other executive officers, each as of the time of the applicable compensation decision. In addition, Jason conducted benchmarking of the competitive market for corresponding positions within comparable geographic areas and companies of similar size and stage of development operating in Jason’s industry. This information is supplemented with discussions with recruiting firms and the experience and knowledge of the Seller Compensation Committee. Jason’s Chief Executive Officer, after thorough discussion of the various factors with Jason’s Seller Compensation Committee, made compensation decisions for Jason’s executive officers. These discussions not only took place at the time of hire of the named executive, but at any time a material compensation decision was being contemplated for a named executive.
Our Compensation Philosophy and Objectives
Following our Business Combination, we formed a Compensation Committee, which is tasked with reviewing and approving the compensation of our named executive officers and overseeing and administering our executive compensation programs and initiatives. As we gain experience as a public company, we expect that the specific direction, emphasis and components of our executive compensation program will continue to evolve. We also anticipate that our Compensation Committee may make adjustments in executive compensation levels and existing Jason arrangements in the future as we continue to review the competitiveness of our compensation package for the named executives and implement formal benchmarking. Accordingly, the compensation paid to Jason’s named executive officers for fiscal year 2013 is not necessarily indicative of how we will compensate our named executive officers in the future.
Compensation Committee Procedures
The Seller Compensation Committee has historically met in the first quarter of the year to review and approve the appropriate base salary and cash performance awards for the Jason executive officers. Further, when necessary, the Seller Compensation Committee has met with Jason’s Chief Executive Officer to approve the grants of profits interests for Jason’s executive officers. The Seller Compensation Committee has met outside of the presence of Jason’s Chief Executive Officer when discussing appropriate compensation, including grants of long-term equity incentive awards, for Jason’s Chief Executive.
Going forward, our Compensation Committee will analyze the performance of our executives and determine the base salary, cash performance awards and grants of long-term equity incentive awards based on its assessment.
Elements of Compensation
We have determined that any risks arising from our or Jason’s compensation programs and policies are not reasonably likely to have a material adverse effect on the Company. Jason’s compensation programs and policies mitigate risk by combining performance-based, long-term compensation elements with payouts that are highly correlated to the value delivered to stockholders, and we intend to continue such practice. The combination of performance measures for annual bonuses and the equity compensation programs, share ownership and retention guidelines for executive officers, as well as the multi-year vesting schedules for equity awards, have encouraged and will encourage employees to maintain both a short and a long-term view with respect to performance.
Jason’s executive compensation program, which was set by the Seller Compensation Committee, consisted of the following components:
| • | base salary; |
| • | annual cash incentive awards linked to Jason’s overall performance and, where applicable, to the performance of the relevant business units; |
116
Table of Contents
| • | periodic grants of long-term equity-based compensation, such as profits interests; |
| • | other executive benefits and perquisites; and |
| • | employment agreements, which contain termination and change of control benefits. |
Jason combined these elements in order to formulate compensation packages that provide competitive pay, reward the achievement of financial, operational and strategic objectives and align the interests of Jason’s executive officers and other senior personnel with those of Jason’s stockholders.
Pay Mix
Jason and the Seller utilized the particular elements of compensation described above because Jason and the Seller believed that such elements provide a well-proportioned mix of secure compensation, retention value and at-risk compensation which produces short-term and long-term performance incentives and rewards. By following this approach, Jason provided the executive a measure of security in the minimum expected level of compensation, while motivating the executive to focus on business metrics that will produce a high level of short-term and long-term performance for Jason and the Seller and long-term wealth creation for the executive, as well as reducing the risk of recruitment of top executive talent by competitors. The mix of metrics used for Jason’s annual performance bonus and long-term incentive program likewise provides an appropriate balance between short-term financial performance and long-term financial and stock performance.
For key Jason executives, the mix of compensation was weighted toward at-risk pay (annual incentives and long-term incentives). This weighting towards at-risk pay is intended to link executive officers performance to the overall performance of the Company. As discussed above, the target annual incentives and number of long term incentive grants varied by position based upon the assessment of the Seller Compensation Committee and Jason’s Chief Executive Officer.
Going forward, we intend to maintain a similar pay mix, which will generally result in a pay-for-performance orientation for our executives that is aligned with our compensation philosophy of paying our employees competitively.
Base Salary
A primary component of Jason’s compensation of its executive officers has historically been base salary. The base salary established for each of Jason’s executive officers was intended to reflect relevant factors such as each individual’s responsibilities, experience, and prior performance. Base salary was also designed to provide Jason’s executive officers with steady cash flow during the course of the fiscal year that was not contingent on short-term variations in Jason’s corporate performance. Jason’s Chief Executive Officer working closely with the Seller Compensation Committee determined market level compensation for base salaries based on the Jason executives’ experience in the industry, with reference to the base salaries of similarly situated executives in other companies of similar size and stage of development operating in the global diversified industrials segment.
A key factor in Jason’s historic annual salary increases has been executive performance as compared to pre-determined quantitative performance objectives. These performance objectives are aligned with the long-term business objectives that were defined by the Seller’s board of directors and Jason’s Chief Executive Officer. Jason’s overall performance also factored into the annual salary increases.
With these principles in mind, base salaries were reviewed during the first quarter of the fiscal year by the Seller Compensation Committee and Jason’s Chief Executive Officer, and were adjusted from time to time based on the results of this review. In past years, Jason’s Chief Executive Officer discussed the performance of all executive officers with the Seller Compensation Committee and based on this discussion and any relevant competitive market data made available to him or them during the past year, the Seller Compensation Committee
117
Table of Contents
set the executive compensation package for each executive officer for the coming year. During fiscal year 2013, adjustments to the base salaries of the named executive officers ranged from no increases to increases of 4.7%. The base salaries paid to our named executive officers in fiscal year 2013 are set forth in the Summary Compensation Table below.
Going forward, our Compensation Committee will determine base salaries and manage the base salary annual review and process.
Bonus
Annual Bonus
Jason’s Chief Executive Officer and the Seller Compensation Committee had the authority to award annual cash bonuses to Jason’s executive officers (except that only the Seller Compensation Committee could award an annual cash bonus to Jason’s Chief Executive Officer). The annual cash bonuses were intended to offer incentive compensation by rewarding the achievement of corporate and individual performance objectives. The Seller Compensation Committee designed Jason’s Management Incentive Compensation Plan (the “Jason MIC”), a plan intended to motivate and reward key Jason personnel who contributed materially to EBITDA growth, Operating Cash Flow generation, and achievement of other business objectives.
On an annual basis, or at the commencement of an executive officer’s employment with Jason, Jason’s Chief Executive Officer and the Seller Compensation Committee typically set a target level of bonus compensation that is structured as a percentage of such executive officer’s annual base salary. Depending upon corporate and individual performance, an executive officer could receive up to 125% of his or her target bonus amount. As referenced above, the performance metrics and objectives were weighted by Jason’s Chief Executive Officer and the Seller Compensation Committee so that the amount of an individual’s bonus is comprised of three elements: EBITDA Bonus which comprises 70% of the overall bonus, Operating Cash Flow Bonus which comprises 20% of the overall bonus, and a discretionary portion of the bonus which comprises 10% of the overall bonus.
The Seller Compensation Committee had full power to amend, modify, construe and interpret the Jason MIC, including, without limitation to modify definitions and adjust EBITDA Targets and Operating Cash Flow Targets for nonrecurring or extraordinary events.
For fiscal year 2013, our Chief Executive Officer and the Seller Compensation Committee established the target percentage amounts for the cash bonuses for each of Jason’s named executive officers. For fiscal year 2013, the target bonus levels of Messrs. Westgate, Cripe, Cataldi, Hengel, and Cummings were 125%, 100%, 100%, 40% and 100% of their fiscal year 2013 base salaries, respectively. As a result of their performance under the Jason MIC for fiscal year 2013, Messrs. Westgate, Cripe, Cataldi, Hengel, and Cummings earned cash bonuses in respect of fiscal year 2013 (but paid in fiscal year 2014) of 134%, 107%, 110%, 42.8% and 102.5% of their fiscal year 2013 base salaries, respectively. Our bonuses are generally paid in the first quarter of the year following the bonus year.
Special Transaction Bonus
In addition to Jason’s annual bonus program, in 2013, Jason awarded certain directors and executives, including the named executive officers, a transaction bonus to reward such individuals for their contributions to a successful consummation of a series of transactions pursuant to which the Seller redeemed its outstanding preferred stock and made distributions to certain of its equity holders. These transaction bonuses were not previously agreed to with the recipients, but our board of directors determined that such awards were appropriate in light of the efforts of the recipients in respect of the transactions.
118
Table of Contents
Long-Term Equity-Based Compensation
Jason’s Chief Executive Officer and the Seller’s board of directors believed that equity-based compensation is an important component of an executive compensation program and that providing a significant portion of executive officers’ total compensation package in equity-based compensation aligns the incentives of executives with the interests of stockholders and with long-term corporate success by rewarding the creation of stockholder value over time. Additionally, Jason’s Chief Executive Officer and the Seller’s board of directors believed that equity-based compensation awards enabled Jason to attract, motivate, retain and adequately compensate executive talent. To that end, the Seller awarded equity-based compensation in the form of profits interests to Jason executives.
Profits Interests
Generally, each Jason executive officer was provided with an equity grant in the form of profits interests in the Seller when they joined Jason based upon his or her position and relevant prior experience. Profits interests entitle the holder to participate in the profits of the issuing entity (here, the Seller) to the extent such profits, as measured upon certain events, exceed the “threshold amount” applicable to such profits interests. The “threshold amount” generally refers to the value of the assets of the issuing entity (here, the Seller) on the relevant grant date.
The profits interests grants were made in two forms of units: Class E-1 profits interests units and Class E-2 profits interests units. Class E-1 profits interests units are time vesting units that vest over a period of four years with twenty-five percent vesting on each of the first four anniversary dates as long as the holder is then employed on a full-time basis by the Seller or its subsidiaries. Further, upon the consummation of a change in control of the Seller, unvested E-1 profits interests units vest if the holder is then employed on a full-time basis by the Seller or its subsidiaries. Class E-2 profits interests units generally vest upon the consummation of a change in control of the Seller that achieves certain performance criteria as long as the holder is then employed on a full-time basis by the Seller or its subsidiaries. For the sake of clarity, a sale of Jason (including this Business Combination) will constitute a change of control of the Seller but not a change in control under Jason’s existing employment agreements with its named executive officers.
In addition to the profits interests granted upon hiring, the Seller Compensation Committee has made other grants of profits interests to retain Jason executives and to recognize the achievement of corporate and individual goals or strong individual performance. Such profits interests awards have also been in the form of Class E-1 and Class E-2 profits interests units.
Historically, the Seller Compensation Committee and Jason’s Chief Executive Officer have made all equity grant decisions with respect to Jason’s executive officers, and the Seller Compensation Committee, without Jason’s Chief Executive Officer, has made all equity grant decisions with respect to Jason’s Chief Executive Officer. The Seller Compensation Committee and Jason’s Chief Executive Officer considered many factors when determining the size of an equity grant, including how the responsibilities of an individual’s position could impact the Seller or Jason’s business goals and results. The Seller and Jason have not used formal benchmarking to determine the size of equity grants made to executive officers.
2014 Equity Incentive Plan
Following the Business Combination, we have discontinued the use of profits interests and intend to award incentive equity awards under the Jason Industries, Inc. 2014 Omnibus Incentive Plan (the “2014 Omnibus Incentive Plan”). We further anticipate that going forward, our board of directors or Compensation Committee will primarily determine the size and terms and conditions of equity grants made to all of our executive officers whether under the 2014 Omnibus Incentive Plan or otherwise after reviewing market data and consultation with our independent consultants.
119
Table of Contents
The 2014 Omnibus Incentive Plan will provide for grants of stock options, stock appreciation rights, restricted stock awards, performance awards, other stock-based awards and other cash-based awards. Directors, officers and other employees of us and our subsidiaries, as well as others performing consulting or advisory services for us, will be eligible for grants under the 2014 Omnibus Incentive Plan. The purpose of the 2014 Omnibus Incentive Plan is to provide incentives that will attract, retain and motivate high performing officers, non-employee directors, employees and consultants by providing them with appropriate incentives and rewards either through a proprietary interest in our long-term success or compensation based on their performance in fulfilling their personal responsibilities. Set forth below is a summary of the material terms of the 2014 Omnibus Incentive Plan. This summary is qualified in its entirety by reference to the complete text of the 2014 Omnibus Incentive Plan, a copy of which is attached as an exhibit to the registration statement of which this prospectus is a part.
Administration
The 2014 Omnibus Incentive Plan will be administered by the Compensation Committee. Among the Compensation Committee’s powers will be to determine the form, amount and other terms and conditions of awards; clarify, construe or resolve any ambiguity in any provision of the 2014 Omnibus Incentive Plan or any award agreement; amend the terms of outstanding awards; and adopt such rules, forms, instruments and guidelines for administering the 2014 Omnibus Incentive Plan as it deems necessary or proper. The Compensation Committee will have the authority to administer and interpret the 2014 Omnibus Incentive Plan, to grant discretionary awards under the 2014 Omnibus Incentive Plan, to determine the persons to whom awards will be granted, to determine the types of awards to be granted, to determine the terms and conditions of each award, to determine the number of shares of Common Stock to be covered by each award, to make all other determinations in connection with the 2014 Omnibus Incentive Plan and the awards thereunder as the Compensation Committee deems necessary or desirable and to delegate authority under the 2014 Omnibus Incentive Plan to our executive officers.
Available Shares
The aggregate number of shares of our Common Stock which may be issued or used for reference purposes under the 2014 Omnibus Incentive Plan or with respect to which awards may be granted may not exceed 3,473,435 shares, subject to adjustment subject to adjustment to prevent dilution or enlargement of the rights granted to, or available for, participants under the plan. The number of shares that will be available for issuance under the 2014 Omnibus Incentive Plan may also be subject to adjustment in the event of a reorganization, stock split, merger or similar change in the corporate structure or the outstanding shares of Common Stock. In the event of any of these occurrences, we may make any adjustments we consider appropriate to, among other things, the number and kind of shares, options or other property available for issuance under the plan or covered by grants previously made under the plan. The shares that will be available for issuance under the plan may be, in whole or in part, either authorized and unissued shares of our Common Stock or shares of Common Stock held in or acquired for our treasury. In general, if awards under the 2014 Omnibus Incentive Plan are for any reason cancelled, or expire or terminate unexercised, the shares covered by such awards may again be available for the grant of awards under the 2014 Omnibus Incentive Plan.
The maximum number of shares of our Common Stock with respect to which any stock option, stock appreciation right, shares of restricted stock or other stock-based awards that will be subject to the attainment of specified performance goals and intended to satisfy Section 162(m) of the U.S. Internal Revenue Code of 1986, as amended (the “Code”) and may be granted under the 2014 Omnibus Incentive Plan during any fiscal year to any eligible individual will be 1,000,000 shares (per type of award). The total number of shares of our Common Stock with respect to all awards that may be granted under the 2014 Omnibus Incentive Plan during any fiscal year to any eligible individual will be 2,000,000 shares. There are no annual limits on the number of shares of our Common Stock with respect to an award of restricted stock or other stock-based awards that are not subject to the
120
Table of Contents
attainment of specified performance goals to eligible individuals. The maximum number of shares of our Common Stock subject to any performance award which may be granted under the 2014 Omnibus Incentive Plan during any fiscal year to any eligible individual will be 1,000,000 shares. The maximum value of a cash payment made under a performance award which may be granted under the 2014 Omnibus Incentive Plan during any fiscal year to any eligible individual will be $10,000,000.
Eligibility for Participation
Non-employee members of our board of directors, as well as employees of, and consultants to, us or any of our subsidiaries and affiliates will be eligible to receive awards under the 2014 Omnibus Incentive Plan. Awards granted under the 2014 Omnibus Incentive Plan are within the discretion of the Compensation Committee, and the Compensation Committee has not determined future awards or who might receive them, although upon consummation of the Business Combination, the Company granted restricted stock unit awards to 13 employees of Jason and all non-employee members of our board of directors.
Award Agreement
Awards granted under the 2014 Omnibus Incentive Plan will be evidenced by award agreements, which need not be identical, that provide additional terms, conditions, restrictions and/or limitations covering the grant of the award, including, without limitation, additional terms providing for the acceleration of exercisability or vesting of awards in the event of a change of control or conditions regarding the participant’s employment, as determined by the Compensation Committee.
Stock Options
The Compensation Committee will be able to grant nonqualified stock options to eligible individuals and incentive stock options only to eligible employees. The Compensation Committee will determine the number of shares of our Common Stock subject to each option, the term of each option, which may not exceed ten years, or five years in the case of an incentive stock option granted to a ten percent stockholder, the exercise price, the vesting schedule, if any, and the other material terms of each option. No incentive stock option or nonqualified stock option may have an exercise price less than the fair market value of a share of our Common Stock at the time of grant or, in the case of an incentive stock option granted to a ten percent stockholder, 110% of such share’s fair market value. Options will be exercisable at such time or times and subject to such terms and conditions as determined by the Compensation Committee at grant and the exercisability of such options may be accelerated by the Compensation Committee.
Stock Appreciation Rights
The Compensation Committee will be able to grant stock appreciation rights (“SARs”), either with a stock option, which may be exercised only at such times and to the extent the related option is exercisable (“Tandem SAR”), or independent of a stock option (“Non-Tandem SAR”). A SAR is a right to receive a payment in shares of our Common Stock or cash, as determined by the Compensation Committee, equal in value to the excess of the fair market value of one share of our Common Stock on the date of exercise over the exercise price per share established in connection with the grant of the SAR. The term of each SAR may not exceed ten years. The exercise price per share covered by a SAR will be the exercise price per share of the related option in the case of a Tandem SAR and will be the fair market value of our Common Stock on the date of grant in the case of a Non-Tandem SAR. The Compensation Committee will also be able to grant limited SARs, either as Tandem SARs or Non-Tandem SARs, which may become exercisable only upon the occurrence of a change in control, as defined in the 2014 Omnibus Incentive Plan, or such other event as the Compensation Committee may designate at the time of grant or thereafter.
121
Table of Contents
Restricted Stock
The Compensation Committee will be able to award shares of restricted stock. Except as otherwise provided by the Compensation Committee upon the award of restricted stock, the recipient will generally have the rights of a stockholder with respect to the shares, including the right to receive dividends, the right to vote the shares of restricted stock and, conditioned upon full vesting of shares of restricted stock, the right to tender such shares, subject to the conditions and restrictions generally applicable to restricted stock or specifically set forth in the recipient’s restricted stock agreement. The Compensation Committee will be able to determine at the time of award that the payment of dividends, if any, will be deferred until the expiration of the applicable restriction period.
Recipients of restricted stock will be required to enter into a restricted stock agreement with us that states the restrictions to which the shares are subject, which may include satisfaction of pre-established performance goals, and the criteria or date or dates on which such restrictions will lapse.
If the grant of restricted stock or the lapse of the relevant restrictions is based on the attainment of performance goals, the Compensation Committee will establish for each recipient the applicable performance goals, formulae or standards and the applicable vesting percentages with reference to the attainment of such goals or satisfaction of such formulae or standards while the outcome of the performance goals are substantially uncertain. Such performance goals may incorporate provisions for disregarding, or adjusting for, changes in accounting methods, corporate transactions, including, without limitation, dispositions and acquisitions, and other similar events or circumstances. Section 162(m) of the Code requires that performance awards be based upon objective performance measures. The performance goals for performance-based restricted stock will be based on one or more of the objective criteria set forth on Exhibit A to the 2014 Omnibus Incentive Plan and are discussed in general below.
Other Stock-Based Awards
The Compensation Committee will be able to, subject to limitations under applicable law, make a grant of such other stock-based awards, including, without limitation, performance units, dividend equivalent units, stock equivalent units, restricted stock and deferred stock units under the 2014 Omnibus Incentive Plan that are payable in cash or denominated or payable in or valued by shares of our Common Stock or factors that influence the value of such shares. The Compensation Committee will be able to determine the terms and conditions of any such other awards, which may include the achievement of certain minimum performance goals for purposes of compliance with Section 162(m) of the Code and/or a minimum vesting period. The performance goals for performance-based other stock-based awards will be based on one or more of the objective criteria set forth on Exhibit A to the 2014 Omnibus Incentive Plan and discussed in general below.
Other Cash-Based Awards
The Compensation Committee will be able to grant awards payable in cash. Cash-based awards will be in such form, and dependent on such conditions, as the Compensation Committee will determine, including, without limitation, being subject to the satisfaction of vesting conditions or awarded purely as a bonus and not subject to restrictions or conditions. If a cash-based award is subject to vesting conditions, the Compensation Committee will be able to accelerate the vesting of such award in its discretion.
Performance Awards
The Compensation Committee will be able to grant a performance award to a participant payable upon the attainment of specific performance goals. The Compensation Committee will be able to grant performance awards that are intended to qualify as performance-based compensation under Section 162(m) of the Code as well as performance awards that are not intended to qualify as performance-based compensation under Section 162(m) of the Code. If the performance award is payable in cash, it may be paid upon the attainment of the relevant performance goals either in cash or in shares of restricted stock, based on the then current fair market
122
Table of Contents
value of such shares, as determined by the Compensation Committee. Based on service, performance and/or other factors or criteria, the Compensation Committee will be able to, at or after grant, accelerate the vesting of all or any part of any performance award.
Performance Goals
The Compensation Committee will be able to grant awards of restricted stock, performance awards, and other stock-based awards that are intended to qualify as performance-based compensation for purposes of Section 162(m) of the Code. These awards may be granted, vest and be paid based on attainment of specified performance goals established by the committee. These performance goals may be based on the attainment by the Company of a certain target level of, or a specified increase or decrease in, one or more of the following measures selected by the Compensation Committee: (1) earnings per share; (2) operating income; (3) gross income; (4) net income, before or after taxes; (5) cash flow; (6) gross profit; (7) gross profit return on investment; (8) gross margin return on investment; (9) gross margin; (10) operating margin; (11) working capital; (12) income before interest and taxes; (13) income before interest, tax, depreciation and amortization; (14) return on equity; (15) return on assets; (16) return on capital; (17) return on invested capital; (18) net revenues; (19) gross revenues; (20) revenue growth; (21) annual recurring revenues; (22) recurring revenues; (23) license revenues; (24) sales or market share; (25) total stockholder return; (26) economic value added; (27) specified objectives with regard to limiting the level of increase in all or a portion of our bank debt or other long-term or short-term public or private debt or other similar financial obligations, which may be calculated net of cash balances and other offsets and adjustments as may be established by the Compensation Committee; (28) the fair market value of a share of our Common Stock; (29) the growth in the value of an investment in our Common Stock assuming the reinvestment of dividends; or (30) reduction in operating expenses.
To the extent permitted by law, the Compensation Committee will also be able to exclude the impact of an event or occurrence which the Compensation Committee determines should be appropriately excluded, such as (1) restructurings, discontinued operations, extraordinary items and other unusual or non-recurring charges; (2) an event either not directly related to our operations or not within the reasonable control of management; or (3) a change in tax law or accounting standards required by generally accepted accounting principles.
Performance goals may also be based on an individual participant’s performance goals, as determined by the Compensation Committee.
In addition, all performance goals may be based upon the attainment of specified levels of our performance, or the performance of a subsidiary, division or other operational unit, under one or more of the measures described above relative to the performance of other corporations. The Compensation Committee will be able to designate additional business criteria on which the performance goals may be based or adjust, modify or amend those criteria.
Change in Control
In connection with a change in control, as defined in the 2014 Omnibus Incentive Plan, the Compensation Committee will be able to accelerate vesting of outstanding awards under the 2014 Omnibus Incentive Plan. In addition, such awards may be, in the discretion of the committee, (1) assumed and continued or substituted in accordance with applicable law; (2) purchased by us for an amount equal to the excess of the price of a share of our Common Stock paid in a change in control over the exercise price of the awards; or (3) cancelled if the price of a share of our Common Stock paid in a change in control is less than the exercise price of the award. The Compensation Committee will also be able to provide for accelerated vesting or lapse of restrictions of an award at any time.
Stockholder Rights
Except as otherwise provided in the applicable award agreement, and with respect to an award of restricted stock, a participant will have no rights as a stockholder with respect to shares of our Common Stock covered by any award until the participant becomes the record holder of such shares.
123
Table of Contents
Amendment and Termination
Notwithstanding any other provision of the 2014 Omnibus Incentive Plan, our board of directors will be able to, at any time, amend any or all of the provisions of the 2014 Omnibus Incentive Plan, or suspend or terminate it entirely, retroactively or otherwise, subject to stockholder approval in certain instances; provided, however, that, unless otherwise required by law or specifically provided in the 2014 Omnibus Incentive Plan, the rights of a participant with respect to awards granted prior to such amendment, suspension or termination may not be adversely affected without the consent of such participant.
Transferability
Awards granted under the 2014 Omnibus Incentive Plan generally will be nontransferable, other than by will or the laws of descent and distribution, except that the Compensation Committee will be able to provide for the transferability of nonqualified stock options at the time of grant or thereafter to certain family members.
Recoupment of Awards
The 2014 Omnibus Incentive Plan will provide that awards granted under the 2014 Omnibus Incentive Plan are subject to any recoupment policy that we may have in place or any obligation that we may have regarding the clawback of “incentive-based compensation” under the Exchange Act or under any applicable rules and regulations promulgated by the SEC.
Effective Date; Term
The 2014 Omnibus Incentive Plan was adopted by our board of directors on March 14, 2014. No award will be granted under the 2014 Omnibus Incentive Plan on or after March 14, 2024. Any award outstanding under the 2014 Omnibus Incentive Plan at the time of termination will remain in effect until such award is exercised or has expired in accordance with its terms.
Other Executive Benefits and Perquisites
In addition to base salary and the bonus and equity opportunities described above, Jason provided the following benefits to Jason’s executive officers on the same basis as other eligible Jason employees:
| • | health insurance; |
| • | vacation, personal holidays and sick days; |
| • | life insurance and supplemental life insurance; |
| • | short-term and long-term disability; and |
| • | a 401(k) plan with matching contributions. |
Jason believed that these benefits are generally consistent with those offered by other companies and specifically with those companies with which Jason competed for employees.
Jason provided certain other benefits to executive officers to insure that it could recruit and retain those individuals with the requisite ability to achieve Jason’s corporate objectives. To that end, Jason provided certain executive officers an annual automobile allowance, long term care, reimbursement for tax preparation, and club membership. Any such benefits provided to our named executive officers are included in the Summary Compensation Table below.
Employment Agreements and Severance and Change of Control Benefits
A strong, experienced management team is essential to the best interests of a company and its stockholders. Jason recognized that the possibility of a change in control could arise and that such a possibility could result in
124
Table of Contents
the departure or distraction of members of Jason’s management team to the detriment of the Jason and its stockholders. Thus, Jason entered into employment agreements with the named executive officers in order to minimize employment security concerns arising in the course of negotiating and completing a significant transaction. These benefits are described in the section entitled “Employment Agreements.” For the sake of clarity, this Business Combination did not constitute a change in control under any employment agreements with Jason’s named executive officers.
Section 162(m) Compliance
Section 162(m) of the Internal Revenue Code limits a public company to a deduction for federal income tax purposes of no more than $1 million of compensation paid to certain executive officers in a taxable year. Pursuant to Section 162(m), compensation above $1 million may be deducted only if it is “performance-based compensation” within the meaning of the Internal Revenue Code. Prior to the Business Combination, Section 162(m) did not apply to Jason. Following the Business Combination, our Compensation Committee will determine whether and/or how to structure our compensation arrangements so as to preserve the related federal income tax deductions.
Section 409A Considerations
Another section of the Internal Revenue Code, Section 409A, affects the manner by which deferred compensation opportunities are offered to employees because Section 409A requires, among other things, that “non-qualified deferred compensation” be structured in a manner that limits employees’ abilities to accelerate or further defer certain kinds of deferred compensation. We intend to operate our existing compensation arrangements that are covered by Section 409A in accordance with the applicable rules thereunder, and will review and amend our compensation arrangements where necessary to comply with Section 409A.
2013 Summary Compensation Table
The following table sets forth certain information with respect to compensation for the year ended December 31, 2013 earned by, awarded to or paid to our named executive officers.
| Name and Principal Position |
Year | Salary ($) |
Bonus ($)(1) |
Non-Equity Incentive Plan Compensation ($)(2) |
All Other Compensation ($)(3) |
Total ($) |
||||||||||||||||||
| David C. Westgate |
2013 | 826,177 | 2,159,131 | 1,076,689 | 70,708 | 4,132,705 | ||||||||||||||||||
| Stephen Cripe |
2013 | 334,648 | 955,412 | 358,451 | 44,419 | 1,692,930 | ||||||||||||||||||
| David Cataldi |
2013 | 317,744 | 350,646 | 357,614 | 43,134 | 1,069,138 | ||||||||||||||||||
| Sean Cummings |
2013 | 263,407 | 237,406 | 281,875 | 31,749 | 814,437 | ||||||||||||||||||
| John Hengel |
2013 | 287,162 | 254,801 | 111,879 | 41,883 | 695,725 | ||||||||||||||||||
| (1) | The amounts listed in this column include a non-recurring transaction bonus that Jason paid to each named executive in fiscal year 2013. As described in the Special Transaction Bonus section above, these bonuses were paid in 2013 to certain individuals, including the named executives, to reward such individuals for a successful consummation of a series of transactions pursuant to which Jason redeemed its outstanding preferred stock and Seller made distributions to certain of its equity holders. |
| (2) | The amounts listed in this column include each named executive officer’s yearly Jason MIC bonus payment with respect to fiscal year 2013, which was paid on March 15, 2014. The amount listed in the table does not include the Jason MIC bonuses earned by the named executives in respect of fiscal year 2012 that were paid in fiscal year 2013. |
125
Table of Contents
| (3) | This column includes contributions made to Jason’s 401(k) Plan made by Jason on behalf of each executive, term life insurance, accidental death and dismemberment insurance, disability insurance, long-term care insurance and other personal benefits as follows: |
| Name |
401(k) Match(a) ($)(a) |
Term Life Insurance ($)(b) |
Long- Term Care Insurance ($)(b) |
Automobile Allowance ($) |
Other Personal Benefits ($)(c) |
|||||||||||||||
| David C. Westgate |
8,670 | 1,577 | 7,973 | 12,900 | 39,588 | |||||||||||||||
| Stephen Cripe |
8,670 | 1,577 | 11,701 | 9,300 | 13,171 | |||||||||||||||
| David Cataldi |
8,670 | 1,577 | 11,700 | 8,408 | 12,779 | |||||||||||||||
| Sean Cummings |
8,670 | 1,577 | 11,780 | 9,722 | ||||||||||||||||
| John Hengel |
8,670 | 1,577 | 11,780 | 9,300 | 10,556 | |||||||||||||||
| (a) | Reflects amounts of contributions to Jason’s 401(k) Plan made by Jason on behalf of each executive. |
| (b) | Represents premiums paid by Jason for applicable insurance policies. |
| (c) | Other personal benefits include: accidental death and dismemberment benefits; health care benefits; tax preparation benefits provided to Messrs. Westgate, Cripe, and Hengel; financial planning benefit provided to Mr. Westgate; health club membership provided to Messrs. Westgate and Cripe; golf club memberships provided to Messrs. Westgate and Cataldi; long-term disability insurance provided to Mr. Westgate. |
2013 Grants of Plan Based Awards
No equity awards were made to the named executives in fiscal year 2013. The following table sets forth certain information concerning grants of cash-based awards made by Jason to the named executive officers under the Jason MIC during fiscal year 2013. The threshold, target and maximum incentive award amounts shown in the table represent the amounts to be paid if Jason’s performance had met the respective levels of the applicable performance measures. The Jason MIC is more fully described under the “Bonus” section.
| Estimated Future Payouts Under Non-Equity Incentive Plan Awards(1) |
||||||||||||||||
| Name |
Grant Date (2) |
Threshold ($) |
Target ($) |
Maximum ($) |
||||||||||||
| David C. Westgate |
3/12/2013 | 895,563 | 1,006,250 | 1,257,813 | ||||||||||||
| Stephen Cripe |
3/12/2013 | 298,150 | 335,000 | 418,750 | ||||||||||||
| David Cataldi |
3/12/2013 | 289,339 | 325,100 | 406,375 | ||||||||||||
| Sean Cummings |
3/12/2013 | 244,750 | 275,000 | 343,750 | ||||||||||||
| John Hengel |
3/12/2013 | 93,058 | 104,560 | 130,700 | ||||||||||||
| (1) | The non-equity incentive plan information represents Jason’s annual bonus grants pursuant to the Jason MIC for fiscal year 2013. The amounts in this table show the threshold, target and maximum bonus amounts payable to the named executives assuming Jason satisfied the relevant performance measures with respect to fiscal year 2013. The actual amounts paid in respect of 2013 are shown in the Summary Compensation Table above. |
| (2) | The grant date is the date that the Seller Compensation Committee met and approved the Jason MIC for fiscal year 2013. |
126
Table of Contents
Outstanding Equity Awards at 2013 Fiscal Year End
The following table sets forth certain information with respect to outstanding Seller equity awards of our named executive officers as of December 31, 2013 with respect to the named executive officer. The market value of the shares in the following table is the fair value of such shares at December 31, 2013.
| Stock Awards (in the form of Class E Profits Interests Units) |
||||||||||||||||
| Name |
Number of E1 Profits Interests Units That Have Not Vested (#)(1)(2) |
Market Value of E1 Profits Interests Units That Have Not Vested ($)(3) |
Number of E2 Profits Interests Units That Have Not Vested (#) (4) |
Market Value of E2 Profits Interests Units That Have Not Vested ($)(3) |
||||||||||||
| David C. Westgate |
208.24 | 689,066 | 1,665.87 | 6,960,005 | ||||||||||||
| Stephen Cripe |
65.07 | 215,317 | 520.59 | 2,175,025 | ||||||||||||
| David Cataldi |
52.06 | 172,267 | 416.47 | 1,740,012 | ||||||||||||
| Sean Cummings |
52.06 | 172,267 | 416.47 | 1,740,012 | ||||||||||||
| John Hengel |
13.02 | 43,083 | 104.12 | 435,013 | ||||||||||||
| (1) | The awards shown in this table are not traditional stock awards, but awards of profits interests in the Seller. These profits interests have been granted in the form of E1 and E2 profits interests units, each of which entitle the executive to participate in the profits of the Seller to the extent the profits, as measured on certain events, exceed the “threshold amount” applicable to such profits interests. The “threshold amount” generally refers to the value of the assets of the issuing entity (here, the Seller) on the relevant grant date. The threshold amounts for the profits interests listed above are $1,869 for each E1 unit and $1,000 for each E2 unit. The E1 Units are time-vesting and vest over a period of four years with twenty-five percent vesting on each of the first four anniversary dates as long as the executive is then employed on a full-time basis by the Seller or its subsidiaries. Further, upon the consummation of a change in control of the Seller, all of the unvested E1 units vest if the executive is then employed on a full-time basis by the Seller or its subsidiaries. The E2 units are performance vesting and vest upon the consummation of a change in control of the Seller that achieves certain performance criteria if the executive is then employed on a full-time basis by the Seller or its subsidiaries. |
| (2) | As of December 31, 2013, 75% of the E1 units granted to our named executive officers had vested. The remaining E1 units held by our named executives will vest on the earlier of September 21, 2014 and the completion of the Business Combination. In the case of Mr. Cummings, even though he has separated from Jason, his E1 units will also accelerate on the earlier of September 21, 2014 and the completion of the Business Combination because the E1 units have a six-month look forward feature for vesting and accelerated change in control vesting. |
| (3) | Market value of unvested units is based on is the amount of proceeds the relevant Class E unit would have received assuming the Seller had liquidated on December 31, 2013. On a per unit basis, E1 units were valued at $3,309 and E2 units were valued at $4,178. In each case, the valuation is net of the threshold amount applicable to such E unit. |
| (4) | As of December 31, 2013 all E2 units held by our named executive officers were unvested. Except in the case of Mr. Cummings who separated from Jason on March 21, 2014, the E2 units held by our named executives will vest on the completion of the Business Combination. With respect to the E2 units held by Mr. Cummings, he forfeited his E2 units upon his separation from Jason, except that he was allowed to retain one-third of his E2 units and such retained E2 units will accelerate upon the completion of the Business Combination if such completion occurs within six months of Mr. Cummings’ separation date. |
127
Table of Contents
Option Exercises and Stock Vested
The following table sets forth certain information with respect to the vesting of the Seller’s Class E Profits Interests Units during the fiscal year ended December 31, 2013 with respect to our named executive officers.
| Stock Awards (in the form of Class E Profits Interests Units) |
||||||||
| Name |
Number of Shares Acquired on Vesting (#)(1) |
Value Realized on Vesting ($)(2) |
||||||
| David C. Westgate |
208.24 | 689,066 | ||||||
| Stephen Cripe |
65.07 | 215,317 | ||||||
| David Cataldi |
52.06 | 172,267 | ||||||
| Sean Cummings |
52.06 | 172,267 | ||||||
| John Hengel |
13.02 | 43,083 | ||||||
| (1) | The awards shown in this table are not traditional stock awards, but awards of profits interests in the Seller. These profits interests have been granted in the form of E1 and E2 profits interests units, each of which entitle the executive to participate in the profits of the Seller to the extent the profits, as measured on certain events, exceed the “threshold amount” applicable to such profits interests. The “threshold amount” generally refers to the value of the assets of the issuing entity (here, the Seller) on the relevant grant date. The threshold amounts for the profits interests listed above are $1,869 for each E1 unit and $1,000 for each E2 unit. The E1 Units are time-vesting and vest over a period of four years with twenty-five percent vesting on each of the first four anniversary dates as long as the executive is then employed on a full-time basis by the Seller or its subsidiaries. Further, upon the consummation of a change in control of the Seller, all of the unvested E1 units vest if the executive is then employed on a full-time basis by the Seller or its subsidiaries. The E2 units are performance vesting and vest upon the consummation of a change in control of the Seller that achieves certain performance criteria if the executive is then employed on a full-time basis by the Seller or its subsidiaries. |
| (2) | Value realized on vesting is based on the amount of proceeds the relevant Class E unit would have received assuming the Seller had liquidated on the date of vesting. On a per unit basis, E1 units were valued at $3,309 and E2 units were valued at $4,178. In each case, the valuation is net of the threshold amount applicable to such E unit. |
Pension Benefits
Neither the Seller nor Jason sponsored any qualified or nonqualified defined benefit plans. Similarly, we do not sponsor any qualified or nonqualified defined benefit plans. Our board of directors or Compensation Committee may elect to adopt qualified or nonqualified benefit plans in the future if it determines that doing so is in our best interests.
Nonqualified Deferred Compensation
Neither the Seller nor Jason sponsored any nonqualified defined contribution plans or other nonqualified deferred compensation plans. Similarly, we do not sponsor any nonqualified defined contribution plans or other nonqualified deferred compensation plans. Our board of directors or Compensation Committee may elect to provide our executive officers and other employees with nonqualified defined contribution or other nonqualified deferred compensation benefits in the future if it determines that doing so is in our best interests.
128
Table of Contents
Employment Agreements
Each of our named executive officers has an employment agreement with Jason. The key provisions of each employment agreement are essentially the same. In addition to setting forth each executive’s base salary and bonus targets, the Jason employment agreements’ material provisions are:
| • | Each employment agreement contains restrictive covenants, whereby the executive agrees to abide by non-solicitation and non-competition obligations for the duration that the executive is receiving severance period, as proved below. |
| • | Each employment agreement automatically renews in September for a one-year period unless a notice of non-renewal is provided by one party to the other party 60 days prior to any renewal date. |
| • | If executive is terminated without “cause” or “constructively discharged” (as such terms are defined in the employment agreement) or if Jason provides a notice of non-renewal to the executive, the executive is entitled to: |
| • | continued base salary for the “severance period,” as defined below: |
| • | 18 months for Mr. Westgate, which is increased to 24 months in the case of such termination occurring 12 months after a change in control of Jason; |
| • | 6 months for Mr. Hengel, which is increased to 12 months in the case of such termination occurring 12 months after a change in control of Jason; and |
| • | 12 months for each other named executive officer, which is increased to 18 months in the case of such termination occurring 12 months after a change in control of Jason. |
| • | pro-rata bonus based on actual results (or, in the case of Mr. Westgate, based on the prior year’s award), to be paid at the same time the bonus would have otherwise been paid; |
| • | continued health and welfare benefits for the applicable executive’s severance period; |
| • | outplacement services; and |
| • | continuation of certain insurance benefits and perquisites during the executive’s applicable severance period, as further described in detail in the following two tables. |
| • | In order to be eligible for the above-referenced severance benefits, the executive must enter into a general release of claims in favor of Jason and its affiliates and comply with the restrictive covenants in the employment agreement. |
Further, if the named executive’s employment with Jason is terminated due to his death or long-term disability, then the executive is entitled to (i) three months of continued base salary, to be paid in equal monthly installments and (ii) a pro-rata annual bonus based on actual results for the fiscal year in which the termination occurs, to be paid when the bonus would have otherwise been paid. The aggregate estimated values of such payments if such a termination occurred on December 31, 2013 are as follows: $1,207,500 for Mr. Westgate, $418,750 for Mr. Cripe, $406,375 for Mr. Cataldi, $343,750 for Mr. Cummings and $169,910 for Mr. Hengel.
Potential Payments Upon a Qualifying Termination
The following table sets forth quantitative estimates of each named executive’s severance payments and benefits upon a termination without “cause” or if the executive is “constructively discharged” (as such terms are defined in the employment agreement) or if the executive is provided with a notice of non-renewal (collectively a “Qualifying Termination”). The amounts below reflect potential severance payments and benefits pursuant to the Jason employment agreements with each named executive officer, assuming the executive experienced a Qualifying Termination from Jason on December 31, 2013 and timely entered into a release agreement with Jason. In addition to these payments and benefits, each executive is entitled to a six-month look forward period in
129
Table of Contents
regards to the vesting and accelerated change in control vesting provisions his Class E1 units. Meaning, that if a time vesting date is scheduled for the six-month period after the executive’s termination date or if a change in control of the Seller happens during such six-month period, then the executive will receive the benefit of such vesting.
| Name of Executive Officer |
Cash Severance Benefits ($)(1) |
Continued Health Benefits ($) |
Outplacement Services ($) |
Continuation of Certain Insurance Benefits and Perquisites ($)(3) |
Total ($) |
|||||||||||||||
| David C. Westgate |
2,169,100 | 15,912 | 10,000 | 45,660 | 2,240,672 | |||||||||||||||
| Stephen Cripe |
670,000 | 10,608 | 8,500 | 13,472 | 702,580 | |||||||||||||||
| David Cataldi |
650,200 | 9,528 | 8,500 | 13,471 | 681,699 | |||||||||||||||
| Sean Cummings(2) |
550,000 | 9,528 | 8,500 | 13,551 | 581,579 | |||||||||||||||
| John Hengel |
235,260 | 4,764 | 8,500 | 6,616 | 255,140 | |||||||||||||||
| (1) | This column includes the continued base salary for each executive’s applicable “severance period” and pro-rata bonus payment (as described above in the “Employment Agreement” section). The pro-rata bonus estimate assumes the annual bonus will be achieved at 100% of the executive’s target level bonus, except for the Mr. Westgate’s pro-rata bonus award, which consistent with his employment agreement, is based on the prior year’s bonus performance. |
| (2) | Mr. Cummings separated from Jason on March 21, 2014. Upon his separation, Mr. Cummings was entitled to cash severance benefits, continued health benefits, outplacement services and continuation of certain insurance benefits and perquisites, as set forth in his employment agreement with Jason. The amounts of such benefits are as follows: $343,750, $9,528, $8,500 and $13,551, respectively ($375,329 in total). Additionally, in recognition of Mr. Cummings’ dedicated service to Jason, the Seller chose to allow Mr. Cummings to retain one-third of his Class E2 profits interests units, and for such retained E2 units to vest if the Business Combination is consummated within six months of Mr. Cummings’ separation. Namely, Mr. Cummings was allowed to retain 138.82 Class E2 profits interests units, and the market value of such acceleration (assuming a December 31, 2013 market value) is $579,989. |
| (3) | This column includes continuation the estimated value of the continuation of life insurance benefits, long-term disability, long-term care, accidental death and dismemberment, and golf and fitness club memberships. |
130
Table of Contents
Potential Payments Upon a Qualifying Termination in connection with a Change in Control
The following table sets forth quantitative estimates of each named executive’s severance payments and benefits upon a termination without “cause” or if the executive is “constructively discharged” (as such terms are defined in the employment agreement) or if the executive is provided with a notice of non-renewal, in each case within the 12 months following a change in control of Jason (collectively a “CIC Qualifying Termination”). The amounts below reflect potential severance payments and benefits pursuant to the Jason employment agreements with each named executive officer, assuming the executive experienced a CIC Qualifying Termination from Jason on December 31, 2013 and timely entered into a release agreement with Jason. In addition to these payments and benefits, each executive is entitled to a six-month look forward period in regards to the vesting and accelerated change in control vesting provisions his Class E1 units. Meaning, that if a time vesting date is scheduled for the six-month period after the executive’s termination date or if a change in control of the Seller happens during such six-month period, then the executive will receive the benefit of such vesting.
| Name of Executive Officer |
Cash Severance Benefits(1) ($) |
Continued Health Benefits ($) |
Outplacement Services ($) |
Continuation of Certain Insurance Benefits and Perquisites ($)(2) |
Total ($) |
|||||||||||||||
| David C. Westgate |
2,571,600 | 21,216 | 10,000 | 60,880 | 2,663,696 | |||||||||||||||
| Stephen Cripe |
837,500 | 15,912 | 8,500 | 26,944 | 888,856 | |||||||||||||||
| David Cataldi |
812,750 | 14,292 | 8,500 | 26,942 | 862,484 | |||||||||||||||
| Sean Cummings |
687,500 | 14,292 | 8,500 | 27,102 | 737,394 | |||||||||||||||
| John Hengel |
365,960 | 9,528 | 8,500 | 13,232 | 397,220 | |||||||||||||||
| (1) | This column includes the continued base salary for each executive’s applicable “severance period” and pro-rata bonus payment (as described above in the “Employment Agreement” section). The pro-rata bonus estimate assumes the annual bonus will be achieved at 100% of the executive’s target level bonus, except for the Mr. Westgate’s pro-rata bonus award, which consistent with his employment agreement, is based on the prior year’s bonus performance. |
| (2) | This column includes the estimated value of the continuation of life insurance benefits, long-term disability, long-term care, accidental death and dismemberment, and golf and fitness club memberships. |
In connection with the Business Combination, the named executives negotiated new employment agreements (the “New Employment Agreements”), which replaced and superseded the named executive’s existing employment agreements. Below is a summary of each named executive’s New Employment Agreement.
The Company has entered into a new employment agreement with David Westgate (the “Westgate Employment Agreement”), which became effective as of the consummation of the Business Combination. The Westgate Employment Agreement provides for Mr. Westgate to serve as the Company’s Chief Executive Officer and a member of the board of directors of the Company, with an initial term of employment commencing on the closing under the Purchase Agreement and ending on December 31, 2017, subject to automatic one-year renewal periods, unless terminated by either party upon at least 60 days advance notice. In addition, the Westgate Employment Agreement provides for an annual base salary of no less than $906,000, the entitlement to customary employee benefits, and an annual target bonus opportunity of 125% of base salary.
In the event Mr. Westgate’s employment is terminated by the Company without “cause,” Mr. Westgate terminates employment pursuant to a “constructive termination” (as such terms are defined in the Westgate Employment Agreement) or if the Company provides a notice of non-renewal to Mr. Westgate, subject to the execution of a release of claims and continued compliance with the restrictive covenants (as described below), he will receive, in addition to his accrued benefits: (i) two times the sum of his base salary and target bonus, payable in installments over the 12 month period following his termination of employment, which shall accelerate to a lump sum payment of two times the sum of his base salary and target bonus in the event such termination occurs
131
Table of Contents
within 12 months following a “change in control” (as such term is defined in the Westgate Employment Agreement); (ii) a pro rata bonus for the year of termination; (iii) continued health and welfare benefits ending on the first to occur of (A) 18 months or, in case such termination occurs within 12 months following a change in control, 24 months following the termination of Mr. Westgate’s employment, and (B) the date Mr. Westgate accepts employment from an unaffiliated company; and (iv) outplacement services. In the event Mr. Westgate’s employment is terminated due to his death or disability, he will be entitled to his base salary for three months following the date of termination plus a pro rata bonus for the year of termination.
The Westgate Employment Agreement further contains a 280G cutback pursuant to which, in the event any payments or benefits provided to Mr. Westgate constitute “parachute payments” within the meaning of Section 280G of the Code, Mr. Westgate would be entitled to the greater of, as determined on an after-tax basis, (i) such parachute payments or (ii) the greatest reduced amount of such parachute payments as would result in no amount of such parachute payments being subject to an excise tax pursuant to Section 280G.
In addition, the Westgate Employment Agreement provides for (i) general restrictions on the disclosure of confidential information, (ii) an inventions assignment covenant, (iii) an agreement that during his employment and for a period of 18 months thereafter or, for the period of 24 months thereafter if he is receiving the enhanced change in control severance benefits described above, he will not compete with the Company or solicit the Company’s employees, customers or business, and (iv) a mutual agreement between Mr. Westgate and the Company that during his employment and for a period of two years thereafter neither Mr. Westgate nor the Company will disparage the other.
The Company has also entered into an employment agreement with Messrs. Cripe, Cataldi and Hengel (the “Executive Employment Agreements”), which became effective as of the consummation of the Business Combination and pursuant to which Mr. Cripe serves as the Chief Financial Officer, Mr. Cataldi as the President of our Acoustics and Components segments and Mr. Hengel as the Vice President of Finance. The Executive Employment Agreements have an initial term of employment commencing on the closing of the Purchase Agreement and ending on December 31, 2017, subject to automatic one-year renewal periods, unless terminated by either party upon at least 60 days advance notice. In addition, the Executive Employment Agreements provide for an annual base salary of no less than $369,600 for Mr. Cripe, $366,600 for Mr. Cataldi and $286,200 for Mr. Hengel, the entitlement to customary employee benefits, and an annual target bonus opportunity of 100% of base salary in the case of Messrs. Cripe and Cataldi and 40% in the case of Mr. Hengel.
In the event the executives’ employment is terminated by the Company without “cause,” the executives terminate employment pursuant to a “constructive termination” (as such terms are defined in the Executive Employment Agreements) or if the Company provides a notice of non-renewal to the executives, subject to the execution of a release of claims and continued compliance with the restrictive covenants (as described below), in addition to their accrued benefits, (A) Mr. Cripe will be entitled to receive the product of 1.5 and the sum of (x) his base salary and (y) an amount equal to his target bonus, payable in installments over the 18 month period following his termination of employment (or payable in a lump if such termination occurs within 12 months following a “change in control” (as defined in the Executive Employment Agreements)), (B) Mr. Cataldi will be entitled to receive the product of 1.0 (or 1.5 in the event such termination occurs within 12 months following a change in control) and the sum of (x) his base salary and (y) an amount equal to his target bonus, payable in installments over the 12 month period following his termination of employment (or payable over the 18 month period if such termination occurs within 12 months following a change in control), and (C) Mr. Hengel will be entitled to receive 1.0 (or 1.5 if such termination occurs within 12 months following a change in control) times his base salary, payable in installments over the 12 month period following his termination of employment (or payable over the 18 month period if such termination occurs within 12 months following a change in control). In addition, each executive will be entitled to receive (i) a pro rata bonus for the year of termination; (ii) continued health and welfare benefits ending on the first to occur of (A) (x) 12 months or, in case such termination occurs within 12 months following a change in control, 18 months following the termination of the executives’ employment in the case of Messrs. Cataldi and Hengel, or (y) 18 months in the case of Mr. Cripe, and (B) the
132
Table of Contents
date they accept employment from an unaffiliated company; and (iii) outplacement services. In the event the executives’ employment is terminated due to their death or disability, they will be entitled to their base salary for three months following the date of termination plus a pro rata bonus for the year of termination.
The Executive Employment Agreements further contains a 280G cutback pursuant to which, in the event any payments or benefits provided to the executives constitute “parachute payments” within the meaning of Section 280G of the Code, the executives would be entitled to the greater of, as determined on an after-tax basis, (i) such parachute payments or (ii) the greatest reduced amount of such parachute payments as would result in no amount of such parachute payments being subject to an excise tax pursuant to Section 280G.
In addition, the Executive Employment Agreements provide for (i) general restrictions on the disclosure of confidential information, (ii) an inventions assignment covenant, (iii) an agreement that during the executives’ employment and for a period of (A) 12 months thereafter or, for the period of 18 months thereafter if they are receiving the enhanced change in control severance benefits described above in the case of Messrs. Cataldi and Hengel, or (B) 18 months thereafter in the case of Mr. Cripe, the executives will not compete with the Company or solicit the Company’s employees, customers or business, and (iv) an agreement between the executives and the Company that during their employment and for a period of two years thereafter the executives will not disparage the Company.
The employment agreement between Sean Cummings and Jason was terminated in connection with his termination of employment (as described in the section captioned “Potential Payments Upon a Qualifying Termination”).
Summary of Potential Transaction Payments to Named Executive Officers
The following table indicates the dollar amounts payable upon the completion of the Business Combination and a contemporaneous Qualifying Termination pursuant to the Seller equity arrangements and the New Employment Agreements, in each case, as described above. For purposes of this disclosure, we have assumed that the Qualifying Termination occurred on June 30, 2014.
Golden Parachute Compensation Table
| Executive Officer |
Cash ($)(1) | Equity ($)(2) | Perquisites / Benefits ($)(3) |
Total ($) | ||||||||||||
| David Westgate |
$ | 4,643,250 | $ | 8,113,833 | $ | 78,138 | $ | 12,835,221 | ||||||||
| Stephen Cripe |
$ | 1,293,600 | $ | 2,535,594 | $ | 49,125 | $ | 3,878,319 | ||||||||
| David Cataldi |
$ | 916,500 | $ | 2,028,465 | $ | 31,669 | $ | 2,976,634 | ||||||||
| Sean Cummings |
$ | 0 | $ | 799,601 | $ | 0 | $ | 799,601 | ||||||||
| John Hengel |
$ | 343,440 | $ | 507,129 | $ | 31,430 | $ | 881,999 | ||||||||
| (1) | Amounts in this column represent the value of the potential cash severance payments payable to each executive pursuant to the executive’s New Employment Agreement assuming a Qualifying Termination on June 30, 2014. The amounts in this column further assume that target bonus levels were achieved so that the pro-rata bonus portion of the severance is paid at 50% of target levels (i.e., prorated for 6 months of the year). Mr. Cummings’ employment was terminated prior to the Business Combination and therefore his post-Business Combination potential severance amount is $0. |
| (2) | The per unit price used for purposes of this table represents the Purchase Price from the Purchase Agreement ($538.65 million) being distributed among the Seller’s unitholders, after reasonable assumptions about expected adjustments and expenses to be deducted from the Purchase Price. Based on these reasonable assumptions, we estimate that each E-1 unit held by the named executive officers would receive $3,557, which is $5,426 minus the applicable threshold amount of $1,869 and each E-2 unit held by the named executive officers would receive $4,426, which is $5,426 minus the applicable threshold amount of $1,000. |
133
Table of Contents
| (3) | The amounts in this column include the value of the additional benefits that may be provided upon a Qualifying Termination following the Business Combination, including continued health benefits and insurance benefits as outlined in more detail below: |
| Executive |
Continued health benefits |
401(k) Contribution |
Life insurance benefits |
AD&D Premium |
Long Term Disability |
Long Term Care |
||||||||||||||||||
| David Westgate |
$ | 21,216 | $ | 17,340 | $ | 3,154 | $ | 389 | $ | 20,094 | $ | 15,946 | ||||||||||||
| Stephen Cripe |
$ | 15,912 | $ | 13,005 | $ | 2,365 | $ | 292 | $ | 0 | $ | 17,552 | ||||||||||||
| David Cataldi |
$ | 9,528 | $ | 8,670 | $ | 1,577 | $ | 194 | $ | 0 | $ | 11,700 | ||||||||||||
| John Hengel |
$ | 9,528 | $ | 8,670 | $ | 1,374 | $ | 153 | $ | 0 | $ | 11,705 | ||||||||||||
Director Compensation
The Seller has provided cash compensation to the non-employee directors listed below for their services as directors or members of committees of the Seller’s board of directors. Each non-employee member of the Seller’s board of directors receives the following cash compensation for board services in fiscal year 2013, as applicable, and as set forth in the table below:
| • | $30,000 per year for service as a board member; and |
| • | Stock Awards (in the form of Class E Profits Interests Units) upon joining the Seller’s board of directors. |
Our employee directors do not receive additional compensation for their board service and our Seller-affiliated directors do not receive compensation for their board services, though the Seller reimburses all of its directors for their reasonable expenses (if any) incurred in attending meetings of the board of directors and committees of the board of directors.
| Name |
Fees Earned or Paid in Cash ($) |
E1 Profits Interests Unit Grant ($)(1)(2) |
E2 Profits Interests Unit Grant ($) |
Additional Payments ($)(3) |
Total ($) |
|||||||||||||||
| Vince Martin |
30,000 | 59,354 | 89,354 | |||||||||||||||||
| Gary Collar |
30,000 | 7,997 | 37,997 | |||||||||||||||||
| Thomas J. Ward |
12,500 | 0 | 0 | 12,500 | ||||||||||||||||
| (1) | The awards shown in this table are not traditional stock awards, but awards of profits interests in the Seller. These profits interests have been granted in the form of E1 and E2 profits interests units, each of which entitle the holder to participate in the profits of the Seller to the extent the profits, as measured on certain events, exceed the “threshold amount” applicable to such profits interests. The “threshold amount” generally refers to the value of the assets of the issuing entity (here, the Seller) on the relevant grant date. The threshold amount Mr. Ward’s E1 and E2 profits interests units is $3,491. The E1 Units are time-vesting and vest over a period of four years with twenty-five percent vesting on each of the first four anniversary dates as long as Mr. Ward is then serving as an independent director of the Seller’s board of directors. Further, upon the consummation of a change in control of the Seller, all of the unvested time vesting units vest if Mr. Ward is then serving as an independent director of the Seller’s board of directors. The E2 units are performance vesting and vest upon the occurrence of a change in control of the Seller that achieves certain performance criteria as long as Mr. Ward is then serving as an independent director of the Seller’s board of directors. |
| (2) | Only Mr. Ward was awarded profits interests in 2013 (26.03 E1 Units and 52.06 E2 Units), and the aggregate grant date fair value of Mr. Ward’s E1 and E2 units was $0 computed in accordance with FASB ASC Topic 718 and note 13 to the financial statements on page A-321. Messrs. Martin and Collar were not awarded Class E profits interests (or any other equity award) in 2013. The aggregate number of Class E profits interests held by each of the directors as of December 31, 2013 was 156.18 for Mr. Martin, 78.09 for Mr. Collar and 78.09 for Mr. Ward. |
134
Table of Contents
| (3) | As described above in the “Special Transaction Bonus” section, the additional payment was paid in 2013 to certain executives and directors, including Vince Martin and Gary Collar, to reward such individuals for a successful consummation of a series of transactions pursuant to which Jason redeemed its outstanding preferred stock and Seller made distributions to certain of its equity holders. |
Director Compensation following the Business Combination
On June 30, 2014, upon completion of the Business Combination, our board of directors considered and voted to approve the director compensation arrangement, below, as recommended by the Compensation Committee:
| Cash: |
||||
| Regular Director Annual Cash Retainer |
$ | 50,000 | ||
| Non-Executive Chair Annual Cash Retainer |
$ | 100,000 | ||
| Audit Committee Chair Retainer |
$ | 15,000 | ||
| Audit Committee Member Retainer |
$ | 7,500 | ||
| Compensation Committee Chair Retainer |
$ | 15,000 | ||
| Compensation Committee Member Retainer |
$ | 7,500 | ||
| Corporate Governance & Nominating Committee Chair Retainer |
$ | 7,500 | ||
| Corporate Governance & Nominating Committee Member Retainer |
$ | 3,750 | ||
| Equity(1)(2): |
||||
| Grant date value of Annual Equity Retainer |
$ | 100,000 | ||
| Illustrative Examples of Annual Cash: |
||||
| Director, Chair of Comp. Committee, Member of Audit Committee |
$ | 72,500 | ||
| Non-Executive Chair (also Corporate Governance & Nominating Committee Chair) |
$ | 107,500 | ||
Note:
| (1) | Restricted Stock Unit (“RSU”) grants would vest on the first anniversary of the date of grant. |
| (2) | Delivery of the shares underlying the RSUs would be deferred until the six-month anniversary of the conclusion of a Director’s board service. |
135
Table of Contents
CERTAIN RELATIONSHIPS AND RELATED TRANSACTIONS
On June 14, 2013, we issued an unsecured promissory note of up to $250,000 to our Sponsor. The loans issued under this agreement were non-interest bearing and payable in full at the earlier of (i) December 31, 2013 or (ii) the closing of our IPO. All outstanding draws against the promissory note in the aggregate amount of $232,139 were repaid at the closing of the IPO.
We also reimbursed our Sponsor $123,915 for travel costs and other administrative expenses since inception.
On May 31, 2013, the Company issued 6,208,333 founder shares to our Sponsor for an aggregate purchase price of $25,000, 75,000 of which were forfeited at the closing of our Business Combination since no extension units were required to be purchased. The founder shares are identical to the shares of Common Stock included in the units sold in the IPO, except that (1) the founder shares are subject to certain transfer restrictions, as described in more detail below, and (2) our initial stockholders agreed: (i) to waive their redemption rights with respect to their founder shares, IPO Placement Shares and public shares in connection with the consummation of our initial business combination and (ii) to waive their redemption rights with respect to their founder shares and IPO Placement Shares if we failed to consummate an initial business combination within 16 months from the consummation of the IPO (or up to 24 months in case of extensions). However, our initial stockholders would have been entitled to redemption rights with respect to any public shares held if we failed to consummate a business combination within such time period. Our initial stockholders also agreed to vote any shares of Common Stock owned by them in favor of the Business Combination.
The initial stockholders have agreed not to transfer, assign or sell any of their founder shares (except to permitted transferees) until (i) with respect to 20% of such shares, upon consummation of the Business Combination, (ii) with respect to 20% of such shares, when the closing price of our Common Stock exceeds $12.00 for any 20 trading days within a 30-trading day period following the consummation of the Business Combination, (iii) with respect to 20% of such shares, when the closing price of our Common Stock exceeds $13.50 for any 20 trading days within a 30-trading day period following the consummation of the Business Combination, (iv) with respect to 20% of such shares, when the closing price of our Common Stock exceeds $15.00 for any 20 trading days within a 30-trading day period following the consummation of the Business Combination and (v) with respect to 20% of such shares, when the closing price of our Common Stock exceeds $17.00 for any 20 trading days within a 30-trading day period following the consummation of the Business Combination or earlier, in any case, if, following the Business Combination, we engage in a subsequent transaction (1) resulting in our stockholders having the right to exchange their shares for cash or other securities or (2) involving a consolidation, merger or other change in the majority of our board of directors or management team in which the company is the surviving entity.
Our Sponsor, initial stockholders and their permitted transferees that hold our founder shares, IPO Placement Shares and IPO Placement Warrants, and any shares of Common Stock issuable upon the exercise of the IPO Placement Warrants, are and will be entitled to registration rights pursuant to a registration rights agreement signed in connection with our IPO and as amended to date, upon consummation of the Business Combination and when such holders are no longer subject to applicable lock-up periods, as described above. The holders of the majority of these securities are entitled to make up to three demands, excluding short form demands, that we register such securities. In addition, the holders have certain “piggy-back” registration rights with respect to registration statements filed subsequent to our consummation of the Business Combination.
On March 14, 2014, our board of directors approved, in accordance with our certificate of incorporation, any future advances by Quinpario Partners LLC or one or more of its affiliates to the Company in order to finance transaction costs associated with any business combination, including the Business Combination. Our board of directors resolved that any such non-interest bearing loans advanced by Quinpario Partners LLC or one or more of its affiliates may be repaid by the Company (i) using a portion of the working capital held outside our
136
Table of Contents
trust account or (ii) upon the consummation of a business combination using the proceeds held in our trust account. Between March 28, 2014 and March 31, 2014, $344,149 was advanced to us by Quinpario Partners LLC for transaction costs associated with the exploration of potential business combinations, including approximately $100,000 in transaction costs incurred in connection with the Business Combination. At March 31, 2014, there was $344,149 outstanding to Quinpario Partners LLC. On May 12, 2014, the Company issued an unsecured promissory note of up to $2,500,000, inclusive of the $344,149 previously advanced to the Company, to Quinpario Partners LLC. The promissory note is non-interest bearing and payable in full at the earlier of (i) December 31, 2014 or (ii) the consummation of our Business Combination. Upon the consummation of the Business Combination, all amounts outstanding under this promissory note were paid in full.
Commencing on August 9, 2013, the date that our securities were first listed on NASDAQ, we agreed to pay our Sponsor a total of $10,000 per month for office space, administrative services and secretarial support. Upon consummation of the Business Combination, we ceased paying these monthly fees.
Jason Incorporated was a party to a Management Services Agreement dated September 21, 2010, with Saw Mill Capital LLC (“Saw Mill”) and Falcon Investment Advisors, LLC (“FIA”, together with Saw Mill, the “Service Providers”), affiliates of Jason Incorporated’s majority shareholders. Such agreement, which was terminated in connection with the consummation of the Business Combination, specified certain services to be performed for Jason Incorporated and was to remain in effect for up to ten years or until the occurrence of a defined event or agreement to terminate. Under terms of the agreement, Jason Incorporated was to pay to the Service Providers a quarterly management fee equal to the lesser of $0.25 million (subject to an annual increase of 3% on each anniversary date of the agreement) or an amount equal to 2.25% of the twelve month trailing earnings before interest, taxes, depreciation and amortization divided by four. During the term of such agreement, the Service Providers were also entitled to receive from Jason Incorporated a transaction fee in connection with the consummation by Jason of each material, as defined, acquisition, divestiture, or refinancing, in an amount ranging from $0.15 million to $0.25 million or from 0.75% to 1.0% of defined transaction value. In addition, the Service Providers were entitled to receive from Jason Incorporated a transaction fee in connection with the sale of Jason Incorporated in an amount equal to 1% of a defined value if that defined value is in excess of a defined amount. Fees were payable in the ratio of 75% to Saw Mill and 25% to FIA. As a result of the consummation of the Business Combination, Saw Mill and FIA received, on the closing thereto, $4,039,875 and $1,346,625, respectively. Management fees and related expenses paid to the Service Providers under this agreement were approximately $1.1 million in each year for the years ended December 31, 2011, 2012 and 2013. During 2013, Jason Incorporated paid the Service Providers $2.3 million in conjunction with its February 28, 2013 refinancing (see Note 10 of Jason’s audited consolidated financial statements). In addition, fees paid to the Service Providers for other services in addition to the fees discussed above were $0.5 million and $0.1 million in 2011 and 2012, respectively. The fees paid in 2011 were paid in conjunction with the Morton acquisition.
In connection with the closing of the Business Combination, we entered into an investor rights agreement (the “Investor Rights Agreement”) with JPHI and the Rollover Participants. The Investor Rights Agreement provides that each Rollover Participant will have the option to exchange, after the consummation of the Business Combination, all or a portion of such Rollover Participant’s shares in JPHI into the same number of shares of our Common Stock, as adjusted for any stock splits, stock dividends and similar transactions. The Investor Rights Agreement also contains customary registration rights of our Common Stock (as further described below under “Description of Capital Stock—Registration Rights”), customary governance provisions and transfer restrictions (including drag-along rights that are triggered in certain circumstances).
Policies and Procedures for Related Person Transactions
Our board of directors has adopted a written related person transaction policy that sets forth the policies and procedures for the review and approval or ratification of related person transactions. Our policy requires that a “related person” (as defined in paragraph (a) of Item 404 of Regulation S-K) must promptly disclose to our
137
Table of Contents
general counsel any “related person transaction” (defined as any transaction that is reportable by us under Item 404(a) of Regulation S-K in which we are or will be a participant and the amount involved exceeds $120,000 and in which any related person has or will have a direct or indirect material interest) in which such related person has or will have a direct or indirect material interest and all material facts with respect thereto. The general counsel will promptly communicate such information to our Audit Committee or another independent body of our board of directors. No related person transaction will be entered into without the approval or ratification of our Audit Committee or another independent body of our board of directors. It is our policy that directors interested in a related person transaction will recuse themselves from any such vote. Our policy does not specify the standards to be applied by our Audit Committee or another independent body of our board of directors in determining whether or not to approve or ratify a related person transaction and we accordingly anticipate that these determinations will be made in accordance with Delaware law.
138
Table of Contents
SECURITY OWNERSHIP OF CERTAIN BENEFICIAL OWNERS AND MANAGEMENT
The following table sets forth information known as of July 31, 2014 regarding the beneficial ownership of our Common Stock by:
| • | each person who is known to be the beneficial owner of more than 5% of the outstanding shares of our Common Stock; |
| • | each of our current executive officers and directors; and |
| • | all current executive officers and directors of the Company as a group. |
Beneficial ownership is determined according to the rules of the SEC, which generally provide that a person has beneficial ownership of a security if he, she or it possesses sole or shared voting or investment power over that security, including options and warrants that are currently exercisable or exercisable within 60 days.
The beneficial ownership of our Common Stock is based on 21,990,666 shares of Common Stock issued and outstanding as of July 31, 2014.
Unless otherwise indicated, we believe that all persons named in the table below have sole voting and investment power with respect to all shares of Common Stock beneficially owned by them.
| Amount of Shares of Common Stock |
Percent of Class % |
|||||||
| Name and Address of Beneficial Owners(1) |
||||||||
| 5% or Greater Stockholders |
||||||||
| Quinpario Partners I, LLC(2) |
7,964,333 | 34.4 | % | |||||
| AQR Capital Management LLC(3) |
2,331,300 | 9.6 | % | |||||
| Polar Securities, Inc.(4) |
2,013,300 | 9.2 | % | |||||
| Davidson Kempner Partners(5) |
2,057,316 | 8.8 | % | |||||
| Oz Management LP(6) |
1,916,051 | 8.3 | % | |||||
| Scoggin Capital Management II LLC(7) |
1,796,751 | 7.6 | % | |||||
| Fir Tree, Inc.(8) |
1,480,200 | 6.7 | % | |||||
| Saw Mill Capital LLC(9) |
1,193,583 | 5.1 | % | |||||
| Directors and Executive Officers |
||||||||
| David C. Westgate(10) |
657,574 | 2.9 | % | |||||
| Stephen L. Cripe(11) |
155,869 | * | ||||||
| David A. Cataldi(12) |
73,063 | * | ||||||
| John J. Hengel(13) |
29,225 | * | ||||||
| William P. Schultz(14) |
14,612 | * | ||||||
| Srivas Prasad(15) |
24,354 | * | ||||||
| Dr. Florestan von Boxberg(16) |
29,225 | * | ||||||
| James P. Heffernan |
53,800 | * | ||||||
| Edgar G. Hotard(17) |
53,800 | * | ||||||
| Robert H. Jenkins |
— | — | ||||||
| Vincent L. Martin(18) |
48,709 | * | ||||||
| Jeffry N. Quinn(2)(19) |
8,111,893 | 35.1 | % | |||||
| Dr. John Rutledge(20) |
53,800 | * | ||||||
| James F. Stern |
— | — | ||||||
| James M. Sullivan |
— | — | ||||||
| All directors and executive officers as a group (15 persons)(21) |
9,305,924 | 38.5 | % | |||||
| * | Represents less than 1%. |
| 1 | Unless otherwise noted, the business address of each of the persons and entities listed above is 411 East Wisconsin Avenue, Suite 2100, Milwaukee, Wisconsin 53202. |
139
Table of Contents
| 2 | Based on information contained in the Schedule 13D filed on July 10, 2014 by Quinpario Partners LLC, Quinpario Partners I, LLC, our Sponsor, the Jeffry N. Quinn Family Trust uad 8/10/2012 and Jeffry N. Quinn. The amount shown includes 1,150,000 shares of Common Stock underlying IPO Placement Warrants that are exercisable within 60 days and 73,340 shares indirectly owned by Jeffry N. Quinn Family Trust uad 8/10/2012 through its membership interest in Quinpario Partners I, LLC, consisting of 20,000 IPO Placement Shares and 53,340 founder shares. Percentage based on shares of Common Stock outstanding as of June 30, 2014 plus 1,150,000 shares underlying the IPO Placement Warrants. Jeffry N. Quinn maintains control over the securities in the Jeffry N. Quinn Family Trust uad 8/10/2012. Quinpario Partners LLC is the managing member of Quinpario Partners I, LLC. Jeffry N. Quinn, our Chairman of the Board, is the sole managing member of Quinpario Partners LLC. Consequently, Mr. Quinn may be deemed the beneficial owner of the founder shares and IPO Placement Shares held by our Sponsor and has sole voting and dispositive control over such securities. Mr. Quinn disclaims beneficial ownership over any securities owned by our Sponsor in which he does not have any pecuniary interest. Each of Quinpario Partners I, LLC, Quinpario Partners LLC, the Jeffry N. Quinn Family Trust uad 8/10/2012 and Jeffry N. Quinn have a business address of 12935 N. Forty Drive, Suite 201, St. Louis, MO 63141. |
| 3 | Based on information contained in the Schedule 13G filed on July 17, 2014 by AQR Capital Management, LLC (“AQR”). AQR has reported it owns Warrants convertible into 2,331,300 shares of Common Stock, which Warrants are exercisable within 60 days. Percentage based on shares of Common Stock outstanding as of July 31, 2014 plus 2,331,300 shares underlying Warrants. AQR has disclosed that it owns a portion of such amount as the investment manager to the AQR Diversified Arbitrage Fund, an open-end registered investment company. Reporting persons have an address at Two Greenwich Plaza, 3rd Floor, Greenwich, CT 06830. |
| 4 | Based on information contained in Amendment No.1 to Schedule 13G filed on February 14, 2014 by Polar Securities Inc. (“Polar Securities”) and North Pole Capital Master Fund (“North Pole”). The reporting persons have reported that North Pole owns the shares directly and Polar Securities is deemed to own such shares as the investment advisor to North Pole. The reporting persons have shared voting and dispositive power over the shares reported. The address of the business office of each of the reporting persons is 401 Bay Street, Suite 1900, PO Box 19, Toronto, Ontario M5H 2Y4, Canada. |
| 5 | Based on information contained in the Schedule 13G filed on July 8, 2014 by M. H. Davidson & Co. (“CO”), M.H. Davidson & Co. GP, L.L.C., the general partner of CO, Davidson Kempner Partners (“DKP”), MHD Management Co. (“MHD”), the general partner of DKP, MHD Management Co. GP, L.L.C., the general partner of MHD, Davidson Kempner Institutional Partners, L.P. (“DKIP”), Davidson Kempner Advisers Inc., the general partner of DKIP, Davidson Kempner International, Ltd. (“DKIL”), Davidson Kempner Capital Management LP (“DKCM”), the investment manager to each of CO, DKP, DKIP, and DKIL, KCM GP LLC, the general partner of DKCM, and Messrs. Thomas L. Kempner, Jr., Stephen M. Dowicz, Timothy I. Levart, Robert J. Brivio, Jr., Anthony A. Yoseloff, Eric P. Epstein, Avram Z. Friedman, Conor Bastable, Shulamit Leviant, Morgan Blackwell, Patrick W. Dennis and Gabriel T. Schwartz, each of whom are the managing members of DKCM. Each of DKCM and Messrs. Kempner, Jr., and Dowicz are responsible for the voting and investment decisions relating to the securities held by CO, DKP, DKIP and DKIL reported therein. CO is deemed to beneficially own 6,312 shares of Common Stock issuable upon exercise of Warrants that are exercisable within 60 days, DKP is deemed to beneficially own 109,687 shares of Common Stock and 280,795 shares of Common Stock issuable upon exercise of Warrants that are exercisable within 60 days, DKIP is deemed to beneficially own 247,009 shares of Common Stock and 603,142 shares of Common Stock issuable upon exercise of Warrants that are exercisable within 60 days and DKIL is deemed to beneficially own 244,004 shares of Common Stock and 566,367 shares of Common Stock issuable upon exercise of Warrants that are exercisable within 60 days. By virtue of their relationships described above, each of DKCM and Messrs. Kempner, Jr., and Dowicz are deemed to beneficially own 600,700 shares of Common Stock and 1,456,616 shares of Common Stock issuable upon exercise of Warrants held by CO, DKP, DKIP and DKIL. Percentage based on shares of Common Stock outstanding as of June 30, 2014 plus 1,456,616 shares underlying Warrants. Each of the reporting persons named above have a business address of c/o Davidson Kempner Partners, 65 East 55th Street, 19th Floor, New York, New York 10022. |
140
Table of Contents
| 6 | Based on information contained in Amendment No. 1 to the Schedule 13G filed on July 10, 2014 by OZ Management LP (“OZ”), OZ Management II LP (“OZII”), Och-Ziff Holding Corporation (“OZHC”), Och- Ziff Holding II LLC (“OZHII”), Och-Ziff Capital Management Group LLC (“OZM”), Daniel S. Och, and OZ Master Fund, Ltd. (“OZMD”). Includes 941,649 shares of Common Stock and 974,402 Warrants that are exercisable within 60 days. Percentage based on shares of Common Stock outstanding as of June 30, 2014 plus 974,402 shares underlying Warrants. OZ and OZII each serve as the principal investment manager to a number of investment funds and discretionary accounts (the “Accounts”), including OZMD. OZII is a wholly-owned subsidiary of OZ and, as such, OZ may be deemed to be the beneficial owner of shares held in the Accounts managed by OZII. OZ is the sole member of OZHII, the general partner of OZII. As a result, OZ has voting and dispositive authority over the shares reported in the Schedule 13G. OZHC serves as the general partner of OZ. As such, OZHC may be deemed to control OZ and therefore may be deemed to be the beneficial owner of the shares reported in the Schedule 13G. OZM is the sole shareholder of OZHC, and for purposes of the Schedule 13G may be deemed to be the beneficial owner of the shares reported in the Schedule 13G. Mr. Och is the Chief Executive Officer and Executive Managing Director of OZM. As such, for purposes of the Schedule 13G, he may be deemed to control such entity and therefore be deemed to be the beneficial owner of the shares reported in the Schedule 13G. The address of the principal business office of each of the reporting persons except OZMD is 9 West 57th Street, 39th Floor, New York, NY 10019. The address of the principal business office of OZMD is c/o Goldman Sachs (Cayman) Trust, Limited, P.O. Box 896, Suite 3307, Gardenia Court, 45 Market Street, Camana Bay, Grand Cayman, Cayman Islands. |
| 7 | Based on information contained in the Schedule 13G filed on July 11, 2014 by Scoggin Capital Management II LLC, Scoggin International Fund, Ltd., Scoggin Worldwide Fund, Ltd., TCW/Scoggin Event Driven Master Fund, L.P., Scoggin LLC, Old Bellows Partners LP, TCW/Scoggin, LLC, A. Dev Chodry, Craig Effron, and Curtis Schenker. Includes (i) 951,555 shares that are deemed beneficially owned by Scoggin Capital Management II LLC, based upon the conversion of 5,114 shares of Series A Convertible Preferred Stock and the exercise of 536,400 Warrants, (ii) 726,755 shares that are deemed beneficially owned by Scoggin International Fund, Ltd., based upon the conversion of 3,682 shares of Series A Convertible Preferred Stock and the exercise of 427,850 Warrants, (iii) 81,180 shares that are deemed beneficially owned by Scoggin Worldwide Fund, Ltd., based upon the conversion of 1,000 shares of Series A Convertible Preferred Stock, and (iv) 37,261 shares that are deemed beneficially owned by TCW/Scoggin Event Driven Master Fund, L.P., based upon the conversion of 204 shares of Series A Convertible Preferred Stock and the exercise of 20,700 Warrants. Scoggin LLC is the investment manager of Scoggin Capital Management II LLC and Scoggin International Fund, Ltd. A. Dev Chodry is a member of Scoggin LLC, and Craig Effron and Curtis Schenker are the managing members of Scoggin LLC. Scoggin LLC is a limited partner of Old Bellows Partners LP. Old Bellows Partners LP is the investment manager of Scoggin Worldwide Fund, Ltd. Old Bell Associates LLC is the general partner of Old Bellows Partners LP. A. Dev Chodry is the managing member of Old Bell Associates LLC. Craig Effron and Curtis Schenker are principals of Old Bellows Partners L.P. The investment manager of TCW/Scoggin Event Driven Master Fund, L.P. is TCW/Scoggin, LLC. A. Dev Chodry, Craig Effron and Curtis Schenker are the Co-Chief Investment Officers of TCW/Scoggin, LLC. By virtue of these relationships, Scoggin LLC is deemed to beneficially own the shares beneficially owned by Scoggin Capital Management II LLC, Scoggin International Fund, Ltd. and Scoggin Worldwide Fund, Ltd., Old Bellows Partners LP is deemed to beneficially own the shares beneficially owned by Scoggin Worldwide Fund, Ltd., TCW/Scoggin, LLC is deemed to beneficially own the shares beneficially owned by TCW/Scoggin Event Driven Master Fund, L.P., and each of A. Dev Chodry, Craig Effron and Curtis Schenker is deemed to beneficially own the shares beneficially owned by Scoggin Capital Management II LLC, Scoggin International Fund, Ltd., Scoggin Worldwide Fund, Ltd., and TCW/Scoggin Event Driven Master Fund, L.P. Percentage based on shares of Common Stock outstanding as of June 30, 2014 plus 1,796,751 shares of Common Stock underlying the reporting persons’ Series A Convertible Preferred Stock and Warrants. Each of Scoggin International Fund, Ltd. and Scoggin Worldwide Fund, Ltd. has a business address at c/o Mourant Ozannes Corporate Services (Cayman) Ltd., 94 Solaris Avenue, Camana Bay, P.O. Box 1348, Grand Cayman, KY1-1108, Cayman Islands. TCW/Scoggin Event Driven Master Fund, L.P. has a business address at c/o |
141
Table of Contents
| Ogier Fiduciary Services (Cayman) Limited, 89 Nexus Way, Camana Bay, Grand Cayman KY1-9007, Cayman Islands. TCW/Scoggin, LLC has a business address at 865 South Figueroa Street, 18th Floor, Los Angeles, CA 90017. Each of the other reporting persons named above has a business address at 660 Madison Avenue, New York, NY 10065. |
| 8 | According to a Schedule 13G filed with the SEC on February 14, 2014 by Fir Tree, Inc (“Fir Tree”), the reporting person beneficially owns 1,480,200 shares of Common Stock purchased by certain private investment funds for which Fir Tree serves as the investment manager. Fir Tree has been granted investment discretion over the shares of Common Stock held by certain private investment funds for which Fir Tree serves as the investment manager. Reporting person has an address at 505 Fifth Avenue, 23rd Floor, New York, New York 10017. |
| 9 | Represents shares of JPHI received in the rollover which can be exchanged at any time at the option of the holder into the same number of shares of Common Stock. Percentage based on shares of Common Stock outstanding as of June 30, 2014 plus 1,193,583 shares of Common Stock that can be issued upon exchange of JPHI stock. Saw Mill Capital Partners, LP is the direct owner of 1,183,438 shares of JPHI and Saw Mill Capital Investors, LP is the direct owner of 10,145 shares of JPHI. Reporting person has an address at 555 Pleasantville Road, South Building, Suite 220, Briarcliff Manor, NY 10510. |
| 10 | Includes 657,574 shares of JPHI received in the rollover which can be exchanged at any time at the option of the holder into the same number of shares of Common Stock. Percentage based on shares of Common Stock outstanding as of June 30, 2014 plus 657,574 shares of Common Stock that can be issued upon exchange of JPHI stock. |
| 11 | Includes 155,869 shares of JPHI received in the rollover which can be exchanged at any time at the option of the holder into the same number of shares of Common Stock. |
| 12 | Includes 73,063 shares of JPHI received in the rollover which can be exchanged at any time at the option of the holder into the same number of shares of Common Stock. |
| 13 | Includes 29,225 shares of JPHI received in the rollover which can be exchanged at any time at the option of the holder into the same number of shares of Common Stock. |
| 14 | Includes 14,612 shares of JPHI received in the rollover which can be exchanged at any time at the option of the holder into the same number of shares of Common Stock. |
| 15 | Includes 24,354 shares of JPHI received in the rollover which can be exchanged at any time at the option of the holder into the same number of shares of Common Stock. |
| 16 | Includes 29,225 shares of JPHI received in the rollover which can be exchanged at any time at the option of the holder into the same number of shares of Common Stock. |
| 17 | Does not include 84,341 shares indirectly owned by Hotard Family Interests, Ltd. through its membership interest in the Sponsor, consisting of 23,000 IPO Placement Shares and 61,341 founder shares. Mr. Hotard does not have voting or dispositive control over such securities. Hotard Family Interests, Ltd. is controlled by Mr. Hotard, who has voting and dispositive power over its securities (other than as set forth in this footnote). Hotard Family Interests, Ltd. has an address of PO Box 632266, Littleton, CO 80163. |
| 18 | Includes 48,709 shares of JPHI received in the rollover which can be exchanged at any time at the option of the holder into the same number of shares of Common Stock. |
| 19 | Includes 50,000 shares owned directly by the Jeffry N. Quinn Family Trust uad 8/10/2012, which Mr. Quinn controls. |
| 20 | Does not include 36,670 shares indirectly owned by Dr. Rutledge through his membership interest in the Sponsor, consisting of 10,000 IPO Placement Shares and 26,670 founder shares. Dr. Rutledge does not have voting or dispositive control over such securities. |
| 21 | Percentage based on shares of Common Stock outstanding as of June 30, 2014 plus 1,032,631 shares of Common Stock that can be issued upon exchange of JPHI stock and 1,150,000 shares underlying IPO Placement Warrants. |
142
Table of Contents
The selling security holders may offer and sell, from time to time, any or all of the shares of Common Stock, IPO Placement Warrants and shares of Series A Convertible Preferred Stock covered by this prospectus. The shares of Common Stock being offered for resale by the selling security holders under this prospectus include 3,485,623 Rollover Shares, 6,133,333 founder shares, 1,150,000 IPO Placement Shares and 3,653,100 shares of Common Stock that can be issued upon conversion of our Series A Convertible Preferred Stock. The Rollover Shares are being registered by the registration statement of which this prospectus forms a part pursuant to registration rights granted to the Rollover Participants in connection with the Business Combination. The founder shares, IPO Placement Shares and IPO Placement Warrants are being registered by the registration statement of which this prospectus forms a part pursuant to registration rights granted to the selling security holders thereof in connection with our initial organization and IPO. The shares of Series A Convertible Preferred Stock and the shares of Common Stock underlying such shares of Series A Convertible Preferred Stock are being registered by the registration statement of which this prospectus forms a part pursuant to registration rights granted to the holders thereof in connection with our Business Combination.
The following table provides, as of July 31, 2014, information regarding the beneficial ownership of our Common Stock, IPO Placement Warrants and Series A Convertible Preferred Stock held by each selling security holder, the securities that may be sold by each selling security holder under this prospectus and the number and percentage of securities that each selling security holder will beneficially own after this offering. Applicable percentages are based on 21,990,666 shares of Common Stock, 1,150,000 IPO Placement Warrants and 45,000 shares of Series A Convertible Preferred Stock outstanding as of July 31, 2014.
Because each selling security holder may dispose of all, none or some portion of their securities, no estimate can be given as to the number of securities that will be beneficially owned by a selling security holder upon termination of this offering. For purposes of the table below, however, we have assumed that after termination of this offering none of the securities covered by this prospectus will be beneficially owned by the selling security holders and further assumed that the selling security holders will not acquire beneficial ownership of any additional securities during the offering. In addition, the selling security holders may have sold, transferred or otherwise disposed of, or may sell, transfer or otherwise dispose of, at any time and from time to time, our securities in transactions exempt from the registration requirements of the Securities Act of 1933, as amended (the “Securities Act”) after the date on which the information in the table is presented.
We may amend or supplement this prospectus from time to time in the future to update or change this selling security holders list and the securities that may be resold.
See the section entitled “Plan of Distribution” for further information regarding the stockholders’ method of distributing these shares.
143
Table of Contents
Common Stock
| Name of Selling Security Holder |
Number of Shares of Common Stock Beneficially Owned Prior to Offering |
Number of Shares of Common Stock to be Sold Pursuant to this Prospectus |
Number of Shares of Common Stock Beneficially Owned After Offering |
Percentage of Shares of Common Stock Beneficially Owned After Offering |
||||||||||||
| David C. Westgate(1) |
657,574 | 657,574 | 0 | 0 | % | |||||||||||
| Stephen L. Cripe(1) |
155,869 | 155,869 | 0 | 0 | % | |||||||||||
| William P. Schultz(1) |
14,612 | 14,612 | 0 | 0 | % | |||||||||||
| David A. Cataldi(1) |
73,063 | 73,063 | 0 | 0 | % | |||||||||||
| Srivas Prasad(1) |
24,354 | 24,354 | 0 | 0 | % | |||||||||||
| Dr. Florestan von Boxberg(1) |
29,225 | 29,225 | 0 | 0 | % | |||||||||||
| John J. Hengel(1) |
29,225 | 29,225 | 0 | 0 | % | |||||||||||
| Steven Carollo(1) |
14,612 | 14,612 | 0 | 0 | % | |||||||||||
| Keith Jochims(1) |
2,922 | 2,922 | 0 | 0 | % | |||||||||||
| Vincent L. Martin and Janet Dowler Martin Revocable Trust 1993 u/a/d(1) |
48,709 | 48,709 | 0 | 0 | % | |||||||||||
| Saw Mill Capital Partners LP(2) |
1,193,583 | 1,193,583 | 0 | 0 | % | |||||||||||
| Falcon Strategic Partners III, L.P.(3) |
706,028 | 706,028 | 0 | 0 | % | |||||||||||
| Hamilton Lane Co-Investment Fund II Holdings, LP |
535,847 | 535,847 | 0 | 0 | % | |||||||||||
| Quinpario Partners I, LLC |
7,964,333 | (4) | 6,814,333 | 0 | 0 | % | ||||||||||
| James P. Heffernan(1) |
53,800 | 53,800 | 0 | 0 | % | |||||||||||
| Edgar G. Hotard(1) |
53,800 | 53,800 | 0 | 0 | % | |||||||||||
| Walter Thomas Jagodinski(1) |
53,800 | 53,800 | 0 | 0 | % | |||||||||||
| Dr. John Rutledge(1) |
53,800 | 53,800 | 0 | 0 | % | |||||||||||
| Ilan Kaufthal(1) |
53,800 | 53,800 | 0 | 0 | % | |||||||||||
| Richa Bansal |
35,000 | 35,000 | 0 | 0 | % | |||||||||||
| Elizabeth A. Reid |
35,000 | 35,000 | 0 | 0 | % | |||||||||||
| Kelly L. Merryman |
20,000 | 20,000 | 0 | 0 | % | |||||||||||
| Carman M. Diebold |
20,000 | 20,000 | 0 | 0 | % | |||||||||||
| Ashish Gupta |
45,000 | 45,000 | 0 | 0 | % | |||||||||||
| Michael C. Krull |
45,000 | 45,000 | 0 | 0 | % | |||||||||||
| Arthur Wrubel |
81,180 | 81,180 | 0 | 0 | % | |||||||||||
| FrontFour Master Fund Ltd.(5) |
1,987,626 | 811,800 | 1,175,826 | 5.3 | % | |||||||||||
| JMB Capital Partners Master Fund, L.P.(6) |
1,217,700 | 1,217,700 | 0 | 0 | % | |||||||||||
| Scoggin Worldwide Fund, Ltd.(7) |
81,180 | 81,180 | 0 | 0 | % | |||||||||||
| TWC/Scoggin Event Driven Master Fund Ltd.(7) |
37,261 | 16,561 | 20,700 | 0.1 | % | |||||||||||
| Scoggin International Fund Ltd.(7) |
726,755 | 298,905 | 427,850 | 1.9 | % | |||||||||||
| Scoggin Capital Management II LLC(7) |
951,555 | 415,155 | 536,400 | 2.4 | % | |||||||||||
| Seneca Capital, LP(8) |
925,788 | 180,788 | 745,000 | 3.4 | % | |||||||||||
| Seneca Capital International Master Fund, LP(8) |
317,752 | 62,752 | 255,000 | 1.2 | % | |||||||||||
| GE Capital Equity Investments, Inc. |
284,130 | 284,130 | 0 | 0 | % | |||||||||||
| J. Goldman Master Fund, LP |
202,950 | 202,950 | 0 | 0 | % | |||||||||||
IPO Placement Warrants
| Name of Selling Security Holder |
Number of IPO Placement Warrants Beneficially Owned Prior to Offering |
Number of IPO Placement Warrants to be Sold Pursuant to this Prospectus |
Number of IPO Placement Warrants Beneficially Owned After Offering |
Percentage of IPO Placement Warrants Beneficially Owned After Offering |
||||||||||||
| Quinpario Partners I, LLC |
1,150,000 | 1,150,000 | 0 | 0 | % | |||||||||||
144
Table of Contents
Series A Convertible Preferred Stock
| Name of Selling Security Holder |
Number of Shares of Series A Convertible Preferred Stock Beneficially Owned Prior to Offering |
Number of Shares of Series A Convertible Preferred Stock to be Sold Pursuant to this Prospectus |
Number of Shares of Series A Convertible Preferred Stock Beneficially Owned After Offering |
Percentage of Shares of Series A Convertible Preferred Stock Beneficially Owned After Offering |
||||||||||||
| Arthur Wrubel |
1,000 | 1,486 | (9) | 0 | 0 | % | ||||||||||
| FrontFour Master Fund Ltd.(5) |
10,000 | 14,860 | (10) | 0 | 0 | % | ||||||||||
| JMB Capital Partners Master Fund, L.P.(6) |
15,000 | 22,289 | (11) | 0 | 0 | % | ||||||||||
| Scoggin Worldwide Fund, Ltd.(7) |
1,000 | 1,486 | (12) | 0 | 0 | % | ||||||||||
| TWC/Scoggin Event Driven Master Fund Ltd.(7) |
204 | 303 | (12) | 0 | 0 | % | ||||||||||
| Scoggin International Fund Ltd.(7) |
3,682 | 5,471 | (12) | 0 | 0 | % | ||||||||||
| Scoggin Capital Management II LLC(7) |
5,114 | 7,599 | (12) | 0 | 0 | % | ||||||||||
| Seneca Capital, LP(8) |
2,227 | 3,309 | (13) | 0 | 0 | % | ||||||||||
| Seneca Capital International Master Fund, LP(8) |
773 | 1,149 | (13) | 0 | 0 | % | ||||||||||
| GE Capital Equity Investments, Inc. |
3,500 | 5,201 | (14) | 0 | 0 | % | ||||||||||
| J. Goldman Master Fund, LP |
2,500 | 3,715 | (15) | 0 | 0 | % | ||||||||||
| (1) | Effective June 30, 2014, Mr. Westgate was appointed to serve as our Chief Executive Officer and elected to our board of directors, Mr. Cripe was appointed to serve as our Chief Financial Officer, Mr. Hengel was appointed to serve as our Vice President of Finance, Mr. Schultz was appointed to serve as our General Counsel, Mr. Cataldi was appointed to serve as our President of the Acoustics and Components segments, Mr. Prasad was appointed to serve as our President of the Seating segment, Dr. von Boxberg was appointed to serve as our President of the Finishing segment, and Mr. Martin, who controls the Vincent L. Martin and Janet Dowler Martin Revocable Trust 1993 u/a/d was appointed to our board of directors. Mr. Heffernan, Hotard and Rutledge currently serve on our board of directors and have served in such capacity since August 2013. Mr. Jagodinski and Kaufthal previously served on our board of directors from August 2013 until the consummation of our Business Combination on June 30, 2014. Effective June 30, 2014, each of Messrs. Carollo and Jochims became non-executive officer employees of Jason. |
| (2) | Saw Mill Capital Partners, LP is the direct owner of 1,183,438 shares of JPHI and Saw Mill Capital Investors, LP is the direct owner of 10,145 shares of JPHI, which are entitled to receive an equal number of shares of Common Stock of the Company in exchange for such shares in JPHI. |
| (3) | Falcon Strategic Partners III, LP is the direct owner of 706,028 shares of JPHI and is entitled to receive an equal number of shares of Common Stock of the Company in exchange for such shares in JPHI. These JPHI shares and the shares of Common Stock into which the JPHI shares are exchangeable may be deemed to be beneficially owned by Falcon Strategic Investments III, LP (“FSI”), the general partner of Falcon Strategic Partners III, LP (“FSIGP”), and Falcon Strategic Investments GP III, LLC, the general partner of Falcon Strategic Investments III, LP. Each of FSI and FSGIP disclaims beneficial ownership of any shares not directly owned by such person. |
| (4) | This amount includes 1,150,000 shares of Common Stock underlying IPO Placement Warrants that are exercisable within 60 days and 73,340 shares indirectly owned by Jeffry N. Quinn Family Trust uad 8/10/2012 through its membership interest in Quinpario Partners I, LLC, consisting of 20,000 IPO Placement Shares and 53,340 founder shares. Jeffry N. Quinn maintains control over the securities in the Jeffry N. Quinn Family Trust uad 8/10/2012. Jeffry N. Quinn Family Trust uad 8/10/2012 has an address of 12935 N. Forty Drive, Suite 201, St. Louis, MO 63141. Quinpario Partners LLC is the managing member of Quinpario Partners I, LLC. Jeffry N. Quinn, our Chairman of the Board and former Chief Executive Officer |
145
Table of Contents
| and President from August 2013 until the consummation of our Business Combination on June 30, 2013, is the sole managing member of Quinpario Partners LLC. Consequently, Mr. Quinn may be deemed the beneficial owner of the founder shares and IPO Placement Shares held by Quinpario Partners I, LLC and has sole voting and dispositive control over such securities. Mr. Quinn disclaims beneficial ownership over any securities owned by Quinpario Partners I, LLC in which he does not have any pecuniary interest. |
| (5) | FrontFour Master Fund Ltd. directly owns 811,800 shares of Common Stock that can be issued upon conversion of our Series A Convertible Preferred Stock. FrontFour Capital Group LLC directly owns 895,270 shares of Common Stock, 178,038 shares of Common Stock underlying warrants. FrontFour Capital Corporation directly owns 84,056 shares of Common Stock and 18,462 shares of Common Stock underlying warrants. FrontFour Capital Group LLC is the investment manager for FrontFour Master Fund Ltd., FrontFour Capital Partners LP and FrontFour Capital Partners Ltd, (collectively, “FrontFour Funds”). FrontFour GP LLC is the general partner to FrontFour Capital Partners LP. The managing members of FrontFour GP LLC are Stephen Loukas, David Lorber and Zachary George (collectively the “FrontFour Managers”). FrontFour Capital Group LLC, FrontFour GP LLC, and each of the FrontFour Managers may be deemed to beneficially own the securities held by the FrontFour Funds and each disclaim beneficial ownership of such securities except to the extent of their pecuniary interests therein. FrontFour Capital Corporation is a Canadian investment advisor to a Canadian mutual fund trust called FrontFour Opportunity Fund. |
| (6) | Smithwood Advisers, L.P. (“Smithwood Advisers”) is the investment adviser to JMB Capital Partners Master Fund, L.P. (“JMB Capital”). Smithwood Partners, LLC (“Smithwood Partners”) is the general partner of JMB Capital and Smithwood General Partner, LLC (“Smithwood GP”) is the general partner of Smithwood Advisers. Jonathan Brooks is the managing member of Smithwood Partners and the controlling owner and managing member of Smithwood GP. Smithwood Advisers, Smithwood Partners, Smithwood GP and Mr. Brooks may be deemed to beneficially own the securities held by JMB Capital. Smithwood Advisers, Smithwood Partners, Smithwood GP and Mr. Brooks each disclaim beneficial ownership of such securities except to the extent of their pecuniary interests therein. |
| (7) | See Footnote (7) under Security Ownership of Certain Beneficial Owners and Management with respect to the ownership of Scoggin Worldwide Fund, Ltd., TWC/Scoggin Event Driven Master Fund L.P., Scoggin International Fund Ltd. and Scoggin Capital Management II LLC. |
| (8) | Seneca Capital, LP directly owns 745,000 shares of Common Stock and 180,788 shares of Common Stock that can be issued upon conversion of our Series A Convertible Preferred Stock. Seneca Capital International Master Fund, LP directly owns 255,000 shares of Common Stock and 62,752 shares of Common Stock that can be issued upon conversion of our Series A Convertible Preferred Stock. Seneca Capital Investments, LP (“Seneca Investments”) is the investment manager for Seneca Capital, LP (“Seneca LP”) and Seneca Capital International Master Fund, LP (“Seneca International” and, together with Seneca LP, the “Seneca Capital Funds”). Seneca Capital Investments, LLC (“Seneca LLC”) is the general partner of Seneca Investments. The managing member of Seneca LLC is Douglas A. Hirsch. Seneca Capital Advisors LLC (“Seneca Advisors”) is the general partner of Seneca LP. The managing member of Seneca Advisors is Douglas A. Hirsch. Seneca Investments, Seneca LLC, Seneca Advisors and Douglas A. Hirsch may be deemed to beneficially own the securities held by the Seneca Capital Funds. Seneca Investments, Seneca LLC, Seneca Advisors and Douglas A. Hirsch each disclaim beneficial ownership of such securities except to the extent of their pecuniary interests therein. |
| (9) | Includes 486 shares of Series A Convertible Preferred Stock potentially issuable over the next five years as dividends. |
| (10) | Includes 4,860 shares of Series A Convertible Preferred Stock potentially issuable over the next five years as dividends. |
| (11) | Includes 7,289 shares of Series A Convertible Preferred Stock potentially issuable over the next five years as dividends. |
| (12) | Includes with respect to Scoggin Worldwide Fund, Ltd., TWC/Scoggin Event Driven Master Fund Ltd., Scoggin International Fund Ltd. and Scoggin Capital Management II LLC, 486, 99, 1,789 and 2,485 shares respectively of Series A Convertible Preferred Stock potentially issuable over the next five years as dividends. |
146
Table of Contents
| (13) | Includes with respect to Seneca Capital, LP and Seneca Capital International Master Fund, LP, 1,082 and 376 shares respectively of Series A Convertible Preferred Stock potentially issuable over the next five years as dividends. |
| (14) | Includes 1,701 shares of Series A Convertible Preferred Stock potentially issuable over the next five years as dividends. |
| (15) | Includes 1,215 shares of Series A Convertible Preferred Stock potentially issuable over the next five years as dividends. |
Material Relationships with Selling Security Holders
In addition to the transactions described below, please see “Certain Relationships and Related Transactions” appearing elsewhere in this prospectus for information regarding all other material relationships with our selling security holders within the past three years.
On May 9, 2014, the Company executed a Backstop and Subscription Agreement with the investors named therein, which included each of the selling security holders of the Series A Convertible Preferred Stock, providing for the issuance by the Company of 45,000 shares of Series A Convertible Preferred Stock in a private placement that closed simultaneously with the closing of our Business Combination on June 30, 2014, for gross proceeds to the Company of approximately $45 million. See “Description of Capital Stock—Authorized and Outstanding Stock—Series A Convertible Preferred Stock.” Also pursuant to the Backstop and Subscription Agreement, investors agreed to collectively purchase up to $17.5 million worth of shares of Common Stock of the Company at a purchase price of up to $10.255 per share through open market purchases, privately negotiated transactions, a private placement or a combination thereof. The Backstop and Subscription Agreement had an effective date as of May 14, 2014. No shares of Common Stock were purchased in a private placement with the Company pursuant to the Backstop and Subscription Agreement.
On May 9, 2014, the Company also entered into a Registration Rights Agreement, providing for the registration of such Series A Convertible Preferred Stock (including the Common Stock into which the Series A Convertible Preferred Stock may be converted), as further described in “Description of Capital Stock—Registration Rights.”
147
Table of Contents
Issuance of Common Stock Underlying Warrants
The prices at which the shares of Common Stock underlying the Warrants covered by this prospectus may actually be disposed of may be at fixed prices, at prevailing market prices at the time of sale, at prices related to the prevailing market price, at varying prices determined at the time of sale or at negotiated prices.
Pursuant to the terms of the Warrants, the shares of Common Stock will be distributed to those Warrant holders who surrender the certificates representing the Warrants and provide payment of the exercise price through their brokers to our warrant agent, Continental Stock Transfer & Trust Company.
Resale of Common Stock, IPO Placement Warrants and Series A Convertible Preferred Stock by Selling Security Holders
We are registering Common Stock, IPO Placement Warrants and Series A Convertible Preferred Stock offered by this prospectus on behalf of the selling security holders named herein. The selling security holders, which as used herein includes donees, pledgees, transferees or other successors-in-interest selling Common Stock, IPO Placement Warrants and/or Series A Convertible Preferred Stock received after the date of this prospectus from a selling security holder as a gift, pledge, partnership distribution or other transfer, may, from time to time, sell, transfer or otherwise dispose of any or all of their securities on Nasdaq (in the case of our Common Stock and IPO Placement Warrants) or any other stock exchange, market or trading facility on which such securities are traded or in private transactions. These dispositions may be at fixed prices, at prevailing market prices at the time of sale, at prices related to the prevailing market price, at varying prices determined at the time of sale or at negotiated prices.
The selling security holders may use any one or more of the following methods when disposing of their securities or interests therein:
| • | ordinary brokerage transactions and transactions in which the broker-dealer solicits purchasers; |
| • | block trades in which the broker-dealer will attempt to sell the securities as agent, but may position and resell a portion of the block as principal to facilitate the transaction; |
| • | purchases by a broker-dealer as principal and resale by the broker-dealer for its account; |
| • | an exchange distribution in accordance with the rules of the applicable exchange; |
| • | privately negotiated transactions; |
| • | short sales; |
| • | through the writing or settlement of options or other hedging transactions, whether through an options exchange or otherwise; |
| • | broker-dealers may agree with the selling security holders to sell a specified number of such securities at a stipulated price; |
| • | distribution to members, limited partners or stockholders of selling security holders; |
| • | a combination of any such methods of sale; and |
| • | any other method permitted pursuant to applicable law. |
The selling security holders may, from time to time, pledge or grant a security interest in some or all of the securities owned by them and, if they default in the performance of their secured obligations, the pledgees or secured parties may offer and sell their securities, from time to time, under this prospectus, or under an amendment to this prospectus under Rule 424(b)(3) or other applicable provision of the Securities Act amending
148
Table of Contents
the list of selling security holders to include the pledgee, transferee or other successors in interest as selling security holders under this prospectus. The selling security holders also may transfer their securities in other circumstances, in which case the transferees, pledgees or other successors in interest will be the selling beneficial owners for purposes of this prospectus.
In connection with the sale of our securities or interests therein, the selling security holders may enter into hedging transactions with broker-dealers or other financial institutions, which may in turn engage in short sales of our securities in the course of hedging the positions they assume. The selling security holders may also sell their securities short and deliver these securities to close out their short positions, or loan or pledge such securities to broker-dealers that in turn may sell these securities. The selling security holders may also enter into option or other transactions with broker-dealers or other financial institutions or the creation of one or more derivative securities which require the delivery to such broker-dealer or other financial institution of securities offered by this prospectus, which securities such broker-dealer or other financial institution may resell pursuant to this prospectus (as supplemented or amended to reflect such transaction).
The aggregate proceeds to the selling security holders from the sale of the securities offered by them will be the purchase price of the security less discounts or commissions, if any. Each of the selling security holders reserves the right to accept and, together with their agents from time to time, to reject, in whole or in part, any proposed purchase of their securities to be made directly or through agents. We will not receive any of the proceeds from the resale of securities being offered by the selling security holders named herein. However, we will receive proceeds from the exercise of the Warrants if they are exercised by a selling security holder.
The selling security holders also may resell all or a portion of their securities in open market transactions in reliance upon Rule 144 under the Securities Act, provided that they meet the criteria and conform to the requirements of that rule.
The selling security holders and any broker-dealers that act in connection with the sale of securities might be deemed to be “underwriters” within the meaning of Section 2(11) of the Securities Act, and any commissions received by such broker-dealers and any profit on the resale of the securities sold by them while acting as principals might be deemed to be underwriting discounts or commissions under the Securities Act.
To the extent required, the securities to be sold, the names of the selling security holders, the respective purchase prices and public offering prices, the names of any agent, dealer or underwriter, and any applicable commissions or discounts with respect to a particular offer will be set forth in an accompanying prospectus supplement or, if appropriate, a post-effective amendment to the registration statement that includes this prospectus.
Blue Sky Restrictions on Resale
In order to comply with the securities laws of some states, if applicable, our securities may be sold in these jurisdictions only through registered or licensed brokers or dealers. In addition, in some states our securities may not be sold unless it has been registered or qualified for sale or an exemption from registration or qualification requirements is available and is complied with.
If a selling security holder wants to sell its securities under this prospectus in the United States, the selling security holders will also need to comply with state securities laws, also known as “Blue Sky laws,” with regard to secondary sales. All states offer a variety of exemption from registration for secondary sales. Many states, for example, have an exemption for secondary trading of securities registered under Section 12(g) of the Securities Exchange Act or for securities of issuers that publish continuous disclosure of financial and non-financial information in a recognized securities manual, such as Standard & Poor’s. The broker for a selling security holder will be able to advise a selling security holder which states our securities are exempt from registration with that state for secondary sales.
149
Table of Contents
Any person who purchases our securities from a selling security holder offered by this prospectus who then wants to sell such securities will also have to comply with Blue Sky laws regarding secondary sales.
When the registration statement that includes this prospectus becomes effective, and a selling security holder indicates in which state(s) he desires to sell his securities, we will be able to identify whether it will need to register or will rely on an exemption there from.
We have advised the selling security holders that the anti-manipulation rules of Regulation M under the Exchange Act may apply to sales of securities in the market and to the activities of the selling security holders and their affiliates. In addition, we will make copies of this prospectus (as it may be supplemented or amended from time to time) available to the selling security holders for the purpose of satisfying the prospectus delivery requirements of the Securities Act. The selling security holders may indemnify any broker-dealer that participates in transactions involving the sale of their securities against certain liabilities, including liabilities arising under the Securities Act.
We have agreed to indemnify the selling security holders against liabilities, including certain liabilities under the Securities Act and state securities laws, relating to the registration of the securities offered by this prospectus. We have also agreed with the selling security holders of the rollover shares, the founder shares, IPO Placement Shares and IPO Placement Warrants to keep the registration statement of which this prospectus forms a part effective until the earlier of (i) the date on which such securities are disposed of pursuant to this prospectus; (ii) such securities shall have been otherwise transferred, new certificates for such securities not bearing a legend restricting further transfer shall have been delivered by the Company and subsequent public distribution of such securities shall not require registration under the Securities Act; (iii) such securities shall have ceased to be outstanding; (iv) such securities may be sold without registration pursuant to Rule 144 promulgated under the Securities Act (but with no volume or other restrictions or limitations); or (v) such securities have been sold to, or through, a broker, dealer or underwriter in a public distribution or other public securities transaction. We have agreed with the selling security holders of our Series A Convertible Preferred Stock to keep the registration statement of which this prospectus forms a part effective until the earlier of (u) the date that is one year from the closing of the Business Combination; (v) the date on which such securities, including the Common Stock underlying such securities, are disposed of pursuant to this prospectus; (w) the date on which such securities, including the Common Stock underlying such securities, are disposed of pursuant to Rule 144 (or any successor provision) promulgated under the Securities Act (or by similar provision under the Securities Act); (x) the date on which such securities, including the Common Stock underlying such securities, may no longer be deemed “restricted securities” as defined in Rule 144(a)(3) under the Securities Act; (y) any time that such security holder is permitted to sell its securities, including the Common Stock underlying such securities, under Rule 144(b)(1) (or by similar provision under the Securities Act); and (z) the date on which such securities, including the Common Stock underlying such securities, cease to be outstanding.
We are required to pay all of our fees and expenses incident to the registration of the securities covered by this prospectus, including with regard to compliance with state securities or “blue sky” laws. Otherwise, all discounts, commissions or fees incurred in connection with the sale of securities offered hereby will be paid by the selling security holders.
150
Table of Contents
Authorized and Outstanding Stock
Our certificate of incorporation authorizes the issuance of 125,000,000 shares of capital stock, consisting of 120,000,000 shares of common stock, $0.0001 par value per share (“Common Stock”), and 5,000,000 shares of preferred stock, $0.0001 par value, 100,000 of which have been designated as 8.0% Series A Convertible Perpetual Preferred Stock, par value $0.0001 per share, which we referred to herein as the Series A Convertible Preferred Stock.
As of the date of this prospectus, there were 21,990,666 shares of Common Stock outstanding, held of record by 319 holders, and 45,000 shares of Series A Convertible Preferred Stock outstanding, held of record by 11 holders. In addition, 13,993,773 shares of Common Stock are issuable upon exercise of 13,993,773 Warrants, held of record by 2 holders. The number of record holders of our Common Stock, Series A Convertible Preferred Stock and Warrants does not include DTC participants or beneficial owners holding shares through nominee names.
Common Stock
Our certificate of incorporation provides that our Common Stock will have identical rights, powers, preferences and privileges.
Voting Power
Except as otherwise required by law or as otherwise provided in any certificate of designation for any series of preferred stock, the holders of Common Stock possess all voting power for the election of our directors and all other matters requiring stockholder action. Holders of Common Stock are entitled to one vote per share on matters to be voted on by stockholders.
Dividends
Subject to the rights, if any, of the holders of any outstanding series of preferred stock, holders of Common Stock are entitled to receive such dividends, if any, as may be declared from time to time by our board of directors in its discretion out of funds legally available therefor. In no event will any stock dividends or stock splits or combinations of stock be declared or made on Common Stock unless the shares of Common Stock at the time outstanding are treated equally and identically.
Liquidation, Dissolution and Winding Up
In the event of our voluntary or involuntary liquidation, dissolution, distribution of assets or winding-up, the holders of the Common Stock will be entitled to receive an equal amount per share of all of our assets of whatever kind available for distribution to stockholders, after the rights of the holders of the preferred stock have been satisfied.
Preemptive or Other Rights
Our stockholders have no preemptive or other subscription rights and there are no sinking fund or redemption provisions applicable to our Common Stock.
Election of Directors
Our board of directors is currently divided into three separate classes with each class serving a three-year term. There is no cumulative voting with respect to the election of directors, with the result that the holders of more than 50% of the shares voted for the election of directors can elect all of the directors.
151
Table of Contents
Founder Shares, IPO Placement Shares
The founder shares and IPO Placement Shares are each identical to the shares of our Common Stock included in the units sold in our IPO, and holders of founder shares or IPO placement shares, as applicable, have the same stockholder rights as public stockholders, except that the founder shares and IPO placement shares are subject to certain transfer restrictions, pursuant to lockup provisions in the letter agreements with us and our initial stockholders and our initial holder (with respect to founder shares, placement units and the securities contained therein). Those lockup provisions provide that such securities are not transferable or salable (i) in the case of the founder shares, until the date (x) with respect to 20% of such shares, upon consummation of our initial business combination, (y) with respect to 20% of such shares, when the closing price of our Common Stock exceeds $12.00 for any 20 trading days within a 30-trading day period following the consummation of our initial business combination, (z) with respect to 20% of such shares, when the closing price of our Common Stock exceeds $13.50 for any 20 trading days within a 30-trading day period following the consummation of our initial business combination, (xx) with respect to 20% of such shares, when the closing price of our Common Stock exceeds $15.00 for any 20 trading days within a 30-trading day period following the consummation of our initial business combination and (yy) with respect to 20% of such shares, when the closing price of our Common Stock exceeds $17.00 for any 20 trading days within a 30-trading day period following the consummation of our initial business combination or earlier, in any case, if, following a business combination, we engage in a subsequent transaction (1) resulting in our stockholders having the right to exchange their shares for cash or other securities or (2) involving a consolidation, merger or other change in the majority of our board of directors or management team in which the company is the surviving entity, and (ii) in the case of the IPO Placement Shares and IPO Placement Warrants, until 30 days after the consummation of our initial business combination, except in each case (a) to the officers or directors or other initial stockholders, any affiliates or family members of any of the officers or directors or other initial stockholders, any members of our Sponsor, or partners, affiliates or employees of the members of our Sponsor, (b) by gift to a member of our Sponsor, partners, affiliates or employees of the members of our Sponsor, one of our initial stockholders, an immediate family member of one of the members of our Sponsor, to a trust, the beneficiary of which is a family member of a member of our Sponsor or partners, affiliates or employees of the members of our Sponsor or one of our initial stockholders, or to a charitable organization, (c) by virtue of laws of descent and distribution upon death of an officer or director or one of our initial stockholders, (d) pursuant to a qualified domestic relations order, (e) by private sales at prices no greater than the price at which the securities were originally purchased, (f) in the event of our liquidation prior to our consummation of our initial business combination, (g) by virtue of the laws of Delaware or our Sponsor’s limited liability company agreement upon dissolution of our Sponsor, or (h) in the event of our consummation of a liquidation, merger, stock exchange or other similar transaction which results in all of our stockholders having the right to exchange their shares of Common Stock for cash, securities or other property subsequent to our consummation of our initial business combination; provided, however, that in the case of clauses (a) through (e) these permitted transferees must enter into a written agreement agreeing to be bound by these transfer restrictions.
Rollover Shares
At the closing of the Business Combination, on June 30, 2014, certain members of Seller and certain directors and management of Jason Incorporated contributed their shares of common stock of Jason Partners Holdings Inc. to JPHI in exchange for 3,485,623 shares of JPHI stock. Each share of JPHI stock can be exchanged on a one-for-one basis for a share of our Common Stock, at any time, at the option of the holder. When shares of JPHI stock are exchanged for our Common Stock, such shares of JPHI stock will be cancelled and will become authorized but unissued shares of JPHI stock.
Preferred Stock
Our certificate of incorporation provides that shares of our preferred stock may be issued from time to time in one or more series. Our board of directors is authorized to fix the voting rights, if any, designations, powers, preferences, the relative, participating, optional or other special rights and any qualifications, limitations and
152
Table of Contents
restrictions thereof, applicable to the shares of each series. Our board of directors is able to, without stockholder approval, issue preferred stock with voting and other rights that could adversely affect the voting power and other rights of the holders of the Common Stock and could have anti-takeover effects. The ability of our board of directors to issue preferred stock without stockholder approval could have the effect of delaying, deferring or preventing a change of control of us or the removal of existing management.
Series A Convertible Preferred Stock
In connection with our Business Combination, we designated 100,000 shares as Series A Convertible Preferred Stock and issued 45,000 shares of Series A Convertible Preferred Stock pursuant to the PIPE Investment that closed simultaneously with the closing of the Business Combination for gross proceeds to us of approximately $45 million.
Holders of the Series A Convertible Preferred Stock are entitled to receive, when, as and if declared by the Company’s board of directors, cumulative dividends at the rate of 8.0% per annum (the dividend rate) on the $1,000 liquidation preference per share of the Series A Convertible Preferred Stock, payable quarterly in arrears on each dividend payment date. Dividends shall be paid in cash or, at the Company’s option, in additional shares of Series A Convertible Preferred Stock or a combination thereof, and are payable on January 1, April 1, July 1, and October 1 of each year, commencing on the first such date after the date of the first issuance of the Series A Convertible Preferred Stock.
The Series A Convertible Preferred Stock has no maturity date, is not redeemable by the Company at any time, and will remain outstanding unless converted by the holders or mandatorily converted by the Company as described below.
Each share of Series A Convertible Preferred Stock is convertible, at the holder’s option at any time, initially into 81.18 shares of our Common Stock (which is equivalent to an initial conversion price of approximately $12.32 per share), subject to specified adjustments as set forth in the Certificate of Designations. Based on the initial conversion rate, approximately 3,653,100 shares of our Common Stock would be issuable upon conversion of all the shares of Series A Convertible Preferred Stock, assuming the absence of in-kind dividends.
On or after the second anniversary of the initial issuance date of June 30, 2014, the Company will have the right, at its option, to give notice of its election to cause all outstanding shares of the Series A Convertible Preferred Stock to be automatically converted into shares of Common Stock at the then effective conversion rate, if the closing sale price of the Common Stock equals or exceeds 125% of the conversion price for at least 20 trading days in a period of 30 consecutive trading days.
If the Company undergoes certain fundamental changes (as defined in the Certificate of Designations) the Series A Convertible Preferred Stock will automatically be converted into Common Stock on the effective date of such fundamental change at a conversion rate (subject to specified adjustments) equal to the greater of (x) the then effective conversion rate (without giving effect to such fundamental change adjustment) and (y) the quotient of (i) the sum of the $1,000 liquidation preference plus all accumulated and unpaid dividends to, but excluding, the settlement date for such conversion, divided by (ii) the volume weighted average of the closing sale prices of the Company’s Common Stock for the five consecutive trading days ending on the third business day prior to such settlement date; provided that, in the case of clause (y), the prevailing conversion rate as adjusted will not exceed the conversion rate obtained by dividing the $1,000 liquidation preference by 66 2/3% of the closing sale price of the Common Stock on June 30, 2014, the date of the initial issuance of the Series A Convertible Preferred Stock.
The Series A Convertible Preferred Stock also contains limitations that prevent the holder thereof from acquiring shares of Common Stock upon conversion that would result in the number of shares beneficially owned by such holder and its affiliates exceeding 9.99% of the total number of shares of our Common Stock then outstanding.
153
Table of Contents
The Series A Convertible Preferred Stock will also contain terms prohibiting the payment of cash dividends on the Common Stock of the Company unless at the time of payment (i) all accumulated dividends on the Series A Convertible Preferred Stock are paid or set aside and (ii) the payment of the dividend in respect of the Series A Convertible Preferred Stock for the then most recent dividend period has been paid in cash or has been declared with the set aside of a sum sufficient for payment thereof.
Except as required by Delaware law, holders of the Series A Convertible Preferred Stock will have no voting rights except with respect to the approval of any material and adverse amendment to our certificate of incorporation.
Warrants
Public Warrants
Each Public Warrant entitles the registered holder to purchase one share of our Common Stock at a price of $12.00 per share, subject to adjustment as discussed below, at any time commencing on the later of one year from the consummation of our IPO, or August 14, 2014, or 30 days after the consummation of our initial business combination, which was June 30, 2014. The Public Warrants will expire five years after the consummation of the Business Combination, at 5:00 p.m., New York time, or earlier upon redemption or liquidation.
We are not obligated to deliver any shares of Common Stock pursuant to the exercise of a Public Warrant and will have no obligation to settle such Public Warrant exercise unless a registration statement under the Securities Act with respect to the shares of Common Stock underlying the Public Warrants is then effective and a prospectus relating thereto is current, subject to our satisfying our obligations described below with respect to registration. No Public Warrant is exercisable and we are not obligated to issue shares of Common Stock upon exercise of a Public Warrant unless Common Stock issuable upon such Public Warrant exercise has been registered, qualified or deemed to be exempt therefrom under the securities laws of the state of residence of the registered holder of the Public Warrants. In the event that the conditions in the two immediately preceding sentences are not satisfied with respect to a Public Warrant, the holder of such Public Warrant will not be entitled to exercise such Public Warrant and such Public Warrant may have no value and will expire worthless. In no event will we be required to net cash settle any Public Warrant. In the event that a registration statement is not effective for the exercised Public Warrants, the purchaser of a unit containing such Public Warrant will have paid the full purchase price for the unit solely for the share of Common Stock underlying such unit.
We have agreed that as soon as practicable, but in no event later than fifteen (15) business days, after the closing of the Business Combination or any initial business combination, we will use our best efforts to file with the SEC a registration statement for the registration, under the Securities Act, of the shares of Common Stock issuable upon exercise of the Public Warrants, and we will use our best efforts to take such action as is necessary to register or qualify for sale, in those states in which the Public Warrants were initially offered by us, the shares of Common Stock issuable upon exercise of the Public Warrants, to the extent an exemption therefrom is not available. We will use our best efforts to cause the same to become effective and to maintain the effectiveness of such registration statement, and a current prospectus relating thereto, until the expiration of the Public Warrants in accordance with the provisions of the warrant agreement. In addition, we agree to use our best efforts to register the shares of Common Stock issuable upon exercise of a Public Warrant under the blue sky laws of the states of residence of the exercising warrant holder to the extent an exemption is not available.
No Public Warrants will be exercisable for cash unless we have an effective and current registration statement covering the shares of Common Stock issuable upon exercise of the Public Warrants and a current prospectus relating to such shares of Common Stock. Notwithstanding the foregoing, if a registration statement covering the shares of Common Stock issuable upon exercise of the Public Warrants has not been declared effective by the 60th business day following the closing of the Business Combination or any initial business combination, warrant holders may, until such time as there is an effective registration statement and during any
154
Table of Contents
period when we shall have failed to maintain an effective registration statement, exercise Public Warrants on a cashless basis pursuant to the exemption provided by Section 3(a)(9) of the Securities Act. If cashless exercise is permitted, each holder of our Public Warrants exercising on a cashless basis would pay the exercise price by surrendering the Public Warrants for that number of shares of Common Stock equal to the quotient obtained by dividing: (x) the product of the number of shares of Common Stock underlying the Public Warrants, multiplied by the difference between the Public Warrant exercise price and the “fair market value” by (y) the fair market value. For these purposes, fair market value will mean the volume weighted average price of Common Stock as reported during the ten (10) trading day period ending on the trading day prior to the date that notice of exercise is received by the warrant agent from the holder of such Public Warrants or our securities broker or intermediary.
Once the Public Warrants become exercisable, we may call the Public Warrants for redemption:
| • | in whole and not in part; |
| • | at a price of $0.01 per Public Warrant; |
| • | upon not less than 30 days’ prior written notice of redemption (the “30-day redemption period”) to each warrantholder; and |
| • | if, and only if, the last reported sale price of the Common Stock equals or exceeds $18.00 per share for any 20 trading days within a 30 trading day period ending three business days before the Company sends the notice of redemption to the warrantholders. |
We will not redeem the Public Warrants unless an effective registration statement covering the shares of Common Stock issuable upon exercise of the Public Warrants is current and available throughout the 30-day redemption period.
We established the last of the redemption criterion discussed above to prevent a redemption call unless there is at the time of the call a significant premium to the Public Warrant exercise price. If the foregoing conditions are satisfied and the Company issues a notice of redemption of the Public Warrants, each warrantholder will be entitled to exercise his, her or its Public Warrant prior to the scheduled redemption date. However, the price of the Common Stock may fall below the $18.00 redemption trigger price as well as the $12.00 exercise price after the redemption notice is issued.
A holder of a Public Warrant may notify us in writing in the event it elects to be subject to a requirement that such holder will not have the right to exercise such Public Warrant, to the extent that after giving effect to such exercise, such person (together with such person’s affiliates), to the warrant agent’s actual knowledge, would beneficially own in excess of 9.8% of the shares of Common Stock outstanding immediately after giving effect to such exercise.
If the number of outstanding shares of Common Stock is increased by a stock dividend payable in shares of Common Stock, or by a split-up of shares of Common Stock or other similar event, then, on the effective date of such stock dividend, split-up or similar event, the number of shares of Common Stock issuable on exercise of each Public Warrant will be increased in proportion to such increase in the outstanding shares of Common Stock. A rights offering to holders of Common Stock entitling holders to purchase shares of Common Stock at a price less than the fair market value will be deemed a stock dividend of a number of shares of Common Stock equal to the product of (i) the number of shares of Common Stock actually sold in such rights offering (or issuable under any other equity securities sold in such rights offering that are convertible into or exercisable for Common Stock) multiplied (ii) one (1) minus the quotient of (x) the price per share of Common Stock paid in such rights offering divided by (y) the fair market value. For these purposes (i) if the rights offering is for securities convertible into or exercisable for Common Stock, in determining the price payable for Common Stock, there will be taken into account any consideration received for such rights, as well as any additional amount payable upon exercise or conversion and (ii) fair market value means the volume weighted average price of Common Stock as reported during the ten (10) trading day period ending on the trading day prior to the first date on which the shares of Common Stock trade on the applicable exchange or in the applicable market, regular way, without the right to receive such rights.
155
Table of Contents
In addition, if we, at any time while the Public Warrants are outstanding and unexpired, pay a dividend or make a distribution in cash, securities or other assets to the holders of Common Stock on account of such shares of Common Stock (or other shares of our capital stock into which the Public Warrants are convertible), other than (a) as described above, (b) certain ordinary cash dividends, (c) to satisfy the redemption rights of the holders of Common Stock in connection with the proposed Business Combination or any initial business combination, or (d) in connection with the redemption of our public shares upon our failure to consummate the Business Combination or any initial business combination, then the Public Warrant exercise price will be decreased, effective immediately after the effective date of such event, by the amount of cash and/or the fair market value of any securities or other assets paid on each share of Common Stock in respect of such event.
If the number of outstanding shares of our Common Stock is decreased by a consolidation, combination, reverse stock split or reclassification of shares of Common Stock or other similar event, then, on the effective date of such consolidation, combination, reverse stock split, reclassification or similar event, the number of shares of Common Stock issuable on exercise of each Public Warrant will be decreased in proportion to such decrease in outstanding shares of Common Stock.
Whenever the number of shares of Common Stock purchasable upon the exercise of the Public Warrants is adjusted, as described above, the Public Warrant exercise price will be adjusted by multiplying the Public Warrant exercise price immediately prior to such adjustment by a fraction (x) the numerator of which will be the number of shares of Common Stock purchasable upon the exercise of the Public Warrants immediately prior to such adjustment, and (y) the denominator of which will be the number of shares of Common Stock so purchasable immediately thereafter.
If, at any time while the Public Warrants are outstanding, we effect (a) a merger with another company, in which our stockholders immediately prior to such transaction own less than a majority of the outstanding stock of the surviving entity, (b) any sale of all or substantially all of our assets in one or a series of related transactions, (c) a tender offer or exchange offer approved or authorized by our board is completed pursuant to which holders of at least a majority of our outstanding shares of Common Stock tender or exchange their shares for other securities, cash or property, or (d) a reclassification of our shares or any compulsory share exchange pursuant to which shares of our Common Stock are effectively converted into or exchanged for other securities, cash or property (other than as a result of a subdivision or combination of our Common Stock), the holders of the Public Warrants will thereafter have the right to receive, upon the basis and upon the terms and conditions specified in the Public Warrants and in lieu of the shares of our Common Stock immediately theretofore purchasable and receivable upon the exercise of the rights represented thereby, the kind and amount of shares or other securities or property receivable upon such event, that the holder of the Public Warrants would have received if such holder had exercised their Public Warrants immediately prior to such event. If less than 70% of the consideration receivable by the holders of Common Stock in such a transaction, is payable in the form of Common Stock in the successor entity that is listed for trading on a national securities exchange or is quoted in an established over-the-counter market, or is to be so listed for trading or quoted immediately following such event, and if the registered holder of the Public Warrant properly exercises the Public Warrant within thirty days following public disclosure of such transaction, the Public Warrant exercise price will be reduced as specified in the warrant agreement based on the Black-Scholes value (as defined in the warrant agreement) of the Public Warrant.
The Public Warrants have been issued in registered form under a warrant agreement between Continental Stock Transfer & Trust Company, as warrant agent, and us. You should review a copy of the warrant agreement, which is filed as an exhibit to the registration statement pertaining to our IPO, for a complete description of the terms and conditions applicable to the Public Warrants.
The Public Warrants may be exercised upon surrender of the Public Warrant certificate on or prior to the expiration date at the offices of the warrant agent, with the exercise form on the reverse side of the Public Warrant certificate completed and executed as indicated, accompanied by full payment of the exercise price (or on a cashless basis, if applicable), by certified or official bank check payable to us, for the number of Public Warrants being exercised. The warrantholders do not have the rights or privileges of holders of Common Stock
156
Table of Contents
and any voting rights until they exercise their Public Warrants and receive shares of Common Stock. After the issuance of shares of Common Stock upon exercise of the Public Warrants, each holder will be entitled to one vote for each share held of record on all matters to be voted on by stockholders.
No fractional shares will be issued upon exercise of the Public Warrants. If, upon exercise of the Public Warrants, a holder would be entitled to receive a fractional interest in a share, we will, upon exercise, round up to the nearest whole number the number of shares of Common Stock to be issued to the warrantholder.
On May 6, 2014, we commenced a tender offer to purchase up to 9,200,000 of the Public Warrants at a purchase price of $0.75 per Warrant, which was subsequently increased to $1.00 per warrant on June 18, 2014 and $1.50 per Warrant on July 7, 2014, subject to certain conditions, including the consummation of the Business Combination. The Warrant Tender Offer expired on July 18, 2014 and a total of 4,406,277 warrants were validly tendered and not properly withdrawn for a total purchase price of approximately $6,609,000.
IPO Placement Warrants
Our Sponsor purchased 1,150,000 IPO Placement Warrants included in the placement units purchased at a price of $10.00 per unit for an aggregate purchase price of $11,500,000 in a private placement that occurred simultaneously with the consummation of our IPO. The IPO Placement Warrants are identical to the Public Warrants sold in our IPO, except that, if held by our Sponsor or their permitted assigns, they (a) may be exercised for cash or on a cashless basis; and (b) are not subject to being called for redemption.
The IPO Placement Warrants were sold in a private placement pursuant to Regulation D of the Securities Act and exempt from registration requirements under the federal securities laws. However, the holders of the IPO Placement Warrants have agreed or will agree that they will not exercise them if, at the time of exercise, an effective registration statement and a current prospectus relating to the Common Stock issuable upon exercise of the Public Warrants is not available, unless, at that time, the Public Warrants are exercisable on a cashless basis.
Dividends
We have not paid any cash dividends on our Common Stock. The payment of cash dividends in the future will be dependent upon our revenues and earnings, if any, capital requirements and general financial condition and will be within the discretion of our board of directors at such time. Further, if we incur any indebtedness, our ability to declare dividends may be limited by restrictive covenants we may agree to in connection therewith.
Our Transfer Agent and Warrant Agent
The transfer agent for our Common Stock and warrant agent for our Warrants is Continental Stock Transfer & Trust Company. We have agreed to indemnify Continental Stock Transfer & Trust Company in its roles as transfer agent and warrant agent, its agents and each of its stockholders, directors, officers and employees against all claims and losses that may arise out of acts performed or omitted for its activities in that capacity, except for any liability due to any gross negligence or intentional misconduct of the indemnified person or entity.
Certain Anti-Takeover Provisions of Delaware Law
We are subject to the provisions of Section 203 of the DGCL regulating corporate takeovers. This statute prevents certain Delaware corporations, under certain circumstances, from engaging in a “business combination” with:
| • | a stockholder who owns 15% or more of our outstanding voting stock (otherwise known as an “interested stockholder”); |
| • | an affiliate of an interested stockholder; or |
157
Table of Contents
| • | an associate of an interested stockholder, for three years following the date that the stockholder became an interested stockholder. |
| • | A “business combination” includes a merger or sale of more than 10% of our assets. However, the above provisions of Section 203 do not apply if: |
| • | our board of directors approves the transaction that made the stockholder an “interested stockholder,” prior to the date of the transaction; |
| • | after the completion of the transaction that resulted in the stockholder becoming an interested stockholder, that stockholder owned at least 85% of our voting stock outstanding at the time the transaction commenced, other than statutorily excluded shares of Common Stock; or |
| • | on or subsequent to the date of the transaction, the business combination is approved by our board of directors and authorized at a meeting of our stockholders, and not by written consent, by an affirmative vote of at least two-thirds of the outstanding voting stock not owned by the interested stockholder. |
See also “Risk Factors— Anti-takeover provisions contained in our certificate of incorporation and bylaws, as well as provisions of Delaware law, could impair a takeover attempt.”
Registration Rights
The holders of our founder shares, IPO Placement Shares and IPO Placement Warrants, and any shares of Common Stock issuable upon the exercise of the IPO Placement Warrants, are and will be entitled to registration rights pursuant to a registration rights agreement signed in connection with our IPO and as amended to date, upon consummation of the Business Combination and when such holders are no longer subject to applicable lock-up periods, as further described above under “—Founder Shares, IPO Placement Shares.” The holders of the majority of these securities are entitled to make up to three demands, excluding short form demands, that we register such securities. In addition, the holders have certain “piggy-back” registration rights with respect to registration statements filed subsequent to our consummation of an initial business combination.
In connection with the Business Combination, the Rollover Participants entered into an investor rights agreement with the Company which also contain registration rights provisions pursuant to which the Rollover Participants will be granted certain registration rights with respect to the registration of the Common Stock that can be received upon exchange of their shares of JPHI stock. Pursuant to the investor rights agreement, we are required to file a shelf registration statement within 10 business days of the closing of the Business Combination and use our reasonable best efforts to cause the shelf registration statement to be declared effective by the SEC as soon as reasonably practicable to permit these holders to sell their Common Stock. We will only be required to conduct one underwritten offering for the first 6 months after closing the Business Combination using the initial registration statement, which offering must reasonably be expected to result in gross proceeds of at least $15 million. We will not be required to effect more than one demand registration in any 4 month period following an effective registration statement, and the Rollover Participants will only be allowed to demand a total of two additional underwritten offerings.
The Company and the investors in the PIPE Investment have also entered into a registration rights agreement that provides for the registration of the Series A Convertible Preferred Stock purchased thereto, including the Common Stock into which the Series A Convertible Preferred Stock is convertible. Such registration rights agreement provides certain cash penalties of up to 6% of the amount of securities purchased in the PIPE Investment, in the event a registration statement filed pursuant thereto is not declared effective within the deadlines set forth therein.
Quotation of Securities
Our Common Stock and Warrants are listed on Nasdaq under the symbols “JASN” and “JASNW,” respectively.
158
Table of Contents
MATERIAL U.S. FEDERAL INCOME TAX CONSIDERATIONS
The following is a discussion of the material U.S. federal income tax considerations relevant to the purchase, ownership, disposition and conversion of the Series A Convertible Preferred Stock and the ownership and disposition of any Common Stock received upon conversion of the Series A Convertible Preferred Stock.
This discussion is based upon provisions of the Internal Revenue Code of 1986, as amended (the “Code”), Treasury regulations, rulings and judicial decisions as of the date hereof. These authorities may change, perhaps retroactively, which could result in U.S. federal income tax consequences different from those summarized below. This discussion only applies to purchasers who purchase and hold the Series A Convertible Preferred Stock as capital assets within the meaning of Section 1221 of the Code (generally property held for investment). This discussion does not address all aspects of U.S. federal income taxation (such as the alternative minimum tax) and does not describe any foreign, state, local or other tax considerations that may be relevant to a purchaser or holder of Series A Convertible Preferred Stock in light of their particular circumstances. In addition, this discussion does not describe the U.S. federal income tax consequences applicable to a purchaser or holder of Series A Convertible Preferred Stock who is subject to special treatment under U.S. federal income tax laws (including, a corporation that accumulates earnings to avoid U.S. federal income tax, a pass-through entity or an investor in a pass-through entity, a tax-exempt entity, a pension or other employee benefit plan, a financial institution or broker-dealer, a regulated investment company, a real estate investment trust, a foreign government or international organization, a U.S. Holder (as defined below) whose “functional currency” is not the U.S. dollar, a person holding Series A Convertible Preferred Stock as part of a hedging or conversion transaction or straddle, a person subject to the alternative minimum tax, an insurance company, a former U.S. citizen, or a former long-term U.S. resident). We cannot assure you that a change in law will not significantly alter the tax considerations that we describe in this discussion. The conclusions in this discussion are based on professional judgment and are not a guarantee of a result and are not binding on the Internal Revenue Service or the courts. Accordingly, no assurance can be given that the conclusions set forth herein will be sustained if challenged by the Internal Revenue Service.
If a partnership (or any other entity treated as a partnership for U.S. federal income tax purposes) holds our Series A Convertible Preferred Stock, the U.S. federal income tax treatment of a partner of that partnership generally will depend upon the status of the partner and the activities of the partnership. If you are a partnership or a partner of a partnership holding our Series A Convertible Preferred Stock, you should consult your tax advisors as to the particular U.S. federal income tax consequences of holding and disposing of our Series A Convertible Preferred Stock.
THIS DISCUSSION CANNOT BE USED BY ANY HOLDER FOR THE PURPOSE OF AVOIDING TAX PENALTIES THAT MAY BE IMPOSED ON SUCH HOLDER. IF YOU ARE CONSIDERING THE PURCHASE OF OUR CONVERTIBLE PREFERRED STOCK, YOU SHOULD CONSULT YOUR OWN TAX ADVISORS CONCERNING THE U.S. FEDERAL INCOME TAX CONSEQUENCES OF PURCHASING, OWNING AND DISPOSING OF OUR CONVERTIBLE PREFERRED STOCK IN LIGHT OF YOUR PARTICULAR CIRCUMSTANCES AND ANY CONSEQUENCES ARISING UNDER OTHER FEDERAL TAX LAW AND THE LAWS OF APPLICABLE STATE, LOCAL AND FOREIGN TAXING JURISDICTIONS. YOU SHOULD ALSO CONSULT WITH YOUR TAX ADVISORS CONCERNING ANY POSSIBLE ENACTMENT OF LEGISLATION THAT WOULD AFFECT YOUR INVESTMENT IN OUR CONVERTIBLE PREFERRED STOCK IN YOUR PARTICULAR CIRCUMSTANCES.
U.S. Holders:
You are a “U.S. Holder” if you are a beneficial owner of Series A Convertible Preferred Stock and you are for U.S. federal income tax purposes:
| • | an individual citizen or resident of the United States; |
| • | a corporation (or other entity treated as a corporation for U.S. federal income tax purposes) created or organized in or under the laws of the United States, any state thereof or the District of Columbia; |
159
Table of Contents
| • | an estate the income of which is subject to U.S. federal income taxation regardless of its source; or |
| • | a trust if it (a) is subject to the primary supervision of a court within the United States and one or more United States persons have the authority to control all substantial decisions of the trust or (b) has a valid election in effect under applicable United States Treasury regulations to be treated as a United States person. |
Distributions in General. If distributions are made with respect to our Series A Convertible Preferred Stock, such distributions will be treated as dividends to the extent of our current and accumulated earnings and profits as determined under the Code. Any portion of a distribution that exceeds our current and accumulated earnings and profits will first be applied to reduce a U.S. Holder’s tax basis in the Series A Convertible Preferred Stock on a share-by-share basis, and the excess will be treated as gain from the disposition of the Series A Convertible Preferred Stock, the tax treatment of which is discussed below under “Material U.S. Federal Income Tax Consequences—U.S. Holders: Sale or Other Disposition.”
Dividends received by individual U.S. Holders of Series A Convertible Preferred Stock will be subject to a reduced maximum tax rate of 20% if such dividends are treated as “qualified dividend income” for U.S. federal income tax purposes. The rate reduction does not apply to dividends received to the extent that the individual U.S. Holder elects to treat the dividends as “investment income,” which may be offset against investment expenses. Furthermore, the rate reduction does not apply to dividends that are paid to individual U.S. Holders with respect to Series A Convertible Preferred Stock that is held for 60 days or less during the 121-day period beginning on the date which is 60 days before the date on which the Series A Convertible Preferred Stock becomes ex-dividend. Also, if a dividend received by an individual U.S. Holder that qualifies for the rate reduction is an “extraordinary dividend” within the meaning of Section 1059 of the Code, any loss recognized by such individual U.S. Holder on a subsequent disposition of the stock will be treated as long-term capital loss to the extent of such “extraordinary dividend,” irrespective of such U.S. Holder’s holding period for the stock. In addition, dividends recognized by U.S. Holders that are individuals could be subject to the 3.8% tax on net investment income. Individual U.S. Holders should consult their own tax advisors regarding the implications of these rules in light of their particular circumstances.
Dividends received by corporations generally will be eligible for the dividends-received deduction. This deduction is allowed if the underlying stock is held for at least 45 days during the 91 day period beginning on the date 45 days before the ex-dividend date of the stock, and for cumulative preferred stock with an arrearage of dividends, the holding period is at least 91 days during the 181 day period beginning on the date 90 days before the ex-dividend date of the stock. If a corporate stockholder receives a dividend on the Series A Convertible Preferred Stock that is an “extraordinary dividend” within the meaning of Section 1059 of the Code, the corporate stockholder in certain instances must reduce its basis in the Series A Convertible Preferred Stock by the amount of the “nontaxed portion” of such “extraordinary dividend” that results from the application of the dividends-received deduction. If the “nontaxed portion” of such “extraordinary dividend” exceeds such corporate stockholder’s basis, any excess will be taxed as gain as if such stockholder had disposed of its shares in the year the “extraordinary dividend” is paid. Each corporate U.S Holder of Series A Convertible Preferred Stock is urged to consult with its tax advisors with respect to the eligibility for and amount of any dividends received deduction and the application of Section 1059 of the Code to any dividends it receives.
Distribution of Additional Shares of Series A Convertible Preferred Stock. As discussed under “Description of Capital Stock—Authorized and Outstanding Stock—Series A Convertible Preferred Stock,” the Certificate of Designations permits us to pay dividends on Series A Convertible Preferred Stock “in-kind” in additional shares of Series A Convertible Preferred Stock in certain circumstances. Such distributions of additional shares of Series A Convertible Preferred Stock will be treated as taxable distributions in the same manner as cash distributions. The amount of the distribution and basis of the shares of Series A Convertible Preferred Stock received will be equal to the fair market value of such shares on the distribution date.
Adjustment of Conversion Price. The conversion price of the Series A Convertible Preferred Stock is subject to adjustment under certain circumstances. Treasury Regulations promulgated under Section 305 of the Code
160
Table of Contents
would treat a U.S. Holder of our Series A Convertible Preferred Stock as having received a constructive distribution includable in such U.S. Holder’s income in the manner described under “Material U.S. Federal Income Tax Consequences—U.S. Holders: Distributions in General,” above, if and to the extent that certain adjustments in the conversion price increase the proportionate interest of the U.S. Holder in our earnings and profits or assets. For example, an increase in the conversion rate to reflect a taxable dividend to holders of Common Stock will generally give rise to a deemed taxable dividend to the holders of convertible preferred stock to the extent of an allocable portion of our current and accumulated earnings and profits. Thus, under certain circumstances, U.S. Holders may recognize income in the event of a constructive distribution even though they may not receive any cash or property. Adjustments to the conversion rate made pursuant to a bona fide reasonable adjustment formula that has the effect of preventing dilution in the interest of the U.S. Holders of the Series A Convertible Preferred Stock (other than an adjustment in respect of a taxable dividend on the Common Stock), however, generally will not be considered to result in a constructive dividend distribution.
Conversion of the Series A Convertible Preferred Stock. Upon conversion of some or all of a U.S. Holder’s Series A Convertible Preferred Stock into Common Stock of the Company, whether resulting from the U.S. Holder’s exercise of the Conversion Option, the Company’s exercise of the Mandatory Conversion Right or a Fundamental Change, the U.S. Holder as a general rule, will not recognize any gain or loss. Except to the extent of Common Stock treated as received in respect of any dividends in arrears, the adjusted tax basis of Common Stock received on conversion will equal the adjusted tax basis of the convertible preferred stock converted (reduced by the portion of adjusted tax basis allocated to any fractional shares of Common Stock exchanged for cash, as described below), and the holding period of such Common Stock received on conversion will generally include the period during which the Series A Convertible Preferred Stock was held prior to conversion. A U.S. Holder of Series A Convertible Preferred Stock may recognize dividend income to the extent there are dividends in arrears on such convertible preferred stock at the time of conversion into Common Stock.
Cash received in lieu of a fractional share of Common Stock will generally be treated as a payment in a taxable exchange for such fractional share, and gain or loss will be recognized on the receipt of cash in an amount equal to the difference between the amount of cash received and the amount of adjusted tax basis allocable to the fractional share.
Sale or Other Disposition. A U.S. Holder will generally recognize capital gain or loss on a sale or exchange of our Series A Convertible Preferred Stock or Common Stock equal to the difference between the amount realized upon the sale or exchange (not including any proceeds attributable to declared and unpaid dividends, which will be taxable to U.S. Holders of record as described above under “Material U.S. Federal Income Tax Consequences—U.S. Holders: Distributions in General”) and the U.S. Holder’s adjusted tax basis in the shares sold or exchanged. Such capital gain or loss will be long-term capital gain or loss if the U.S. Holder’s holding period for the shares sold or exchanged is more than one year. Long-term capital gains of non-corporate taxpayers currently are taxed at a maximum 20% rate. The deductibility of capital losses is subject to limitations.
Information Reporting and Backup Withholding. Information reporting and backup withholding may apply with respect to payments of dividends on the Series A Convertible Preferred Stock and to certain payments of proceeds on the sale or other disposition of Series A Convertible Preferred Stock. Certain non-corporate U.S. Holders may be subject to U.S. backup withholding (currently at a rate of 28%) on payments of dividends on the Series A Convertible Preferred Stock and certain payments of proceeds on the sale or other disposition of our Series A Convertible Preferred Stock unless the beneficial owner thereof furnishes the payor or its agent with a taxpayer identification number, certified under penalties of perjury, and certain other information, or otherwise establishes, in the manner prescribed by law, an exemption from backup withholding.
U.S. backup withholding tax is not an additional tax. Any amounts withheld under the backup withholding rules may be allowed as a refund or a credit against a U.S. Holder’s U.S. federal income tax liability, which may entitle the U.S. Holder to a refund, provided the U.S. Holder timely furnishes the required information to the Internal Revenue Service.
161
Table of Contents
Non-U.S. Holders:
You are a “Non-U.S. Holder” if you are a beneficial owner of Series A Convertible Preferred Stock and you are not a “U.S. Holder.”
Distributions on the Series A Convertible Preferred Stock. If distributions (whether in cash or Series A Convertible Preferred Stock) are made with respect to our Series A Convertible Preferred Stock, such distributions will be treated as dividends to the extent of our current and accumulated earnings and profits as determined under the Code and may be subject to withholding as discussed below. Any portion of a distribution that exceeds our current and accumulated earnings and profits will first be applied to reduce the Non-U.S. Holder’s basis in the Series A Convertible Preferred Stock and, to the extent such portion exceeds the Non-U.S. Holder’s basis, the excess will be treated as gain from the disposition of the Series A Convertible Preferred Stock, the tax treatment of which is discussed below under “Material U.S. Federal Income Tax Consequences—Non-U.S. Holders: Disposition of Series A Convertible Preferred Stock, Including Redemptions.” In addition, although we believe we are not currently a U.S. real property holding corporation, i.e. a “USRPHC,” if we were to meet the definition of a USRPHC and any distribution exceeds our current and accumulated earnings and profits, we will need to choose to satisfy our withholding requirements either by treating the entire distribution as a dividend, subject to the withholding rules in the following paragraph (and withhold at a minimum rate of 10% or such lower rate as may be specified by an applicable income tax treaty for distributions from a USRPHC), or by treating only the amount of the distribution equal to our reasonable estimate of our current and accumulated earnings and profits as a dividend, subject to the withholding rules in the following paragraph, with the excess portion of the distribution subject to withholding at a rate of 10% or such lower rate as may be specified by an applicable income tax treaty as if such excess were the result of a sale of shares in a USRPHC (discussed below under “Material U.S. Federal Income Tax Consequences—Non-U.S. Holders: Sale or Other Disposition”), with a credit generally allowed against the Non-U.S. Holder’s U.S. federal income tax liability in an amount equal to the amount withheld from such excess.
Dividends or any other taxable distribution (whether in cash or Series A Convertible Preferred Stock) paid to a Non-U.S. Holder of our Series A Convertible Preferred Stock will be subject to withholding of U.S. federal income tax at a 30% rate or such lower rate as may be specified by statute or an applicable income tax treaty. Any required withholding tax may be satisfied by the withholding agent through a sale of a portion of the shares received by a Non-U.S. Holder in a taxable distribution or may be withheld from cash dividends or sales proceeds subsequently paid or credited to a Non-U.S. Holder. However, dividends that are effectively connected with the conduct of a trade or business by the Non-U.S. Holder within the United States (and, where a tax treaty applies, are attributable to a permanent establishment maintained by the Non-U.S. Holder in the United States) are not subject to the withholding tax, provided certain certification and disclosure requirements are satisfied including completing Internal Revenue Service Form W-8ECI (or other applicable form). Instead, such dividends are subject to U.S. federal income tax on a net income basis in the same manner as if the Non-U.S. Holder were a United States person as defined under the Code, unless an applicable income tax treaty provides otherwise. Any such effectively connected dividends received by a foreign corporation may be subject to an additional “branch profits tax” at a 30% rate or such lower rate as may be specified by an applicable income tax treaty.
A Non-U.S. Holder of our Series A Convertible Preferred Stock who wishes to claim the benefit of an applicable treaty rate and avoid backup withholding, as discussed below, for dividends will be required to (a) complete Internal Revenue Service Form W-8BEN (or other applicable form) and certify under penalties of perjury that such Non-U.S. Holder is not a United States person as defined under the Code and is eligible for treaty benefits, or (b) if our Series A Convertible Preferred Stock is held through certain foreign intermediaries, satisfy the relevant certification requirements of applicable Treasury regulations.
A Non-U.S. Holder of our Series A Convertible Preferred Stock eligible for a reduced rate of U.S. withholding tax pursuant to an income tax treaty may obtain a refund of any excess amounts withheld by timely filing an appropriate claim for refund with the Internal Revenue Service.
162
Table of Contents
Sale or Other Disposition. Any gain realized by a Non-U.S. Holder on the disposition of our Series A Convertible Preferred Stock will not be subject to U.S. federal income or withholding tax unless:
| • | the gain is effectively connected with a trade or business of the Non-U.S. Holder in the United States (and, if required by an applicable income tax treaty, is attributable to a permanent establishment maintained by the Non-U.S. Holder in the United States); |
| • | the Non-U.S. Holder is an individual who is present in the United States for 183 days or more in the taxable year of disposition, and certain other conditions are met; or |
| • | we are or have been a USRPHC for U.S. federal income tax purposes, as such term is defined in Section 897(c) of the Code, and such Non-U.S. Holder owned beneficially (directly or pursuant to attribution rules) more than 5% of the total fair market value of our Series A Convertible Preferred Stock at any time during the five year period ending either on the date of disposition of such interest or other applicable determination date. This assumes that our Series A Convertible Preferred Stock is regularly traded on an established securities market, within the meaning of Section 897(c)(3) of the Code. Although we do not believe we are currently a USRPHC, we do believe that our Series A Convertible Preferred Stock will be regularly traded on an established securities market if we were to become a USRPHC. |
A Non-U.S. Holder described in the first bullet point immediately above will generally be subject to tax on the net gain derived from the sale under regular graduated U.S. federal income tax rates in the same manner as if the Non-U.S. Holder were a United States person as defined under the Code, and if the Non-U.S. Holder is a corporation, may also be subject to the branch profits tax equal to 30% of its effectively connected earnings and profits or at such lower rate as may be specified by an applicable income tax treaty. An individual Non-U.S. Holder described in the second bullet point immediately above will be subject to a flat 30% tax (or at such reduced rate as may be provided by an applicable treaty) on the gain derived from the sale, which may be offset by U.S. source capital losses, even though the individual is not considered a resident of the United States. A Non-U.S. Holder described in the third bullet point above will be subject to U.S. federal income tax under regular graduated U.S. federal income tax rates with respect to the gain recognized in the same manner as if the Non-U.S. Holder were a United States person as defined under the Code.
If a Non-U.S. Holder is subject to U.S. federal income tax on any sale, exchange, redemption (except as discussed below), or other disposition of the Series A Convertible Preferred Stock, such Non-U.S. Holder will recognize capital gain or loss equal to the difference between the amount realized by the Non-U.S. Holder and the Non-U.S. Holder’s adjusted tax basis in the Series A Convertible Preferred Stock. Such capital gain or loss will be long-term capital gain or loss if the Non-U.S. Holder’s holding period for the Series A Convertible Preferred Stock is longer than one year. A Non-U.S. Holder should consult its own tax advisors with respect to applicable tax rates and netting rules for capital gains and losses. Certain limitations exist on the deduction of capital losses by both corporate and non-corporate taxpayers.
Information Reporting and Backup Withholding. We must report annually to the Internal Revenue Service and to each Non-U.S. Holder the amount of dividends paid to such Non-U.S. Holder and the tax withheld with respect to such dividends, regardless of whether withholding was required. Copies of the information returns reporting such dividends and withholding may also be made available to the tax authorities in the country in which the Non-U.S. Holder resides under the provisions of an applicable income tax treaty.
A Non-U.S. Holder will not be subject to backup withholding on dividends paid to such Non-U.S. Holder as long as such Non-U.S. Holder certifies under penalties of perjury that it is a Non-U.S. Holder (and the payor does not have actual knowledge or reason to know that such Non-U.S. Holder is a United States person as defined under the Code), or such Non-U.S. Holder otherwise establishes an exemption.
Depending on the circumstances, information reporting and backup withholding may apply to the proceeds received from a sale or other disposition of our Series A Convertible Preferred Stock unless the beneficial owner
163
Table of Contents
certifies under penalties of perjury that it is a Non-U.S. Holder (and the payor does not have actual knowledge or reason to know that the beneficial owner is a United States person as defined under the Code), or such owner otherwise establishes an exemption.
U.S. backup withholding tax is not an additional tax. Any amounts withheld under the backup withholding rules may be allowed as a refund or a credit against a Non-U.S. Holder’s U.S. federal income tax liability provided the required information is timely furnished to the Internal Revenue Service.
Recently Enacted Legislation Relating to Foreign Accounts. Recently enacted legislation (“FATCA”) will generally impose a 30% withholding tax on dividends on Series A Convertible Preferred Stock and the gross proceeds of a disposition of Series A Convertible Preferred Stock that are paid to: (i) a foreign financial institution (as that term is defined in Section 1471(d)(4) of the Code and the Treasury regulations thereunder) unless that foreign financial institution enters into an agreement with the U.S. Treasury Department to collect and disclose information regarding U.S. account holders of that foreign financial institution (including certain account holders that are foreign entities that have U.S. owners) and satisfies other requirements, or is otherwise exempt from FATCA withholding; and (ii) a “non-financial foreign entity” (as that term is defined in Section 1472(d) of the Code and the Treasury regulations thereunder) unless such entity certifies that it does not have any substantial U.S. owners or provides the name, address and taxpayer identification number of each substantial U.S. owner and such entity satisfies other specified requirements, or otherwise is exempt from FATCA withholding. A Non-U.S. Holder should consult its own tax advisors regarding the application of this legislation to it. According to recently issued guidance from the Internal Revenue Service, FATCA withholding will apply to dividends paid on shares of our Series A Convertible Preferred Stock starting July 1, 2014, and to gross proceeds from the disposition of shares of our Series A Convertible Preferred Stock starting January 1, 2017.
164
Table of Contents
The validity of the securities offered hereby will be passed upon for us by Olshan Frome Wolosky LLP of New York, New York.
The audited financial statements and financial statement schedules of Jason Partners Holdings Inc., as of December 31, 2013 and 2012 and for each of the three years in the period ended December 31, 2013 included in this prospectus have been so included in reliance on the report of PricewaterhouseCoopers LLP, an independent registered public accounting firm, given on the authority of said firm as experts in auditing and accounting.
WHERE YOU CAN FIND MORE INFORMATION
We have filed with the SEC a registration statement on Form S-1 under the Securities Act with respect to the shares of Common Stock, Warrants and Series A Convertible Preferred Stock being offered by this prospectus. This prospectus does not contain all of the information included in the registration statement. For further information pertaining to us and our Common Stock, Warrants and Series A Convertible Preferred Stock you should refer to the registration statement and its exhibits. Statements contained in this prospectus concerning any of our contracts, agreements or other documents are not necessarily complete. If a contract or document has been filed as an exhibit to the registration statement, we refer you to the copy of the contract or document that has been filed. Each statement in this prospectus relating to a contract or document filed as an exhibit is qualified in all respects by the filed exhibit.
We are subject to the informational requirements of the Exchange Act and file annual, quarterly and current reports and other information with the SEC. Our filings with the SEC are available to the public on the SEC’s website at http://www.sec.gov. Those filings are also available to the public on, or accessible through, our website under the heading “Investors” at www.jasoninc.com. The information we file with the SEC or contained on or accessible through our corporate website or any other website that we may maintain is not part of this prospectus or the registration statement of which this prospectus is a part. You may also read and copy, at SEC prescribed rates, any document we file with the SEC, including the registration statement (and its exhibits) of which this prospectus is a part, at the SEC’s Public Reference Room located at 100 F Street, N.E., Washington D.C. 20549. You can call the SEC at 1-800-SEC-0330 to obtain information on the operation of the Public Reference Room.
165
Table of Contents
INDEX TO CONSOLIDATED FINANCIAL STATEMENTS
| Jason Partners Holdings Inc. |
||||
| UNAUDITED CONDENSED CONSOLIDATED FINANCIAL STATEMENTS |
||||
| For the quarterly period ended March 28, 2014 |
||||
| F-2 | ||||
| F-3 | ||||
| F-4 | ||||
| F-5 | ||||
| F-6 | ||||
| AUDITED CONSOLIDATED FINANCIAL STATEMENTS |
||||
| For the years ended December 31, 2011, 2012 and 2013 |
||||
| F-16 | ||||
| F-17 | ||||
| F-18 | ||||
| F-19 | ||||
| F-20 | ||||
| F-21 | ||||
| F-23 | ||||
| F-49 | ||||
| F-53 | ||||
F-1
Table of Contents
Condensed Consolidated Statements of Operations
(In thousands, except share and per share amounts)
(Unaudited)
| Three Months Ended | ||||||||
| March 29, 2013 |
March 28, 2014 |
|||||||
| Net sales |
$ | 179,669 | $ | 186,536 | ||||
| Cost of goods sold |
139,255 | 144,492 | ||||||
|
|
|
|
|
|||||
| Gross profit |
40,414 | 42,044 | ||||||
| Selling and administrative expenses |
26,976 | 29,453 | ||||||
| Newcomerstown fire loss—net (Note 15) |
1,719 | — | ||||||
| Loss on disposals of property, plant and equipment—net |
5 | 123 | ||||||
| Restructuring (Note 3) |
72 | 647 | ||||||
|
|
|
|
|
|||||
| Operating income |
11,642 | 11,821 | ||||||
| Interest expense |
(9,780 | ) | (3,495 | ) | ||||
| Equity income |
225 | 315 | ||||||
| Gain from sale of joint ventures (Note 2) |
— | 3,508 | ||||||
| Gain from involuntary conversion of property, plant and equipment (Note 15) |
1,927 | — | ||||||
| Other income (expense)—net |
47 | 78 | ||||||
|
|
|
|
|
|||||
| Income before income taxes |
4,061 | 12,227 | ||||||
| Tax provision |
1,420 | 4,492 | ||||||
|
|
|
|
|
|||||
| Net income |
2,641 | 7,735 | ||||||
| Accretion of preferred stock dividends and redemption premium |
986 | — | ||||||
|
|
|
|
|
|||||
| Net income available to common shareholders |
$ | 1,655 | $ | 7,735 | ||||
|
|
|
|
|
|||||
| Net income per share available to common shareholders: |
||||||||
| Basic and diluted |
$ | 1,655 | $ | 7,735 | ||||
| Weighted average number of common shares outstanding: |
||||||||
| Basic and diluted |
1,000 | 1,000 | ||||||
| Cash dividends paid per common share |
$ | 24,962 | $ | — | ||||
The accompanying notes are an integral part of these condensed consolidated financial statements.
F-2
Table of Contents
Condensed Consolidated Statements of Comprehensive Income
(In thousands)
(Unaudited)
| Three Months Ended | ||||||||
| March 29, 2013 |
March 28, 2014 |
|||||||
| Net income |
$ | 2,641 | $ | 7,735 | ||||
| Other comprehensive income (loss): |
||||||||
| Employee retirement plan adjustments, net of tax |
79 | 57 | ||||||
| Cumulative foreign currency translation adjustments associated with joint ventures sold |
— | (591 | ) | |||||
| Foreign currency translation adjustments |
(813 | ) | 129 | |||||
|
|
|
|
|
|||||
| Total other comprehensive income (loss) |
(734 | ) | (405 | ) | ||||
|
|
|
|
|
|||||
| Comprehensive income |
$ | 1,907 | $ | 7,330 | ||||
|
|
|
|
|
|||||
The accompanying notes are an integral part of these condensed consolidated financial statements.
F-3
Table of Contents
Condensed Consolidated Balance Sheets
(In thousands, except share amounts)
(Unaudited)
| December 31, 2013 |
March 28, 2014 |
|||||||
| Assets |
||||||||
| Current assets |
||||||||
| Cash and cash equivalents |
$ | 16,318 | $ | 21,800 | ||||
| Accounts receivable—net |
77,003 | 110,443 | ||||||
| Inventories—net |
72,259 | 76,668 | ||||||
| Deferred income taxes |
6,755 | 7,451 | ||||||
| Investments in partially-owned affiliates held for sale (Note 2) |
8,211 | — | ||||||
| Other current assets |
19,746 | 20,583 | ||||||
|
|
|
|
|
|||||
| Total current assets |
200,292 | 236,945 | ||||||
| Property, plant and equipment—net |
126,286 | 125,419 | ||||||
| Goodwill |
34,198 | 34,198 | ||||||
| Other intangible assets—net |
49,131 | 47,765 | ||||||
| Investments in partially-owned affiliates |
5,547 | 5,636 | ||||||
| Deferred income taxes |
2,066 | 2,066 | ||||||
| Other assets—net |
5,497 | 5,086 | ||||||
|
|
|
|
|
|||||
| Total assets |
$ | 423,017 | $ | 457,115 | ||||
|
|
|
|
|
|||||
| Liabilities and Shareholders’ Equity |
||||||||
| Current liabilities |
||||||||
| Current portion of long-term debt |
$ | 6,904 | $ | 6,453 | ||||
| Accounts payable |
58,042 | 70,690 | ||||||
| Accrued compensation and employee benefits |
20,831 | 18,168 | ||||||
| Accrued interest |
2,998 | 2,987 | ||||||
| Accrued income taxes |
2,764 | 8,201 | ||||||
| Liabilities related to fire (Note 15) |
1,000 | 942 | ||||||
| Deferred income taxes |
105 | 105 | ||||||
| Other current liabilities |
19,679 | 19,458 | ||||||
|
|
|
|
|
|||||
| Total current liabilities |
112,323 | 127,004 | ||||||
| Long-term debt |
235,831 | 250,497 | ||||||
| Postretirement health and other benefits |
11,134 | 11,044 | ||||||
| Multiemployer pension plan withdrawal liability |
2,213 | 2,173 | ||||||
| Deferred income taxes |
27,774 | 25,399 | ||||||
| Other long-term liabilities |
3,270 | 3,147 | ||||||
|
|
|
|
|
|||||
| Total liabilities |
392,545 | 419,264 | ||||||
|
|
|
|
|
|||||
| Commitments and contingencies (Note 14) |
||||||||
| Shareholders’ equity: |
||||||||
| Common stock, $0.001 par value |
||||||||
| 1,000 shares authorized, 1,000 shares issued and outstanding |
— | — | ||||||
| Additional paid-in capital |
25,358 | 25,407 | ||||||
| Retained earnings |
4,640 | 12,375 | ||||||
| Accumulated other comprehensive income |
474 | 69 | ||||||
|
|
|
|
|
|||||
| Total shareholders’ equity |
30,472 | 37,851 | ||||||
|
|
|
|
|
|||||
| Total liabilities and shareholders’ equity |
$ | 423,017 | $ | 457,115 | ||||
|
|
|
|
|
|||||
The accompanying notes are an integral part of these condensed consolidated financial statements.
F-4
Table of Contents
Condensed Consolidated Statements of Cash Flows
(In thousands)
(Unaudited)
| Three Months Ended | ||||||||
| March 29, 2013 |
March 28, 2014 |
|||||||
| Cash flows from operating activities |
||||||||
| Net income |
$ | 2,641 | $ | 7,735 | ||||
|
|
|
|
|
|||||
| Adjustments to reconcile net income to net cash used in operating activities: |
||||||||
| Depreciation |
5,364 | 4,960 | ||||||
| Amortization of intangible assets |
1,356 | 1,364 | ||||||
| Amortization of deferred financing costs and debt discount |
306 | 218 | ||||||
| Write-off of deferred financing costs due to debt extinguishment |
1,423 | — | ||||||
| Equity income, net of dividends |
(225 | ) | (315 | ) | ||||
| Deferred income taxes |
1,046 | (3,070 | ) | |||||
| Loss on disposals of property, plant and equipment—net |
5 | 123 | ||||||
| Gain from sale of joint ventures (Note 2) |
— | (3,508 | ) | |||||
| Gain from involuntary conversion of property, plant and equipment (Note 15) |
(1,927 | ) | — | |||||
| Non-cash stock compensation |
51 | 49 | ||||||
| Net increase (decrease) in cash due to changes in: |
||||||||
| Accounts receivable |
(25,047 | ) | (33,331 | ) | ||||
| Inventories |
(1,014 | ) | (4,329 | ) | ||||
| Insurance receivable |
(1,122 | ) | — | |||||
| Other current assets |
(946 | ) | (826 | ) | ||||
| Accounts payable |
11,029 | 12,812 | ||||||
| Accrued compensation and employee benefits |
(3,583 | ) | (2,680 | ) | ||||
| Accrued interest |
933 | (11 | ) | |||||
| Accrued income taxes |
(1,177 | ) | 5,437 | |||||
| Liabilities related to fire |
(270 | ) | (58 | ) | ||||
| Other—net |
640 | (502 | ) | |||||
|
|
|
|
|
|||||
| Total adjustments |
(13,158 | ) | (23,667 | ) | ||||
|
|
|
|
|
|||||
| Net cash used in operating activities |
(10,517 | ) | (15,932 | ) | ||||
|
|
|
|
|
|||||
| Cash flows from investing activities |
||||||||
| Proceeds from disposals of property, plant and equipment and other assets |
842 | 123 | ||||||
| Proceeds from sale of joint ventures |
— | 11,500 | ||||||
| Insurance proceeds related to property, plant and equipment |
161 | — | ||||||
| Payments for property, plant and equipment |
(5,833 | ) | (4,430 | ) | ||||
| Acquisitions of patents |
(9 | ) | — | |||||
|
|
|
|
|
|||||
| Net cash (used in) provided by investing activities |
(4,839 | ) | 7,193 | |||||
|
|
|
|
|
|||||
| Cash flows from financing activities |
||||||||
| Payment of capitalized debt issuance costs |
(3,690 | ) | — | |||||
| Payments of previous U.S. term loan |
(178,534 | ) | — | |||||
| Proceeds from new U.S. term loan |
225,000 | — | ||||||
| Payments of new U.S. term loan |
— | (588 | ) | |||||
| Proceeds from U.S. revolving loans |
10,500 | 31,575 | ||||||
| Payments of U.S. revolving loans |
(7,400 | ) | (16,025 | ) | ||||
| Proceeds from other long-term debt |
207 | 1,055 | ||||||
| Payments of other long-term debt |
(3,571 | ) | (1,841 | ) | ||||
| Payments of preferred stock redemptions (Note 10) |
(24,830 | ) | — | |||||
| Payments of common stock dividends (Note 11) |
(24,962 | ) | — | |||||
|
|
|
|
|
|||||
| Net cash (used in) provided by financing activities |
(7,280 | ) | 14,176 | |||||
| Effect of exchange rate changes on cash and cash equivalents |
(78 | ) | 45 | |||||
|
|
|
|
|
|||||
| Net (decrease) increase in cash and cash equivalents |
(22,714 | ) | 5,482 | |||||
| Cash and cash equivalents, beginning of period |
29,557 | 16,318 | ||||||
|
|
|
|
|
|||||
| Cash and cash equivalents, end of period |
$ | 6,843 | $ | 21,800 | ||||
|
|
|
|
|
|||||
The accompanying notes are an integral part of these condensed consolidated financial statements.
F-5
Table of Contents
Notes to Condensed Consolidated Financial Statements
(Unaudited)
| 1. | Accounting Policies and Pending Business Combination |
Basis of presentation
The accompanying unaudited condensed consolidated financial statements of Jason Partners Holdings Inc. and its subsidiaries (“the Company”) have been prepared in accordance with generally accepted accounting principles for interim financial reporting and Article 10 of Regulation S-X. Accordingly, they do not include all of the information and footnotes required by generally accepted accounting principles for complete financial statements. The condensed consolidated balance sheet data as of December 31, 2013 was derived from the Company’s audited financial statements, but does not include all disclosures required by generally accepted accounting principles. For additional information, including the Company’s significant accounting policies, refer to the consolidated financial statements and related footnotes in the Company’s financial statements for the periods ended December 31, 2011, 2012 and 2013.
The Company’s year ends on December 31. Throughout the year, the Company reports its results using a fiscal calendar whereby each three month quarterly reporting period is approximately thirteen weeks in length, ending on a Friday. The exceptions are the first quarter, which begins on January 1, and the fourth quarter, which ends on December 31. For 2013, the Company’s fiscal quarters are comprised of the three months ended March 29, June 28, September 27 and December 31. In 2014, the Company’s first quarter is comprised of the three months ended March 28.
In the opinion of management, all adjustments considered necessary for a fair statement of financial results have been made. Such adjustments consist of only those of a normal recurring nature. Operating results for the three months ended March 28, 2014 are not necessarily indicative of the results that may be expected for the entire year ending December 31, 2014.
Recently issued accounting standards
In March 2013, the Financial Accounting Standards Board (“FASB”) issued amended guidance for cumulative translation adjustments upon derecognition of certain subsidiaries or groups of assets within a foreign entity or of an investment in a foreign entity. These amendments provide guidance on releasing cumulative translation adjustments when a reporting entity ceases to have a controlling financial interest in a subsidiary or group of assets that is a nonprofit activity or a business within a foreign entity. In addition, these amendments provide guidance on the release of cumulative translation adjustments in partial sales of equity method investments and in step acquisitions. The amendments are effective on a prospective basis for fiscal years and interim reporting periods within those years, beginning after December 15, 2013. The adoption of this guidance did not have a material impact on the Company’s condensed consolidated financial statements.
In July 2013, the FASB issued guidance designed to clarify the financial statement presentation requirements of an unrecognized tax benefit when a net operating loss carryforward, a similar tax loss or a tax credit carryforward exists. This guidance is effective for reporting periods beginning after December 15, 2013, and did not have a material impact on the Company’s condensed consolidated financial statements.
In April 2014, the FASB issued guidance changing the criteria for reporting discontinued operations. Under the new guidance, only disposals representing a strategic shift in operations should be presented as discontinued operations. Those strategic shifts should have a major effect on the organization’s operating and financial results. The new guidance also expanded the disclosures requirements about discontinued operations. The new guidance is effective for fiscal years and reporting periods beginning after December 15, 2014 with early adoption permitted. The impact of the adoption of this guidance on the Company’s condensed consolidated financial statements will depend on the Company’s future disposal activity.
F-6
Table of Contents
Pending business combination
On March 17, 2014, the Company and Quinpario Acquisition Corp. (“QPAC”), a publicly-held company listed on the NASDAQ, announced they had reached a definitive agreement for QPAC to acquire the Company from its current owners, Saw Mill Capital, LLC, Falcon Investment Advisors, LLC and other investors. The purchase price of $538.65 million will be funded by the cash proceeds from QPAC’s initial public offering, new debt and rollover equity invested by the current owners and management of the Company. The acquisition is expected to be completed in the second or third quarter of 2014, pending regulatory and shareholder approval, and satisfaction of customary closing conditions.
| 2. | Sale of Joint Ventures |
During the first quarter of 2014, the Company completed the sale of its 50% equity interest in two of its joint ventures for a total of $11.5 million. The sale of one of the joint ventures in the amount of $7.5 million was completed in January 2014 and the sale of the second joint venture in the amount of $4.0 million was completed in March 2014. The Company recorded a $3.5 million gain on the sale of the joint ventures, which is reported separately on the condensed consolidated statements of operations. The gain includes the recognition of $0.6 million of cumulative translation adjustments which had been recorded in accumulated other comprehensive income. The $0.6 million is reported separately in the condensed consolidated statements of comprehensive income. Terms of the sale include a supply agreement which will allow the Company to purchase product at established prices over the agreement’s three-year term.
| 3. | Restructuring Costs |
The Company has continued to make changes to its worldwide manufacturing footprint. These actions resulted in charges relating to employee severance and other related charges, such as exit costs for consolidation and closure of plant facilities, employee relocation and lease termination costs. During the three months ended March 29, 2013 and March 28, 2014, the Company incurred $0.1 million and $0.6 million of restructuring charges, respectively. These restructuring costs are presented separately on the condensed consolidated statements of operations. The following table presents the restructuring liability activity for the three month periods ended March 29, 2013 and March 28, 2014:
| Severance costs |
Lease termination costs |
Other costs | Total | |||||||||||||
| Balance—December 31, 2012 |
$ | 180 | $ | 1,070 | $ | 98 | $ | 1,348 | ||||||||
| Current period restructuring charges |
72 | — | — | 72 | ||||||||||||
| Cash payments |
(81 | ) | (25 | ) | (98 | ) | (204 | ) | ||||||||
|
|
|
|
|
|
|
|
|
|||||||||
| Balance—March 29, 2013 |
$ | 171 | $ | 1,045 | $ | — | $ | 1,216 | ||||||||
|
|
|
|
|
|
|
|
|
|||||||||
| Severance costs |
Lease termination costs |
Other costs | Total | |||||||||||||
| Balance—December 31, 2013 |
$ | 1,112 | $ | 818 | $ | 65 | $ | 1,995 | ||||||||
| Current period restructuring charges |
405 | — | 242 | 647 | ||||||||||||
| Cash payments |
(786 | ) | (120 | ) | (307 | ) | (1,213 | ) | ||||||||
|
|
|
|
|
|
|
|
|
|||||||||
| Balance—March 28, 2014 |
$ | 731 | $ | 698 | $ | — | $ | 1,429 | ||||||||
|
|
|
|
|
|
|
|
|
|||||||||
The accruals for severance presented above relate to costs incurred in the Finishing and Acoustics segments. These accruals are expected to be utilized during the next twelve months and are recorded within other current liabilities on the condensed consolidated balance sheets. The accrual for lease termination costs relates to restructuring costs within the Components segment. At December 31, 2013 and March 28, 2014, $0.5 million and $0.4 million, respectively, is recorded within other long-term liabilities and $0.3 million and $0.3 million, respectively, is recorded within other current liabilities on the condensed consolidated balance sheets.
F-7
Table of Contents
| 4. | Related Party Transactions |
The Company is part of a Management Services Agreement with Saw Mill Capital LLC (“Saw Mill”) and Falcon Investment Advisors, LLC (“FIA”, together with Saw Mill, the “Service Providers”), affiliates of the Company’s majority shareholders. Management fees and related expenses paid to the Service Providers under this agreement were approximately $0.3 million for the three months ended March 29, 2013 and March 28, 2014. In addition, during the three months ended March 29, 2013 the Company paid fees of $2.3 million to the Service Providers in connection with the refinancing discussed in Note 9.
| 5. | Accounts Receivable |
Accounts receivable at December 31, 2013 and March 28, 2014 consisted of the following (in thousands):
| December 31, 2013 |
March 28, 2014 |
|||||||
| Accounts Receivable |
$ | 79,230 | $ | 112,659 | ||||
| Allowance for Doubtful Accounts |
(2,227 | ) | (2,216 | ) | ||||
|
|
|
|
|
|||||
| $ | 77,003 | $ | 110,443 | |||||
|
|
|
|
|
|||||
| 6. | Inventories |
Inventories at December 31, 2013 and March 28, 2014 consisted of the following (in thousands):
| December 31, 2013 |
March 28, 2014 |
|||||||
| Raw material |
$ | 37,562 | $ | 41,051 | ||||
| Work-in-process |
5,653 | 7,303 | ||||||
| Finished goods |
29,044 | 28,314 | ||||||
|
|
|
|
|
|||||
| $ | 72,259 | $ | 76,668 | |||||
|
|
|
|
|
|||||
| 7. | Property, Plant and Equipment |
Property, plant and equipment at December 31, 2013 and March 28, 2014 consisted of the following (in thousands):
| December 31, 2013 |
March 28, 2014 |
|||||||
| Land and improvements |
$ | 6,987 | $ | 7,006 | ||||
| Buildings and improvements |
38,258 | 38,790 | ||||||
| Machinery and equipment |
128,284 | 128,861 | ||||||
| Construction-in-progress |
10,119 | 11,613 | ||||||
|
|
|
|
|
|||||
| 183,648 | 186,270 | |||||||
| Less: Accumulated depreciation |
(57,362 | ) | (60,851 | ) | ||||
|
|
|
|
|
|||||
| $ | 126,286 | $ | 125,419 | |||||
|
|
|
|
|
|||||
F-8
Table of Contents
| 8. | Goodwill and Other Intangible Assets |
The Company’s goodwill balance by reportable segment at December 31, 2013 and March 28, 2014 were as follows (in thousands):
| Seating |
Components |
Total | ||
| $19,402 |
$14,796 | $34,198 |
The Company’s other intangible assets at December 31, 2013 and March 28, 2014 consisted of the following (in thousands):
| December 31, 2013 | March 28, 2014 | |||||||||||||||||||||||
| Gross Carrying Amount |
Accumulated Amortization |
Net | Gross Carrying Amount |
Accumulated Amortization |
Net | |||||||||||||||||||
| Patents |
$ | 2,337 | $ | (948 | ) | $ | 1,389 | $ | 2,337 | $ | (1,030 | ) | $ | 1,307 | ||||||||||
| Customer relationships |
37,290 | (7,611 | ) | 29,679 | 37,290 | (8,248 | ) | 29,042 | ||||||||||||||||
| Trademarks and other intangibles |
25,820 | (7,757 | ) | 18,063 | 25,820 | (8,404 | ) | 17,416 | ||||||||||||||||
|
|
|
|
|
|
|
|
|
|
|
|
|
|||||||||||||
| Total amortized other intangible assets |
$ | 65,447 | $ | (16,316 | ) | $ | 49,131 | $ | 65,447 | $ | (17,682 | ) | $ | 47,765 | ||||||||||
|
|
|
|
|
|
|
|
|
|
|
|
|
|||||||||||||
| 9. | Revolving Loans and Other Long-Term Debt Instruments |
At December 31, 2013 and March 28, 2014, the Company assessed the amounts recorded under revolving loans and long-term debt and determined that such amounts approximated fair value. The fair value of the debt was based on quoted inactive market prices and is therefore classified as Level 2 within the valuation hierarchy.
Revolving loans and other long-term debt instruments at December 31, 2013 and March 28, 2014 consisted of the following (in thousands):
| December 31, 2013 |
March 28, 2014 |
|||||||
| U.S. term loan |
$ | 229,438 | $ | 228,850 | ||||
| Debt discount on U.S. term loan |
(429 | ) | (408 | ) | ||||
| U.S. revolving loans |
— | 15,550 | ||||||
| Foreign debt |
11,304 | 10,665 | ||||||
| Capital lease obligations |
2,422 | 2,293 | ||||||
|
|
|
|
|
|||||
| 242,735 | 256,950 | |||||||
| Less: Current portion |
(6,904 | ) | (6,453 | ) | ||||
|
|
|
|
|
|||||
| $ | 235,831 | $ | 250,497 | |||||
|
|
|
|
|
|||||
Credit facility—refinancing and amendment
In February 2013, the Company replaced its existing credit agreement with a new $260.0 million senior secured credit facility. The new facility included a six-year, $225.0 million senior secured term loan and a five-year, $35.0 million revolving loan. The borrowings under the term loan, along with existing cash, were used to retire borrowings outstanding under a previous term loan of $178.5 million, redeem 17,757.7 shares of preferred stock for $24.8 million, pay a cash dividend to common shareholders of $25.0 million and pay various expenses associated with the refinancing. In November 2013, the credit facility was amended to increase borrowings by $10.0 million, as allowed by the agreement.
The refinancing of the term loan portion of the former facility resulted in recognition of a significant portion of the debt as a debt extinguishment in the first quarter of 2013. The extinguishment was caused by the
F-9
Table of Contents
change in the projected present value of cash flows under the new agreement, resulting in a loss on extinguishment of $5.4 million. This amount is included in interest expense during the three months ended March 29, 2013 and includes $4.0 million of lender fees incurred through the refinancing as well as a $1.4 million write-off of unamortized deferred financing costs related to the old credit facility. In addition, the Company has included $0.2 million in interest expense related to other debt issuance costs that were allocated to a portion of the debt which the Company treated as a debt modification. The Company capitalized additional debt issuance costs of $2.6 million in connection with the refinancing that will be expensed over the life of the term loan. Furthermore, the Company capitalized an additional $1.1 million of debt issuance costs related to the refinancing of the revolving loan facility. These costs will be amortized over the life of the agreement on a straight-line basis.
At December 31, 2013, the interest rate on the term loan was 5.00%. At March 28, 2014, the interest rates on the outstanding balances of the term loan and the revolving loan were 5% and 6%, respectively. At March 28, 2014, the Company had a total of $15.5 million of availability for additional borrowings under the $35.0 million revolving loan facility as the Company had the outstanding balance $15.6 million and letters of credit outstanding of $3.9 million which reduce availability under the facility. The revolver is subject to a fee of 3.75% on all outstanding letters of credit and a fee of 0.50% on the unused portion of the facility, payable on a monthly basis.
Foreign debt
At December 31, 2013 and March 28, 2014, the Company has recorded $11.3 million and $10.7 million, respectively, in foreign debt obligations, including various overdraft facilities and term loans. The largest foreign debt balances are held by the Company’s subsidiaries in Germany (approximately $6.8 million and $6.3 million as of December 31, 2013 and March 28, 2014, respectively) and Mexico (approximately $2.7 million and $1.8 million as of December 31, 2013 and March 28, 2014, respectively). These various foreign loans are comprised of individual outstanding obligations ranging from approximately $0.1 million to $3.0 million as of December 31, 2013 and March 28, 2014.
| 10. | Redeemable Preferred Stock |
During 2013, the Company redeemed all of the 35,000 outstanding preferred shares at the end of 2012. The redemption totaled $48.4 million, which included the $35.0 million original liquidation value, accumulated and unpaid dividends of $11.2 million and a redemption premium of $2.2 million. Dividends on the preferred stock had accrued each quarter on a cumulative basis at a rate of 10% per year and compounded quarterly through February 28, 2013, and at a rate of 12% after that date through the final redemption on November 14, 2013.
In February 2013, in connection with the refinancing discussed in Note 9, the Company exercised its option and redeemed 17,757.7 shares, leaving 17,242.3 shares outstanding at March 29, 2013. Total consideration paid related to the redemption was $24.8 million which included a redemption premium of $2.2 million. In the first quarter of 2013, the company recognized approximately $1.0 million of accretion of preferred stock dividends and redemption premium which is reported on the condensed consolidated statements of operations and recorded as a reduction to retained earnings during the quarter.
| 11. | Shareholders’ Equity |
At December 31, 2013 and March 28, 2014, the Company had authorized for issuance 1,000 shares of $0.001 par value common stock of which 1,000 shares of common stock were issued and outstanding.
During 2013, the Company paid $43.1 million of dividends to common shareholders. The dividends were recorded as a reduction to retained earnings and additional contributed capital. In February 2013, in connection with the refinancing discussed in Note 9, a dividend of $25.0 million was declared and paid to common shareholders.
F-10
Table of Contents
The changes in the shareholders’ equity balances for the three months ended March 28, 2014 are as follows (in thousands):
| Common Stock |
Additional Contributed Capital |
Retained Earnings |
Accumulated Other Comprehensive Income |
Total | ||||||||||||||||
| Balance at December 31, 2013 |
$ | — | $ | 25,358 | $ | 4,640 | $ | 474 | $ | 30,472 | ||||||||||
| Stock compensation activity |
— | 49 | — | — | 49 | |||||||||||||||
| Net income |
— | — | 7,735 | — | 7,735 | |||||||||||||||
| Employee retirement plan adjustments, net of tax |
— | — | — | 57 | 57 | |||||||||||||||
| Foreign currency translation adjustments |
— | — | — | (462 | ) | (462 | ) | |||||||||||||
|
|
|
|
|
|
|
|
|
|
|
|||||||||||
| Balance at March 28, 2014 |
$ | — | $ | 25,407 | $ | 12,375 | $ | 69 | $ | 37,851 | ||||||||||
|
|
|
|
|
|
|
|
|
|
|
|||||||||||
The changes in the components of accumulated other comprehensive income (loss), net of taxes, for the three months ended March 29, 2013 and March 28, 2014 are as follows (in thousands):
| Employee retirement plan adjustments |
Foreign currency translation adjustments |
Total | ||||||||||
| Balance at December 31, 2012 |
$ | (1,158 | ) | $ | (1,101 | ) | $ | (2,259 | ) | |||
| Amounts reclassified from accumulated other comprehensive income |
79 | — | 79 | |||||||||
| Foreign currency translation adjustments |
— | (813 | ) | (813 | ) | |||||||
|
|
|
|
|
|
|
|||||||
| Balance at March 29, 2013 |
$ | (1,079 | ) | $ | (1,914 | ) | $ | (2,993 | ) | |||
|
|
|
|
|
|
|
|||||||
| Employee retirement plan adjustments |
Foreign currency translation adjustments |
Total | ||||||||||
| Balance at December 31, 2013 |
$ | (156 | ) | $ | 630 | $ | 474 | |||||
| Amounts reclassified from accumulated other comprehensive income |
57 | — | 57 | |||||||||
| Cumulative foreign currency translation adjustments associated with joint ventures sold |
— | (591 | ) | (591 | ) | |||||||
| Foreign currency translation adjustments |
— | 129 | 129 | |||||||||
|
|
|
|
|
|
|
|||||||
| Balance at March 28, 2014 |
$ | (99 | ) | $ | 168 | $ | 69 | |||||
|
|
|
|
|
|
|
|||||||
Employee retirement plan adjustments of $0.1 million were reclassified from accumulated other comprehensive income (loss), primarily into selling and administrative expenses, on the condensed consolidated statement of operations during each of the three months ended March 29, 2013 and March 28, 2014. During the three months ended March 28, 2014, $0.6 million of cumulative foreign currency translation adjustments were recognized as part of the $3.5 million gain on the sale of joint ventures on the condensed consolidated statement of operations.
| 12. | Income Taxes |
At the end of each three month period, the Company estimates a base effective tax rate expected for the full year based on the most recent forecast of pre-tax income, permanent book and tax differences, and global tax planning strategies. The Company uses this base rate to provide for income taxes on a year-to-date basis, excluding the effect of significant, unusual, discrete or extraordinary items, and items that are reported net of their related tax effects. The Company records the tax effect of significant, unusual, discrete or extraordinary items, and items that are reported net of their tax effects in the period in which they occur.
F-11
Table of Contents
The provision for income taxes as a percentage of earnings before income taxes was 35.0% and 36.7% for the three months ended March 29, 2013 and March 28, 2014, respectively. The Company’s income tax expense is impacted by a number of factors, including the amount of taxable earnings derived in foreign jurisdictions with tax rates that are higher or lower than the U.S. federal statutory rate, permanent items, state tax rates, and the ability to utilize net operating loss carryforwards. The Company recognized net discrete tax expense of $1.5 million for the three months ended March 28, 2014, which was primarily related to the sale of joint ventures. Net discrete tax expense was immaterial for the three months ended March 29, 2013.
The amount of gross unrecognized tax benefits was $3.7 million and $3.9 million at December 31, 2013 and March 28, 2014, respectively. Of the $3.9 million of unrecognized tax benefits, $2.5 million would reduce our effective tax rate if recognized.
The Company believes it is reasonably possible that the amount of gross unrecognized tax benefits could be reduced by up to $2.1 million in the next 12 months as a result of the resolution of tax matters in various global jurisdictions and the lapses of statutes of limitations.
The Company recognizes interest and penalties related to tax matters in tax expense. Accrued interest and penalties were immaterial at December 31, 2013 and March 28, 2014.
| 13. | Business Segments, Geographic and Customer Information |
The Company identifies its segments using the “management approach,” which designates the internal organization that is used by management for making operating decisions and assessing performance as the source of the company’s reportable segments. The Company has four reportable segments: Seating, Automotive Acoustics, Finishing and Components.
Sales information relating to the Company’s reportable segments is as follows for the three months ended March 29, 2013 and March 28, 2014 (in thousands):
| Three Months Ended | ||||||||
| March 29, 2013 |
March 28, 2014 |
|||||||
| Net sales |
||||||||
| Seating |
$ | 52,937 | $ | 52,291 | ||||
| Acoustics |
48,403 | 53,007 | ||||||
| Finishing |
45,061 | 46,583 | ||||||
| Components |
33,268 | 34,655 | ||||||
|
|
|
|
|
|||||
| $ | 179,669 | $ | 186,536 | |||||
|
|
|
|
|
|||||
The Company uses “Adjusted EBITDA” as the primary measure of profit or loss for the purposes of assessing the operating performance of its segments. The Company defines EBITDA as net income (loss) before interest expense, provision (benefit) for income taxes, depreciation and amortization and (gain)/loss on disposal of property, plant and equipment. The Company defines Adjusted EBITDA as EBITDA, excluding the impact of non-cash or non-operational losses or gains, including long-lived asset impairment charges, operational restructuring charges, transactional legal fees, other professional fees and special employee bonuses, Newcomerstown fire losses and gains, multiemployer pension plan withdrawal expense (gain), purchase accounting adjustments and Management Services Agreement fees and expenses.
Management believes that Adjusted EBITDA provides a clear picture of the Company’s operating results by eliminating expenses and income that are not reflective of the underlying business performance. Certain corporate-level administrative expenses such as payroll and benefits, incentive compensation, travel, marketing, accounting, auditing and legal fees and certain other expenses are kept within its corporate results and not allocated to its business segments. Adjusted EBITDA is used to facilitate a comparison of the Company’s operating performance on a consistent basis from period to period and to analyze the factors and
F-12
Table of Contents
trends affecting its segments. The Company’s internal plans, budgets and forecasts use Adjusted EBITDA as a key metric. In addition, this measure is used to evaluate its operating performance and segment operating performance and to determine the level of incentive compensation paid to its employees.
As the Company uses Adjusted EBITDA as its primary measure of segment performance, US GAAP rules on segment reporting require the Company to include this measure in its discussion of segment operating results. The Company must also reconcile Adjusted EBITDA to operating results presented on a US GAAP basis.
Adjusted EBITDA information relating to the Company’s reportable segments is presented below followed by a reconciliation of total segment EBITDA to consolidated income before taxes for the three months ended March 29, 2013 and March 28, 2014 (in thousands):
| Three Months Ended | ||||||||
| March 29, 2013 |
March 28, 2014 |
|||||||
| Segment Adjusted EBITDA |
||||||||
| Seating |
$ | 9,319 | $ | 8,111 | ||||
| Acoustics |
5,145 | 4,439 | ||||||
| Finishing |
4,416 | 6,003 | ||||||
| Components |
5,395 | 6,539 | ||||||
|
|
|
|
|
|||||
| $ | 24,275 | $ | 25,092 | |||||
|
|
|
|
|
|||||
| Total segment Adjusted EBITDA |
$ | 24,275 | $ | 25,092 | ||||
| Interest expense, including intercompany |
(723 | ) | (591 | ) | ||||
| Depreciation and amortization |
(6,689 | ) | (6,296 | ) | ||||
| Gain (loss) on disposal of property, plant and equipment—net |
35 | (122 | ) | |||||
| Restructuring |
(72 | ) | (647 | ) | ||||
| Gain from sale of joint venture |
— | 3,508 | ||||||
| Other operational restructuring related costs |
— | (648 | ) | |||||
| Newcomerstown fire gain |
208 | — | ||||||
|
|
|
|
|
|||||
| Total segment income before income taxes |
17,034 | 20,296 | ||||||
| Corporate general and administrative expenses |
(3,845 | ) | (5,136 | ) | ||||
| Corporate depreciation |
(31 | ) | (28 | ) | ||||
| Corporate loss on disposal of property, plant and equipment |
(40 | ) | (1 | ) | ||||
| Corporate interest expense, including intercompany |
(9,057 | ) | (2,904 | ) | ||||
|
|
|
|
|
|||||
| Consolidated income before taxes |
$ | 4,061 | $ | 12,227 | ||||
|
|
|
|
|
|||||
Assets held by reportable segment as of December 31, 2013 and March 28, 2014 were as follows (in thousands):
| December 31, 2013 |
March 28, 2014 |
|||||||
| Assets |
||||||||
| Seating |
$ | 93,238 | $ | 105,731 | ||||
| Acoustics |
106,031 | 116,178 | ||||||
| Finishing |
136,371 | 142,738 | ||||||
| Components |
93,112 | 103,194 | ||||||
| General Corporate and Eliminations |
(5,735 | ) | (10,726 | ) | ||||
|
|
|
|
|
|||||
| $ | 423,017 | $ | 457,115 | |||||
|
|
|
|
|
|||||
F-13
Table of Contents
| 14. | Litigation and Contingencies |
The Company is a party to various legal proceedings that have arisen in the normal course of its business. These legal proceedings typically include product liability, labor, and patent claims. The Company has recorded reserves for loss contingencies based on the specific circumstances of each case. Such reserves are recorded when it is probable that a loss has been incurred as of the balance sheet date, can be reasonably estimated and is not covered by insurance. In the opinion of management, the resolution of these contingencies will not have a material adverse effect on the Company’s financial condition, results of operations, or cash flows.
At December 31, 2013 and March 28, 2014, the Company held reserves of $1.1 million for environmental matters at two locations. The ultimate cost of any remediation required will depend on the results of future investigation. Based upon available information, the Company believes that it has obtained and is in substantial compliance with those material environmental permits and approvals necessary to conduct its business. Based on the facts presently known, the Company does not expect environmental costs to have a material adverse effect on its financial condition, results of operations or cash flows.
| 15. | Newcomerstown Fire |
On November 27, 2011, the Company experienced a fire at an Acoustics’ facility in Newcomerstown, Ohio (“Newcomerstown”). No one was injured as a result of the fire. Newcomerstown was comprised of approximately 93,000 square feet in one leased building with an additional 38,000 square foot expansion in process. Newcomerstown employed 103 employees prior to the accident. The fire destroyed the entire leased facility and its contents. Newcomerstown manufactured non-woven acoustical fiber insulation for the automotive industry. During 2012, the Company commenced a lease of a facility in Battle Creek, Michigan as a replacement to the Newcomerstown, Ohio location and reached pre-accident production levels at this location during the three months ended September 27, 2013.
The Company negotiated a final settlement with its insurance carrier related to this incident during the three months ended September 27, 2013 and received its final insurance payment during the three months ended December 31, 2013. Other than future payments of liabilities recorded to third parties, the Company finalized its accounting for the incident during the three months ended December 31, 2013. As a result, there were no expenses (income) during the three months ended March 28, 2014. For the three months ended March 29, 2013, the Company recorded the following expenses (income) related to the incident (in thousands):
| Three Months Ended March 29, 2013 |
||||
| Business interruption expenses |
$ | 3,479 | ||
| Less insurance recoveries: |
||||
| Property |
(1,927 | ) | ||
| Business interruption |
(1,760 | ) | ||
|
|
|
|||
| Subtotal insurance recoveries |
(3,687 | ) | ||
|
|
|
|||
| Net fire gain |
$ | (208 | ) | |
|
|
|
|||
Through the date of the settlement mentioned above, the Company has recorded insurance recoveries in the amount of $61.9 million of which $26.9 million related to property and $35.0 million related to business interruption. The Company has recorded $1.0 million and $0.9 million of liabilities for estimated expenses to be paid as of December 31, 2013 and March 28, 2014, respectively. The Company has recorded a loss of $1.7 million associated with business interruption expenses, net of recovery and a gain of $1.9 million from involuntary conversion of property, plant and equipment for the three months ended March 29, 2013. The Company received $0.8M of recoveries from its insurance carrier during the three months ended March 29, 2013.
F-14
Table of Contents
| 16. | Subsequent Events |
On June 30, 2014 the Company and QPAC consummated the previously announced business combination described in Note 1. In connection with the closing of the business combination, QPAC changed its name from Quinpario Acquisition Corp. to Jason Industries, Inc.
On June 30, 2014, Jason Incorporated, a subsidiary of the Company, as the borrower, entered into (i) the First Lien Credit Agreement, dated as of June 30, 2014, with Jason Partners Holdings Inc. (“Jason”), Jason Holdings, Inc. I (“Intermediate Holdings”), Deutsche Bank AG New York Branch, as administrative agent (the “First Lien Administrative Agent”), the subsidiary guarantors party thereto and the several banks and other financial institutions or entities from time to time party thereto (the “New First Lien Credit Agreement”) and (ii) the Second Lien Credit Agreement, dated as of June 30, 2014, with Jason, Intermediate Holdings, Deutsche Bank AG New York Branch, as administrative agent (the “Second Lien Administrative Agent”), the subsidiary guarantors party thereto and the several banks and other financial institutions or entities from time to time party thereto (the “New Second Lien Credit Agreement” and, together with the New First Lien Credit Agreement, the “New Credit Agreements”).
The New First Lien Credit Agreement provides for (i) term loans in an aggregate principal amount of $310,000,000 (the “First Lien Term Facility” and the loans thereunder the “First Lien Term Loans”) and (ii) a revolving loan of up to $40,000,000 (including revolving loans, swingline loans and letters of credit) (the “Revolving Credit Facility”), in each case under the new first lien senior secured loan facilities (the “First Lien Credit Facilities”). The New Second Lien Credit Agreement provides for term loans in an aggregate principal amount of $110,000,000 under the new second lien senior secured term loan facility (the “Second Lien Term Facility” and the loans thereunder the “Second Lien Term Loans” and, the Second Lien Term Facility together with the First Lien Credit Facilities, the “New Credit Facilities”). Substantially concurrently with the consummation of the business combination, the full amount of the first lien terms loans and second lien term loans were drawn, and no revolving loans were drawn.
Recognized subsequent events were evaluated through June 3, 2014, which was the date of issuance of the financial statements and disclosure of unrecognized subsequent events were evaluated through July 14, 2014.
F-15
Table of Contents
Report of Independent Registered Public Accounting Firm
To the Board of Directors and Shareholders
of Jason Partners Holdings Inc.:
In our opinion, the accompanying consolidated balance sheets and the related consolidated statements of operations, comprehensive income, shareholders’ equity and cash flows present fairly, in all material respects, the financial position of Jason Partners Holdings Inc. and its subsidiaries at December 31, 2013 and December 31, 2012, and the results of their operations and their cash flows for each of the three years in the period ended December 31, 2013 in conformity with accounting principles generally accepted in the United States of America. In addition, in our opinion, the accompanying financial statement schedules listed in the Index to Consolidated Financial Statements of Jason Partners Holdings Inc. present fairly, in all material respects, the information set forth therein when read in conjunction with the related consolidated financial statements. These financial statements and financial statement schedules are the responsibility of the Company’s management. Our responsibility is to express an opinion on these financial statements and financial statement schedules based on our audits. We conducted our audits of these statements in accordance with the standards of the Public Company Accounting Oversight Board (United States). Those standards require that we plan and perform the audit to obtain reasonable assurance about whether the financial statements are free of material misstatement. An audit includes examining, on a test basis, evidence supporting the amounts and disclosures in the financial statements, assessing the accounting principles used and significant estimates made by management, and evaluating the overall financial statement presentation. We believe that our audits provide a reasonable basis for our opinion.
/s/ PricewaterhouseCoopers LLP
Milwaukee, Wisconsin
March 12, 2014
F-16
Table of Contents
Consolidated Statements of Operations
(In thousands, except share and per share amounts)
| For the Years Ended December 31, | ||||||||||||
| 2011 | 2012 | 2013 | ||||||||||
| Net sales |
$ | 600,557 | $ | 655,020 | $ | 680,845 | ||||||
| Cost of goods sold |
469,943 | 515,154 | 527,371 | |||||||||
|
|
|
|
|
|
|
|||||||
| Gross profit |
130,614 | 139,866 | 153,474 | |||||||||
| Selling and administrative expenses |
96,302 | 99,139 | 109,962 | |||||||||
| Newcomerstown fire loss (gain)—net (Note 18) |
2,947 | 4,736 | (12,483 | ) | ||||||||
| Impairment of long-lived assets |
1,288 | 544 | — | |||||||||
| Loss on disposals of fixed assets—net |
62 | 472 | 22 | |||||||||
| Restructuring (Note 3) |
710 | 1,631 | 2,950 | |||||||||
| Multiemployer pension plan withdrawal expense (gain) (Note 15) |
— | 3,395 | (696 | ) | ||||||||
|
|
|
|
|
|
|
|||||||
| Operating income |
29,305 | 29,949 | 53,719 | |||||||||
| Interest expense |
(17,011 | ) | (18,612 | ) | (20,716 | ) | ||||||
| Equity income |
865 | 1,510 | 2,345 | |||||||||
| Gain from involuntary conversion of property, plant and equipment (Note 18) |
— | 6,103 | 6,351 | |||||||||
| Other income (expense)—net |
266 | 543 | 636 | |||||||||
|
|
|
|
|
|
|
|||||||
| Income before income taxes |
13,425 | 19,493 | 42,335 | |||||||||
| Tax provision |
4,117 | 4,828 | 18,247 | |||||||||
|
|
|
|
|
|
|
|||||||
| Net income |
9,308 | 14,665 | 24,088 | |||||||||
| Accretion of preferred stock dividends and redemption premium |
3,733 | 6,312 | 2,405 | |||||||||
|
|
|
|
|
|
|
|||||||
| Net income available to common shareholders |
$ | 5,575 | $ | 8,353 | $ | 21,683 | ||||||
|
|
|
|
|
|
|
|||||||
| Net income per share available to common shareholders: |
||||||||||||
| Basic and diluted |
$ | 5,575 | $ | 8,353 | $ | 21,683 | ||||||
| Weighted average number of common shares outstanding: |
||||||||||||
| Basic and diluted |
1,000 | 1,000 | 1,000 | |||||||||
| Cash dividends paid per common share |
$ | — | $ | — | $ | 43,055 | ||||||
The accompanying notes are an integral part of these consolidated financial statements.
F-17
Table of Contents
Consolidated Statements of Comprehensive Income
(In thousands)
| For the Years Ended December 31, | ||||||||||||
| 2011 | 2012 | 2013 | ||||||||||
| Net income |
$ | 9,308 | $ | 14,665 | $ | 24,088 | ||||||
| Other comprehensive income (loss), net of tax: |
||||||||||||
| Employer retirement plan adjustments, net of tax of $(0.3) million, $(0.9) million and $0.7 million, respectively |
(1,236 | ) | (541 | ) | 1,002 | |||||||
| Foreign currency translation adjustments |
(1,607 | ) | 1,073 | 1,731 | ||||||||
|
|
|
|
|
|
|
|||||||
| Total other comprehensive income (loss) |
(2,843 | ) | 532 | 2,733 | ||||||||
|
|
|
|
|
|
|
|||||||
| Comprehensive income |
$ | 6,465 | $ | 15,197 | $ | 26,821 | ||||||
|
|
|
|
|
|
|
|||||||
The accompanying notes are an integral part of these consolidated financial statements.
F-18
Table of Contents
Consolidated Balance Sheets
(In thousands, except share amounts)
| December 31, | ||||||||
| 2012 | 2013 | |||||||
| Assets |
||||||||
| Current assets |
||||||||
| Cash and cash equivalents |
$ | 29,557 | $ | 16,318 | ||||
| Accounts receivable—net |
70,234 | 77,003 | ||||||
| Inventories |
72,195 | 72,259 | ||||||
| Deferred income taxes |
7,462 | 6,755 | ||||||
| Insurance receivable (Note 18) |
2,795 | — | ||||||
| Assets held for sale (Note 8) |
779 | — | ||||||
| Investments in partially-owned affiliates held for sale (Note 1) |
— | 8,211 | ||||||
| Other current assets |
20,159 | 19,746 | ||||||
|
|
|
|
|
|||||
| Total current assets |
203,181 | 200,292 | ||||||
| Property, plant and equipment—net |
121,108 | 126,286 | ||||||
| Goodwill |
34,198 | 34,198 | ||||||
| Other intangible assets—net |
54,394 | 49,131 | ||||||
| Investments in partially-owned affiliates (Note 1) |
12,091 | 5,547 | ||||||
| Deferred income taxes |
3,020 | 2,066 | ||||||
| Other assets—net |
3,362 | 5,497 | ||||||
|
|
|
|
|
|||||
| Total assets |
$ | 431,354 | $ | 423,017 | ||||
|
|
|
|
|
|||||
| Liabilities and Shareholders’ Equity |
||||||||
| Current liabilities |
||||||||
| Current portion of long-term debt |
$ | 8,725 | $ | 6,904 | ||||
| Accounts payable |
55,171 | 58,042 | ||||||
| Accrued compensation and employee benefits |
20,302 | 20,831 | ||||||
| Accrued interest |
147 | 2,998 | ||||||
| Accrued income taxes |
1,623 | 2,764 | ||||||
| Liabilities related to fire (Note 18) |
1,776 | 1,000 | ||||||
| Deferred income taxes |
43 | 105 | ||||||
| Other current liabilities |
14,196 | 19,679 | ||||||
|
|
|
|
|
|||||
| Total current liabilities |
101,983 | 112,323 | ||||||
| Long-term debt |
192,091 | 235,831 | ||||||
| Postretirement health and other benefits |
12,023 | 11,134 | ||||||
| Multiemployer pension plan withdrawal liability (Note 15) |
3,203 | 2,213 | ||||||
| Deferred income taxes |
23,680 | 27,774 | ||||||
| Other long-term liabilities |
3,448 | 3,270 | ||||||
|
|
|
|
|
|||||
| Total liabilities |
336,428 | 392,545 | ||||||
|
|
|
|
|
|||||
| Commitments and contingencies (Note 17) |
||||||||
| Redeemable preferred stock, $0.001 par value (Note 12) |
||||||||
| 49,000 shares authorized, 35,000 shares issued and outstanding at December 31, 2012 and 0 shares issued and outstanding at December 31, 2013 |
46,010 | — | ||||||
| Shareholders’ equity: |
||||||||
| Common stock, $0.001 par value |
||||||||
| 1,000 shares authorized, 1,000 shares issued and outstanding |
— | — | ||||||
| Additional paid-in capital |
37,919 | 25,358 | ||||||
| Retained earnings |
13,256 | 4,640 | ||||||
| Accumulated other comprehensive (loss) income |
(2,259 | ) | 474 | |||||
|
|
|
|
|
|||||
| Total shareholders’ equity |
48,916 | 30,472 | ||||||
|
|
|
|
|
|||||
| Total liabilities and shareholders’ equity |
$ | 431,354 | $ | 423,017 | ||||
|
|
|
|
|
|||||
The accompanying notes are an integral part of these consolidated financial statements.
F-19
Table of Contents
Consolidated Statements of Shareholders’ Equity
(In thousands)
| Common Stock |
Additional Contributed Capital |
Retained Earnings (Deficit) |
Accumulated Other Comprehensive Income (Loss) |
Total | ||||||||||||||||
| Balance at December 31, 2010 |
$ | — | $ | 37,529 | $ | (672 | ) | $ | 52 | $ | 36,909 | |||||||||
| Stock compensation activity (Note 13) |
— | 195 | — | — | 195 | |||||||||||||||
| Accretion of redeemable preferred stock (Note 12) |
— | — | (3,733 | ) | — | (3,733 | ) | |||||||||||||
| Net income |
— | — | 9,308 | — | 9,308 | |||||||||||||||
| Employee retirement plan adjustments, net of tax of $(0.3) million |
— | — | — | (1,236 | ) | (1,236 | ) | |||||||||||||
| Foreign currency translation adjustments |
— | — | — | (1,607 | ) | (1,607 | ) | |||||||||||||
|
|
|
|
|
|
|
|
|
|
|
|||||||||||
| Balance at December 31, 2011 |
$ | — | $ | 37,724 | $ | 4,903 | $ | (2,791 | ) | $ | 39,836 | |||||||||
| Stock compensation activity (Note 13) |
— | 195 | — | — | 195 | |||||||||||||||
| Accretion of redeemable preferred stock (Note 12) |
— | — | (6,312 | ) | — | (6,312 | ) | |||||||||||||
| Net income |
— | — | 14,665 | — | 14,665 | |||||||||||||||
| Employee retirement plan adjustments, net of tax of $(0.9) million |
— | — | — | (541 | ) | (541 | ) | |||||||||||||
| Foreign currency translation adjustments |
— | — | — | 1,073 | 1,073 | |||||||||||||||
|
|
|
|
|
|
|
|
|
|
|
|||||||||||
| Balance at December 31, 2012 |
$ | — | $ | 37,919 | $ | 13,256 | $ | (2,259 | ) | $ | 48,916 | |||||||||
| Stock compensation activity (Note 13) |
— | 195 | — | — | 195 | |||||||||||||||
| Accretion of redeemable preferred stock (Note 12) |
— | — | (2,405 | ) | — | (2,405 | ) | |||||||||||||
| Common stock dividend (Note 13) |
— | (12,756 | ) | (30,299 | ) | — | (43,055 | ) | ||||||||||||
| Net income |
— | — | 24,088 | — | 24,088 | |||||||||||||||
| Employee retirement plan adjustments, net of tax of $0.7 million |
— | — | — | 1,002 | 1,002 | |||||||||||||||
| Foreign currency translation adjustments |
— | — | — | 1,731 | 1,731 | |||||||||||||||
|
|
|
|
|
|
|
|
|
|
|
|||||||||||
| Balance at December 31, 2013 |
$ | — | $ | 25,358 | $ | 4,640 | $ | 474 | $ | 30,472 | ||||||||||
|
|
|
|
|
|
|
|
|
|
|
|||||||||||
The accompanying notes are an integral part of these consolidated financial statements.
F-20
Table of Contents
Consolidated Statements of Cash Flows
(In thousands)
| For the Years Ended December 31, | ||||||||||||
| 2011 | 2012 | 2013 | ||||||||||
| Cash flows from operating activities |
||||||||||||
| Net income |
$ | 9,308 | $ | 14,665 | $ | 24,088 | ||||||
|
|
|
|
|
|
|
|||||||
| Adjustments to reconcile net income to net cash provided by operating activities: |
||||||||||||
| Depreciation |
15,794 | 18,733 | 21,581 | |||||||||
| Amortization of intangible assets |
4,425 | 5,433 | 5,424 | |||||||||
| Amortization of deferred financing costs and debt discount |
654 | 1,437 | 935 | |||||||||
| Write-off of deferred financing costs due to debt extinguishment |
— | — | 1,423 | |||||||||
| Multiemployer pension plan withdrawal expense (gain) (Note 15) |
— | 3,395 | (696 | ) | ||||||||
| Impairment of long-lived assets |
1,288 | 544 | — | |||||||||
| Equity income, net of dividends |
(615 | ) | (660 | ) | (1,345 | ) | ||||||
| Deferred income taxes |
2,098 | 1,257 | 4,597 | |||||||||
| Loss on disposals of property, plant and equipment—net |
62 | 472 | 22 | |||||||||
| Gain from involuntary conversion of property, plant and equipment (Note 18) |
— | (6,103 | ) | (6,351 | ) | |||||||
| Amortization of purchase accounting inventory write-up (Note 2) |
443 | — | — | |||||||||
| Non-cash stock compensation |
195 | 195 | 195 | |||||||||
| Net increase (decrease) in cash, excluding effects of acquisitions, due to changes in: |
||||||||||||
| Accounts receivable |
1,195 | (3,798 | ) | (6,628 | ) | |||||||
| Inventories |
(6,621 | ) | (4,308 | ) | 333 | |||||||
| Insurance receivable |
(13,336 | ) | 8,163 | 2,634 | ||||||||
| Other current assets |
590 | (5,599 | ) | 504 | ||||||||
| Accounts payable |
(7,804 | ) | 8,409 | 2,499 | ||||||||
| Accrued compensation and employee benefits |
1,980 | (1,794 | ) | 451 | ||||||||
| Accrued interest |
38 | (93 | ) | 2,849 | ||||||||
| Accrued income taxes |
(122 | ) | 1,129 | 1,141 | ||||||||
| Liabilities related to fire |
13,975 | (12,199 | ) | (776 | ) | |||||||
| Other—net |
(4,947 | ) | (2,440 | ) | 5,198 | |||||||
|
|
|
|
|
|
|
|||||||
| Total adjustments |
9,292 | 12,173 | 33,990 | |||||||||
|
|
|
|
|
|
|
|||||||
| Net cash provided by operating activities |
18,600 | 26,838 | 58,078 | |||||||||
|
|
|
|
|
|
|
|||||||
| Cash flows from investing activities |
||||||||||||
| Proceeds from disposals of property, plant and equipment and other assets |
353 | 755 | 1,035 | |||||||||
| Insurance proceeds related to property, plant and equipment |
— | 8,481 | 6,512 | |||||||||
| Payments for property, plant and equipment |
(16,285 | ) | (26,237 | ) | (25,609 | ) | ||||||
| Acquisitions of businesses, net of cash acquired (Note 2) |
(34,000 | ) | — | — | ||||||||
| Acquisitions of patents |
— | (146 | ) | (161 | ) | |||||||
|
|
|
|
|
|
|
|||||||
| Net cash used in investing activities |
(49,932 | ) | (17,147 | ) | (18,223 | ) | ||||||
|
|
|
|
|
|
|
|||||||
The accompanying notes are an integral part of these consolidated financial statements.
F-21
Table of Contents
Jason Partners Holdings Inc.
Consolidated Statements of Cash Flows
(In thousands)
| For the Years Ended December 31, | ||||||||||||
| 2011 | 2012 | 2013 | ||||||||||
| Cash flows from financing activities |
||||||||||||
| Payment of capitalized debt issuance costs |
$ | (2,634 | ) | $ | (294 | ) | $ | (3,995 | ) | |||
| Proceeds from previous U.S. term loan |
37,500 | 7,500 | — | |||||||||
| Payments of previous U.S. term loan |
(2,191 | ) | (2,836 | ) | (178,534 | ) | ||||||
| Proceeds from new U.S. term loan |
— | — | 235,000 | |||||||||
| Payments of new U.S. term loan |
— | — | (5,563 | ) | ||||||||
| Proceeds from U.S. revolving loans |
3,500 | — | 27,690 | |||||||||
| Payments of U.S. revolving loans |
(3,500 | ) | — | (27,690 | ) | |||||||
| Proceeds from other long-term debt |
5,450 | 10,056 | 3,202 | |||||||||
| Payments of other long-term debt |
(8,800 | ) | (9,459 | ) | (11,882 | ) | ||||||
| Payments of subordinated debt |
(6,856 | ) | — | — | ||||||||
| Payments of preferred stock redemptions (Note 12) |
— | — | (48,415 | ) | ||||||||
| Payments of common stock dividends (Note 13) |
— | — | (43,055 | ) | ||||||||
|
|
|
|
|
|
|
|||||||
| Net cash provided by (used in) financing activities |
22,469 | 4,967 | (53,242 | ) | ||||||||
| Effect of exchange rate changes on cash and cash equivalents |
(107 | ) | 165 | 148 | ||||||||
|
|
|
|
|
|
|
|||||||
| Net decrease in cash and cash equivalents |
(8,970 | ) | 14,823 | (13,239 | ) | |||||||
| Cash and cash equivalents, beginning of year |
23,704 | 14,734 | 29,557 | |||||||||
|
|
|
|
|
|
|
|||||||
| Cash and cash equivalents, end of year |
$ | 14,734 | $ | 29,557 | $ | 16,318 | ||||||
|
|
|
|
|
|
|
|||||||
| Supplemental disclosures of cash flow information |
||||||||||||
| Cash paid during the year for: |
||||||||||||
| Interest |
$ | 16,975 | $ | 17,326 | $ | 10,681 | ||||||
|
|
|
|
|
|
|
|||||||
| Income taxes, net of refunds |
$ | 2,313 | $ | 3,717 | $ | 10,056 | ||||||
|
|
|
|
|
|
|
|||||||
| Non-cash investing activities |
||||||||||||
| Accrued purchases of property, plant and equipment |
$ | 1,026 | $ | 555 | $ | 886 | ||||||
|
|
|
|
|
|
|
|||||||
| Non-cash financing activities: |
||||||||||||
| Accretion of preferred stock dividends and redemption premium |
$ | 3,733 | $ | 6,312 | $ | 2,405 | ||||||
|
|
|
|
|
|
|
|||||||
The accompanying notes are an integral part of these consolidated financial statements.
F-22
Table of Contents
Notes to Consolidated Financial Statements
| 1. | Summary of Significant Accounting Policies |
Nature of business
Jason Partners Holdings Inc. and its subsidiaries (“the Company”), a subsidiary of Jason Partners Holdings LLC (“Jason LLC”), is a diversified industrial manufacturing company with four reportable segments: Seating, Acoustics, Finishing and Components. The segments have separate management teams and have operations within the United States and 14 foreign countries. Through these segments, the Company is the global or domestic leader in a number of product categories. The Company is the leading producer of seating for the motorcycle and off-road vehicle sectors, and the leading supplier of static seats to the commercial and residential lawn/turf sector. The Company is also the largest global producer of non-woven acoustical fiber insulation for the automotive sector and the leading global manufacturer of industrial consumables (brushes, buffing wheels and buffing compounds). The Company also manufactures precision components, expanded and perforated metal, and slip-resistant walking surfaces.
Principles of consolidation
The consolidated financial statements include the accounts of all wholly-owned subsidiaries. All significant intercompany transactions and balances have been eliminated. Investments in partially owned affiliates are accounted for using the equity method when the Company’s interest is between 20% and 50% and the Company does not have a controlling interest, yet maintains significant influence.
Cash and cash equivalents
The Company considers all highly liquid investments with an original maturity of three months or less at the date of purchase to be cash equivalents. At December 31, 2012 and 2013, book overdrafts of approximately $9.5 million and $8.6 million, respectively, are included in accounts payable within the accompanying consolidated balance sheets. These amounts are held in accounts in which the Company has no right of offset with other cash balances.
Inventories
Inventories are comprised of material, direct labor and manufacturing overhead, and are valued at the lower of cost or market and adjusted for the value of inventory that is estimated to be excess, obsolete or otherwise unmarketable. The estimation of excess, obsolete and unmarketable inventory is based on a variety of factors, including material or product age, estimated usage and estimated market demand. The first-in, first-out (FIFO) method is used to determine cost for all of the Company’s inventories.
Property, plant and equipment
Property, plant and equipment are stated at cost and are generally depreciated over the following estimated useful lives using the straight-line method:
| Land improvements |
20 years | |||
| Buildings and improvements |
2 to 40 years | |||
| Machinery and equipment |
7 to 10 years |
Leasehold improvements are amortized over the lesser of the term of the respective leases and the useful life of the related improvement using the straight-line method. The Company uses accelerated depreciation methods for income tax purposes. Expenditures which substantially increase value or extend useful lives are
F-23
Table of Contents
capitalized. Expenditures for maintenance and repairs are charged to operations as incurred. The Company records gains and losses on the disposition or retirement of property, plant and equipment based on the net book value and any proceeds received.
Goodwill and other intangible assets
Goodwill has been assigned to reporting units for purposes of impairment testing based upon the relative fair value of the asset to each reporting unit. Impairment of goodwill is measured according to a two-step approach. In the first step, the fair value of a reporting unit is compared to the carrying value of the reporting unit, including goodwill. If the carrying amount exceeds the fair value, the second step of the goodwill impairment test is performed to measure the amount of the impairment loss, if any. In the second step, the implied value of the goodwill is estimated as the fair value of the reporting unit less the fair value of all other tangible and identifiable intangible assets of the reporting unit. If the carrying amount of the goodwill exceeds the implied fair value of the goodwill, an impairment loss is recognized in an amount equal to that excess, not to exceed the carrying amount of the goodwill.
Goodwill is tested for impairment at least annually. The Company is subject to financial statement risk in the event that goodwill becomes impaired. No impairment of goodwill was recorded during the years ended December 31, 2011, 2012 or 2013. In each of the years presented, the fair value of goodwill for the Company’s reporting units significantly exceeds the respective carrying values.
Amortization is recorded for other intangible assets with determinable lives. These assets are amortized on a straight line basis over estimated useful lives as follows:
| Patents |
7 years | |
| Customer relationships |
14 to 15 years | |
| Trademarks and other intangible assets |
10 years |
Investments in partially-owned affiliates
Investments in partially-owned affiliates include the investment amounts related to joint ventures located in China and Taiwan. These joint ventures are part of the Finishing segment and are accounted for on the equity method of accounting. The investment amounts include the original costs plus the Company’s share of earnings, less dividends paid. Equity income is presented separately on the consolidated statements of operations.
At December 31, 2013, the Company had agreed to terms to sell its interest in two of its joint ventures. As such, the investment value associated with these joint ventures in the amount of $8.2 million is included as a current asset on the consolidated balance sheet at December 31, 2013. During the years ended December 31, 2011, 2012 and 2013 equity income associated with these investments was $0.6 million, $1.3 million and $1.5 million, respectively. See Note 19 for further discussion of the sale subsequent to year-end.
Income taxes
The provision for income taxes includes Federal, state, local and foreign taxes on income. Deferred taxes are recorded for the expected future tax consequences of temporary differences between the financial statement carrying amounts and the tax bases of assets and liabilities, and net operating loss and credit carryforwards available to offset future taxable income. Future tax benefits are recognized to the extent that realization for those benefits is considered to be more likely than not. A valuation allowance is provided for deferred tax assets when it is more likely than not that the Company will not realize the benefit of such assets. The Company recognizes interest and penalties related to unrecognized tax benefits in income tax expense.
F-24
Table of Contents
Fair value of financial instruments
The carrying amounts within the accompanying consolidated balance sheets for cash and cash equivalents, accounts receivable and accounts payable approximate fair value due to the short-term maturity of these instruments. As of December 31, 2013, the Company assessed the amounts recorded under revolving loans and long-term debt and determined that such amounts approximated fair value. As of December 31, 2012, the Company estimated the fair value of revolving loans and long-term debt to be approximately $207.2 million based on current market rates as of that date. The Company considers the inputs related to these estimations to be Level 2 fair value measurements.
Current accounting guidance defines fair value as the exchange price that would be received for an asset or paid to transfer a liability (an exit price) in the principal or most advantageous market for the asset or liability in an orderly transaction between market participants. It also specifies a fair value hierarchy based upon the observability of inputs used in valuation techniques. Observable inputs (highest level) reflect market data obtained from independent sources, while unobservable inputs (lowest level) reflect internally developed market assumptions. In accordance with the guidance and the Company’s internal policy, fair value measurements are classified under the following hierarchy:
| • | Level 1—Quoted prices for identical instruments in active markets. |
| • | Level 2—Quoted prices for similar instruments in active markets; quoted prices for identical or similar instruments in markets that are not active; and model-derived valuations in which all significant inputs or significant value-drivers are observable in active markets. |
| • | Level 3—Model-derived valuations in which one or more significant inputs or significant value-drivers are unobservable. |
Fair value measurements are classified according to the lowest level input or value-driver that is significant to the valuation. A measurement may therefore be classified within Level 3 even though there may be significant inputs that are readily observable.
Foreign currency translation
Assets and liabilities of the Company’s foreign subsidiaries, whose respective functional currencies are other than the U.S. dollar, are translated at year-end exchange rates while revenues and expenses are translated at average exchange rates. Resultant gains and losses are reflected as accumulated other comprehensive income within the accompanying consolidated statements of shareholders’ equity.
F-25
Table of Contents
Comprehensive income
The changes in components of accumulated other comprehensive income (loss), net of income taxes, during the year ended December 31, 2013 include the following (in thousands):
| Employee retirement plan adjustments |
Foreign currency translation adjustments |
Total | ||||||||||
| Balance, December 31, 2011 |
$ | (2,174 | ) | $ | (617 | ) | $ | (2,791 | ) | |||
|
|
|
|
|
|
|
|||||||
| Other comprehensive income before reclassifications |
974 | (484 | ) | 490 | ||||||||
| Amounts reclassified from accumulated other comprehensive income |
42 | — | 42 | |||||||||
|
|
|
|
|
|
|
|||||||
| Total other comprehensive income (loss) |
1,016 | (484 | ) | 532 | ||||||||
|
|
|
|
|
|
|
|||||||
| Balance, December 31, 2012 |
(1,158 | ) | (1,101 | ) | (2,259 | ) | ||||||
| Other comprehensive income before reclassifications |
683 | 1,731 | 2,414 | |||||||||
| Amounts reclassified from accumulated other comprehensive income |
319 | — | 319 | |||||||||
|
|
|
|
|
|
|
|||||||
| Total other comprehensive income (loss) |
1,002 | 1,731 | 2,733 | |||||||||
|
|
|
|
|
|
|
|||||||
| Balance, December 31, 2013 |
$ | (156 | ) | $ | 630 | $ | 474 | |||||
|
|
|
|
|
|
|
|||||||
The above employee retirement plan amounts reclassified from accumulated other comprehensive income into net income relate to the net amount of amortization of actuarial gains and losses. See Note 15 for further discussion of pension and postretirement amounts.
Pre-production costs related to long-term supply arrangements
The Company’s policy for engineering, research and development, and other design and development costs related to products that will be sold under long-term supply arrangements requires such costs to be expensed as incurred. Costs for molds, dies, and other tools used to manufacture products that will be sold under long-term supply arrangements are capitalized if the Company has title to the assets or when customer reimbursement is assured.
Long-lived assets
Long-lived assets to be held and used are reviewed for impairment whenever events or changes in circumstances indicate that the carrying amount may not be recoverable based upon an estimate of the related future undiscounted cash flows. When required, impairment losses on assets to be held and used are recognized based on the fair value of the asset as compared to its carrying value. Long-lived assets to be disposed of by sale are reported at the lower of carrying amount or fair value less cost to sell. The Company conducts its long-lived asset impairment reviews at the lowest level in which identifiable cash flows are largely independent of cash flows of other assets and liabilities, which is generally at the facility level.
Revenue recognition
Revenue is recognized from product sales at the time of shipment, reflecting the time that title and risks and rewards of ownership generally are transferred to the customer. Customer sales are recorded net of allowances for returns and discounts. The Company provides for an allowance for doubtful accounts based on historical experience and review of its existing receivables.
Shipping and handling fees and costs
The Company classifies all amounts invoiced to customers related to shipping and handling as sales. Expenses for transportation of products to customers are recorded as a component of cost of goods sold.
F-26
Table of Contents
Research and development costs
Research and development costs consist of engineering and development resources and are expensed as incurred. Such costs incurred in the development of new products or significant improvements to existing products were $4.9 million, $4.5 million and $5.0 million during the years ended December 31, 2011, 2012 and 2013, respectively.
Net income per share
Basic net income per share available to common shareholders of the Company is calculated by dividing the net income available to the common shareholders by the weighted average number of common shares outstanding during the year. In calculating the net income available to common shareholders, accretion of preferred stock dividends and redemption premium are deducted from net income. There are no additional potential shares of common stock for the Company to consider for the diluted net income per share calculation.
Use of estimates
The preparation of financial statements in conformity with generally accepted accounting principles (“GAAP”) requires management to make estimates and assumptions that affect the reported amounts of assets and liabilities and disclosure of contingent assets and liabilities at the date of the financial statements, and the reported amounts of revenues and expenses during the reporting period. Actual results could differ from those estimates.
Recently issued accounting standards
In July 2012, the Financial Accounting Standards Board (“FASB”) issued amended guidance that simplifies how entities test indefinite-lived intangible assets other than goodwill for impairment. After an assessment of certain qualitative factors, if it is determined to be more likely than not that an indefinite-lived asset is impaired, entities must perform the quantitative impairment test. Otherwise, the quantitative test is optional. The amended guidance is effective for annual and interim impairment tests performed for fiscal years beginning after September 15, 2012, with early adoption permitted. The adoption of this guidance did not have an impact on the Company’s consolidated financial statements.
In February 2013, the FASB issued guidance designed to improve the transparency in reporting amounts that are reclassified out of accumulated other comprehensive income into net income. This new guidance will require presentation of the effects on the line items of net income of significant amounts reclassified out of accumulated other comprehensive income and a cross-reference to other disclosure currently required for the reclassification items. The amended guidance is effective for reporting periods beginning after December 15, 2012. The adoption of this guidance did not have a material impact on the Company’s consolidated financial statements.
In March 2013, the FASB issued amended guidance for cumulative translation adjustments upon derecognition of certain subsidiaries or groups of assets within a foreign entity or of an investment in a foreign entity. These amendments provide guidance on releasing cumulative translation adjustments when a reporting entity ceases to have a controlling financial interest in a subsidiary or group of assets that is a nonprofit activity or a business within a foreign entity. In addition, these amendments provide guidance on the release of cumulative translation adjustments in partial sales of equity method investments and in step acquisitions. The amendments are effective on a prospective basis for fiscal years and interim reporting periods within those years, beginning after December 15, 2013. Early adoption is permitted. The adoption of this guidance is not expected to have a material impact on the Company’s consolidated financial statements.
In July 2013, the FASB issued guidance designed to clarify the financial statement presentation requirements of an unrecognized tax benefit when a net operating loss carryforward, a similar tax loss or a tax credit carryforward exists. This guidance is effective for reporting periods beginning after December 15, 2013, and is not expected to have a material impact on the Company’s consolidated financial statements.
F-27
Table of Contents
| 2. | Acquisitions |
In October 2011, the Company completed the acquisition of Morton Manufacturing Company (“Morton”) for $34.0 million, net of cash acquired, and charged $0.7 million in acquisition costs to selling and administrative expenses during 2011. The acquisition of Morton is part of a growth strategy focused on acquiring high-performing businesses that can further benefit from the Company’s operating expertise and that complement current product offerings. Morton is the leading manufacturer of slip-resistant walking surfaces for railcars, both for original equipment manufacturers (“OEMs”) and aftermarket repair customers. Morton also supplies OEMs and aftermarket customers in the agricultural, heavy equipment and general industrial space. The acquisition has been accounted for using the purchase method and, accordingly, operating results were included in the consolidated financial statements since the acquisition date. The results of Morton are included within the financial results for the Components segment. The purchase price was allocated to the assets acquired and liabilities assumed based primarily on third party valuations. Purchase price allocations have resulted in goodwill recognition of $0.4 million, which is deductible for tax purposes. This recorded goodwill represents expected synergies from the acquisition. A purchase price adjustment of $0.4 million was recorded to write-up inventory to fair value and such adjustment was subsequently recognized in cost of goods sold during 2011. The Company recorded customer relationship intangible assets in the amount of $9.7 million, which are being amortized on a straight-line basis over 15 years, and trademarks in the amount of $6.1 million, which are being amortized on a straight-line basis over 10 years.
The following table summarizes the fair values of the Morton assets acquired and liabilities assumed at the date of the acquisition (in thousands):
| Accounts receivable |
$ | 5,995 | ||
| Inventory |
4,878 | |||
| Other current assets |
457 | |||
| Property, plant and equipment |
11,603 | |||
| Intangible assets |
15,810 | |||
| Goodwill |
355 | |||
| Other long-term assets |
185 | |||
|
|
|
|||
| Total assets |
39,283 | |||
| Current liabilities |
4,055 | |||
| Long-term pension liability |
1,228 | |||
|
|
|
|||
| Total liabilities |
5,283 | |||
|
|
|
|||
| $ | 34,000 | |||
|
|
|
The following unaudited pro forma financial information for the year ended December 31, 2011 assumes the acquisition of Morton occurred on January 1, 2011, after giving effect to certain adjustments and income tax effects. The pro forma information is presented for illustrative purposes only and is not indicative of what actual results would have been if the acquisition had taken place on January 1, 2011, or of future results. The table below summarizes pro forma results for the year ended December 31, 2011 (in thousands, except for per share information):
| Pro forma year ended December 31, |
2011 (Unaudited) | |||
| Net sales |
$ | 634,662 | ||
| Operating income |
33,343 | |||
| Net income available to common shareholders |
6,602 | |||
| Net income per share, basic and diluted |
6,602 | |||
Pro forma results for the year ended December 31, 2011 were adjusted for the Morton acquisition to include $1.0 million of additional amortization, $0.4 million of additional depreciation and $2.3 million of interest expense. The additional interest expense is related to the $37.5 million term loan entered into in connection with the acquisition.
F-28
Table of Contents
Included in the Company’s results of operations from the Morton acquisition date are net sales of $10.4 million, $46.8 million and $34.1 million for the years ended December 31, 2011, 2012 and 2013, respectively. As the acquisition of Morton has been fully integrated into our financial systems, the earnings from the acquisition cannot be calculated without unreasonable effort.
| 3. | Restructuring Costs |
The Company has continued to make changes to its worldwide manufacturing footprint. These actions resulted in charges for items such as employee severance, exit costs for consolidation and closure of plant facilities, employee relocation and lease termination costs. These restructuring costs are presented separately on the consolidated statements of operations. During the year ended December 31, 2011, the Company recorded $0.7 million of restructuring costs, including $0.3 million related to a lease previously terminated and $0.5 million related to severance and other charges as described above. Restructuring costs during the year ended December 31, 2012 totaled $1.6 million related to severance and other restructuring costs. During the year ended December 31, 2013, the Company recorded restructuring costs of $3.0 million, including severance of $2.1 million and $0.9 million of other restructuring costs. The following presents the restructuring liability activity for the years ended December 31, 2012 and 2013 as follows (in thousands):
| Severance costs |
Lease termination costs |
Other costs |
Total | |||||||||||||
| Balance—December 31, 2011 |
$ | 283 | $ | 1,314 | $ | — | $ | 1,597 | ||||||||
| Utilization of reserve |
(283 | ) | (244 | ) | — | (527 | ) | |||||||||
| Current year restructuring charges |
910 | — | 721 | 1,631 | ||||||||||||
| Cash payments |
(730 | ) | — | (623 | ) | (1,353 | ) | |||||||||
|
|
|
|
|
|
|
|
|
|||||||||
| Balance—December 31, 2012 |
180 | 1,070 | 98 | 1,348 | ||||||||||||
| Utilization of reserve |
(180 | ) | (252 | ) | (98 | ) | (530 | ) | ||||||||
| Current year restructuring charges |
2,095 | — | 855 | 2,950 | ||||||||||||
| Cash payments |
(983 | ) | — | (790 | ) | (1,773 | ) | |||||||||
|
|
|
|
|
|
|
|
|
|||||||||
| Balance—December 31, 2013 |
$ | 1,112 | $ | 818 | $ | 65 | $ | 1,995 | ||||||||
|
|
|
|
|
|
|
|
|
|||||||||
The accruals for severance and other costs presented above relate to costs incurred in the Finishing and Acoustics segments. These accruals are expected to be utilized during the next twelve months and are recorded within other current liabilities on the consolidated balance sheets. The accrual for lease termination costs relates to restructuring costs within the Components segment. At December 31, 2012 and 2013, $0.8 million and $0.5 million, respectively, is recorded within other long-term liabilities and $0.2 million and $0.3 million, respectively, is recorded within other current liabilities on the consolidated balance sheets.
| 4. | Related Party Transactions |
The Company is part of a Management Services Agreement with Saw Mill Capital LLC (“Saw Mill”) and Falcon Investment Advisors, LLC (“FIA”, together with Saw Mill, the “Service Providers”), affiliates of the Company’s majority shareholders. Such agreement specifies certain services to be performed for the Company and shall remain in effect for up to ten years or until the occurrence of a defined event or agreement to terminate. Under terms of the agreement, the Company shall pay to the Service Providers a quarterly management fee equal to the lesser of $0.25 million (subject to an annual increase of 3% on each anniversary date of the agreement) or an amount equal to 2.25% of the twelve month trailing earnings before interest, taxes, depreciation and amortization (“EBITDA”) divided by four. During the term of such agreement, the Service Providers shall also be entitled to receive from the Company a transaction fee in connection with the consummation by the Company of each material, as defined, acquisition, divestiture, or refinancing, in an amount ranging from $0.15 million to $0.25 million or from 0.75% to 1.0% of defined transaction value. In addition, the Service Providers shall be entitled to receive from the Company a
F-29
Table of Contents
transaction fee in connection with the sale of the Company in an amount equal to 1% of a defined value if that defined value is in excess of a defined amount. Fees shall be payable in the ratio of 75% to Saw Mill and 25% to FIA. Management fees and related expenses paid to the Service Providers under this agreement were approximately $1.1 million in each year for the years ended December 31, 2011, 2012 and 2013. During 2013, the Company paid the Service Providers $2.3 million in conjunction with the February 28, 2013 refinancing (see Note 10 for further discussion of the refinancing). In addition, fees paid to the Service Providers for other services in addition to the fees discussed above were $0.5 million and $0.1 million in 2011 and 2012, respectively. The fees paid in 2011 were paid in conjunction with the Morton acquisition.
| 5. | Accounts Receivable |
Accounts receivable at December 31, 2012 and 2013 consisted of the following (in thousands):
| 2012 | 2013 | |||||||
| Accounts receivable |
$ | 72,489 | $ | 79,230 | ||||
| Allowance for doubtful accounts |
(2,255 | ) | (2,227 | ) | ||||
|
|
|
|
|
|||||
| $ | 70,234 | $ | 77,003 | |||||
|
|
|
|
|
|||||
| 6. | Inventories |
Inventories at December 31, 2012 and 2013 consisted of the following (in thousands):
| 2012 | 2013 | |||||||
| Raw material |
$ | 35,784 | $ | 37,562 | ||||
| Work-in-process |
5,277 | 5,653 | ||||||
| Finished goods |
31,134 | 29,044 | ||||||
|
|
|
|
|
|||||
| $ | 72,195 | $ | 72,259 | |||||
|
|
|
|
|
|||||
| 7. | Property, Plant and Equipment |
Property, plant and equipment at December 31, 2012 and 2013 consisted of the following (in thousands):
| 2012 | 2013 | |||||||
| Land and improvements |
$ | 6,802 | $ | 6,987 | ||||
| Buildings and improvements |
36,109 | 38,258 | ||||||
| Machinery and equipment |
105,736 | 128,284 | ||||||
| Construction-in-progress |
9,160 | 10,119 | ||||||
|
|
|
|
|
|||||
| 157,807 | 183,648 | |||||||
| Less: Accumulated depreciation |
(36,699 | ) | (57,362 | ) | ||||
|
|
|
|
|
|||||
| $ | 121,108 | $ | 126,286 | |||||
|
|
|
|
|
|||||
| 8. | Assets Held for Sale |
As of December 31, 2012, the Company had a former manufacturing facility in Denmark classified as an asset held for sale. This facility had an estimated fair value, less costs to sell, at December 31, 2012 of $0.8 million. During 2012, the Company recognized a loss of approximately $0.1 million to reduce the carrying value to the estimated fair value, less costs to sell. The Company had previously recognized a loss of approximately $0.4 million during 2011 on this property. This building was sold during 2013, and as the building was valued at the anticipated sales price, no gain or loss was recorded on the sale.
F-30
Table of Contents
| 9. | Goodwill and Other Intangible Assets |
The Company’s goodwill balance by reportable segment at December 31, 2012 and 2013 were as follows (in thousands):
| Seating |
Components | Total | ||
| $19,402 |
$14,796 | $34,198 |
The Company’s other intangible assets at December 31, 2012 and 2013 consisted of the following (in thousands):
| 2012 | 2013 | |||||||||||||||||||||||
| Gross Carrying Amount |
Accumulated Amortization |
Net | Gross Carrying Amount |
Accumulated Amortization |
Net | |||||||||||||||||||
| Patents |
$ | 2,176 | $ | (655 | ) | $ | 1,521 | $ | 2,337 | $ | (948 | ) | $ | 1,389 | ||||||||||
| Customer relationships |
37,290 | (5,063 | ) | 32,227 | 37,290 | (7,611 | ) | 29,679 | ||||||||||||||||
| Trademarks and other intangibles |
25,820 | (5,174 | ) | 20,646 | 25,820 | (7,757 | ) | 18,063 | ||||||||||||||||
|
|
|
|
|
|
|
|
|
|
|
|
|
|||||||||||||
| Total amortized other intangible assets |
$ | 65,286 | $ | (10,892 | ) | $ | 54,394 | $ | 65,447 | $ | (16,316 | ) | $ | 49,131 | ||||||||||
|
|
|
|
|
|
|
|
|
|
|
|
|
|||||||||||||
The approximate weighted average remaining useful lives of the Company’s intangible assets are as follows: Patents—4.33 years; customer relationships—11.72 years; and trademarks and other intangibles—7.04 years.
Amortization of intangible assets approximated $4.4 million, $5.4 million and $5.4 million for the years ended December 31, 2011, 2012 and 2013, respectively. Excluding the impact of any future acquisitions, the Company anticipates the annual amortization for each of the next five years and thereafter to be the following (in thousands):
| 2014 |
$ | 5,464 | ||
| 2015 |
5,464 | |||
| 2016 |
5,464 | |||
| 2017 |
5,391 | |||
| 2018 |
5,174 | |||
| Thereafter |
22,174 | |||
|
|
|
|||
| $ | 49,131 | |||
|
|
|
| 10. | Revolving Loans and Other Long-Term Debt Instruments |
Revolving loans and other long-term debt instruments at December 31, 2012 and 2013 consisted of the following (in thousands):
| 2012 | 2013 | |||||||
| U.S. term loans |
$ | 178,535 | $ | 229,438 | ||||
| Foreign debt |
19,521 | 11,304 | ||||||
| Capital lease obligations |
2,760 | 2,422 | ||||||
| Debt discount |
— | (429 | ) | |||||
|
|
|
|
|
|||||
| 200,816 | 242,735 | |||||||
| Less: Current portion |
(8,725 | ) | (6,904 | ) | ||||
|
|
|
|
|
|||||
| $ | 192,091 | $ | 235,831 | |||||
|
|
|
|
|
|||||
F-31
Table of Contents
Credit facility—refinancing and amendment
On February 28, 2013, the Company replaced its existing credit agreement with a new $260.0 million senior secured credit facility. The new facility includes a six-year, $225.0 million senior secured term loan and a five-year, $35.0 million revolving loan. The borrowings under the term loan, along with existing cash, were used to retire borrowings outstanding under a previous term loan of $178.5 million, redeem 17,757.7 shares of preferred stock for $24.8 million, pay a cash dividend to common shareholders of $25.0 million and pay various expenses associated with the refinancing. On November 14, 2013, this credit facility was amended to increase borrowings by $10.0 million through the exercise of a portion of the incremental term loan as allowed by the agreement.
In addition to increasing the term loan borrowings as discussed above, the amendment also revised the maturities schedule to reflect the additional borrowings, and adjusted certain definitions related to the required financial covenant calculations. The discussion below on the senior secured credit facility reflects the terms of the November 14, 2013 amendment.
Senior secured credit facility
The term loan amortizes in quarterly installments of approximately $0.6 million, with $217.6 million due on February 28, 2019. The term loan has a stated interest rate of LIBOR plus 3.75% or a defined base rate plus 2.75%. The revolving loan facility includes a $12.5 million letter of credit sub-facility and a $10.0 million swingline sub-facility available for same-day loans. The revolving loan facility is subject to a fee of 3.75% on all outstanding letters of credit and a fee of 0.50% on the unused portion of the facility, payable on a monthly basis. Revolving loans have a stated interest rate of LIBOR plus 3.75% or a defined base rate plus 2.75%. The agreement requires the Company to meet a financial covenant tied to a maximum total debt to EBITDA ratio, as defined in the agreement. The facility permits additional loans of up to $90.0 million, subject to covenant compliance and certain other conditions. The debt is collateralized by substantially all of the assets of the Company.
At December 31, 2013, the Company had $229.4 million outstanding on the term loan. The interest rate was 5.00% at December 31, 2013. No amounts were outstanding on the revolving loan at December 31, 2013. Letters of credit outstanding of $3.6 million on the Company’s behalf reduce availability under the revolving credit facility. As of December 31, 2013, the Company had a total of $31.4 million of availability for additional borrowings under the revolving loan facility. A fee (3.75% at December 31, 2013) on all outstanding letters of credit is payable on a monthly basis.
The senior secured credit facility was financed with a group of various lenders with one of the lenders acting as administrative agent. The refinancing of the term loan portion of the facility resulted in recognition of a significant portion of the debt as a debt extinguishment. The extinguishment was caused by the change in the projected present value of cash flows under the new agreement, resulting in a loss on extinguishment of $5.4 million. This amount is included in interest expense during the year ended December 31, 2013 and includes $4.0 million of lender fees incurred through the refinancing as well as a $1.4 million write-off of unamortized deferred financing costs related to the old credit facility. In addition, the Company has included $0.2 million in interest expense related to other debt issuance costs that were allocated to a portion of the debt in which the Company treated as a debt modification. The Company capitalized additional debt issuance costs of $2.6 million in connection with the refinancing that will be expensed over the life of the term loan. Furthermore, the Company capitalized an additional $1.1 million of debt issuance costs related to the refinancing of the revolving loan facility. These costs will be amortized over the life of the agreement on a straight-line basis. The November 14, 2013 amendment discussed above was deemed to be a debt modification. Total debt issuance costs of $0.6 million were incurred. These costs included $0.3 million of lender costs that were capitalized, and $0.3 million of other third-party costs that were expensed and included in interest expense for the year ended December 31, 2013.
F-32
Table of Contents
Previous credit agreement
Prior to the refinancing, the Company’s credit facility dated September, 21, 2010 was with a group of lenders and was subsequently amended on October 13, 2011. This facility had three underlying term loans with outstanding balances totaling $178.5 million at December 31, 2012 and a $35.0 million revolving credit facility. No amounts were outstanding on the revolver at December 31, 2012. The interest rates on the term loans were LIBOR-based and ranged from 7.75% to 8.25% at December 31, 2012.
Foreign debt
At December 31, 2012 and 2013, the Company has recorded $19.5 million and $11.3 million, respectively, in foreign debt obligations, including various overdraft facilities and term loans. The largest foreign debt balances are held by the Company’s subsidiaries in Germany (approximately $10.9 million and $6.8 million as of December 31, 2012 and 2013, respectively) and Mexico (approximately $4.2 million and $2.7 million as of December 31, 2012 and 2013, respectively). These various foreign loans are comprised of individual outstanding obligations ranging from approximately $0.1 million to $3.4 million at December 31, 2012 and ranging from approximately $0.1 million to $3.0 million at December 31, 2013. There are certain restrictions included in loan agreements with the Company’s wholly-owned subsidiary, Jason GmbH, that restrict the transfer of assets or payment of dividends to its shareholders. In connection with these restrictions, at December 31, 2012 and 2013, the Company had restricted net assets from consolidated subsidiaries of $34.3 million and $39.8 million, respectively, and had restricted net assets from unconsolidated subsidiaries of $7.5 million and $8.2 million, respectively.
Future annual maturities of long-term debt outstanding at December 31, 2013 are as follows (in thousands):
| 2014 |
$ | 6,904 | ||
| 2015 |
4,376 | |||
| 2016 |
3,390 | |||
| 2017 |
2,739 | |||
| 2018 |
8,090 | |||
| Thereafter |
217,236 | |||
|
|
|
|||
| $ | 242,735 | |||
|
|
|
| 11. | Lease Obligations |
The Company leases machinery, transportation equipment and office, warehouse and manufacturing facilities under agreements which are accounted for as operating leases. Many of the leases include provisions that enable the Company to renew the lease, and certain leases are subject to various escalation clauses.
Future minimum lease payments required under long-term operating leases in effect at December 31, 2013 are as follows (in thousands):
| 2014 |
$ | 9,599 | ||
| 2015 |
8,779 | |||
| 2016 |
6,829 | |||
| 2017 |
4,741 | |||
| 2018 |
3,977 | |||
| Thereafter |
9,435 | |||
|
|
|
|||
| $ | 43,360 | |||
|
|
|
Total rental expense under operating leases was $8.6 million, $9.1 million and $9.3 million for the years ended December 31, 2011, 2012 and 2013, respectively.
F-33
Table of Contents
| 12. | Redeemable Preferred Stock |
At December 31, 2012, the Company had authorized for issuance 49,000 shares of $0.001 par value nonvoting redeemable preferred stock of which 35,000 shares were issued and outstanding. The terms of the preferred stock allow the Company at its option to redeem preferred shares at $1,000 per share, plus accumulated and unpaid dividends, and a redemption premium if redeemed between March 21, 2012 and September 20, 2014.
During 2013, the Company redeemed all of the 35,000 outstanding preferred shares. The redemption totaled $48.4 million, which included the $35.0 million original liquidation value, accumulated and unpaid dividends of $11.2 million and a redemption premium of $2.2 million.
At December 31, 2012, the Company had classified the preferred stock as temporary or mezzanine equity in accordance with Accounting Standards Codification (“ASC”) 480-10-S99 due to a mandatory redemption feature triggered by a sale of the Company. At that date, the Company had $46.0 million recorded within this classification. This value represented the original liquidation value of $35.0 million, plus accumulated and unpaid dividends of $11.0 million. The carrying value of the preferred stock was increased by accretions related to a discount to liquidation value, premium redemption rates, and cumulative undeclared dividends so that the carrying value equals the redemption value at the balance sheet date. Accretion recorded during the periods in which the preferred shares were outstanding was $9.6 million, $3.7 million, $6.3 million and $2.4 million during the periods ended December 31, 2010, 2011, 2012 and 2013, respectively. These amounts were charged to retained earnings or in the absence of retained earnings, charged to additional contributed capital.
Dividends on the preferred stock had accrued each quarter on a cumulative basis at a rate of 10% per year and compounded quarterly through February 28, 2013, and at a rate of 12% after that date through the final redemption on November 14, 2013.
| 13. | Shareholders’ Equity |
Common stock
At December 31, 2012 and December 31, 2013, the Company had authorized for issuance 1,000 shares of $0.001 par value common stock of which 1,000 shares of common stock were issued and outstanding. Dividends may be declared and paid on the common stock, subject to laws and provisions of the Company’s articles of incorporation, and subject to the rights and privileges of the preferred shares. In 2013, Jason paid dividends to its common shareholders in an amount of $43.1 million and to its preferred shareholders in the amount of $11.2 million, in addition to a redemption of preferred shares in the amount of $37.2 million, comprised of an original liquidation value of $35 million and a redemption premium of $2.2 million. This dividend is presented as a reduction to retained earnings and additional contributed capital in the consolidated statement of shareholders’ equity.
Other contributed equity
Jason LLC has issued (granted) various classes of its common units to certain executives and directors of the Company. In accordance with ASC 718, “Accounting for Stock Compensation”, compensation cost related to the units granted is measured on the date of grant and recognized in the Company’s financial statements over the service (vesting) period. The various classes of units are as follows:
| • | Jason LLC has issued and outstanding 1,753 Class C common units to certain executives of the Company. The units were fully vested upon issuance. The fair value of these units totaled $0.8 million and was expensed by the Company in the period ended December 31, 2010 with a corresponding increase to additional contributed capital. If a holder of Class C common units ceases to be employed by the Company, Jason LLC would have the right, but not the obligation, to repurchase all or any portion of the Class C common units at a price equal to fair value, as defined. Under certain |
F-34
Table of Contents
| circumstances, as defined, an employee shall have the right, but not the obligation, to put the Class C common units to Jason LLC, and Jason LLC is required to repurchase the Class C common units at $1,000 per unit, subject to adjustment, as defined. |
| • | Jason LLC has issued and outstanding 3,069 Class D common units. The fair value of the units totaled $1.5 million, and was treated as a non-cash conversion of debt during the period ended December 31, 2010. |
| • | Jason LLC has authorized 2,603 Class E-1 common units to certain executives and directors of the Company of which 2,190 are outstanding at December 31, 2013. The fair value of these units totaled $0.8 million, and is being expensed by the Company on a straight-line basis over the four-year vesting period. The Company expensed $0.2 million in each of the years ended December 31, 2011, 2012 and 2013, with a corresponding increase to additional contributed capital. |
| • | Jason LLC has authorized 5,206 Class E-2 common units to certain executives and directors of the Company of which 4,360 are outstanding at December 31, 2013. The units vest upon a sale or initial public offering (IPO) if certain investment returns are achieved. The fair value of these units totaled $0.9 million and will be recognized as expense by the Company when the performance condition (i.e. sale or IPO of the Company) becomes probable. |
If a holder of Class E-1 or Class E-2 common units ceases to be employed by the Company for any reason, Jason LLC shall have the right, but not the obligation, to repurchase all or any portion of the vested Class E-1 or Class E-2 units at a price equal to fair value, as defined.
The fair value of the equity instruments was determined using the probability-weighted expected return method. The inputs utilized are classified as Level 3 inputs within the fair value hierarchy as defined in ASC 820.
| 14. | Income Taxes |
The source of earnings before income taxes consisted of the following for the years ended December 31, 2011, 2012 and 2013 (in thousands):
| 2011 | 2012 | 2013 | ||||||||||
| Domestic |
$ | 7,300 | $ | 12,415 | $ | 32,404 | ||||||
| Foreign |
6,125 | 7,078 | 9,931 | |||||||||
|
|
|
|
|
|
|
|||||||
| $ | 13,425 | $ | 19,493 | $ | 42,335 | |||||||
|
|
|
|
|
|
|
|||||||
The consolidated provision for income taxes included within the consolidated statements of operations consisted of the following for the years ended December 31, 2011, 2012 and 2013 (in thousands):
| 2011 | 2012 | 2013 | ||||||||||
| Current |
||||||||||||
| Federal |
$ | 352 | $ | 2,373 | $ | 9,541 | ||||||
| State |
430 | 133 | 936 | |||||||||
| Foreign |
1,237 | 1,065 | 3,173 | |||||||||
|
|
|
|
|
|
|
|||||||
| 2,019 | 3,571 | 13,650 | ||||||||||
| Deferred |
||||||||||||
| Federal |
1,731 | 2,139 | 2,963 | |||||||||
| State |
(305 | ) | 248 | 487 | ||||||||
| Foreign |
672 | (1,130 | ) | 1,147 | ||||||||
|
|
|
|
|
|
|
|||||||
| 2,098 | 1,257 | 4,597 | ||||||||||
|
|
|
|
|
|
|
|||||||
| $ | 4,117 | $ | 4,828 | $ | 18,247 | |||||||
|
|
|
|
|
|
|
|||||||
F-35
Table of Contents
Income tax expense recognized in the accompanying consolidated statements of operations differs from the amounts computed by applying the Federal income tax rate to earnings before income tax expense. A reconciliation of income taxes at the Federal statutory rate to the effective tax rate is summarized in the following table for the years ended December 31, 2011, 2012 and 2013 (in thousands):
| 2011 | 2012 | 2013 | ||||||||||
| Tax at Federal statutory rate of 35% |
$ | 4,699 | $ | 6,822 | $ | 14,817 | ||||||
| State taxes—net of Federal benefit |
103 | 186 | 992 | |||||||||
| Research and development incentives |
(203 | ) | (456 | ) | (1,007 | ) | ||||||
| Manufacturer’s deduction |
(75 | ) | (173 | ) | (780 | ) | ||||||
| Foreign rate differential |
537 | (409 | ) | (388 | ) | |||||||
| Valuation allowances |
(1,668 | ) | (1,333 | ) | (504 | ) | ||||||
| Impact of favorable tax ruling(1) |
— | (2,216 | ) | — | ||||||||
| Tax rate change |
243 | (2 | ) | 675 | ||||||||
| Increase in tax reserves(1) |
537 | 1,545 | 1,174 | |||||||||
| Stock compensation expense |
71 | 68 | 68 | |||||||||
| U.S. taxation of foreign earnings(2) |
8 | 336 | 2,193 | |||||||||
| Non-deductible meals and entertainment |
118 | 162 | 120 | |||||||||
| Other |
(253 | ) | 298 | 887 | ||||||||
|
|
|
|
|
|
|
|||||||
| Tax provision |
$ | 4,117 | $ | 4,828 | $ | 18,247 | ||||||
|
|
|
|
|
|
|
|||||||
| (1) | During the year ended December 31, 2012, the German tax authorities issued a favorable tax ruling which allowed the Company to restore its German net operating loss. This benefit was partially offset by an increase in the tax reserve. |
| (2) | During the year ended December 31 2013, the U.S. taxation of foreign earnings includes the recognition of a deferred tax liability for foreign earnings that are no longer considered permanently reinvested. |
The Company’s temporary differences which gave rise to deferred tax assets and liabilities at December 31, 2012 and 2013 include (in thousands):
| 2012 | 2013 | |||||||
| Deferred tax assets |
||||||||
| Accrued expenses and reserves |
$ | 3,481 | $ | 3,092 | ||||
| Postretirement and postemployment benefits |
3,503 | 2,354 | ||||||
| Employee benefits |
3,312 | 3,348 | ||||||
| Inventories |
2,057 | 2,568 | ||||||
| Capitalized research and development expenses |
1,129 | 1,074 | ||||||
| Deferred financing costs |
1,211 | 1,245 | ||||||
| Other assets and liabilities |
998 | 96 | ||||||
| Domestic net operating loss and credit carryforwards |
1,240 | 1,215 | ||||||
| Foreign operating loss carryforwards |
6,451 | 5,240 | ||||||
| Valuation allowance |
(4,962 | ) | (4,347 | ) | ||||
|
|
|
|
|
|||||
| 18,420 | 15,885 | |||||||
| Deferred tax liabilities |
||||||||
| Property, plant and equipment |
(17,068 | ) | (18,365 | ) | ||||
| Intangible and other assets and liabilities |
(14,413 | ) | (14,261 | ) | ||||
| Foreign Investments |
(180 | ) | (2,317 | ) | ||||
|
|
|
|
|
|||||
| (31,661 | ) | (34,943 | ) | |||||
|
|
|
|
|
|||||
| Net deferred tax liability |
$ | (13,241 | ) | $ | (19,058 | ) | ||
|
|
|
|
|
|||||
F-36
Table of Contents
At December 31, 2013, the Company has U.S. state net operating loss carryforwards, which expire at various dates through 2032, approximating $22.9 million. In addition, the Company has U.S. state tax credit carryforwards of $1.1 million which expire between 2016 and 2028. The Company’s foreign net operating loss carryforwards total approximately $46.6 million (at December 31, 2013 exchange rates). Of these foreign net operating loss carryforwards, $45.5 million are available for an indefinite period.
Valuation allowances totaling $5.0 million and $4.3 million as of December 31, 2012 and 2013, respectively, have been established for deferred income tax assets primarily related to certain subsidiary loss carryforwards that may not be realized. Realization of the net deferred income tax assets is dependent on generating sufficient taxable income prior to their expiration. Although realization is not assured, management believes it is more-likely-than-not that the net deferred income tax assets will be realized. The amount of the net deferred income tax assets considered realizable, however, could change in the near term if future taxable income during the carryforward period fluctuates.
Changes in the Company’s gross liability for unrecognized tax benefits, excluding interest and penalties, are as follows for the years ended December 31, 2011, 2012 and 2013 (in thousands):
| 2011 | 2012 | 2013 | ||||||||||
| Balance at beginning of year |
$ | 320 | $ | 1,030 | $ | 2,556 | ||||||
| Additions based on tax positions related to current year (see below) |
170 | 144 | 1,230 | |||||||||
| Additions based on tax positions related to prior years |
375 | 1,418 | 29 | |||||||||
| Other additions and reductions |
211 | — | — | |||||||||
| Reductions related to lapses of statute of limitations |
(46 | ) | (36 | ) | (124 | ) | ||||||
|
|
|
|
|
|
|
|||||||
| Balance at end of year |
$ | 1,030 | $ | 2,556 | $ | 3,691 | ||||||
|
|
|
|
|
|
|
|||||||
Of the $1.0 million, $2.6 million and $3.7 million of unrecognized tax benefits as of December 31, 2011, 2012 and 2013, respectively, approximately $0.1 million, $2.1 million and $2.3 million, respectively, would impact the effective income tax rate if recognized. The Company recognizes accrued interest and penalties related to unrecognized tax benefits as part of its income tax provision. During the years ended December 31, 2011, 2012 and 2013 the Company did not have any material interest or penalties that were recognized as a component of the income tax provision.
At December 31, 2012 and 2013, the Company has no accrued interest and penalties related to taxes which are included within the consolidated balance sheets. During the next twelve months, the Company does not expect any significant changes in its unrecognized tax benefits.
The Company, along with its subsidiaries, files returns in the U.S. Federal and various state and foreign jurisdictions. With certain exceptions, the Company is subject to examination by U.S. Federal and state taxing authorities for the taxable years 2003 through 2013, its subsidiaries in Germany and Mexico are subject to examination for taxable years 2008 through 2013, its subsidiaries in France, Brazil and Sweden are subject to examination for taxable years 2009 through 2013 and its subsidiaries in the U.K. are subject to examination for taxable years 2011 through 2013. The Company is currently under examination by the state of Illinois for tax years 2003 through 2011 and the Company’s Jason GmbH subsidiary is under examination by the German tax authorities for tax years 2008 through 2011. The Company does not expect the results of these examinations to have a material impact on the Company.
The cumulative undistributed earnings of all non-U.S. subsidiaries totaled $30.2 million at December 31, 2013. The Company has not provided any deferred taxes on these undistributed earnings as it considers the undistributed earnings to be permanently reinvested. If all such undistributed earnings were remitted, an additional income tax provision of approximately $10.9 million would have been necessary as of December 31, 2013.
F-37
Table of Contents
| 15. | Employee Benefit Plans |
Defined contribution plans
The Company maintains a 401(k) Plan for substantially all full time U.S. employees (the “401(k) Plan”). Company contributions are allocated to accounts set aside for each employee’s retirement. Employees generally may contribute up to 50% of their compensation to individual accounts within the 401(k) Plan. While contributions vary, the Company generally makes base contributions to employee accounts equal to 1% of each employee’s eligible annual cash compensation, subject to IRS limitations. In addition, the Company can elect to match up to 75% of the first 6% of each employee’s contribution to the 401(k) Plan, subject to Internal Revenue Service limitations. Expense recognized related to the 401(k) Plan totaled approximately $1.7 million, $1.7 million and $2.5 million for the years ended December 31, 2011, 2012 and 2013, respectively.
Defined benefit pension plans
The Company maintains defined benefit pension plans covering union and certain other employees. The majority of these plans are frozen to new participation.
The table that follows contains the accumulated benefit obligation and reconciliations of the changes in projected benefit obligation, the changes in plan assets and funded status for the years ended December 31, 2012 and 2013 (in thousands):
| U.S. Plans | Non-U.S. Plans | |||||||||||||||
| 2012 | 2013 | 2012 | 2013 | |||||||||||||
| Accumulated benefit obligation |
$ | 11,190 | $ | 10,324 | $ | 12,673 | $ | 13,127 | ||||||||
|
|
|
|
|
|
|
|
|
|||||||||
| Change in projected benefit obligation |
||||||||||||||||
| Projected benefit obligation at beginning of year |
$ | 10,241 | $ | 11,190 | $ | 12,083 | $ | 13,143 | ||||||||
| Service cost |
— | — | 128 | 161 | ||||||||||||
| Interest cost |
455 | 425 | 599 | 500 | ||||||||||||
| Actuarial (gain) loss |
853 | (616 | ) | 402 | 162 | |||||||||||
| Benefits paid |
(580 | ) | (675 | ) | (544 | ) | (724 | ) | ||||||||
| Other |
221 | — | 15 | 27 | ||||||||||||
| Currency translation adjustment |
— | — | 460 | 393 | ||||||||||||
|
|
|
|
|
|
|
|
|
|||||||||
| Projected benefit obligation at end of year |
$ | 11,190 | $ | 10,324 | $ | 13,143 | $ | 13,662 | ||||||||
|
|
|
|
|
|
|
|
|
|||||||||
| Change in plan assets |
||||||||||||||||
| Fair value of plan assets at beginning of year |
$ | 9,364 | $ | 9,721 | $ | 5,151 | $ | 5,954 | ||||||||
| Actual return on plan assets |
937 | 1,075 | 538 | 350 | ||||||||||||
| Employer and employee contributions |
— | — | 535 | 557 | ||||||||||||
| Benefits paid |
(580 | ) | (675 | ) | (510 | ) | (641 | ) | ||||||||
| Currency translation adjustment |
— | — | 240 | 138 | ||||||||||||
|
|
|
|
|
|
|
|
|
|||||||||
| Fair value of plan assets at end of year |
$ | 9,721 | $ | 10,121 | $ | 5,954 | $ | 6,358 | ||||||||
|
|
|
|
|
|
|
|
|
|||||||||
| Funded Status |
$ | (1,469 | ) | $ | (203 | ) | $ | (7,189 | ) | $ | (7,304 | ) | ||||
|
|
|
|
|
|
|
|
|
|||||||||
| Weighted-average assumptions |
||||||||||||||||
| Discount rates |
3.75% – 4.00 | % | 4.50 | % | 3.40% – 4.40 | % | 3.50% – 4.60 | % | ||||||||
| Rate of compensation increase |
N/A | N/A | 2.00% – 3.10 | % | 2.00% – 4.00 | % | ||||||||||
| Amounts recognized in the statement of financial position consist of: |
||||||||||||||||
| Prepaid benefit cost |
$ | 419 | $ | 1,309 | $ | — | $ | — | ||||||||
| Pension obligation—current |
— | — | (18 | ) | (47 | ) | ||||||||||
| Pension obligation—non-current |
(1,888 | ) | (1,512 | ) | (7,171 | ) | (7,257 | ) | ||||||||
|
|
|
|
|
|
|
|
|
|||||||||
| Net amount recognized |
$ | (1,469 | ) | $ | (203 | ) | $ | (7,189 | ) | $ | (7,304 | ) | ||||
|
|
|
|
|
|
|
|
|
|||||||||
F-38
Table of Contents
The following table contains the components of net periodic benefit cost for the years ended December 31, 2011, 2012 and 2013 (in thousands):
| U.S. Plans | Non-U.S. Plans | |||||||||||||||||||||||
| 2011 | 2012 | 2013 | 2011 | 2012 | 2013 | |||||||||||||||||||
| Components of Net Periodic Benefit Cost |
||||||||||||||||||||||||
| Service cost |
$ | 41 | $ | — | $ | — | $ | 98 | $ | 128 | $ | 161 | ||||||||||||
| Interest cost |
268 | 455 | 425 | 621 | 599 | 500 | ||||||||||||||||||
| Expected return on plan assets |
(185 | ) | (710 | ) | (592 | ) | (290 | ) | (246 | ) | (257 | ) | ||||||||||||
| Amortization of actuarial gain/loss |
(225 | ) | — | — | 1 | 42 | 253 | |||||||||||||||||
| Recognized net actuarial loss/ settlements/curtailments |
(302 | ) | 122 | 11 | — | 2 | — | |||||||||||||||||
|
|
|
|
|
|
|
|
|
|
|
|
|
|||||||||||||
| Net periodic benefit cost |
$ | (403 | ) | $ | (133 | ) | $ | (156 | ) | $ | 430 | $ | 525 | $ | 657 | |||||||||
|
|
|
|
|
|
|
|
|
|
|
|
|
|||||||||||||
| Weighted-average assumptions |
||||||||||||||||||||||||
| Discount rates |
5.00% – 5.25% | 4.50% | 3.75% – 4.00% | 4.50% – 5.40% | 4.65% – 5.40% | 3.40% – 4.40% | ||||||||||||||||||
| Rate of compensation increase |
2.50% | N/A | N/A | 2.00% – 4.00% | 2.00% – 3.30% | 2.00% – 3.10% | ||||||||||||||||||
| Expected long-term rates or return |
5.50% – 8.00% | 5.50% – 8.00% | 5.25% – 8.00% | 4.50% – 5.90% | 4.50% – 4.80% | 4.50% | ||||||||||||||||||
The expected return on plan assets is based on the Company’s expectation of the long-term average rate of return of the capital markets in which the plans invest. The expected return reflects the target asset allocations and considers the historical returns earned for each asset category. The Company determines the discount rate assumptions by referencing high-quality long-term bond rates that are matched to the duration of our benefit obligations, with appropriate consideration of local market factors, participant demographics and benefit payment terms.
During 2011, the Morton Manufacturing Salaried Plan was added as a pension plan as a result of the Morton acquisition (see Note 2). Effective December 31, 2011, certain benefits of the Morton Manufacturing Salaried Plan were frozen. As a result, the Company recognized a curtailment gain of $0.3 million in December 2011 and such gain is included in net periodic benefit cost above.
The gross amounts recognized in accumulated other comprehensive income related to the Company’s defined benefit pension plans consisted of the following for the years ended December 31, 2011, 2012 and 2013 (in thousands):
| 2011 | 2012 | 2013 | ||||||||||
| Unrecognized loss, net |
$ | 798 | $ | 1,327 | $ | 249 | ||||||
The amount in accumulated other comprehensive income that is expected to be recognized as a component of net periodic benefit cost during the next fiscal year is estimated to be approximately $0.2 million.
The Company’s investment policies employ an approach whereby a mix of equities and fixed income investments are used to maximize the long-term return on plan assets for a prudent level of risk. The investment portfolio primarily contains a diversified blend of equity and fixed income investments. Equity investments are diversified across domestic and non-domestic stocks, and investment and market risk are measured and monitored on an ongoing basis. The Company’s actual asset allocations are in line with target allocations and the Company does not have concentration within individual or similar investments that would pose a significant concentration risk to the Company.
F-39
Table of Contents
The Company’s pension plan asset allocations by asset category at December 31, 2012 and 2013 are as follows:
| U.S. Plans | Non-U.S. Plans | |||||||||||||||
| 2012 | 2013 | 2012 | 2013 | |||||||||||||
| Equity securities |
50.9 | % | 50.7 | % | 42.2 | % | 46.8 | % | ||||||||
| Debt securities |
40.1 | 38.1 | 51.3 | 47.7 | ||||||||||||
| Other |
9.0 | 11.2 | 6.5 | 5.5 | ||||||||||||
The fair values of pension plan assets by asset category at December 31, 2012 and 2013 are as follows (in thousands):
| Total as of December 31, 2012 |
Level 1 | Level 2 | Level 3 | |||||||||||||
| Cash and cash equivalents |
$ | 963 | $ | 963 | $ | — | $ | — | ||||||||
| Accrued dividends |
4 | 4 | — | — | ||||||||||||
| Global equities |
7,458 | 7,458 | — | — | ||||||||||||
| Government bonds |
772 | — | 772 | — | ||||||||||||
| Corporate bonds |
6,183 | — | 6,183 | — | ||||||||||||
| Group annuity/insurance contracts |
295 | — | — | 295 | ||||||||||||
|
|
|
|
|
|
|
|
|
|||||||||
| Total |
$ | 15,675 | $ | 8,425 | $ | 6,955 | $ | 295 | ||||||||
|
|
|
|
|
|
|
|
|
|||||||||
| Total as of December 31, 2013 |
Level 1 | Level 2 | Level 3 | |||||||||||||
| Cash and cash equivalents |
$ | 1,169 | $ | 1,169 | $ | — | $ | — | ||||||||
| Accrued dividends |
8 | 8 | — | — | ||||||||||||
| Global equities |
8,106 | 8,106 | — | — | ||||||||||||
| Government bonds |
739 | — | 739 | — | ||||||||||||
| Corporate bonds |
6,152 | — | 6,152 | — | ||||||||||||
| Group annuity/insurance contracts |
305 | — | — | 305 | ||||||||||||
|
|
|
|
|
|
|
|
|
|||||||||
| Total |
$ | 16,479 | $ | 9,283 | $ | 6,891 | $ | 305 | ||||||||
|
|
|
|
|
|
|
|
|
|||||||||
The fair value measurement of plan assets using significant unobservable inputs (Level 3) changed during the year ended December 31, 2013 due to the following (in thousands):
| Beginning balance, December 31, 2012 |
$ | 295 | ||
| Actual return on assets related to assets still held |
12 | |||
| Purchases, sales and settlements |
— | |||
| Currency impact |
(2 | ) | ||
|
|
|
|||
| Ending balance, December 31, 2013 |
$ | 305 | ||
|
|
|
No assets were transferred between levels of the fair value hierarchy during the years ended December 31, 2012 and 2013.
Quoted market prices are used to value investments when available. Investments in securities traded on exchanges are valued at the last reported sale prices on the last business day of the year or, if not available, the last reported bid prices.
F-40
Table of Contents
The Company’s cash contributions to its defined benefit pension plans in 2014 are not yet determined, but estimated to be approximately $0.6 million. Estimated projected benefit payments from the plans as of December 31, 2013 are as follows (in thousands):
| 2014 |
$ | 1,138 | ||
| 2015 |
1,400 | |||
| 2016 |
1,225 | |||
| 2017 |
1,736 | |||
| 2018 |
1,275 | |||
| 2019-2023 |
7,062 |
Multiemployer plan
Morton hourly union employees were covered under the National Shopmen Pension Fund (EIN 52-6122274, plan number 001), a union-sponsored and trusteed multiemployer plan which required the Company to contribute a negotiated amount per hour worked by the employees covered by the plan. The Company made the decision to withdraw from this plan as of August 15, 2012. In connection with the withdrawal the Company recorded an expense of $3.4 million during the year ended December 31, 2012. This represented the estimated present value of the Company’s obligation to the plan as of that date. This amount is included as a separate line item on the consolidated statements of operations. As of December 31, 2012, the Company had a liability recorded of $3.2 million associated with this withdrawal. This liability and related payment schedule was subject to change upon finalization of the liability calculation by the plan. The withdrawal amount was finalized during 2013 and the Company reduced its liability by reversing expense of $0.7 million. As of December 31, 2013, a liability of $2.4 million, of which $0.2 million is classified as a current liability, is recorded as a multiemployer pension plan withdrawal liability on the consolidated balance sheets. The liability will be paid in equal monthly installments through April 2026, and interest expense will be incurred associated with the discounting of this liability through that date.
Postretirement health care and life insurance plans
The Company also provides postretirement health care benefits and life insurance coverage to certain eligible former employees at one of its segments. The costs of retiree health care benefits and life insurance coverage are accrued over the employee benefit period.
F-41
Table of Contents
The table that follows contains the accumulated benefit obligation and reconciliations of the changes in projected benefit obligation, the changes in plan assets and funded status during the years ended December 31, 2012 and 2013 (in thousands):
| 2012 | 2013 | |||||||
| Accumulated benefit obligation |
$ | 3,243 | $ | 2,614 | ||||
|
|
|
|
|
|||||
| Change in projected benefit obligation |
||||||||
| Projected benefit obligation at beginning of year |
$ | 2,436 | $ | 3,243 | ||||
| Interest cost |
104 | 108 | ||||||
| Actuarial loss (gain) |
953 | (500 | ) | |||||
| Benefits paid |
(250 | ) | (237 | ) | ||||
|
|
|
|
|
|||||
| Projected benefit obligation at end of year |
3,243 | 2,614 | ||||||
|
|
|
|
|
|||||
| Change in plan assets |
||||||||
| Employer contributions |
$ | 250 | $ | 237 | ||||
| Benefits paid |
(250 | ) | (237 | ) | ||||
|
|
|
|
|
|||||
| Fair value of plan assets at end of year |
$ | — | $ | — | ||||
|
|
|
|
|
|||||
| Funded Status |
$ | (3,243 | ) | $ | (2,614 | ) | ||
|
|
|
|
|
|||||
| Weighted-average assumptions |
||||||||
| Discount rates |
3.50 | % | 4.25 | % | ||||
| Amounts recognized in the statement of financial position consist of: |
||||||||
| Pension obligation—current |
$ | (279 | ) | $ | (249 | ) | ||
| Pension obligation—non-current |
(2,964 | ) | (2,365 | ) | ||||
|
|
|
|
|
|||||
| Net amount recognized |
$ | (3,243 | ) | $ | (2,614 | ) | ||
|
|
|
|
|
|||||
The assumed health care cost trend rate used in measuring the accumulated postretirement benefit obligation was a blended rate of 8.50% and 6.70% at December 31, 2012 and 2013, respectively. It was assumed that these rates will decline by 1% to 2% every 5 years for the next 15 years for the hourly and salaried plans. An increase or decrease in the medical trend rate of 1% would increase or decrease the accumulated postretirement benefit obligation by approximately $0.2 million and $0.2 million, respectively.
The table that follows contains the components of net periodic benefit costs for the years ended December 31, 2011, 2012 and 2013 (in thousands):
| 2011 | 2012 | 2013 | ||||||||||
| Components of net periodic benefit cost |
||||||||||||
| Interest cost |
$ | 123 | $ | 104 | $ | 109 | ||||||
| Amortization of the net loss from earlier periods |
— | — | 66 | |||||||||
|
|
|
|
|
|
|
|||||||
| Net periodic benefit cost |
$ | 123 | $ | 104 | $ | 175 | ||||||
|
|
|
|
|
|
|
|||||||
| Weighted-average assumptions |
||||||||||||
| Discount rates |
5.25 | % | 4.50 | % | 4.25 | % | ||||||
The gross amounts recognized in accumulated other comprehensive income related to the Company’s other postretirement plans consisted of the following (in thousands):
| 2011 | 2012 | 2013 | ||||||||||
| Unrecognized loss (gain) |
$ | (53 | ) | $ | 901 | $ | 334 | |||||
F-42
Table of Contents
The Company’s cash contributions to its postretirement benefit plan in 2014 are not yet determined but are expected to equal the projected benefits from the plan. Estimated projected benefit payments from the plan at December 31, 2013 are as follows (in thousands):
| 2014 |
$ | 255 | ||
| 2015 |
246 | |||
| 2016 |
240 | |||
| 2017 |
236 | |||
| 2018 |
231 | |||
| 2019-2023 |
936 |
| 16. | Business Segments, Geographic and Customer Information |
The Company identifies its segments using the “management approach,” which designates the internal organization that is used by management for making operating decisions and assessing performance as the source of the Company’s reportable segments.
The Company is a global manufacturer of a broad range of industrial products and is organized into four reportable segments: Seating, Acoustics, Finishing and Components. The Seating segment is the leading producer of seating for the motorcycle and off-road vehicle sectors, and the leading supplier of static seats to the commercial and residential lawn/turf sector. Industry segments served also include construction equipment, agricultural equipment, utility vehicles, material handling, and mobility. The Acoustics segment is the largest global supplier of non-woven acoustical and thermal fiber insulation for the automotive and transportation sectors. The Finishing segment is the leading global manufacturer of industrial consumables, including brushes, buffing wheels, and buffing compounds. Industry segments served include aerospace, engineering, plastic, finishing, building, leisure, steel, hardware, welding and naval, among others. The Components segment manufactures precision components, expanded and perforated metal, and slip-resistant walking surfaces. These products are used by the rail, industrial, energy, and lawn/turf sectors.
The Company uses “Adjusted EBITDA” as the primary measure of profit or loss for purposes of assessing the operating performance of its segments. The Company defines EBITDA as net income (loss) before interest expense, provision (benefit) for income taxes, depreciation and amortization and (gain)/loss on disposal of property, plant and equipment. The Company defines Adjusted EBITDA as EBITDA, excluding the impact of operational restructuring charges and non-cash or non-operational losses or gains, including long-lived asset impairment charges, transactional legal fees, other professional fees and special employee bonuses, Newcomerstown fire losses and gains, multiemployer pension plan withdrawal expense (gain), purchase accounting adjustments and Management Services Agreement fees and expenses.
Management believes that Adjusted EBITDA provides a clear picture of the Company’s operating results by eliminating expenses and income that are not reflective of the underlying business performance. Certain corporate-level administrative expenses such as payroll and benefits, incentive compensation, travel, marketing, accounting, auditing and legal fees and certain other expenses are kept within its corporate results and not allocated to its business segments. Adjusted EBITDA is used to facilitate a comparison of the Company’s operating performance on a consistent basis from period to period and to analyze the factors and trends affecting its segments. The Company’s internal plans, budgets and forecasts use Adjusted EBITDA as a key metric. In addition, this measure is used to evaluate its operating performance and segment operating performance and to determine the level of incentive compensation paid to its employees.
As the Company uses Adjusted EBITDA as its primary measure of segment performance, US GAAP rules on segment reporting require the Company to include this measure in its discussion of its segments. The Company must also reconcile Adjusted EBITDA to operating results presented on a US GAAP basis.
F-43
Table of Contents
Sales and Adjusted EBITDA information relating to the Company’s reportable segments is as follows for the years ended December 31, 2011, 2012 and 2013 (in thousands):
| 2011 | 2012 | 2013 | ||||||||||
| Net sales |
||||||||||||
| Seating |
$ | 164,853 | $ | 162,519 | $ | 165,245 | ||||||
| Acoustics |
145,268 | 172,327 | 204,494 | |||||||||
| Finishing |
190,715 | 184,308 | 180,406 | |||||||||
| Components |
99,721 | 135,866 | 130,700 | |||||||||
|
|
|
|
|
|
|
|||||||
| $ | 600,557 | $ | 655,020 | $ | 680,845 | |||||||
|
|
|
|
|
|
|
|||||||
| 2011 | 2012 | 2013 | ||||||||||
| Segment Adjusted EBITDA |
||||||||||||
| Seating |
$ | 24,366 | $ | 22,576 | $ | 25,601 | ||||||
| Acoustics |
9,120 | 13,405 | 23,426 | |||||||||
| Finishing |
14,818 | 18,371 | 17,620 | |||||||||
| Components |
18,559 | 25,081 | 22,898 | |||||||||
|
|
|
|
|
|
|
|||||||
| $ | 66,863 | $ | 79,433 | $ | 89,545 | |||||||
|
|
|
|
|
|
|
|||||||
The Company’s total segment Adjusted EBITDA differs from consolidated Adjusted EBITDA due to unallocated corporate expenses and other corporate activities.
A reconciliation from total segment Adjusted EBITDA to consolidated income before taxes for the years ended December 31, 2011, 2012 and 2013 is as follows (in thousands):
| 2011 | 2012 | 2013 | ||||||||||
| Total segment Adjusted EBITDA |
$ | 66,863 | $ | 79,433 | $ | 89,545 | ||||||
| Interest expense, including intercompany |
(3,079 | ) | (3,524 | ) | (2,696 | ) | ||||||
| Depreciation and amortization |
(20,024 | ) | (23,991 | ) | (26,882 | ) | ||||||
| Impairment of long-lived assets |
(1,288 | ) | (544 | ) | — | |||||||
| (Loss) gain on disposal of fixed assets—net |
(103 | ) | (472 | ) | 18 | |||||||
| Restructuring |
(710 | ) | (1,631 | ) | (2,950 | ) | ||||||
| Other operational restructuring related costs |
— | — | (1,039 | ) | ||||||||
| Transactional advisory, legal and other professional fees |
(673 | ) | — | — | ||||||||
| Newcomerstown fire (loss) gain |
(2,947 | ) | 1,367 | 18,834 | ||||||||
| Adjustment for non-discrete fire costs |
— | (1,419 | ) | 1,419 | ||||||||
| Purchase accounting impact of inventory write-up |
(443 | ) | — | — | ||||||||
| Multiemployer pension plan withdrawal (loss) gain |
— | (3,395 | ) | 696 | ||||||||
| Gain on claim settlement |
— | — | 455 | |||||||||
|
|
|
|
|
|
|
|||||||
| Total segment income before income taxes |
37,596 | 45,824 | 77,400 | |||||||||
| Corporate general and administrative expenses |
(10,085 | ) | (11,068 | ) | (16,882 | ) | ||||||
| Corporate depreciation |
(195 | ) | (175 | ) | (123 | ) | ||||||
| Corporate (loss) gain on disposal of fixed assets—net |
41 | — | (40 | ) | ||||||||
| Corporate interest expense, including intercompany |
(13,932 | ) | (15,088 | ) | (18,020 | ) | ||||||
|
|
|
|
|
|
|
|||||||
| Consolidated income before taxes |
$ | 13,425 | $ | 19,493 | $ | 42,335 | ||||||
|
|
|
|
|
|
|
|||||||
F-44
Table of Contents
Other financial information relating to the Company’s reportable segments is as follows at December 31, 2012 and 2013 and for the years ended December 31, 2011, 2012 and 2013 (in thousands):
| 2011 | 2012 | 2013 | ||||||||||
| Depreciation and amortization |
||||||||||||
| Seating |
$ | 8,731 | $ | 9,478 | $ | 9,228 | ||||||
| Acoustics |
3,501 | 3,706 | 4,950 | |||||||||
| Finishing |
3,829 | 4,191 | 5,631 | |||||||||
| Components |
3,963 | 6,616 | 7,073 | |||||||||
| General Corporate |
195 | 175 | 123 | |||||||||
|
|
|
|
|
|
|
|||||||
| $ | 20,219 | $ | 24,166 | $ | 27,005 | |||||||
|
|
|
|
|
|
|
|||||||
| 2011 | 2012 | 2013 | ||||||||||
| Capital expenditures |
||||||||||||
| Seating |
$ | 2,125 | $ | 2,468 | $ | 2,066 | ||||||
| Acoustics |
6,769 | 15,092 | 14,855 | |||||||||
| Finishing |
5,625 | 4,990 | 5,824 | |||||||||
| Components |
1,605 | 3,683 | 2,794 | |||||||||
| General Corporate |
161 | 4 | 70 | |||||||||
|
|
|
|
|
|
|
|||||||
| $ | 16,285 | $ | 26,237 | $ | 25,609 | |||||||
|
|
|
|
|
|
|
|||||||
| 2012 | 2013 | |||||||
| Assets |
||||||||
| Seating |
$ | 100,809 | $ | 93,238 | ||||
| Acoustics |
91,109 | 106,031 | ||||||
| Finishing |
132,371 | 136,371 | ||||||
| Components |
93,540 | 93,112 | ||||||
| General Corporate and Eliminations |
13,525 | (5,735 | ) | |||||
|
|
|
|
|
|||||
| $ | 431,354 | $ | 423,017 | |||||
|
|
|
|
|
|||||
Net sales and long-lived asset information by geographic area as of December 31, 2012 and 2013 and for the years ended December 31, 2011, 2012 and 2013 are as follows (in thousands):
| 2011 | 2012 | 2013 | ||||||||||
| Net sales by region |
||||||||||||
| United States |
$ | 413,086 | $ | 477,262 | $ | 489,714 | ||||||
| Europe |
148,288 | 130,516 | 126,261 | |||||||||
| Mexico |
23,468 | 33,602 | 51,542 | |||||||||
| Other |
15,715 | 13,640 | 13,328 | |||||||||
|
|
|
|
|
|
|
|||||||
| $ | 600,557 | $ | 655,020 | $ | 680,845 | |||||||
|
|
|
|
|
|
|
|||||||
| 2012 | 2013 | |||||||
| Long-lived assets |
||||||||
| United States |
$ | 130,459 | $ | 128,959 | ||||
| Europe |
33,141 | 34,717 | ||||||
| Mexico |
9,492 | 9,668 | ||||||
| Other |
2,410 | 2,073 | ||||||
|
|
|
|
|
|||||
| $ | 175,502 | $ | 175,417 | |||||
|
|
|
|
|
|||||
F-45
Table of Contents
Net sales attributed to geographic locations are based on the locations producing the external sales. Long-lived assets by geographic location consist of the net book values of property, plant and equipment and amortizable intangible assets.
Major customers
During the years ended December 31, 2011, 2012 and 2013 the Company had no individual customers that accounted for greater than 10% of consolidated net sales. The largest individual customer during each of the years ended December 31, 2011, 2012 and 2013 accounted for 7%, 6% and 7%, respectively. At December 31, 2012 and 2013, no customers accounted for greater than 10% of the consolidated accounts receivable balance.
| 17. | Litigation and Contingencies |
The Company is a party to various legal proceedings that have arisen in the normal course of its business. These legal proceedings typically include product liability, labor, and patent claims. The Company has recorded reserves for loss contingencies based on the specific circumstances of each case. Such reserves are recorded when it is probable that a loss has been incurred as of the balance sheet date, can be reasonably estimated and is not covered by insurance. In the opinion of management, the resolution of these contingencies will not have a material adverse effect on the Company’s financial condition, results of operations or cash flows.
At December 31, 2012 and 2013, the Company held reserves of $1.1 million for environmental matters at two locations. The ultimate cost of any remediation required will depend on the results of future investigation. Based upon available information, the company does not expect the ultimate costs at these locations will have a material adverse effect on its financial condition, results of operations, or cash flows individually and in aggregate. The company believes that it has obtained and is in substantial compliance with those material environmental permits and approvals necessary to conduct its various businesses. Based on the facts presently known, the Company does not expect environmental compliance costs to have a material adverse effect on its financial condition, results of operations, or cash flows.
| 18. | Newcomerstown Fire |
On November 27, 2011, the Company experienced a fire at an Acoustics’ facility in Newcomerstown, Ohio (“Newcomerstown”). No one was injured as a result of the fire. Newcomerstown was comprised of approximately 93,000 square feet in one leased building with an additional 38,000 square foot expansion in process. Newcomerstown employed 103 employees prior to the accident. The fire destroyed the entire leased facility and its contents. Newcomerstown manufactured non-woven acoustical fiber insulation for the automotive industry.
F-46
Table of Contents
The Company has recorded the following expenses (income) related to the incident in its statements of operations for the years ended 2011, 2012 and 2013, and in total from the date of the fire through December 31, 2013 (in thousands):
| 2011 | 2012 | 2013 | Cumulative fire (gains) losses |
|||||||||||||
| Insurance deductibles |
$ | 200 | $ | — | $ | (100 | ) | $ | 100 | |||||||
| Non-cash asset impairments |
||||||||||||||||
| Inventories, tooling and supplies |
1,336 | (346 | ) | — | 990 | |||||||||||
| Property, plant and equipment—net |
2,703 | (163 | ) | — | 2,540 | |||||||||||
| Losses of third-party property |
11,252 | (456 | ) | — | 10,796 | |||||||||||
|
|
|
|
|
|
|
|
|
|||||||||
| Subtotal asset impairments and third-party property |
15,291 | (965 | ) | — | 14,326 | |||||||||||
| Business interruption expenses |
3,792 | 14,228 | 12,200 | 30,220 | ||||||||||||
|
|
|
|
|
|
|
|
|
|||||||||
| Subtotal prior to insurance recoveries |
19,283 | 13,263 | 12,100 | 44,646 | ||||||||||||
| Less insurance recoveries |
||||||||||||||||
| Property |
(15,191 | ) | (5,310 | ) | (6,351 | ) | (26,852 | ) | ||||||||
| Business interruption |
(1,145 | ) | (9,320 | ) | (24,583 | ) | (35,048 | ) | ||||||||
|
|
|
|
|
|
|
|
|
|||||||||
| Subtotal insurance recoveries |
(16,336 | ) | (14,630 | ) | (30,934 | ) | (61,900 | ) | ||||||||
|
|
|
|
|
|
|
|
|
|||||||||
| Net fire loss (gain) |
$ | 2,947 | $ | (1,367 | ) | $ | (18,834 | ) | $ | (17,254 | ) | |||||
|
|
|
|
|
|
|
|
|
|||||||||
The Company has substantial property, casualty, liability, workers’ compensation and business interruption insurance. The property and business interruption insurance provides coverage of up to $150.0 million per incident with deductibles up to approximately $0.2 million. During 2013, the Company negotiated a final settlement with its insurance carrier.
Through the date of the settlement mentioned above, the Company has recorded insurance recoveries in the amount of $61.9 million for property and business interruption. As of December 31, 2013, the Company has recorded $1.0 million of liabilities for estimated expenses yet to be paid. As the claim is fully settled, no receivables are recorded as of December 31, 2013. As of December 31, 2012, the Company had recorded insurance recoveries in the amount of $31.0 million for property losses and certain business interruption expenses. As of December 31, 2012, $2.8 million of net receivables (estimated recoveries of $31.0 million less $28.2 million cash received as of December 31, 2012) from the insurance company and $1.8 million of liabilities ($0.1 million of losses of third party property, $0.1 million of insurance deductibles, and $1.6 million of business interruption expenses) to third parties had been recorded.
The fire affected production and shipments from Newcomerstown, creating a business interruption. The Company has recorded losses of $2.9 million and $4.7 million for the years ended December 31, 2011 and 2012, respectively and a gain of $7.6 million for the year ended December 31, 2013 associated with property and business interruption expenses, net of recovery. The net expenses predominantly relate to material and labor inefficiencies, outsourcing, temporary and permanent facility start-up costs and professional fees. In conjunction with the final settlement, the Company has recorded a gain of $4.9 million for the year ended December 31, 2013 associated with lost margins since the fire.
The Company has made capital expenditures in connection with the replacement of property, plant and equipment of approximately $1.0 million, $8.6 million and $5.7 million for the years ended December 31, 2011, 2012 and 2013, respectively. The Company has recorded gains from involuntary conversion of property, plant and equipment of $6.1 million and $6.3 million for the years ended December 31, 2012 and 2013, respectively. No gain from involuntary conversion was recorded during the year ended December 31, 2011.
During 2012, the Company commenced a lease of a facility in Battle Creek, Michigan as a replacement to the Newcomerstown, Ohio location. The Company reached pre-accident production levels at this location during 2013.
F-47
Table of Contents
The Company did not incur significant losses of customer business or any long-term negative implications to its Acoustics segment as a result of the fire. Additionally, the Company did not experience any material adverse impact to liquidity, cash, or its leverage profile as a result of the fire.
| 19. | Subsequent Events |
On January 9, 2014, the Company agreed to sell its 50% equity interest in two of its joint ventures for a total of $11.5 million. The sale of one of the joint ventures in the amount of $7.5 million was completed on January 22, 2014. The sale of the second joint venture is expected to close by the end of the Company’s first quarter in 2014. Terms of the sale allow for the Company to continue to be supplied with product at agreed-upon prices through the terms of a three-year supply agreement. The Company expects to record a gain on the sale of the joint ventures; however, the final gain amount has not yet been determined. Subsequent events were evaluated through March 12, 2014, which was the date of issuance of the financial statements.
F-48
Table of Contents
Schedule I: Parent-only Financial Statements
Jason Partners Holdings Inc.
Condensed Statements of Income
(in thousands, except share and per share amounts)
| For the Years Ended December 31, | ||||||||||||
| 2011 | 2012 | 2013 | ||||||||||
| Equity in net income of Jason Holdings, Inc. I (net of tax) |
$ | 9,308 | $ | 14,665 | $ | 24,088 | ||||||
|
|
|
|
|
|
|
|||||||
| Net income |
9,308 | 14,665 | 24,088 | |||||||||
| Preferred stock dividends and redemption premium accretion |
3,733 | 6,312 | 2,405 | |||||||||
|
|
|
|
|
|
|
|||||||
| Net income available to common shareholders |
$ | 5,575 | $ | 8,353 | $ | 21,683 | ||||||
|
|
|
|
|
|
|
|||||||
| Basic and diluted earnings per common share |
$ | 5,575 | $ | 8,353 | $ | 21,683 | ||||||
| Basic and diluted weighted average number of shares outstanding |
1,000 | 1,000 | 1,000 | |||||||||
The accompanying note is an integral part of these condensed financial statements.
F-49
Table of Contents
Jason Partners Holdings Inc.
Schedule I: Parent-only Financial Statements
Jason Partners Holdings Inc.
Condensed Statements of Comprehensive Income
(in thousands)
| For the Years Ended December 31, | ||||||||||||
| 2011 | 2012 | 2013 | ||||||||||
| Net income |
$ | 9,308 | $ | 14,665 | $ | 24,088 | ||||||
| Other comprehensive income (loss), net of tax: |
||||||||||||
| Employer retirement plan adjustments |
(1,236 | ) | (541 | ) | 1,002 | |||||||
| Foreign currency translation adjustments |
(1,607 | ) | 1,073 | 1,731 | ||||||||
|
|
|
|
|
|
|
|||||||
| Total other comprehensive income (loss) |
(2,843 | ) | 532 | 2,733 | ||||||||
|
|
|
|
|
|
|
|||||||
| Comprehensive income |
$ | 6,465 | $ | 15,197 | $ | 26,821 | ||||||
|
|
|
|
|
|
|
|||||||
The accompanying note is an integral part of these condensed financial statements.
F-50
Table of Contents
Jason Partners Holdings Inc.
Schedule I: Parent-only Financial Statements
Jason Partners Holdings Inc.
Condensed Balance Sheets
(in thousands, except share and per share amounts)
| December 31, | ||||||||
| 2012 | 2013 | |||||||
| Assets |
||||||||
| Investment in equity of Jason Holdings, Inc. I |
94,926 | 30,472 | ||||||
| Mezzanine Equity—$0.001 par value; 49,000 shares authorized, 35,000 shares issued and outstanding at December 31, 2012 and 0 shares issued and outstanding at December 31, 2013 |
46,010 | — | ||||||
| Shareholder’s Equity |
||||||||
| Common Stock—$0.001 par value; 1,000 shares authorized, issued, and outstanding |
— | — | ||||||
| Additional paid-in capital |
37,919 | 25,358 | ||||||
| Retained earnings |
13,256 | 4,640 | ||||||
| Accumulated other comprehensive loss |
(2,259 | ) | 474 | |||||
|
|
|
|
|
|||||
| Total stockholders’ equity |
$ | 48,916 | $ | 30,472 | ||||
|
|
|
|
|
|||||
The accompanying note is an integral part of these condensed financial statements.
F-51
Table of Contents
Jason Partners Holdings Inc.
Note to Condensed Financial Statements of Parent Company
Basis of Presentation
Jason Partners Holdings Inc. (“the Parent Company”) follows the accounting policies as described in Note 1 to the consolidated financial statements of Jason Partners Holdings Inc. and subsidiaries (“the Company”) with the exception of its investment in its subsidiary for which the Parent Company uses the equity method of accounting.
For further information, reference should be made to the notes to the audited consolidated financial statements of the Company.
At December 31, 2012 and December 31, 2013, consolidated retained earnings of Jason Partners Holdings Inc. included undistributed earnings from unconsolidated subsidiaries, accounted for by the equity method, of approximately $1.5 million and $2.3 million, respectively. At December 31, 2012 and 2013, Jason Partners Holdings Inc. had restricted net assets from consolidated subsidiaries of $34.3 million and $39.8 million, respectively, and had restricted net assets from unconsolidated subsidiaries of $7.5 million and $8.2 million, respectively. Such restriction is related to debt maintained at the Company’s wholly-owned German subsidiary, Jason GmbH, totaling $8.9 million and $5.7 million as of December 31, 2012 and December 31, 2013, respectively, and includes transfer of assets or the payment of dividends between Jason GMBH and its consolidated and unconsolidated subsidiaries and Jason GMBH’s parent entities.
During the year ended December 31, 2013, the Parent Company received $43.1 million of common stock dividends and $48.4 million related to preferred stock redemptions from Jason Holdings, Inc. I.
As the Parent Company does not maintain a cash account and necessary cash payments are paid by the Company, statements of cash flows have not been presented for the Parent Company.
F-52
Table of Contents
Schedule II—Valuation and Qualifying Accounts
(In thousands)
| Balance at beginning of year |
Charge to Costs and Expenses |
Utilization of Reserve |
Other* | Balance at end of year |
||||||||||||||||
| Year Ended December 31, 2011 |
||||||||||||||||||||
| Allowance for doubtful accounts |
$ | 3,947 | $ | 437 | $ | (1,475 | ) | $ | (106 | ) | $ | 2,803 | ||||||||
| Deferred tax valuation allowance |
$ | 7,939 | $ | (1,668 | ) | $ | — | $ | (18 | ) | $ | 6,253 | ||||||||
| Year Ended December 31, 2012 |
||||||||||||||||||||
| Allowance for doubtful accounts |
$ | 2,803 | $ | 155 | $ | (739 | ) | $ | 36 | $ | 2,255 | |||||||||
| Deferred tax valuation allowance |
$ | 6,253 | $ | (1,333 | ) | $ | — | $ | 42 | $ | 4,962 | |||||||||
| Year Ended December 31, 2013 |
||||||||||||||||||||
| Allowance for doubtful accounts |
$ | 2,255 | $ | 341 | $ | (304 | ) | $ | (65 | ) | $ | 2,227 | ||||||||
| Deferred tax valuation allowance |
$ | 4,962 | $ | (504 | ) | $ | — | $ | (111 | ) | $ | 4,347 | ||||||||
| * | The amounts included in the “other” column primarily relate to the impact of foreign currency exchange rates. |
F-53
Table of Contents
PART II—INFORMATION NOT REQUIRED IN PROSPECTUS
Item 13. OTHER EXPENSES OF ISSUANCE AND DISTRIBUTION
The following table sets forth the costs and expenses payable by the registrant in connection with this offering. All of the amounts shown are estimates except the Securities and Exchange Commission (the “SEC”) registration fee.
| SEC Registration Fee |
$ | 51,480 | ||
| Legal Fees and Expenses |
80,000 | |||
| Accounting Fees and Expenses |
[— | ]* | ||
| Other |
[— | ]* | ||
|
|
|
|||
| Total |
$ | [— | ]* |
| * | To be filed by Amendment |
We will bear all costs, expenses and fees in connection with the registration of these shares, including with regard to compliance with state securities or “blue sky” laws. The selling security holder, however, will bear all commissions and discounts, if any, attributable to its sale of securities.
Item 14. INDEMNIFICATION OF DIRECTORS AND OFFICERS
Our second amended and restated certificate of incorporation (the “certificate of incorporation”) provides that each of our directors shall not be liable to the Company or its stockholders for monetary damages for breach of fiduciary duty as a director, except to the extent such exemption from liability or limitation thereof is not permitted under the Delaware General Corporation Law (the “DGCL”).
In addition, our certificate of incorporation provides that to the fullest extent permitted by applicable law, we shall indemnify and hold harmless each person who is or was made a party or is threatened to be made a party to or is otherwise involved in any threatened, pending or completed action, suit or proceeding, whether civil, criminal, administrative or investigative (a “proceeding”) by reason of the fact that he or she is or was a director or officer of the Company or, while a director or officer of the Company, is or was serving at the request of the Company as a director, officer, employee or agent of another corporation or of a partnership, joint venture, trust, other enterprise or nonprofit entity, including service with respect to an employee benefit plan (an “indemnitee”), whether the basis of such proceeding is alleged action in an official capacity as a director, officer, employee or agent, or in any other capacity while serving as a director, officer, employee or agent, against all liability and loss suffered and expenses (including, without limitation, attorneys’ fees, judgments, fines, ERISA excise taxes and penalties and amounts paid in settlement) reasonably incurred by such indemnitee in connection with such proceeding. The Company shall to the fullest extent not prohibited by applicable law pay the expenses (including attorneys’ fees) incurred by an indemnitee in defending or otherwise participating in any proceeding in advance of its final disposition; provided, however, that, to the extent required by applicable law, such payment of expenses in advance of the final disposition of the proceeding shall be made only upon receipt of an undertaking, by or on behalf of the indemnitee, to repay all amounts so advanced if it shall ultimately be determined that the indemnitee is not entitled to be indemnified. The rights to indemnification and advancement of expenses is a contract right and such right shall continue as to an indemnitee who has ceased to be a director, officer, employee or agent and shall inure to the benefit of his or her heirs, executors and administrators. Notwithstanding the foregoing, except for proceedings to enforce rights to indemnification and advancement of expenses, the company shall indemnify and advance expenses to an indemnitee in connection with a proceeding (or part thereof) initiated by such indemnitee only if such proceeding (or part thereof) was authorized by the Board.
Our bylaws provide for the indemnification of our directors, officers or other persons in accordance with our certificate of incorporation. In addition, our bylaws allow us to maintain insurance to protect the Company and/or
II-1
Table of Contents
any director, officer, employee or agent of the company or another corporation, partnership, joint venture, trust or other enterprise against any expense, liability or loss, whether or not the Company would have the power to indemnify such person against such expense, liability or loss under the DGCL. We have purchased a policy of directors’ and officers’ liability insurance that insures our officers and directors against the cost of defense, settlement or payment of a judgment in some circumstances and insures us against our obligations to indemnify our officers and directors.
Indemnity Agreements
We have entered into indemnification agreements with each of our directors and executive officers. Each indemnification agreement provides that, subject to limited exceptions, and among other things, we will indemnify the director or executive officer to the fullest extent permitted by law for claims arising in his or her capacity as our director or officer.
Employment Agreements
The amended and restated employment agreement with David Westgate, our President and Chief Executive Officer dated as of June 30, 2014, provides that we will hold him harmless to the maximum extent permitted under the Company’s certificate of incorporation, By-Laws and applicable law against and in respect of any and all actions, suits, proceedings, claims, demands, judgments, costs, expenses (including advances of reasonable attorney’s fees), losses, and damages resulting from his good faith performance of duties and obligations with the Company. In addition, the Company is required to purchase and maintain, at its own expense, directors and officers liability insurance providing coverage for Mr. Westgate in the same amount as for members of the Company’s Board of Directors in respect of acts and omissions of executive in his capacity as such or as a director of the Company and occurring during his employment or service as a member of the Board (or both), which coverage (to the extent otherwise maintained for members of the Board) shall continue for so long as he is subject to liability (or threatened claim of liability) for any act or omission otherwise covered by such insurance. These obligations survive the termination of Mr. Westgate’s employment with the Company and a termination of the employment agreement.
The Purchase Agreement
The stock purchase agreement (the “Purchase Agreement”) providing for the acquisition (the “Business Combination”) of all of the capital stock of Jason Partners Holdings Inc. by JPHI Holdings Inc. (“JPHI”), a subsidiary of the Company, from Jason Partners Holdings LLC (“Seller”) and certain members of Seller, provides that the Company will maintain a fully pre-paid six-year “tail” policy to the current directors’ and officers’ liability insurance policy and fiduciary insurance policy maintained as of the date of the Purchase Agreement by Seller, Jason Incorporated or Jason Incorporated’s subsidiaries, which tail policy will cover a period of at least six years from the date of consummation of the Business Combination with respect to matters occurring prior to the same date, and which tail policies will contain at least the same coverage as the coverage set forth in the current policies (provided that the cost of such tail policies will not exceed more than 200% of the premium paid by Jason Incorporated and its subsidiaries for its current policies).
Other Agreements
The investor rights agreement dated as of June 30, 2014 by and among the Company, JPHI and certain members of Seller and management of the Company, including each of the executive officers of the Company, provides that the Company will indemnify each of them and each of their officers and directors and each person who controls them against all losses, claims, damages, liabilities and expenses (including attorneys’ fees) caused by any untrue or alleged untrue statement of material fact contained in any Registration Statement, Prospectus or preliminary Prospectus or any amendment thereof or supplement thereto filed thereto, or any omission or alleged omission of a material fact required to be stated therein or necessary to make the statements therein not misleading, except insofar as the same are caused by or contained in any information furnished in writing to the Company by such person expressly for use therein.
II-2
Table of Contents
Item 15. RECENT SALES OF UNREGISTERED SECURITIES
During the past three years, we sold the following securities without registration under the Securities Act:
Founder Shares. On May 31, 2013, the Company issued 6,208,333 shares of common stock (the “Founder Shares”) to Quinpario Partners I, LLC (the “Sponsor”) for an aggregate purchase price of $25,000. The Founder Shares included (i) 750,000 shares that were subject to forfeiture if and to the extent the underwriters’ over-allotment option was not exercised, and (ii) up to 75,000 shares of common stock that were subject to forfeiture in the event that up to two (2) tranches of extension units were not purchased (or 37,500 Founder Shares per extension), so that the Sponsor would own 25.0% of the Company’s issued and outstanding shares after the IPO. The underwriters exercised the over-allotment option in full and no extension units were purchased prior to the Business Combination. Accordingly, only 75,000 shares of common stock were forfeited by the Sponsor. The Founder Shares were issued in connection with our organization pursuant to the exemption from registration contained in Section 4(a)(2) of the Securities Act of 1933, as amended (the “Securities Act”), as they were sold solely to an accredited investor and did not involve a public offering.
Placement Units. On August 14, 2013, the Sponsor purchased 1,150,000 placement units (“Placement Units”), each consisting of one share of common stock and one warrant to purchase one share of our common stock exercisable at $12.00, at a price of $10.00 per unit ($11.5 million in the aggregate) in a private placement that occurred simultaneously with the consummation of the IPO. The sale of the Placement Units was made pursuant to the exemption from registration contained in Section 4(a)(2) of the Securities Act, as they were sold solely to an accredited investor and did not involve a public offering.
PIPE Investment. On May 9, 2014, the Company executed a Backstop and Subscription Agreement with the investors named therein providing for the issuance by the Company of 45,000 shares of 8.0% Series A Convertible Perpetual Preferred Stock in a private placement that closed simultaneously with the closing of our Business Combination on June 30, 2014, for gross proceeds to the Company of approximately $45 million. Each share of 8.0% Series A Convertible Perpetual Preferred Stock is convertible, at the holder’s option at any time, initially into 81.18 shares of the Company’s common stock (which is equivalent to an initial conversion price of approximately $12.32 per share), subject to specified adjustments as set forth in the Certificate of Designations relating thereto. Based on the initial conversion rate, approximately 3,653,113 shares of the Company’s common stock would be issuable upon conversion of all 45,000 shares of Series A Convertible Perpetual Preferred Stock, when issued, assuming the absence of in-kind dividends. The sale of the 8.0% Series A Convertible Perpetual Preferred Stock was made pursuant to the exemption from registration contained in Section 4(a)(2) of the Securities Act because the transaction did not involve a public offering.
Rollover. At the closing of the Business Combination, on June 30, 2014, certain members of Seller and certain directors and management of Jason Incorporated contributed their shares of common stock of Jason Partners Holdings Inc. to JPHI in exchange for shares of JPHI (the “JPHI stock”), valued at approximately $35.8 million, in the aggregate. Each share of JPHI stock can be exchanged on a one-for-one basis for a share of our common stock, at any time, at the option of the holder. The sale of JPHI stock was made pursuant to the exemption from registration contained in Section 4(a)(2) of the Securities Act because the transaction did not involve a public offering.
Item 16. EXHIBITS AND FINANCIAL STATEMENT SCHEDULES
See the Exhibit Index, which follows the signature page and which is incorporated by reference herein.
Item 17. UNDERTAKINGS
The undersigned Registrant hereby undertakes:
| (1) | To file, during any period in which offers or sales are being made, a post-effective amendment to this registration statement: |
| (i) | To include any prospectus required by Section 10(a)(3) of the Securities Act of 1933; |
II-3
Table of Contents
| (ii) | To reflect in the prospectus any facts or events arising after the effective date of the registration statement (or the most recent post-effective amendment thereof) which, individually or in the aggregate, represent a fundamental change in the information set forth in the registration statement. Notwithstanding the foregoing, any increase or decrease in volume of securities offered (if the total dollar value of securities offered would not exceed that which was registered) and any deviation from the low or high end of the estimated maximum offering range may be reflected in the form of prospectus filed with the Commission pursuant to Rule 424(b) if, in the aggregate, the changes in volume and price represent no more than 20 percent change in the maximum aggregate offering price set forth in the “Calculation of Registration Fee” table in the effective registration statement; and |
| (iii) | To include any material information with respect to the plan of distribution not previously disclosed in the registration statement or any material change to such information in the registration statement. |
| (2) | That, for the purpose of determining any liability under the Securities Act of 1933, each such post-effective amendment shall be deemed a new registration statement relating to the securities offered therein, and the offering of such securities at that time shall be deemed to be the initial bona fide offering thereof. |
| (3) | To remove from registration by means of a post-effective amendment any of the securities being registered which remain unsold at the termination of the offering. |
| (4) | That, for purposes of determining liability under the Securities Act of 1933 to any purchaser, each prospectus filed pursuant to Rule 424(b) as part of a registration statement relating to an offering, other than registration statements relying on Rule 430B or other than prospectuses filed in reliance on Rule 430A, shall be deemed to be part of and included in the registration statement as of the date it is first used after effectiveness. Provided, however, that no statement made in a registration statement or prospectus that is part of the registration statement or made in a document incorporated or deemed incorporated by reference into the registration statement or prospectus that is part of the registration statement will, as to a purchaser with a time of contract of sale prior to such first use, supersede or modify any statement that was made in the registration statement or prospectus that was part of the registration statement or made in any such document immediately prior to such date of first use. |
| (5) | That, for the purpose of determining liability of the registrant under the Securities Act of 1933 to any purchaser in the initial distribution of the securities: The undersigned registrant undertakes that in a primary offering of securities of the undersigned registrant pursuant to this registration statement, regardless of the underwriting method used to sell the securities to the purchaser, if the securities are offered or sold to such purchaser by means of any of the following communications, the undersigned registrant will be a seller to the purchaser and will be considered to offer or sell such securities to such purchaser: |
| (i) | Any preliminary prospectus or prospectus of the undersigned registrant relating to the offering required to be filed pursuant to Rule 424; |
| (ii) | Any free writing prospectus relating to the offering prepared by or on behalf of the undersigned registrant or used or referred to by the undersigned registrant; |
| (iii) | The portion of any other free writing prospectus relating to the offering containing material information about the undersigned registrant or its securities provided by or on behalf of the undersigned registrant; and |
| (iv) | Any other communication that is an offer in the offering made by the undersigned registrant to the purchaser. |
Insofar as indemnification for liabilities arising under the Securities Act of 1933 may be permitted to directors, officers and controlling persons of the Registrant pursuant to the foregoing provisions, or otherwise, the Registrant has been advised that in the opinion of the Securities and Exchange Commission such
II-4
Table of Contents
indemnification is against public policy as expressed in the Act and is, therefore, unenforceable. In the event that a claim for indemnification against such liabilities (other than the payment by the Registrant of expenses incurred or paid by a director, officer or controlling person of the Registrant in the successful defense of any action, suit or proceeding) is asserted by such director, officer or controlling person in connection with the securities being registered, the Registrant will, unless in the opinion of its counsel the matter has been settled by controlling precedent, submit to a court of appropriate jurisdiction the question whether such indemnification by it is against public policy as expressed in the Act and will be governed by the final adjudication of such issue.
II-5
Table of Contents
SIGNATURES
Pursuant to the requirements of the Securities Act of 1933, as amended, the Registrant certifies that it has reasonable grounds to believe that it meets all of the requirements for filing on Form S-1 and has duly caused this Registration Statement to be signed on its behalf by the undersigned, thereunto duly authorized, in the city of New York, State of New York, on August 1, 2014.
| Jason Industries, Inc. | ||||
| (Registrant) | ||||
| Date: August 4, 2014 |
By: | /s/ David C. Westgate | ||
| Name | David C. Westgate | |||
| Title: | Chief Executive Officer (Principal Executive Officer) | |||
Pursuant to the requirements of the Securities Act of 1933, this Registration Statement has been signed by the following persons in the capacities and on the dates indicated below.
| Signature | Title | Date | ||
| /s/ David C. Westgate* David C. Westgate |
Chief Executive Officer and Director (Principal Executive Officer) |
August 4, 2014 | ||
| /s/ Stephen L. Cripe* Stephen L. Cripe |
Chief Financial Officer (Principal Financial Officer and Principal Accounting Officer) |
August 4, 2014 | ||
| /s/ James P. Heffernan* James P. Heffernan |
Director | August 4, 2014 | ||
| /s/ Edgar G. Hotard* Edgar G. Hotard |
Director | August 4, 2014 | ||
| /s/ Robert H. Jenkins* Robert H. Jenkins |
Director | August 4, 2014 | ||
| /s/ Vincent L. Martin* Vincent L. Martin |
Director | August 4, 2014 | ||
| /s/ Jeffry N. Quinn* Jeffry N. Quinn |
Director, Chairman | August 4, 2014 | ||
| /s/ Dr. John Rutledge* Dr. John Rutledge |
Director | August 4, 2014 | ||
| /s/ James F. Stern* James F. Stern |
Director | August 4, 2014 | ||
| /s/ James M. Sullivan* James M. Sullivan |
Director | August 4, 2014 | ||
| /s/ William P. Schultz * By Power of Attorney |
||||
II-6
Table of Contents
EXHIBIT INDEX
| Exhibit |
Description of Exhibits | |
| 1.1 | Underwriting Agreement between the Company and C&Co./PrinceRidge LLC, dated as of August 8, 2013, incorporated by reference as Exhibit 1.1 to the Company’s Form 8-K, filed with the Commission on August 14, 2013. | |
| 2.1 | Stock Purchase Agreement, dated as of March 16, 2014, by and among Jason Partners Holdings Inc., Jason Partners Holdings LLC, Quinpario Acquisition Corp. and JPHI Holdings Inc., incorporated by reference as Exhibit 2.1 to the Company’s Form 8-K, filed with the Commission on March 18, 2014. | |
| 3.1 | Second Amended and Restated Certificate of Incorporation of the Company, incorporated by reference as Exhibit 4.2 to the Registration Statement on Form S-8 filed with the Commission on July 3, 2014). | |
| 3.2 | Bylaws of the Company, incorporated by reference as Exhibit 4.1 to the Registration Statement on Form S-8 filed with the Commission on July 3, 2014. | |
| 4.1 | Specimen Common Stock Certificate, incorporated by reference as Exhibit 4.2 to the Company’s Registration Statement on Form S-1, filed with the Commission on August 1, 2013. | |
| 4.2 | Specimen Warrant Certificate, incorporated by reference as Exhibit A to Exhibit 4.4 to the Company’s Form 8-K, filed with the Commission on August 14, 2013. | |
| 4.3 | Warrant Agreement between Continental Stock Transfer & Trust Company and the Company, dated as of August 8, 2013, incorporated by reference as Exhibit 4.4 to the Company’s Form 8-K, filed with the Commission on August 14, 2013. | |
| 4.4 | Certificate of Designations, Preferences, Rights and Limitations of 8.0% Series A Convertible Perpetual Preferred Stock, incorporated by reference as Exhibit A to Exhibit 10.11 to the Company’s Form 10-Q, filed with the Commission on May 15, 2014. | |
| 4.5 | Registration Rights Agreement among the Company, Quinpario Partners I, LLC and the other security holders named therein, dated August 8, 2013, incorporated by reference as Exhibit 10.2 to the Company’s Form 8-K, filed with the Commission on August 14, 2013. | |
| 4.6+ | Amendment No.1 to Registration Rights Agreement among the Company, Quinpario Partners I, LLC and the other security holders named therein, dated July 14, 2014. | |
| 4.7 | Form of Registration Rights Agreement by and between the Company and the persons named therein, incorporated by reference as Exhibit 10.12 to the Company’s Form 10-Q, filed with the Commission on May 15, 2014. | |
| 5.1++ | Opinion of Olshan Frome Wolosky LLP. | |
| 10.1 | Letter Agreement between Quinpario Partners I, LLC and the Company regarding administrative support, dated August 8, 2013, incorporated by reference as Exhibit 10.8 to the Company’s Form 8-K, filed with the Commission on August 14, 2013. | |
| 10.2 | Securities Subscription Agreement, dated as of May 31, 2013, between the Company and Quinpario Partners I, LLC, incorporated by reference as Exhibit 10.4 to the Company’s Registration Statement on Form S-1, filed with the Commission on June 19, 2013. | |
| 10.3 | Promissory Note in the amount of $250,000, dated as of June 14, 2013 and issued to Quinpario Partners I, LLC, incorporated by reference as Exhibit 10.5 to the Company’s Registration Statement on Form S-1, filed with the Commission on June 19, 2013. | |
II-7
Table of Contents
| Exhibit |
Description of Exhibits | |
| 10.4 | Unit Subscription Agreement between the Company and the Sponsor dated as of May 31, 2013, incorporated by reference as Exhibit 10.6 to the Company’s Registration Statement on Form S-1, filed with the Commission on July 19, 2013. | |
| 10.5 | Form of Indemnity Agreement, incorporated by reference as Exhibit 10.8 to the Company’s Registration Statement on Form S-1, filed with the Commission on July 19, 2013. | |
| 10.6 | Promissory Note in the amount of $2,500,000 dated May 12, 2014 and issued to Quinpario Partners LLC, incorporated by reference as Exhibit 10.10 to the Company’s Form 10-Q, filed with the Commission on May 15, 2014. | |
| 10.7 | Form of Backstop and Subscription Agreement by and between the Company and the subscribers named therein, incorporated by reference as Exhibit 10.11 to the Company’s Form 10-Q, filed with the Commission on May 15, 2014. | |
| 10.8 | Investor Rights Agreement by and between the Company, JPHI Holdings Inc. and certain stockholders of the Company, dated as of June 30, 2014, incorporated by reference as Exhibit 10.5 to the Company’s Form 8-K, filed with the Commission on July 7, 2014. | |
| 10.9* | Jason Industries, Inc. 2014 Omnibus Incentive Plan, incorporated by reference as Exhibit 99.1 to the Registration Statement on Form S-8 filed with the Commission on July 3, 2014). | |
| 10.10 | Amended and Restated Employment Agreement between the Company and David Westgate, dated as of June 30, 2014, incorporated by reference as Exhibit 10.6 to the Company’s Form 8-K, filed with the Commission on July 7, 2014. | |
| 10.11 | Amended and Restated Employment Agreement between the Company and Stephen Cripe, dated as of June 30, 2014, incorporated by reference as Exhibit 10.7 to the Company’s Form 8-K, filed with the Commission on July 7, 2014. | |
| 10.12 | Amended and Restated Employment Agreement between the Company and William Schultz, dated as of June 30, 2014, incorporated by reference as Exhibit 10.8 to the Company’s Form 8-K, filed with the Commission on July 7, 2014. | |
| 10.13 | Amended and Restated Employment Agreement between the Company and David Cataldi, dated as of June 30, 2014, incorporated by reference as Exhibit 10.9 to the Company’s Form 8-K, filed with the Commission on July 7, 2014. | |
| 10.14 | Employment Agreement between the Company and Srivas Prasad, dated as of June 30, 2014, incorporated by reference as Exhibit 10.10 to the Company’s Form 8-K, filed with the Commission on July 7, 2014. | |
| 10.15 | Service Agreement, dated as of February 10, 2011, between Jason GmbH and Dr. Florestan von Boxberg, incorporated by reference as Exhibit 10.11 to the Company’s Form 8-K, filed with the Commission on July 7, 2014. | |
| 10.16 | Amended and Restated Employment Agreement between the Company and John Hengel, dated as of June 30, 2014, incorporated by reference as Exhibit 10.12 to the Company’s Form 8-K, filed with the Commission on July 7, 2014. | |
| 10.17 | First Lien Credit Agreement, dated as of June 30, 2014, by and among Jason Incorporated, Jason Partners Holdings Inc., Jason Holdings, Inc. I, Deutsche Bank AG New York Branch, as administrative agent, the subsidiary guarantors party thereto and the several banks and other financial institutions or entities from time to time party thereto, incorporated by reference as Exhibit 10.1 to the Company’s Form 8-K, filed with the Commission on July 7, 2014. | |
II-8
Table of Contents
| Exhibit |
Description of Exhibits | |
| 10.18 | Second Lien Credit Agreement, dated as of June 30, 2014, by and among Jason Incorporated, Jason Partners Holdings Inc., Jason Holdings, Inc. I, Deutsche Bank AG New York Branch, as administrative agent, the subsidiary guarantors party thereto and the several banks and other financial institutions or entities from time to time party thereto, incorporated by reference as Exhibit 10.2 to the Company’s Form 8-K, filed with the Commission on July 7, 2014. | |
| 10.19 | First Lien Security Agreement, dated as of June 30, 2014, by and among Jason Partners Holdings Inc., Jason Holdings, Inc. I, Jason Incorporated and certain of its subsidiaries in favor of Deutsche Bank AG New York Branch, incorporated by reference as Exhibit 10.3 to the Company’s Form 8-K, filed with the Commission on July 7, 2014. | |
| 10.20 | Second Lien Security Agreement, dated as of June 30, 2014, by and among Jason Partners Holdings Inc., Jason Holdings, Inc. I, Jason Incorporated and certain of its subsidiaries in favor of Deutsche Bank AG New York Branch, incorporated by reference as Exhibit 10.4 to the Company’s Form 8-K, filed with the Commission on July 7, 2014. | |
| 10.21 | Form of Indemnification Agreement, incorporated by reference as Exhibit 10.13 to the Company’s Form 8-K, filed with the Commission on July 7, 2014. | |
| 12.1+ | Computation of Ratio of Earnings to Combined Fixed Charges and Preference Dividends. | |
| 21.1 | List of Subsidiaries, incorporated by reference as Exhibit 21.1 to the Company’s Form 8-K, filed with the Commission on July 7, 2014. | |
| 23.1+ | Consent of PricewaterhouseCoopers LLP. | |
| 23.2++ | Consent of Olshan Frome Wolosky LLP (included in Exhibit 5.1). | |
| 24.1+ | Power of Attorney (included in signature page hereto). | |
| * | Includes compensatory plan or arrangement. |
| + | Previously filed. |
| ++ | Filed herewith. |
II-9