Attached files
| file | filename |
|---|---|
| 8-K - FORM 8-K - AVIV REIT, INC. | d767549d8k.htm |
Exhibit 99.1

Second Quarter 2014 Results
| Table of Contents |
||||
| Earnings Release |
1-4 | |||
| Consolidated Statements of Operations |
5 | |||
| Reconciliations of Net Income to EBITDA, Adjusted EBITDA, FFO, Normalized FFO and AFFO |
6 | |||
| Consolidated Balance Sheets |
7 | |||
| Consolidated Statements of Cash Flows |
8-9 | |||
| Portfolio Summary |
10-12 | |||
| Investment Activity |
13 | |||
| Debt Summary and Capitalization |
14 | |||
| Common Share and OP Unit Weighted Average Amounts Outstanding |
15 | |||
| 2014 Guidance |
16 | |||
| Definitions and Footnotes |
17-18 | |||
Note: This earnings release and supplemental information contains certain non-GAAP financial measures that we believe are helpful in understanding our business, as further discussed herein. These financial measures, which include Funds From Operations, Normalized Funds From Operations, AFFO, EBITDA and Adjusted EBITDA, should not be considered as an alternative to net income, earnings per share or any other GAAP measurement of performance or as an alternative to cash flows from operating, investing or financing activities. Furthermore, these non-GAAP financial measures are not intended to be a measure of cash flow or liquidity. Information included in this supplemental package is unaudited.

AVIV REIT REPORTS SECOND QUARTER 2014 RESULTS
$285 MILLION OF ACQUISITIONS YEAR-TO-DATE AT 9.4% INITIAL CASH YIELD
2014 GUIDANCE REAFFIRMED
CHICAGO, IL – August 5, 2014 – Aviv REIT, Inc. (NYSE: AVIV) today reported results for the second quarter ended June 30, 2014. All per share results are reported on a fully diluted basis.
Q2 Highlights
| • | $82.7 million of SNF acquisitions at a blended initial cash yield of 9.8% |
| • | $8.4 million of property reinvestment and new construction |
| • | AFFO of $26.0 million, or $0.44 per share, a 7% increase over Q2 2013 |
| • | Adjusted EBITDA of $39.5 million, a 25% increase over Q2 2013 |
| • | $211.7 million of net proceeds raised through the issuance of 9.2 million common shares |
| • | New $600 million unsecured revolving credit facility |
Q3 Highlights
| • | $110.5 million of investments |
| • | $82.0 million of ALF acquisitions at an initial cash yield of 8.0% |
| • | $16.2 million of SNF acquisitions at an initial cash yield of 10.0% |
| • | $12.3 million acquisition for land and entitlements for future identified new construction assisted living facilities |
“The strength and depth of our management team has continued to produce strong portfolio performance and a significant volume of attractive investments,” said Craig M. Bernfield, Chairman and Chief Executive Officer of Aviv. “We are taking advantage of our access to capital and the market opportunity, completing $314 million of investments year-to-date, already the most we have ever produced in a calendar year. We continue to acquire high-quality SNFs with knowledgeable and experienced operators, at attractive valuations, cash yields and coverages, all consistent with our track record.”
Mr. Bernfield continued, “Our team also did a great job identifying and closing a strategic acquisition of high-quality ALFs in premium, high barrier to entry markets, at an attractive price which allowed us to create an above market yield relative to the quality of the properties. We continue to successfully execute our strategy of sourcing off-market transactions which allows us to achieve accretive returns. We are pleased with our performance year-to-date and we remain on track to deliver significant earnings growth.”
1
Second Quarter 2014 Results
AFFO for the quarter ended June 30, 2014 was $26.0 million, or $0.44 per share, compared to $21.2 million, or $0.41 per share, for the quarter ended June 30, 2013, an increase of 7%. The growth in AFFO per share was driven primarily by the Company’s strong acquisition activity offset by the additional common shares issued.
Adjusted EBITDA for the quarter ended June 30, 2014 was $39.5 million, compared to $31.6 million for the quarter ended June 30, 2013, an increase of 25%. Net income for the quarter ended June 30, 2014 was $8.5 million, or $0.14 per share, compared to $13.4 million, or $0.26 per share, for the quarter ended June 30, 2013.
Six Months 2014 Results
AFFO for the six months ended June 30, 2014 was $49.5 million, or $0.90 per share, compared to $36.8 million, or $0.84 per share, for the six months ended June 30, 2013, an increase of 7%. The growth in AFFO per share was driven primarily by the Company’s strong acquisition activity.
Adjusted EBITDA for the six months ended June 30, 2014 was $77.1 million, compared to $62.8 million for the six months ended June 30, 2013, an increase of 23%. Net income for the six months ended June 30, 2014 was $19.9 million, or $0.36 per share, compared to $2.0 million, or $0.04 per share, for the six months ended June 30, 2013.
Acquisition Update
During the second quarter, the Company completed five transactions acquiring 10 properties in four states with five operators for $82.7 million at a blended initial cash yield of 9.8%, comprised of the following:
| • | A SNF in Florida for $6.0 million triple-net leased to existing operator Trillium Healthcare, an operator of nine facilities in three states, at an initial cash yield of 10.5% |
| • | Four SNFs in Texas for $53.7 million triple-net leased to existing operator Fundamental, an operator of 72 facilities in nine states, at an initial cash yield of 9.5% |
| • | Three SNFs in California for $13.4 million triple-net leased to existing operator Providence Group, an operator of 10 facilities in two states, at an initial cash yield of 10.25% |
| • | A SNF in Texas for $3.6 million triple-net leased to existing operator Trinity Healthcare LLC, an operator of five properties in two states, at an initial cash yield of 10.75% |
| • | A SNF in Kentucky for $6.0 million triple-net leased to existing operator Diversicare Healthcare Services (“Diversicare”), an operator of 40 facilities in nine states, at an initial cash yield of 9.8% |
During the third quarter, the Company completed two transactions acquiring six properties and two land parcels in two states with two operators for $110.5 million, comprised of the following:
| • | Three SNFs in Missouri for $16.2 million triple-net leased to existing operator Diversicare at an initial cash yield of 10.0% |
| • | Two ALFs and one SNF in Massachusetts for $82.0 million triple-net leased to existing operator Maplewood Senior Living, an operator of 12 facilities in three states, at an initial cash yield of 8.0% |
| • | Two land parcels and entitlements for $12.3 million for future identified new construction assisted living facilities |
Year-to-date, the Company has completed 11 transactions acquiring 29 properties in eight states with seven operators for $285.3 million at a blended initial cash yield of 9.4%. The Company has also invested $16.0 million through June 30, 2014 for property reinvestment and new construction.
2
Balance Sheet and Liquidity
On April 15, 2014, the Company completed an underwritten public offering of 9.2 million shares of common stock at a public offering price of $24.10 per share, raising net proceeds of $211.7 million. Proceeds from the offering were used to repay $118 million under the Company’s revolving credit facility and for general corporate purposes.
On May 14, 2014, the Company refinanced its existing $400 million secured revolving credit facility with a new $600 million unsecured revolving credit facility (the “Credit Facility”) which lowered the interest rate and extended the term. The Credit Facility has a rate that ranges from 170 to 225 basis points over LIBOR depending on the Company’s consolidated leverage and a maturity date of May 2018. The Credit Facility can be extended for an additional year at the Company’s option, subject to the satisfaction of certain conditions, and contains an accordion feature increasing the borrowing capacity to $800 million.
As of June 30, 2014, the Company had $49 million of cash, an undrawn Credit Facility and a net debt to Adjusted EBITDA ratio of 3.9x. As of today, the Company has $90 million outstanding under the Credit Facility.
Dividends
On June 2, 2014, the Company announced that its Board of Directors declared a dividend for the second quarter of $0.36 per share. The dividend was paid in cash on July 11, 2014 to stockholders of record on June 27, 2014.
On July 29, 2014, the Company announced that its Board of Directors declared a dividend for the third quarter of $0.36 per share. The dividend will be paid in cash on October 10, 2014 to stockholders of record on September 26, 2014.
Full Year 2014 AFFO Guidance
The Company is reaffirming its AFFO guidance range of $1.89 to $1.93 per share for the full year 2014. The details underlying this guidance can be found on page 16 of this press release.
Conference Call and Webcast Information
A conference call to discuss the second quarter 2014 earnings will take place today at 12:00 p.m. Central time / 1:00 p.m. Eastern time. The dial-in number for the conference call is (888) 713-3596 (U.S.) or (913) 312-1477 (International). The participant passcode is 8782301. The conference call can also be accessed via webcast at www.avivreit.com under the Investor Relations tab. A replay of the call will be available through September 8, 2014 on the Company’s website or by calling (888) 203-1112, access code 8782301.
About Aviv
Aviv REIT, Inc., based in Chicago, is a real estate investment trust that specializes in owning post-acute and long-term care SNFs and other healthcare properties. Aviv is one of the largest owners of SNFs in the United States and has been in the business for over 30 years. As of today, the Company owns 312 properties that are triple-net leased to 39 operators in 29 states.
For more information about the Company, please visit our website at www.avivreit.com or contact: David J. Smith, Managing
Director, Investor Relations & Capital Markets at 312-855-0930.
3
Forward-Looking Statements
The information presented herein includes forward-looking statements within the meaning of Section 27A of the Securities Act of 1933, as amended and Section 21E of the Securities Exchange Act of 1934, as amended. Forward-looking statements provide our current expectations or forecasts of future events. Forward-looking statements include statements about our expectations, beliefs, intentions, plans, objectives, goals, strategies, future events, performance and underlying assumptions and other statements that are not historical facts. Examples of forward-looking statements include all statements regarding our expected future financial position, results of operations, cash flows, liquidity, business strategy, projected growth opportunities and potential acquisitions and plans, objectives of management for future operations and AFFO guidance. You can identify forward-looking statements by their use of forward-looking words, such as “may,” “will,” “anticipate,” “expect,” “believe,” “estimate,” “intend,” “plan,” “should,” “seek” or comparable terms, or the negative use of those words, but the absence of these words does not necessarily mean that a statement is not forward-looking.
These forward-looking statements are made based on our current expectations and beliefs concerning future events affecting us and are subject to uncertainties and factors relating to our operations and business environment, all of which are difficult to predict and many of which are beyond our control, that could cause our actual results to differ materially from those matters expressed in or implied by these forward-looking statements. Important factors, risks and uncertainties that could cause actual results to differ materially from our expectations include those disclosed under Part I, Item 1A, “Risk Factors” in our Annual Report on Form 10-K for the year ended December 31, 2013 and elsewhere in filings made by us with the Securities and Exchange Commission. These factors include, among others: uncertainties relating to the operations of our operators, including those relating to reimbursement by government and other third-party payors, compliance with regulatory requirements and occupancy levels; our ability to successfully engage in strategic acquisitions and investments; competition in the acquisition and ownership of healthcare properties; our ability to monitor our portfolio; environmental liabilities associated with our properties; our ability to re-lease or sell any of our properties; the availability and cost of capital; changes in interest rates; the amount and yield of any additional investments; changes in tax laws and regulations affecting real estate investment trusts (REITs); and our ability to maintain our status as a REIT.
There may be additional risks of which we are presently unaware or that we currently deem immaterial. You are cautioned not to place undue reliance on these forward-looking statements, which speak only as of the date as of which such statements are made. Forward-looking statements are not guarantees of future performance. Except as required by law, we do not undertake any responsibility to release publicly any revisions to these forward-looking statements to take into account events or circumstances that occur after the date as of which such statements are made or to update you on the occurrence of any unanticipated events which may cause actual results to differ from those expressed or implied by the forward-looking statements contained herein.
4
Aviv REIT, Inc.
Consolidated Statements of Operations
(unaudited, in thousands except share and per share data)
| Three Months Ended June 30, | Six Months Ended June 30, | |||||||||||||||
| 2014 | 2013 | 2014 | 2013 | |||||||||||||
| Revenues |
||||||||||||||||
| Rental income |
$ | 41,440 | $ | 33,874 | $ | 81,862 | $ | 67,514 | ||||||||
| Interest on secured loans and financing lease |
1,076 | 1,082 | 2,162 | 2,141 | ||||||||||||
| Interest and other income |
674 | 77 | 1,041 | 79 | ||||||||||||
|
|
|
|
|
|
|
|
|
|||||||||
| Total revenues |
43,190 | 35,033 | 85,065 | 69,734 | ||||||||||||
| Expenses |
||||||||||||||||
| Interest expense incurred |
11,991 | 8,578 | 24,112 | 21,022 | ||||||||||||
| Amortization of deferred financing costs |
975 | 805 | 1,956 | 1,706 | ||||||||||||
| Depreciation and amortization |
10,439 | 8,099 | 19,948 | 16,097 | ||||||||||||
| General and administrative |
6,271 | 3,446 | 11,664 | 17,283 | ||||||||||||
| Transaction costs |
1,048 | 460 | 2,593 | 696 | ||||||||||||
| Loss on impairment |
— | — | 862 | — | ||||||||||||
| Reserve for uncollectible secured loans and other receivables |
3,496 | 16 | 3,500 | 30 | ||||||||||||
| Loss (gain) on sale of assets, net |
9 | 225 | 13 | (39 | ) | |||||||||||
| Loss on extinguishment of debt |
501 | — | 501 | 10,974 | ||||||||||||
|
|
|
|
|
|
|
|
|
|||||||||
| Total expenses |
34,730 | 21,629 | 65,149 | 67,769 | ||||||||||||
|
|
|
|
|
|
|
|
|
|||||||||
| Net income |
8,460 | 13,404 | 19,916 | 1,965 | ||||||||||||
| Net income allocable to noncontrolling interests - operating partnership |
(1,699 | ) | (3,257 | ) | (4,306 | ) | (560 | ) | ||||||||
|
|
|
|
|
|
|
|
|
|||||||||
| Net income allocable to common stockholders |
$ | 6,761 | $ | 10,147 | $ | 15,610 | $ | 1,405 | ||||||||
|
|
|
|
|
|
|
|
|
|||||||||
| Earnings per common share: |
||||||||||||||||
| Basic: |
||||||||||||||||
| Net income allocable to common stockholders |
$ | 0.15 | $ | 0.27 | $ | 0.37 | $ | 0.05 | ||||||||
| Diluted: |
||||||||||||||||
| Net income allocable to common stockholders |
$ | 0.14 | $ | 0.26 | $ | 0.36 | $ | 0.04 | ||||||||
| Weighted average common shares outstanding: |
||||||||||||||||
| Basic |
45,713,834 | 37,271,273 | 41,727,085 | 29,937,107 | ||||||||||||
| Diluted |
59,366,873 | 51,154,412 | 55,173,714 | 38,166,793 | ||||||||||||
| Dividends declared per common share |
$ | 0.36 | $ | 0.36 | $ | 0.72 | $ | 0.68 | ||||||||
5
Aviv REIT, Inc.
Reconciliations of Net Income to EBITDA and Adjusted EBITDA1
(unaudited, in thousands)
| Three Months Ended June 30, | Six Months Ended June 30, | |||||||||||||||
| 2014 | 2013 | 2014 | 2013 | |||||||||||||
| Net income |
$ | 8,460 | $ | 13,404 | $ | 19,916 | $ | 1,965 | ||||||||
| Interest expense, net |
11,991 | 8,578 | 24,112 | 21,022 | ||||||||||||
| Amortization of deferred financing costs |
975 | 805 | 1,956 | 1,706 | ||||||||||||
| Depreciation and amortization |
10,439 | 8,099 | 19,948 | 16,097 | ||||||||||||
|
|
|
|
|
|
|
|
|
|||||||||
| EBITDA |
31,865 | 30,886 | 65,932 | 40,790 | ||||||||||||
| Loss on impairment |
— | — | 862 | — | ||||||||||||
| Loss (gain) on sale of assets, net |
9 | 225 | 13 | (39 | ) | |||||||||||
| Transaction costs |
1,048 | 460 | 2,593 | 696 | ||||||||||||
| Write-off of straight-line rents |
1,380 | — | 1,380 | — | ||||||||||||
| Non-cash stock-based compensation |
1,511 | 39 | 2,632 | 10,392 | ||||||||||||
| Loss on extinguishment of debt |
501 | — | 501 | 10,974 | ||||||||||||
| Reserve for uncollectible loan receivables |
3,211 | 11 | 3,211 | 11 | ||||||||||||
|
|
|
|
|
|
|
|
|
|||||||||
| Adjusted EBITDA |
$ | 39,525 | $ | 31,621 | $ | 77,124 | $ | 62,824 | ||||||||
|
|
|
|
|
|
|
|
|
|||||||||
| (1) | See definitions and footnotes on pages 17 and 18 |
Aviv REIT, Inc.
Reconciliations of Net Income to FFO, Normalized FFO and AFFO1
(unaudited, in thousands except per share data)
| Three Months Ended June 30, | Six Months Ended June 30, | |||||||||||||||
| 2014 | 2013 | 2014 | 2013 | |||||||||||||
| Net income |
$ | 8,460 | $ | 13,404 | $ | 19,916 | $ | 1,965 | ||||||||
| Depreciation and amortization |
10,439 | 8,099 | 19,948 | 16,097 | ||||||||||||
| Loss on impairment |
— | — | 862 | — | ||||||||||||
| Loss (gain) on sale of assets, net |
9 | 225 | 13 | (39 | ) | |||||||||||
|
|
|
|
|
|
|
|
|
|||||||||
| FFO |
18,908 | 21,728 | 40,739 | 18,023 | ||||||||||||
| Loss on extinguishment of debt |
501 | — | 501 | 10,974 | ||||||||||||
| Reserve for uncollectible loan receivables |
3,211 | 11 | 3,211 | 11 | ||||||||||||
| Transaction costs |
1,048 | 460 | 2,593 | 696 | ||||||||||||
|
|
|
|
|
|
|
|
|
|||||||||
| Normalized FFO |
23,668 | 22,199 | 47,044 | 29,704 | ||||||||||||
| Amortization of deferred financing costs |
975 | 805 | 1,956 | 1,706 | ||||||||||||
| Non-cash stock-based compensation |
1,511 | 39 | 2,632 | 10,392 | ||||||||||||
| Straight-line rental income, net |
(58 | ) | (1,491 | ) | (1,694 | ) | (4,224 | ) | ||||||||
| Rental income from intangible amortization, net |
(139 | ) | (366 | ) | (407 | ) | (732 | ) | ||||||||
|
|
|
|
|
|
|
|
|
|||||||||
| AFFO |
$ | 25,957 | $ | 21,186 | $ | 49,531 | $ | 36,846 | ||||||||
|
|
|
|
|
|
|
|
|
|||||||||
| Weighted average common shares and units outstanding, basic |
57,200 | 49,210 | 53,237 | 41,876 | ||||||||||||
|
|
|
|
|
|
|
|
|
|||||||||
| Weighted average common shares and units outstanding, diluted |
59,367 | 51,154 | 55,174 | 43,773 | ||||||||||||
|
|
|
|
|
|
|
|
|
|||||||||
| AFFO per share and unit, basic |
$ | 0.45 | $ | 0.43 | $ | 0.93 | $ | 0.88 | ||||||||
|
|
|
|
|
|
|
|
|
|||||||||
| AFFO per share and unit, diluted |
$ | 0.44 | $ | 0.41 | $ | 0.90 | $ | 0.84 | ||||||||
|
|
|
|
|
|
|
|
|
|||||||||
| (1) | See definitions and footnotes on pages 17 and 18 |
6
Aviv REIT, Inc.
Consolidated Balance Sheets
(unaudited, in thousands except share data)
| June 30, 2014 |
December 31, 2013 |
|||||||
| Assets |
||||||||
| Income producing property |
||||||||
| Land |
$ | 159,238 | $ | 138,150 | ||||
| Buildings and improvements |
1,325,129 | 1,138,173 | ||||||
| Assets under direct financing leases |
11,234 | 11,175 | ||||||
|
|
|
|
|
|||||
| 1,495,601 | 1,287,498 | |||||||
| Less accumulated depreciation |
(166,356 | ) | (147,302 | ) | ||||
| Construction in progress and land held for development |
19,273 | 23,292 | ||||||
|
|
|
|
|
|||||
| Net real estate |
1,348,518 | 1,163,488 | ||||||
| Cash and cash equivalents |
49,056 | 50,764 | ||||||
| Straight-line rent receivable, net |
42,274 | 40,580 | ||||||
| Tenant receivables, net |
2,516 | 1,647 | ||||||
| Deferred finance costs, net |
18,614 | 16,643 | ||||||
| Secured loan receivables, net |
36,736 | 41,686 | ||||||
| Other assets |
16,670 | 15,625 | ||||||
|
|
|
|
|
|||||
| Total assets |
$ | 1,514,384 | $ | 1,330,433 | ||||
|
|
|
|
|
|||||
| Liabilities and equity |
||||||||
| Secured loan |
$ | 13,537 | $ | 13,654 | ||||
| Unsecured notes payable |
652,527 | 652,752 | ||||||
| Line of credit |
— | 20,000 | ||||||
| Accrued interest payable |
14,797 | 15,284 | ||||||
| Dividends and distributions payable |
21,077 | 17,694 | ||||||
| Accounts payable and accrued expenses |
11,101 | 10,555 | ||||||
| Tenant security and escrow deposits |
24,613 | 21,586 | ||||||
| Other liabilities |
10,296 | 10,463 | ||||||
|
|
|
|
|
|||||
| Total liabilities |
747,948 | 761,988 | ||||||
| Equity: |
||||||||
| Stockholders’ equity |
||||||||
| Common stock (par value $0.01; 47,190,078 and 37,593,910 shares issued and outstanding, as of June 30, 2014 and December 31, 2013, respectively) |
472 | 376 | ||||||
| Additional paid-in-capital |
721,297 | 523,658 | ||||||
| Accumulated deficit |
(104,788 | ) | (89,742 | ) | ||||
|
|
|
|
|
|||||
| Total stockholders’ equity |
616,981 | 434,292 | ||||||
| Noncontrolling interests - operating partnership |
149,455 | 134,153 | ||||||
|
|
|
|
|
|||||
| Total equity |
766,436 | 568,445 | ||||||
|
|
|
|
|
|||||
| Total liabilities and equity |
$ | 1,514,384 | $ | 1,330,433 | ||||
|
|
|
|
|
|||||
7
Aviv REIT, Inc.
Consolidated Statements of Cash Flows
(unaudited, in thousands)
| Six Months Ended June 30, | ||||||||
| 2014 | 2013 | |||||||
| Operating activities |
||||||||
| Net income |
$ | 19,916 | $ | 1,965 | ||||
| Adjustments to reconcile net income to net cash provided by operating activities: |
||||||||
| Depreciation and amortization |
19,948 | 16,097 | ||||||
| Amortization of deferred financing costs |
1,956 | 1,706 | ||||||
| Accretion of debt premium |
(264 | ) | (248 | ) | ||||
| Straight-line rental income, net |
(1,694 | ) | (4,224 | ) | ||||
| Rental income from intangible amortization, net |
(407 | ) | (732 | ) | ||||
| Non-cash stock-based compensation |
2,632 | 10,392 | ||||||
| Loss (gain) on sale of assets, net |
13 | (39 | ) | |||||
| Non-cash loss on extinguishment of debt |
494 | 5,161 | ||||||
| Loss on impairment |
862 | — | ||||||
| Reserve for uncollectible secured loan and other receivables |
3,500 | 30 | ||||||
| Changes in assets and liabilities: |
||||||||
| Tenant receivables |
(1,157 | ) | (2,273 | ) | ||||
| Other assets |
(1,251 | ) | 625 | |||||
| Accounts payable and accrued expenses |
(3,180 | ) | (2,915 | ) | ||||
| Tenant security deposits and other liabilities |
3,479 | (4,047 | ) | |||||
|
|
|
|
|
|||||
| Net cash provided by operating activities |
44,847 | 21,498 | ||||||
| Investing activities |
||||||||
| Purchase of real estate |
(187,070 | ) | (25,626 | ) | ||||
| Proceeds from sales of real estate |
622 | 2,606 | ||||||
| Capital improvements |
(5,266 | ) | (7,916 | ) | ||||
| Development projects |
(10,719 | ) | (10,498 | ) | ||||
| Secured loan receivables received from others |
5,034 | 2,361 | ||||||
| Secured loan receivables funded to others |
(3,295 | ) | (2,707 | ) | ||||
|
|
|
|
|
|||||
| Net cash used in investing activities |
(200,694 | ) | (41,780 | ) | ||||
8
Aviv REIT, Inc.
Consolidated Statements of Cash Flows (continued)
(unaudited, in thousands)
| Six Months Ended June 30, | ||||||||
| 2014 | 2013 | |||||||
| Financing activities |
||||||||
| Borrowings of debt |
$ | 98,000 | $ | 145,000 | ||||
| Repayment of debt |
(118,078 | ) | (353,165 | ) | ||||
| Payment of financing costs |
(4,566 | ) | (5,283 | ) | ||||
| Capital contributions |
17 | 425 | ||||||
| Proceeds from issuance of common stock |
221,720 | 303,600 | ||||||
| Cost of raising capital |
(10,470 | ) | (25,387 | ) | ||||
| Shares issued for settlement of vested stock and exercised stock options, net |
3,053 | — | ||||||
| Cash distributions to partners |
(8,330 | ) | (11,951 | ) | ||||
| Cash dividends to stockholders |
(27,207 | ) | (35,567 | ) | ||||
|
|
|
|
|
|||||
| Net cash provided by financing activities |
154,139 | 17,672 | ||||||
|
|
|
|
|
|||||
| Net decrease in cash and cash equivalents |
(1,708 | ) | (2,610 | ) | ||||
| Cash and cash equivalents: |
||||||||
| Beginning of period |
50,764 | 17,876 | ||||||
|
|
|
|
|
|||||
| End of period |
$ | 49,056 | $ | 15,266 | ||||
|
|
|
|
|
|||||
| Supplemental cash flow information |
||||||||
| Cash paid for interest |
$ | 25,156 | $ | 23,050 | ||||
| Supplemental disclosure of noncash activity |
||||||||
| Accrued dividends payable to stockholders |
$ | 17,000 | $ | — | ||||
| Accrued distributions payable to partners |
$ | 4,077 | $ | 27 | ||||
| Write-off of straight-line rent receivable |
$ | 1,380 | $ | — | ||||
| Write-off of deferred financing costs, net |
$ | 501 | $ | 5,161 | ||||
9
Aviv REIT, Inc.
Portfolio Summary1
Portfolio Composition
| Property Type |
Property Count |
Number of Beds |
Square Feet |
Investment (GBV) |
Annualized Cash Rent |
% of Total Rent |
||||||||||||||||||
| Skilled Nursing |
254 | 22,661 | 8,905 | $ | 1,272,738 | $ | 147,188 | 86.7 | % | |||||||||||||||
| Senior Housing |
29 | 1,850 | 1,196 | 162,210 | 17,307 | 10.2 | % | |||||||||||||||||
| Other Healthcare Properties |
21 | 201 | 260 | 60,652 | 5,340 | 3.1 | % | |||||||||||||||||
|
|
|
|
|
|
|
|
|
|
|
|
|
|||||||||||||
| Total |
304 | 24,712 | 10,361 | $ | 1,495,601 | $ | 169,836 | 100.0 | % | |||||||||||||||
|
|
|
|
|
|
|
|
|
|
|
|
|
|||||||||||||
Portfolio Performance
| Core Portfolio |
EBITDARM Coverage |
EBITDAR Coverage |
Occupancy | Facility Revenue Mix | EBITDAR Margin |
|||||||||||||||||||||||
| Private Pay | Medicare | Medicaid | ||||||||||||||||||||||||||
| Skilled Nursing |
1.84x | 1.43x | 78.1 | % | 19.6 | % | 24.2 | % | 56.1 | % | 14.2 | % | ||||||||||||||||
| Senior Housing |
1.26x | 1.08x | 77.9 | % | 83.8 | % | 4.5 | % | 11.7 | % | 23.5 | % | ||||||||||||||||
| Other Healthcare Properties |
7.91x | 7.07x | 89.2 | % | 100.0 | % | 0.0 | % | 0.0 | % | 34.0 | % | ||||||||||||||||
|
|
|
|
|
|
|
|
|
|
|
|
|
|
|
|||||||||||||||
| Total |
1.88x | 1.49x | 78.2 | % | 24.6 | % | 22.7 | % | 52.7 | % | 15.2 | % | ||||||||||||||||
|
|
|
|
|
|
|
|
|
|
|
|
|
|
|
|||||||||||||||
State Diversification
| Properties | Investment (GBV) |
Annualized Rent | ||||||||||||||
| State |
$ | % | ||||||||||||||
| Texas |
69 | $ | 295,441 | $ | 33,950 | 20.0 | % | |||||||||
| Ohio |
27 | 192,164 | 20,966 | 12.3 | % | |||||||||||
| California |
39 | 182,013 | 20,692 | 12.2 | % | |||||||||||
| Connecticut |
6 | 83,217 | 9,500 | 5.6 | % | |||||||||||
| Pennsylvania |
10 | 79,475 | 9,345 | 5.5 | % | |||||||||||
| Missouri |
15 | 76,441 | 7,527 | 4.4 | % | |||||||||||
| Kentucky |
10 | 60,052 | 6,474 | 3.8 | % | |||||||||||
| Arkansas |
10 | 54,016 | 5,915 | 3.5 | % | |||||||||||
| Illinois |
11 | 38,872 | 5,399 | 3.2 | % | |||||||||||
| New Mexico |
9 | 29,586 | 5,183 | 3.1 | % | |||||||||||
| Other 19 States |
98 | 404,324 | 44,884 | 26.4 | % | |||||||||||
|
|
|
|
|
|
|
|
|
|||||||||
| 304 | $ | 1,495,601 | $ | 169,836 | 100.0 | % | ||||||||||
|
|
|
|
|
|
|
|
|
|||||||||
Operator Diversification
| Properties | Investment (GBV) |
Annualized Rent | States | |||||||||||||||||||||
| Operator (Location) |
Aviv | Total | $ | % | ||||||||||||||||||||
| Daybreak (Denton, TX) |
53 | 70 | $ | 173,337 | $ | 21,841 | 12.9 | % | 2 | |||||||||||||||
| Saber (Bedford Heights, OH) |
30 | 79 | 185,726 | 21,313 | 12.5 | % | 6 | |||||||||||||||||
| Fundamental (Sparks, MD) |
17 | 72 | 148,335 | 14,182 | 8.4 | % | 9 | |||||||||||||||||
| EmpRes (Vancouver, WA) |
17 | 45 | 111,862 | 12,556 | 7.4 | % | 6 | |||||||||||||||||
| Preferred Care (Plano, TX) |
17 | 111 | 69,007 | 10,660 | 6.3 | % | 12 | |||||||||||||||||
| Maplewood (Westport, CT) |
7 | 7 | 93,826 | 10,305 | 6.1 | % | 2 | |||||||||||||||||
| Sun Mar (Brea, CA) |
13 | 25 | 71,121 | 9,031 | 5.3 | % | 1 | |||||||||||||||||
| Diversicare (Brentwood, TN) |
7 | 49 | 61,055 | 6,237 | 3.7 | % | 9 | |||||||||||||||||
| Providence (National City, CA) |
10 | 12 | 48,350 | 5,228 | 3.1 | % | 2 | |||||||||||||||||
| Deseret (Bountiful, UT) |
17 | 28 | 37,646 | 4,941 | 2.9 | % | 5 | |||||||||||||||||
| Other 29 Operators |
116 | 402 | 495,334 | 53,543 | 31.5 | % | ||||||||||||||||||
|
|
|
|
|
|
|
|
|
|
|
|||||||||||||||
| 304 | 900 | $ | 1,495,601 | $ | 169,836 | 100.0 | % | |||||||||||||||||
|
|
|
|
|
|
|
|
|
|
|
|||||||||||||||
| (1) | Dollars and square feet in thousands. Data as of June 30, 2014. Coverage, occupancy, margin and revenue mix information is provided on a trailing twelve month basis through M arch 31, 2014. Annualized cash rent for leases in place as of June 30, 2014 and includes income from a deferred financing lease. Totals may not add due to rounding. |
10
Aviv REIT, Inc.
Portfolio Summary
State Occupancy1
| State |
Aviv Occupancy |
State Average |
Variance | |||||||||
| Texas |
73.9 | % | 72.1 | % | 1.8 | % | ||||||
| Ohio |
77.6 | % | 84.3 | % | (6.7 | %) | ||||||
| California |
91.5 | % | 85.0 | % | 6.5 | % | ||||||
| Connecticut |
98.4 | % | NA | NA | ||||||||
| Pennsylvania |
85.0 | % | 90.1 | % | (5.1 | %) | ||||||
| Missouri |
70.5 | % | 71.6 | % | (1.1 | %) | ||||||
| Kentucky |
83.4 | % | 87.1 | % | (3.7 | %) | ||||||
| Arkansas |
68.6 | % | 72.1 | % | (3.5 | %) | ||||||
| Illinois |
69.5 | % | 77.3 | % | (7.8 | %) | ||||||
| New Mexico |
80.5 | % | 83.2 | % | (2.7 | %) | ||||||
Lease Maturity Schedule2
| Year |
Number of Properties |
% of Total Rent |
||||||
| 2014 |
0 | 0.0 | % | |||||
| 2015 |
4 | 1.0 | % | |||||
| 2016 |
4 | 1.5 | % | |||||
| 2017 |
16 | 3.4 | % | |||||
| 2018 |
29 | 10.6 | % | |||||
| Thereafter |
250 | 83.5 | % | |||||
|
|
|
|
|
|||||
| Total |
303 | 100.0 | % | |||||
|
|
|
|
|
|||||
| (1) | Occupancy information as of March 31, 2014. State occupancy represents nursing facility occupancies per American Health Care Association. Aviv only has assisted living properties in Connecticut. |
| (2) | Lease expiration schedule as of June 30, 2014 and excludes one property without a lease in place at June 30, 2014. |
11
Aviv REIT, Inc.
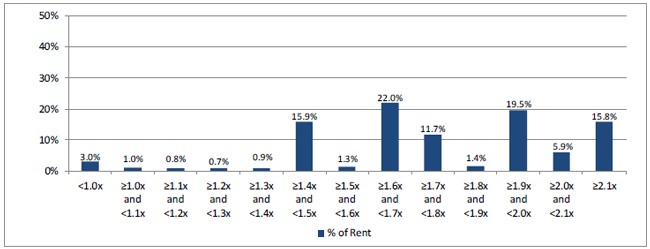
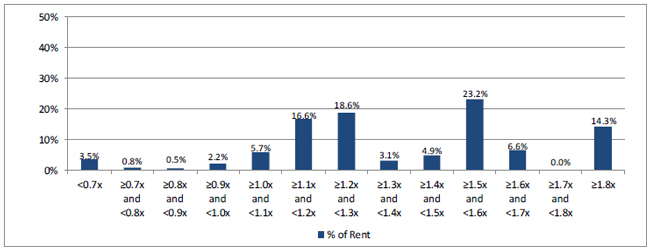
Portfolio Summary
Information for the trailing twelve month period ended March 31, 2014
EBITDARM Coverage Distribution
EBITDAR Coverage Distribution
12
Aviv REIT, Inc.
Investment Activity as of June 30, 2014
(in thousands)
2014 Property Reinvestment and New Construction
| Period |
Property Reinvestment |
New Construction |
Total | |||||||||
| Second quarter |
$ | 3,422 | $ | 5,023 | $ | 8,445 | ||||||
| First quarter |
1,844 | 5,696 | 7,540 | |||||||||
|
|
|
|||||||||||
| $ | 15,985 | |||||||||||
|
|
|
|||||||||||
New Construction Projects
| Operator - Location |
Property Type |
Beds | Opening Date |
Construction in Progress at 6/30/2014 |
Remaining Costs to be Spent |
Total Expected Cost |
Expected Yield |
|||||||||||||||
| Maplewood - Bethel, CT |
ALF | 80 | Q1 2015 | $ | 12,538 | $ | 6,362 | $ | 18,900 | 9.5 | % | |||||||||||
| Care Meridian - numerous locations |
TBI | — | — | 2,540 | 3,960 | 6,500 | 9.5 | % | ||||||||||||||
| Physician’s Hospital - Bremen, IN |
Spec. Hosp. | 37 | Q4 2014 | 1,837 | 863 | 2,700 | 10.0 | % | ||||||||||||||
| Land held for development |
— | — | — | 2,359 | — | 2,359 | — | |||||||||||||||
|
|
|
|
|
|
|
|||||||||||||||||
| Total |
$ | 19,273 | $ | 11,185 | $ | 30,459 | ||||||||||||||||
|
|
|
|
|
|
|
|||||||||||||||||
2014 Acquisitions
| Period |
Property Type | Location | Beds | Amount | Initial Cash Yield |
|||||||||||
| Third quarter to date1 |
SNF, ALF | 2 states | 951 | $ | 98,200 | 8.3 | % | |||||||||
| Second quarter |
SNF | 4 states | 1,123 | 82,650 | 9.8 | % | ||||||||||
| First quarter |
SNF, ALF, ILF | 4 states | 1,504 | 104,420 | 10.0 | % | ||||||||||
|
|
|
|
|
|
|
|||||||||||
| Total |
3,578 | $ | 285,270 | 9.4 | % | |||||||||||
|
|
|
|
|
|
|
|||||||||||
| (1) | Excludes $12.3 million paid for two land parcels and entitlements for the construction of two ALFs and a 50-unit expansion to an existing ALF. |
13
Aviv REIT, Inc.
Debt Summary and Capitalization as of June 30, 2014
Debt Maturities
| Year |
Senior Unsecured Notes |
Line of Credit | Mortgage Debt |
Total Debt | ||||||||||||
| 2014 |
$ | — | $ | — | $ | 81 | $ | 81 | ||||||||
| 2015 |
— | — | 165 | 165 | ||||||||||||
| 2016 |
— | — | 174 | 174 | ||||||||||||
| 2017 |
— | — | 183 | 183 | ||||||||||||
| 2018 |
— | — | 192 | 192 | ||||||||||||
| Thereafter |
650,000 | — | 10,366 | 660,366 | ||||||||||||
|
|
|
|
|
|
|
|
|
|||||||||
| Subtotal |
$ | 650,000 | $ | — | $ | 11,161 | $ | 661,161 | ||||||||
| (Discounts) and premiums, net |
2,527 | — | 2,376 | 4,903 | ||||||||||||
|
|
|
|
|
|
|
|
|
|||||||||
| Total debt |
$ | 652,527 | $ | — | $ | 13,537 | $ | 666,064 | ||||||||
|
|
|
|
|
|
|
|
|
|||||||||
| Weighted average interest rate |
7.0 | % | ||||||||||||||
|
|
|
|||||||||||||||
| Weighted average maturity in years |
6.1 | |||||||||||||||
|
|
|
|||||||||||||||
Fixed and Floating Rate Debt
| Amount | % of Total | |||||||
| Fixed rate debt |
||||||||
| Senior unsecured notes |
$ | 652,527 | 98.0 | % | ||||
| Mortgage debt |
13,537 | 2.0 | % | |||||
|
|
|
|
|
|||||
| Total fixed rate debt |
$ | 666,064 | 100.0 | % | ||||
| Floating rate debt |
||||||||
| Revolver |
$ | — | 0.0 | % | ||||
|
|
|
|
|
|||||
| Total debt |
$ | 666,064 | 100.0 | % | ||||
|
|
|
|
|
|||||
Covenants for Senior Unsecured Notes1
| Covenant |
Requirement |
Q2 2014 | Q4 2013 | |||||||
| Total debt / total assets |
No greater than 60% | 40 | % | 46 | % | |||||
| Secured debt / total assets |
No greater than 40% | 1 | % | 2 | % | |||||
| Interest coverage |
No less than 2.00x | 3.30x | 3.16x | |||||||
| Unencumbered assets / unsecured debt |
No less than 150% | 254 | % | 185 | % | |||||
Total Market Capitalization
| Shares/units Outstanding |
6/30/2014 Closing Price |
Value | ||||||||||
| Common stock and OP units |
58,681 | $ | 28.17 | $ | 1,653,034 | |||||||
| Total debt |
666,064 | |||||||||||
|
|
|
|||||||||||
| Total market capitalization |
$ | 2,319,097 | ||||||||||
|
|
|
|||||||||||
Dollars and shares/units in thousands
| (1) | Covenants are calculated in accordance with the indenture governing the senior unsecured notes. |
14
Aviv REIT, Inc.
Common Share and OP Unit
Weighted Average Amounts Outstanding
| Q2 2014 | Q2 2013 | YTD Q2 2014 |
YTD Q2 2013 |
|||||||||||||
| Weighted Average Amounts Outstanding for EPS Purposes: |
||||||||||||||||
| Common shares - basic |
45,715,874 | 37,271,273 | 41,728,111 | 29,937,107 | ||||||||||||
| Effect of dilutive securities: |
||||||||||||||||
| OP units |
11,484,462 | 11,938,420 | 11,508,413 | 6,331,980 | ||||||||||||
| Stock options |
2,031,963 | 1,932,841 | 1,841,567 | 1,891,604 | ||||||||||||
| Restricted stock units |
134,574 | 11,878 | 95,623 | 6,102 | ||||||||||||
|
|
|
|
|
|
|
|
|
|||||||||
| Total common shares - diluted |
59,366,873 | 51,154,412 | 55,173,714 | 38,166,793 | ||||||||||||
|
|
|
|
|
|
|
|
|
|||||||||
| Weighted Average Amounts Outstanding for FFO, Normalized FFO and AFFO Purposes: |
||||||||||||||||
| Common shares - basic |
45,715,874 | 37,271,273 | 41,728,111 | 29,937,107 | ||||||||||||
| OP units |
11,484,462 | 11,938,420 | 11,508,413 | 11,938,420 | ||||||||||||
|
|
|
|
|
|
|
|
|
|||||||||
| Total common shares and OP units |
57,200,336 | 49,209,693 | 53,236,524 | 41,875,527 | ||||||||||||
| Effect of dilutive securities: |
||||||||||||||||
| Stock options |
2,031,963 | 1,932,841 | 1,841,567 | 1,891,604 | ||||||||||||
| Restricted stock units |
134,574 | 11,878 | 95,623 | 6,102 | ||||||||||||
|
|
|
|
|
|
|
|
|
|||||||||
| Total common shares and units - diluted |
59,366,873 | 51,154,412 | 55,173,714 | 43,773,233 | ||||||||||||
|
|
|
|
|
|
|
|
|
|||||||||
| Period Ending Amounts Outstanding: |
||||||||||||||||
| Common shares (includes restricted stock) |
47,221,578 | 37,318,523 | ||||||||||||||
| OP units |
11,443,312 | 11,938,420 | ||||||||||||||
|
|
|
|
|
|||||||||||||
| Total common shares and units |
58,664,890 | 49,256,943 | ||||||||||||||
|
|
|
|
|
|||||||||||||
15
Aviv REIT, Inc.
2014 Guidance
The following table illustrates the Company’s AFFO per share guidance for the year ending December 31, 2014.
| Expected 2014 Per Share | ||
| Per diluted common share: |
||
| Net income |
$0.91 - $0.95 | |
| Depreciation and amortization |
0.74 | |
| Loss on impairment |
0.01 | |
|
| ||
| FFO |
$1.66 - $1.70 | |
| Loss on extinguishment of debt |
0.01 | |
| Reserve for uncollectible loan receivables |
0.06 | |
| Transaction costs |
0.09 | |
|
| ||
| Normalized FFO |
$1.82 - $1.86 | |
| Amortization of deferred financing costs |
0.07 | |
| Non-cash stock-based compensation |
0.09 | |
| Straight-line rental income, net |
(0.07) | |
| Rental income from intangible amortization, net |
(0.01) | |
|
| ||
| AFFO |
$1.89 - $1.93 | |
|
| ||
| Weighted average common shares and units - diluted |
58.2 million | |
16
Aviv REIT, Inc.
Definitions and Footnotes
EBITDARM Coverage: Represents EBITDARM, which the Company defines as earnings before interest, taxes, depreciation, amortization, rent expense and management fees allocated by the operator to one of its affiliates, of our operators for the applicable period, divided by the rent paid to the Company by its operators during each period.
EBITDAR Coverage: Represents EBITDAR, which the Company defines as earnings before interest, taxes, depreciation, amortization and rent expense, of its operators for the applicable period, divided by the rent paid to Aviv by its operators during such period. Assumes a management fee of 4%.
EBITDAR Margin: Represents the operator’s EBITDAR for the applicable period divided by the operator’s total revenue for the applicable period.
Enterprise Value: Represents equity market capitalization plus net debt. Equity market capitalization is calculated as the number of shares of common stock and units multiplied by the closing price of the Company’s common stock on the last day of the period presented. Net debt represents total debt less cash and cash equivalents.
Portfolio Occupancy: Represents the average daily number of beds at the Company’s properties that are occupied during the applicable period divided by the total number of beds at the Company’s properties that are available for use during the applicable period.
Property Type: ALF = assisted living facility; LTACH = long-term acute care hospital; MOB = medical office building; TBI = traumatic brain injury facility; SNF = skilled nursing facility
State Average Occupancy: Represents the Nursing Facility State Occupancy Rate as reported by American Health Care Association (AHCA). AHCA occupancy data is calculated by dividing the sum of all facility patients in the state occupying certified beds by the sum of all the certified beds in the state reported at the time of the survey corresponding to the period presented. Aviv occupancy represents the state occupancy for the entire portfolio.
Yield: Represents annualized contractual or projected income to be received in cash divided by investment amount.
Portfolio metrics and other statistics are not derived from Aviv’s financial statements but are operating statistics that the Company derives from reports that it receives from its operators pursuant to Aviv’s triple-net leases. As a result, the Company’s portfolio metrics typically lag its own financial statements by approximately one quarter. In order to determine Aviv’s portfolio metrics for the period presented, the metrics are stated only with respect to properties owned by the Company and operated by the same operator for the portion of the period Aviv owned the properties and exclude assets held for sale, closed properties, properties under construction and, with certain exceptions for shorter periods, properties within 24 months of completion of construction. Accordingly, EBITDARM coverage, EBITDAR coverage, EBITDAR margin, portfolio occupancy and quality mix for the twelve months ended March 31, 2014 included 276 core properties of the 295 properties in the Company’s portfolio as of March 31, 2014.
When Aviv refers to the “total rent” of its portfolio, the Company is referring to the total monthly rent due under all of its triple-net leases as of the date specified, calculated based on the first full month following the specified date. Aviv calculates “annualized rent” for properties during a period by utilizing the amount of rent under contract as of the last day of the period and assume that amount of rent was received in respect of such property throughout the entire period.
Non-GAAP Financial Measures
In addition to the results of operations presented in this release, we use financial measures in this release that are derived on the basis of methodologies other than in accordance with United States generally accepted accounting principles (GAAP). We derive these non-GAAP measures as follows:
| • | FFO is defined by the National Association of Real Estate Investment Trusts, or NAREIT, as net income (computed in accordance with GAAP), excluding gains and losses from sales of property (net) and impairments of depreciated real estate, plus real estate depreciation and amortization (excluding amortization of deferred financing costs) and after adjustments for unconsolidated partnerships and joint ventures. Applying the NAREIT definition to our financial statements results in FFO representing net income before depreciation and amortization, loss on impairment, and gain (loss) on sale of assets (net). |
| • | Normalized FFO represents FFO before loss on extinguishment of debt, reserve for uncollectible loan receivables, transaction costs and severance costs. |
| • | AFFO represents Normalized FFO before amortization of deferred financing costs, non-cash stock-based compensation, straight-line rental income (net) and rental income from intangible amortization (net). |
| • | EBITDA represents net income before interest expense (net), amortization of deferred financing costs and depreciation and amortization. |
| • | Adjusted EBITDA represents EBITDA before impairment of assets, gain (loss) on sale of assets (net), transaction costs, write-off of straight-line rents, non-cash stock-based compensation, loss on extinguishment of debt and reserve for uncollectible loan receivables. |
17
Aviv REIT, Inc.
Definitions and Footnotes
Our management uses FFO, Normalized FFO, AFFO, EBITDA and Adjusted EBITDA as important supplemental measures of our operating performance and liquidity. FFO is intended to exclude GAAP historical cost depreciation and amortization of real estate and related assets, which assumes that the value of real estate assets diminishes ratably over time. Historically, however, real estate values have risen or fallen with market conditions. The term FFO was designed by the real estate industry to address this issue and as an indicator of our ability to incur and service debt. Because FFO, Normalized FFO and AFFO exclude depreciation and amortization unique to real estate, impairment, gains and losses from property dispositions and extraordinary items and because EBITDA and Adjusted EBITDA exclude certain non-cash charges and adjustments and amounts spent on interest and taxes, they provide our management with performance measures that, when compared year over year or with other REITs, reflect the impact to operations from trends in occupancy rates, rental rates, operating costs, development activities and, with respect to FFO, Normalized FFO and AFFO, interest costs, in each case providing perspective not immediately apparent from net income. In addition, we believe that FFO, Normalized FFO, AFFO, EBITDA and Adjusted EBITDA are frequently used by securities analysts, investors and other interested parties in the evaluation of REITs.
We offer these measures to assist the users of our financial statements in assessing our financial performance and liquidity under GAAP, but these measures are non-GAAP measures and should not be considered measures of liquidity, alternatives to net income or indicators of any other performance measure determined in accordance with GAAP, nor are they indicative of funds available to fund our cash needs, including our ability to make payments on our indebtedness. In addition, our calculations of these measures are not necessarily comparable to similar measures as calculated by other companies that do not use the same definition or implementation guidelines or interpret the standards differently from us. Investors should not rely on these measures as a substitute for any GAAP measure, including net income, cash flows provided by operating activities or revenues.
18