Attached files
| file | filename |
|---|---|
| 8-K - FORM 8-K - ASTORIA FINANCIAL CORP | v385703_8k.htm |

NYSE : AF Investor Presentation Second Quarter Ended June 30, 2014

Forward Looking Statement 2 Thispresentationmaycontainanumberofforward-lookingstatementswithinthemeaningofSection27Aofthe Securities Act of 1933, as amended, and Section 21E of the Securities Exchange Act of 1934, as amended. Thesestatementsmaybeidentifiedbytheuseofthewords“anticipate,”“believe,”“could,”“estimate,”“expect,” “intend,” “may,” “outlook,” “plan,” “potential,” “predict,” “project,” “should,” “will,” “would,” and similar terms and phrases,includingreferencestoassumptions.Forward-lookingstatementsarebasedonvariousassumptionsand analyses made by us in light of our management’s experience and perception of historical trends, current conditions and expected future developments, as well as other factors we believe are appropriate under the circumstances.Thesestatementsarenotguaranteesoffutureperformanceandaresubjecttorisks,uncertainties andotherfactors(manyofwhicharebeyondourcontrol)thatcouldcauseactualresultstodiffermateriallyfrom futureresultsexpressedorimpliedbysuchforward-lookingstatements.Thesefactorsinclude,withoutlimitation, thefollowing:thetimingandoccurrenceornon-occurrenceofeventsmaybesubjecttocircumstancesbeyondour control; there may be increases in competitive pressure among financial institutions or from non-financial institutions; changes in the interest rate environment may reduce interest margins or affect the value of our investments;changes indeposit flows,loan demand orrealestate values may adversely affect ourbusiness; changes in accounting principles, policies or guidelines may cause our financial condition to be perceived differently;generaleconomicconditions,eithernationallyorlocallyinsomeorallareasinwhichwedobusiness, or conditions in the real estate or securities markets or the banking industry may be less favorable than we currentlyanticipate;legislativeorregulatorychanges,includingtheimplementationoftheDodd-FrankWallStreet ReformandConsumerProtectionActof2010andanyactionsregardingforeclosures,mayadverselyaffectour business;enhancedsupervisionandexaminationbytheOfficeoftheComptrolleroftheCurrency,theBoardof GovernorsoftheFederalReserveSystem,andtheConsumerFinancialProtectionBureau;effectsofchangesin existing U.S. government or government-sponsored mortgage programs; technological changes may be more difficult or expensive than we anticipate; success or consummation of new business initiatives may be more difficultorexpensivethanweanticipate;orlitigationorothermattersbeforeregulatoryagencies,whethercurrently existing or commencing in the future, may be determined adverse to us or may delay occurrence or non- occurrenceofeventslongerthanweanticipate.Wehavenoobligationtoupdateanyforward-lookingstatements toreflecteventsorcircumstancesafterthedateofthisdocument.
Corporate Profile NYSE : AF » With assets of $15.7 billion, Astoria Financial is the holding company for Astoria Bank and is the fifth largest publicly traded thrift holding company in the country. » Established in 1888, Astoria Bank (name changed from Astoria Federal Savings & Loan Association on June 1, 2014), with deposits totaling $9.7 billion, is the second largest thrift depository in New York. » 20 consecutive years of core profitability as a public company (1) » Stable and healthy credit metrics throughout the crisis » Clean, well capitalized balance sheet 3 (1) Refers to net income recalculated to exclude net realized gains and losses on securities, amortization of intangibles and impairment of goodwill, and other nonrecurring items. Core profitability is a non-GAAP financial measure.

Strategy and Business Fundamentals 4 Conservative Corporate Strategy • Core competencies: -Mortgage lending - Retail banking -Business banking • Reposition asset/liability mix - Focus on multi-family & commercial real estate loans - Increase core deposits, decrease CDs - Expand business banking footprint • Disciplined cost control Disciplined Lending • Multi-family & commercial real estate lending - Top quality - Approximately 90% of multi-family loans recently closed and pipeline loans are subject to rent control or rent stabilization - Low LTVs • Residential lending - Geographically diverse loan portfolio - Low LTVs and no sub- prime, payment option or negative amortization loans - Primarily jumbo 5/1 and 7/1 ARMs and 15 year fixed rate loans Attractive and Stable Franchise • Significant deposit market share • #2 thrift in core market (1) • Core market is more densely populated and wealthier than U.S. average (1) Strong Leadership and Culture • Solid & seasoned management team • High insider ownership (14%) aligns management with shareholders • Significant community involvement through funding and volunteer efforts Sources: SNL Financial LC, Company filings. (1) Deposit market share as of June 30, 2013. Core market includes Long Island market consisting of Kings, Queens, Nassau and Suffolk counties.
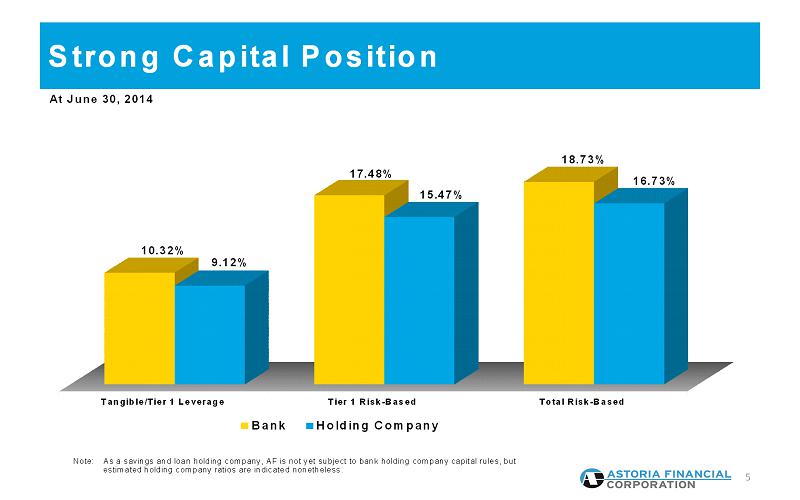
Strong Capital Position 5 Tangible/Tier 1 Leverage Tier 1 Risk-Based Total Risk-Based 10.32% 17.48% 18.73% 9.12% 15.47% 16.73% Bank Holding Company At June 30, 2014 Note: As a savings and loan holding company, AF is not yet subject to bank holding company capital rules, but estimated holding company ratios are indicated nonetheless.

Multi-family/Commercial Real Estate Lending MF/CRE loan portfolio growing to a larger percentage of the total loan portfolio; grew to 37% of total loans at June 30, 2014, from 33% at December 31, 2013 and 30% at June 30, 2013. » $4.4 billion portfolio, or 37% of total loan portfolio 1 st half 2014 originations of $571.5 million, with a weighted average LTV at origination of approximately 52% and weighted average debt service coverage ratio of approximately 1.63, all in footprint » Focus on rent controlled, rent stabilized apartments in New York City Approximately 70% of multi-family portfolio originated prior to 2011, and approximately 90% of originated and pipeline loans since 2011, are subject to rent control or rent stabilization Pipeline of approximately $347 million at June 30, 2014 with weighted average coupon of approximately 3.41%. 6
Residential Mortgage Lending » $7.3 billion portfolio Primarily prime, jumbo 5/1 and 7/1 hybrid ARMs and 15 year fixed rate loans No sub-prime, payment option or negative amortization ARM lending Weighted average LTV (1) on total residential loan portfolio <60% 1 st half 2014 originations of $181.5 million with a weighted average LTV at origination of approximately 70% Pipeline of approximately $207 million at June 30, 2014 » Multiple delivery channels provide flexibility & efficiency Retail (2) Commissioned brokers (2) Third party originators (2) » Geographically diversified portfolio Reduces lending concentrations 7 (1) LTV ratios are based on current principal balances and original appraised values. (2) All loans underwritten to Astoria’s stringent standards.

Leading Retail Banking Franchise » Changed name to Astoria Bank on June 1, 2014 Better reflects our business as a diversified, full service community bank » $9.7 billion in deposits, 86 branch locations Low cost/stable source of funds –weighted average rate: 0.53% Low cost core deposits * totaled $6.7 billion, or 69% of total deposits; up from 67% of total deposits at December 31, 2013 and 65% of total deposits at June 30, 2013 57% of households that have a retail CD account also have a low cost checking, savings or money market account relationship » 92% of depositors, with $8.9 billion in deposits, live within 5 miles of a branch » Banking branches with high average deposits contribute to franchise value Long Island Offices (82) –Nassau (28), Suffolk (25), Queens (17), Brooklyn (12) Average Deposits of $113 Million Westchester Offices (3) –Average Deposits of $126 Million New York Office (1) –Opened March 31, 2014 –Deposits of $35 Million » Multiple delivery channels ATM’s, telephone, Internet and mobile banking 8 * Core deposits include savings, money market and checking accounts

Retail Banking Philosophy » Consultative approach to helping consumers achieve financial health and well-being » Pro-active sales culture –PEAK Process » Focus on customer service High customer satisfaction Favorably positioned against the competition » Community involvement Support over 700 local organizations and not-for-profit agencies 9 Astoria Bank is an integral part of the fabric of the communities it serves
Business Banking Expansion » More than 60% of Astoria Bank’s 86 branches are headed by experienced commercial bankers » 44 employees currently supporting the business at June 30, 2014, up from 21 at year-end 2012 » Opened a business banking office in mid-town Manhattan during 3Q13 » Opened our first full-service branch in Manhattan on March 31, 2014. » Plan to open seven more full-service branches by the end of 2016 in prime commercial locations within our market to better serve our business banking clients 10 Business deposits grew 23% from year-end 2013 to $801.3 million at June 30, 2014, including $111.2 million in the 2014 second quarter.

Strong Banking Franchise 11 CORE MARKET (Kings, Queens, Nassau & Suffolk) Total Population –7.6 Million (Exceeds population of 38 individual U.S. states) Total Deposits -$191.3 Billion Kings County (Brooklyn) Population: 2.5 million Median household income: $40K Deposits: $1.3 billion Branches: 12 Market share: 3% Rank: #1 thrift Queens County Population: 2.3 million Median household income: $53K Deposits: $2.4 billion Branches: 17 Market share: 5% Rank: #2 thrift Nassau County Population: 1.3 million Median household income: $95K Deposits: $4.1 billion Branches: 28 Market share: 7% Rank: #2 thrift Suffolk County Population: 1.5 million Median household income: $84K Deposits: $2.3 billion Branches: 25 Market share: 5% Rank: #1 thrift Manhattan (NYC) Population: 1.6 million Median household income: $59K Branches: 1 Westchester Population: 0.9 million Median household income: $76K Deposits: $0.4 billion Branches: 3 Market share: 1% Rank: #3 thrift Well Positioned in Core Long Island Market Sources: FDIC Summary of Deposits (as of June 30, 2013) SNL Financial LC
Current Focus »Balance Sheet Repositioning »Asset Quality Improvement »Interest Rate Risk Management »Net Interest Margin Improvement 12

Residential 68% MF/CRE 30% Other 2% Residential 61% MF/CRE 37% Other 2% Balance Sheet Repositioning Trend 13 Deposits Core 65% CDs 35% Core 69% CDs 31% Loans At June 30, 20142012 Residential 77% MF/CRE 21% Other 2% Core 58% CDs 42% 2013
Current Focus »Balance Sheet Repositioning »Asset Quality Improvement »Interest Rate Risk Management »Net Interest Margin Improvement 14
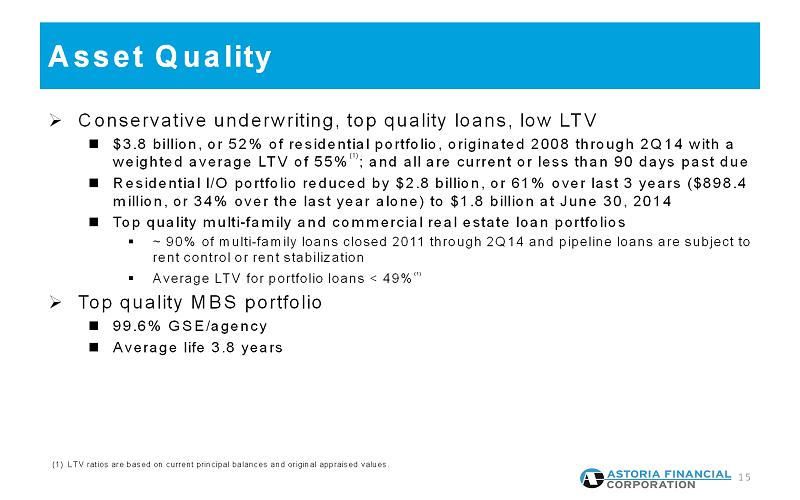
Asset Quality » Conservative underwriting, top quality loans, low LTV $3.8 billion, or 52% of residential portfolio, originated 2008 through 2Q14 with a weighted average LTV of 55% (1) ; and all are current or less than 90 days past due Residential I/O portfolio reduced by $2.8 billion, or 61% over last 3 years ($898.4 million, or 34% over the last year alone) to $1.8 billion at June 30, 2014 Top quality multi-family and commercial real estate loan portfolios ▪ ~ 90% of multi-family loans closed 2011 through 2Q14 and pipeline loans are subject to rent control or rent stabilization ▪ Average LTV for portfolio loans < 49% (1) » Top quality MBS portfolio 99.6% GSE/agency Average life 3.8 years 15 (1) LTV ratios are based on current principal balances and original appraised values.

Geographic Composition of Residential Loans 16 NPLs Total NPLs Less NPLs Pre-Bulk Portfolio Than 90 Days 90 Days or State Sale NPLs Past Due More Past Due New York* $ 2,181.9 $ 48.8 $ 42.0 $ 6.8 $ 2.8 $ 4.0 Connecticut* 737.8 32.8 27.3 5.5 3.7 1.8 Illinois* 659.4 33.3 22.1 11.2 8.8 2.4 Massachusetts* 638.7 11.3 8.5 2.8 1.9 0.9 Virginia 530.1 14.6 6.5 8.1 6.7 1.4 New Jersey* 494.2 51.5 40.8 10.7 7.5 3.2 Maryland* 458.3 34.4 18.5 15.9 11.9 4.0 California 424.0 20.0 9.7 10.3 9.8 0.5 Washington 212.2 1.0 1.0 0.0 0.0 0.0 Texas 191.9 0.0 0.0 0.0 0.0 0.0 All other states (1,2) 796.2 30.0 18.6 11.4 7.9 3.5 TOTAL PORTFOLIO $ 7,324.7 $ 277.7 $ 195.0 $ 82.7 $ 61.0 $ 21.7 Residential Loans Sale Bulk (in millions) At June 30, 2014 * Judicial foreclosure required. (1) Includes 25 states and Washington, D.C. (2) Includes Florida with $127.1 million of total loans, of which $2.4 million are still in the portfolio.

Asset Quality 17 (1) Includes $188.8 million of home equity loans. (2) Includes $51.7 million of net unamortized premiums and deferred loan costs. (3) Includes $61.0 million of residential loans, $2.9 million of multi-family loans and $7.6 million of CRE loans, in each case, which were current or less than 90 days past due. Does not include $186.3million of residential loans held-for-sale. (4) Does not footdue to rounding. (5) Includes $8.7 million of charge-offs related to the designation of NPLs asheld-for-sale. (6) Includes loans which were current totaling $62.9 million at June 30, 2014, $67.2 million at June 30, 2013 and $28.8 million at June 30, 2012. Consumer & Multi-family Loan portfolio balance $ 7,324.7 $ 3,583.6 $ 862.4 $ 239.2 (1) $ 12,061.6 (2) Non-performing loans (NPLs) (3) $ 82.7 $ 13.2 $ 8.0 $ 5.8 $ 109.7 NPLs as a % of total loans 0.69 % 0.11 % 0.07 % 0.05 % 0.91 %(4) Net charge-offs 2Q14 $ 9.0 (5) $ 0.2 $ -- $ 0.4 $ 9.7 (4) Net charge-offs YTD $ 11.2 (5) $ 0.9 $ 3.0 $ 1.2 $ 16.3 Other Residential TotalCRE + = At June 30, 2012 $ 163.9 $ 33.6 $ 309.7 $ 343.3 $ 507.2 142.4 163.9 At June 30, 2013 $ 142.4 $ 78.8 $ 278.1 $ 356.9 $ 499.3 142.4 163.9 At June 30, 2014 $ 113.6 $ 71.5 $ 38.2 $ 109.7 $ 223.3 Past Due (6) Past Due NPLs Delinquent Loans and NPLs Total Loans 30-89 Days Past Due NPLs 90 Days or More NPLs Less Than 90 Days Selected asset quality metrics at June 30, 2014, except as noted ($ in millions) Two year delinquent loan migration trend (in millions)

»Balance Sheet Repositioning »Asset Quality Improvement »Interest Rate Risk Management »Net Interest Margin Improvement Current Focus 18

Interest Rate Risk Management » One year cumulative interest rate sensitivity gap at June 30, 2014: + 0.40% At June 30, 2014 low cost core deposits totaled $6.7 billion or 69% of total deposits; up from 67% of total deposits at December 31, 2013 and 65% of total deposits at June 30, 2013 » Key balance sheet components Approximately $3.7 billion, or 32%, of mortgage portfolio matures or repricesin one year or less Weighted average life of MBS portfolio of 3.8 years 19

»Balance Sheet Repositioning »Asset Quality Improvement »Interest Rate Risk Management »Net Interest Margin Improvement Current Focus 20

Net Interest Margin 21 2012 2013 1H2014 2.16% 2.25% 2.34%

Investment Summary » Conservative Corporate Strategy Quality mortgage lending Quality retail and business banking Disciplined cost control Well capitalized for all bank regulatory purposes » Disciplined Lending Multi-family/CRE 1H14 originations of $571.5 million with a weighted average LTV at origination of approximately 52% and weighted average debt service coverage ratio of approximately 1.63 all in footprint $3.8 billion, or 52% of residential portfolio, originated 2008 through 2Q14, with weighted average LTVs of approximately 55% (1) ; and all are current or less than 90 days past due No Alt A loans originated since 2007 Residential I/O portfolio reduced by $2.8 billion, or 61% over last 3 years ($898.4 million, or 34% over the last year alone) to $1.8 billion at June 30, 2014 » Attractive and Stable Franchise Significant deposit market share in Long Island market (2) Core deposit growth –emphasis on personal and business checking, marketing campaigns » Strong Leadership and Culture Average of 33 years of executive management experience Insider ownership at 14% 22 (1) LTV ratios are based on current principal balances and original appraised values. (2) Long Island market includes Kings, Queens, Nassau and Suffolk counties.

23 Addendum
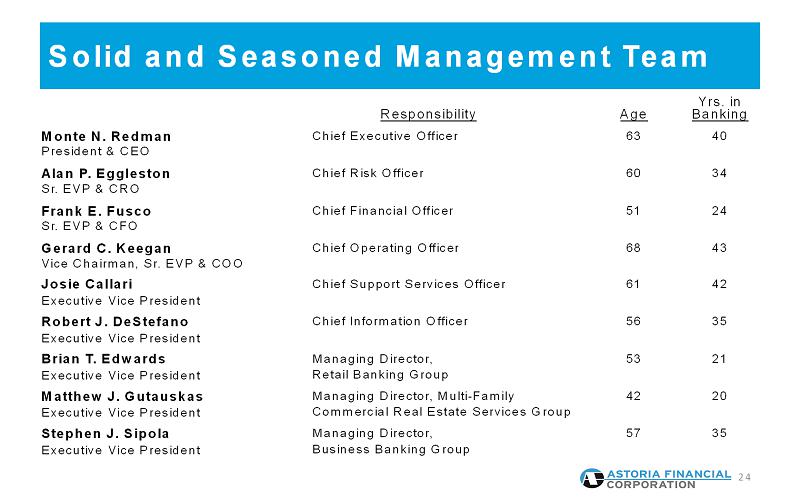
Solid and Seasoned Management Team 24 Responsibility Age Yrs. in Banking Monte N. Redman President & CEO Chief Executive Officer 63 40 Alan P. Eggleston Sr. EVP & CRO Chief Risk Officer 60 34 Frank E. Fusco Sr. EVP & CFO Chief Financial Officer 51 24 Gerard C. Keegan Vice Chairman, Sr. EVP & COO Chief Operating Officer 68 43 Josie Callari Executive Vice President Chief Support Services Officer 61 42 Robert J. DeStefano Executive Vice President Chief Information Officer 56 35 Brian T. Edwards Executive Vice President Managing Director, Retail Banking Group 53 21 Matthew J. Gutauskas Executive Vice President Managing Director, Multi-Family Commercial Real Estate Services Group 42 20 Stephen J. Sipola Executive Vice President Managing Director, Business Banking Group 57 35

Asset and Liability Repricing » CDs were either issued or repricedduring June 2014 with a weighted average rate of 0.37% » CDs scheduled to mature: 3Q14: $0.4 billion with a weighted average rate of 0.61% 4Q14: $0.3 billion with a weighted average rate of 1.22% » Borrowings scheduled to mature: 3Q14: $1.2 billion with a weighted average rate of 0.37% » Residential hybrid ARMs scheduled to reset into 1 year ARMs: 3Q14: $0.9 billion with a weighted average rate of 3.42% 4Q14: $0.8 billion with a weighted average rate of 3.46% 25 Expect full year 2014 net interest margin to be higher than the 2013 full year margin.
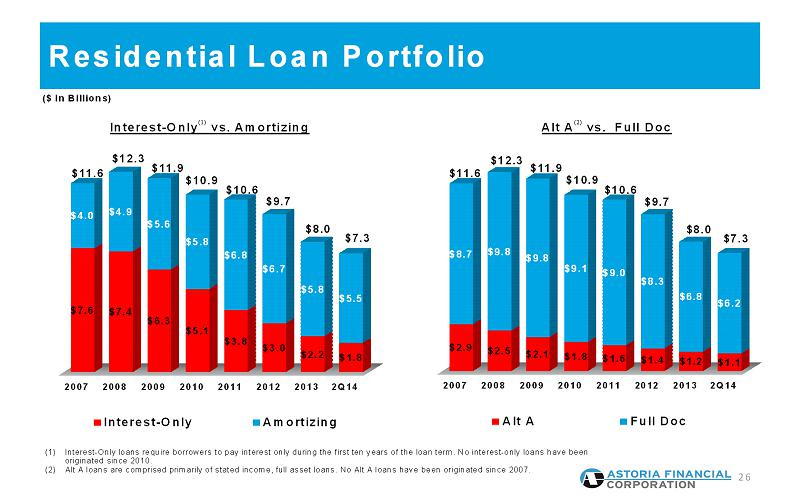
Residential Loan Portfolio 26 2007 2008 2009 2010 2011 2012 2013 2Q14 $7.6 $7.4 $6.3 $5.1 $3.8 $3.0 $2.2 $1.8 $4.0 $4.9 $5.6 $5.8 $6.8 $6.7 $5.8 $5.5 $11.6 $12.3 $11.9 $10.9 $10.6 $9.7 $8.0 $7.3 Interest-Only Amortizing 2007 2008 2009 2010 2011 2012 2013 2Q14 $2.9 $2.5 $2.1 $1.8 $1.6 $1.4 $1.2 $1.1 $8.7 $9.8 $9.8 $9.1 $9.0 $8.3 $6.8 $6.2 $11.6 $12.3 $11.9 $10.9 $10.6 $9.7 $8.0 $7.3 Alt A Full Doc Interest-Only (1) vs. Amortizing Alt A (2) vs. Full Doc ($ in Billions) (1) Interest-Only loans require borrowers to pay interest only during the first ten years of the loan term. No interest-only loans have been originated since 2010. (2) Alt A loans are comprised primarily of stated income, full asset loans. No Alt A loans have been originated since 2007.

Geographic Composition of Residential Loan Originations 27 (1) Includes $22.8 million originated for sale. (2) Includes $41.0 million originated for sale. (3) Loans originated for portfolio. For the three months ended June 30, 2014 New York 43% California 5% Maryland 6% Connecticut 7% Washington 8% Massachusetts 8% Virginia 11% Other < 5% 12% Total Residential Loan Originations $106.1 Million (1) Weighted Average LTV: 71% (3) Total Residential Loan Originations $222.5 Million (2) Weighted Average LTV: 70% (3) New York 44% California 5% Maryland 6% Washington 6% Massachusetts 9% Virginia 11% Other < 5% 19% For the six months ended June 30, 2014
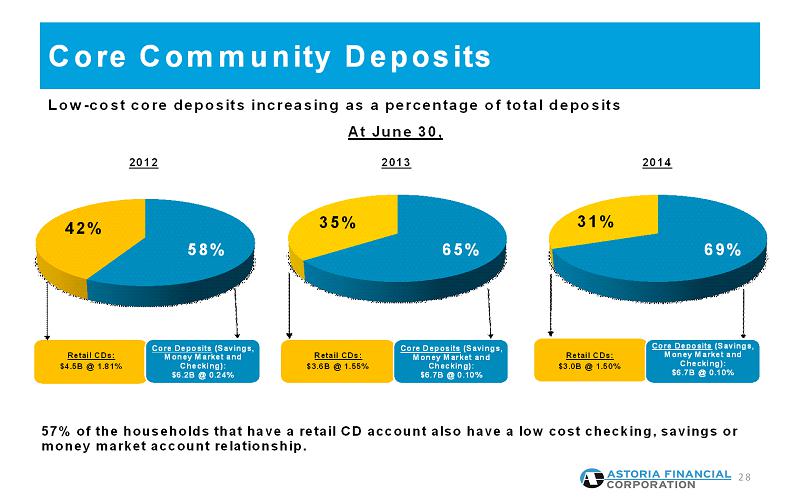
58% 42% 65% 35% 69% 31% Retail CDs: $3.0B @ 1.50% Core Community Deposits 28 Core Deposits(Savings, Money Market and Checking): $6.7B @ 0.10% 2013 57% of the households that have a retail CD account also have a low cost checking, savings or money market account relationship. 2014 Low-cost core deposits increasing as a percentage of total deposits Retail CDs: $3.6B @ 1.55% 2012 Retail CDs: $4.5B @ 1.81% Core Deposits(Savings, Money Market and Checking): $6.2B @ 0.24% Core Deposits(Savings, Money Market and Checking): $6.7B @ 0.10% AtJune 30,

Sales –PEAK Process » A “needs” based approach to sales rather than “product” based approach » Highly interactive program –daily and weekly meetings create a focus that is shared throughout the branch network » Incentives for strong performance, both individual and team 29 Performance based on Enthusiasm, Actions and Knowledge “Sales Oriented and Service Obsessed”
Customer Satisfaction » 77% of Astoria customers are highly satisfied » 74% of Astoria customers are highly likely to recommend Astoria to friend/family member » Satisfaction with the branch is by far the strongest driver of overall satisfaction – 87% of Astoria customers are highly satisfied with quality of branch service 30 Key Findings: Favorably Positioned Against Competitors Results are based on a 2014 Customer Satisfaction Survey.

Community Involvement » Education First Supports lifelong learning, promotes savings and provides meaningful financial solutions to improve the way our customers live and the neighborhoods we serve » Neighborhood Outreach Through funding and volunteer efforts, supports over 700 community- based organizations and not-for-profit agencies that enrich the communities within our market area Reinforces community involvement by promoting neighborhood news and events in our local community branches » Results/Recognition Seven consecutive “Outstanding” Community Reinvestment Act ratings by our primary banking regulator 31 Key Initiatives Astoria Bank is an integral part of the fabric of the communities it serves
Contact Information 32 Web Site: www.astoriabank.com Email: ir@astoriabank.com Telephone: (516) 327-7869 Address: Astoria Financial Corporation Attn: Investor Relations One Astoria Bank Plaza Lake Success, NY 11042