Attached files
| file | filename |
|---|---|
| 8-K - EXELIS INC. 8-K - Exelis Inc. | a50916899.htm |
| EX-99.1 - EXHIBIT 99.1 - Exelis Inc. | a50916899ex99_1.htm |
Exhibit 99.2
Second Quarter 2014Earnings Presentation David Melcher Chief Executive Officer and President Peter Milligan Senior Vice President and Chief Financial Officer August 1, 2014
Safe Harbor Statement Safe Harbor Statement under the Private Securities Litigation Reform Act of 1995 (the “Act”): Some of the information included herein includes forward-looking statements intended to qualify for the safe harbor from liability established by the Act. Whenever used, words such as “anticipate,” “estimate,” “expect,” “project,” “intend,” “plan,” “believe,” “target,” “may,” “could,” “outlook” and other terms of similar meaning are intended to identify such forward-looking statements. Forward-looking statements are uncertain and to some extent unpredictable, and involve known and unknown risks, uncertainties and other important factors that could cause actual results to differ materially from those expressed in, or implied from, such forward-looking statements. The company undertakes no obligation to update any forward-looking statements, whether as a result of new information, future events or otherwise, except as required bylaw. In addition, forward-looking statements are subject to certain risks and uncertainties that could cause actual results to differ materially from the company’s historical experience and our present expectations or projections. These risks and uncertainties include, but are not limited to: The forward-looking statements in this presentation are made as of the date hereof and the company undertakes no obligation to update any forward-looking statements, whether as a result of new information, future events or otherwise. In addition, forward-looking statements are subject to certain risks and uncertainties that could cause actual results to differ materially from the company’s historical experience and our present expectations or projections. These risks and uncertainties include, but are not limited to, those described in the Exelis Inc. Form 10-K for the fiscal year ended December 31, 2013, and those described from time to time in our future reports filed with the Securities and Exchange Commission. The timing and completion of the tax-free spin-off described in this presentation; Our dependence on the defense industry and the business risks peculiar to that industry, including changing priorities or reductions in the U.S. Government or international defense budgets; Government regulations and compliance therewith, including changes to the Department of Defense procurement process; Our international operations, including sales to foreign customers; Competition, industry capacity and production rates; Misconduct of our employees, subcontractors, agents and business partners; The level of returns on postretirement benefit plan assets and potential employee benefit plan contributions and other employment and pension matters; Changes in interest rates and other factors that affect earnings and cash flows; The mix of our contracts and programs, our performance, and our ability to control costs; Governmental investigations; Our level of indebtedness and our ability to make payments on or service our indebtedness; Subcontractor performance; Economic and capital markets conditions; The availability and pricing of raw materials and components; Ability to retain and recruit qualified personnel; Protection of intellectual property rights; Changes in technology; Contingencies related to actual or alleged environmental contamination, claims and concerns; Security breaches and other disruptions to our information technology and operations; Unanticipated changes in our tax provisions or exposure to additional income tax liabilities; and Ability to execute our internal performance plans including restructuring, productivity improvements and cost reduction initiatives.
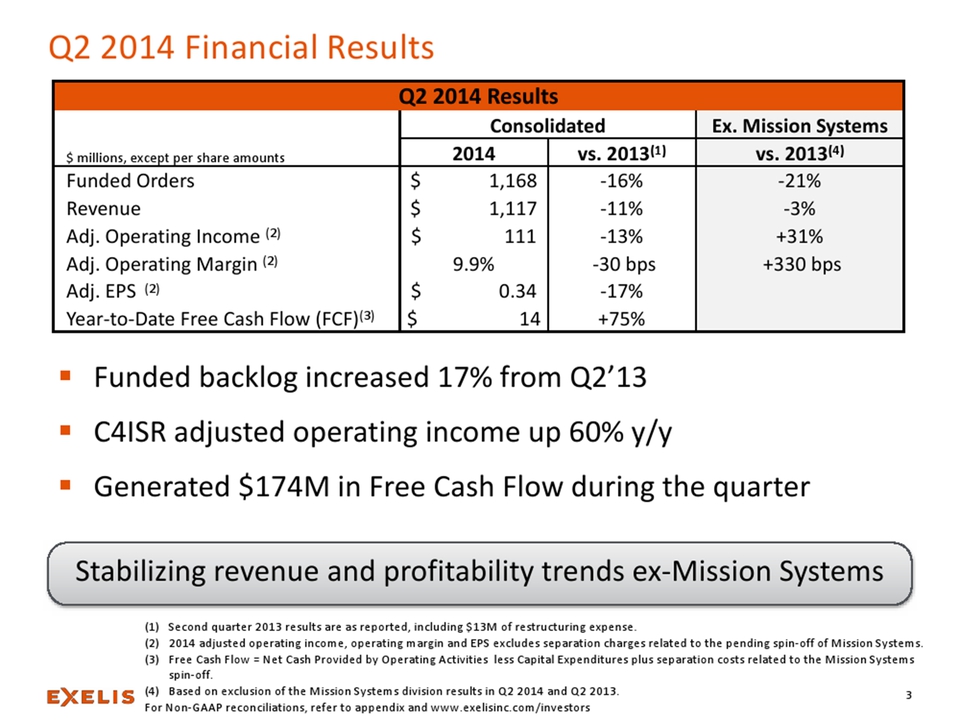
Q2 2014 Financial Results Q2 2014 Results Consolidated Ex. Mission Systems $ millions, except per share amounts 2014 vs. 2013(1)vs. 2013(4)Funded Orders$ 1,168 -16%-21%Revenue$ 1,117-11%-3%Adj.Operating Income (2) $ 111 -13% +31% Adj. Operating Margin (2) 9.9% -30 bps +330 bps Adj. EPS (2) $ 0.34 -17% Year-to-Date Free Cash Flow (FCF)(3)$ 14 +75% (1)Second quarter 2013 results are as reported, including $13M of restructuring expense. (2)2014 adjusted operating income, operating margin and EPS excludes separation charges related to the pending spin-off of Mission Systems.(3)Free Cash Flow = Net Cash Provided by Operating Activities less Capital Expenditures plus separation costs related to the Mission Systems spin-off. (4)Based on exclusion of the Mission Systems division results in Q2 2014 and Q2 2013.For Non-GAAP reconciliations, refer to appendix and www.exelisinc.com/investors Funded backlog increased 17% from Q2’13 C4ISR adjusted operating income up 60% y/y Generated $174M in Free Cash Flow during the quarter Stabilizing revenue and profitability trends ex-Mission Systems
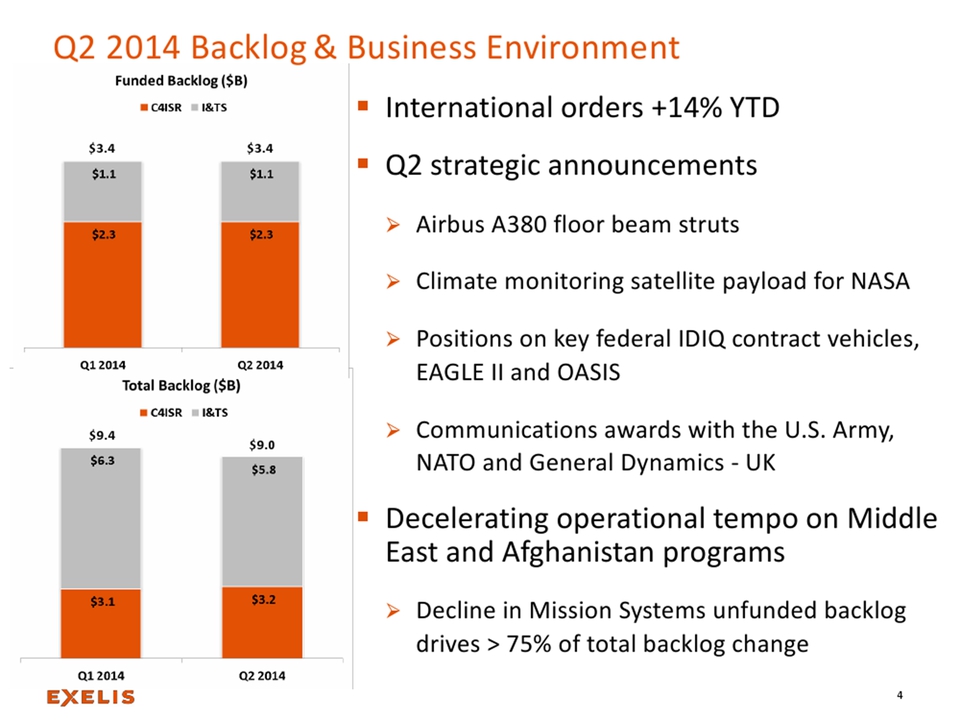
Q2 2014 Backlog & Business Environment International orders +14% YTD Q2 strategic announcements Airbus A380 floor beam struts Climate monitoring satellite payload for NASA Positions on key federal IDIQ contract vehicles, EAGLE II and OASIS Communications awards with the U.S. Army, NATO and General Dynamics –UK Decelerating operational tempo on Middle East and Afghanistan programs Decline in Mission Systems unfunded backlog drives > 75% of total backlog change $3.4 $9.0 $9.4 $3.4 $1.1 $2.3 $6.3 $3.1 $5.8 $3.2 C4ISR I&TS
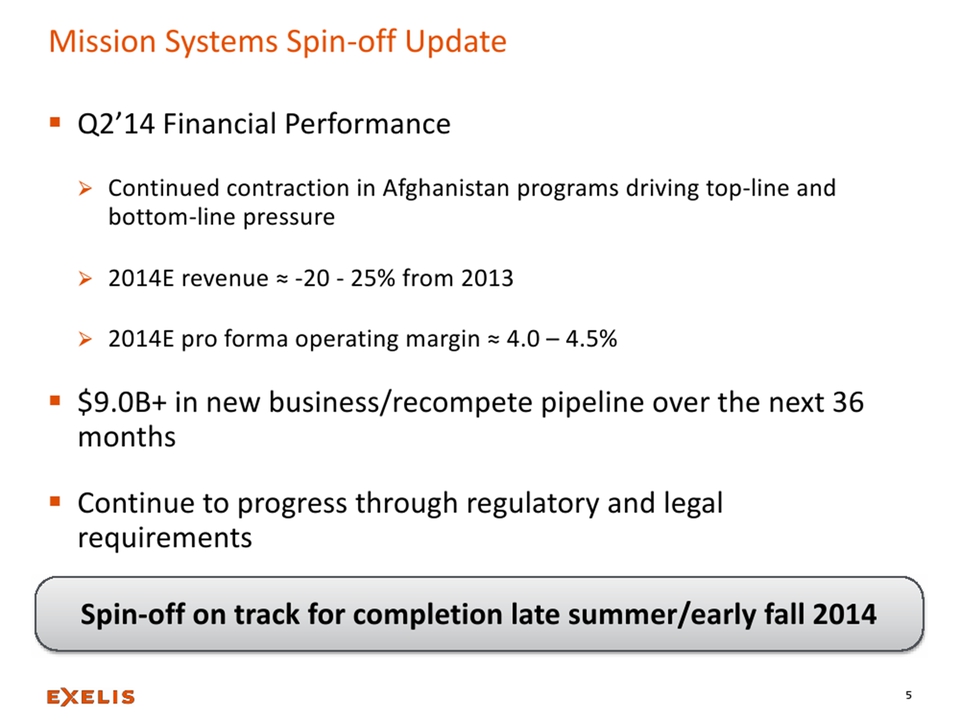
Mission Systems Spin-off Update Q2’14 Financial Performance Continued contraction in Afghanistan programs driving top-line and bottom-line pressure2014E revenue ≈ -20 -25% from 2013 2014E pro forma operating margin ≈ 4.0 –4.5% $9.0B+ in new business/recompete pipeline over the next 36 months Continue to progress through regulatory and legal requirements Spin-off on track for completion late summer/early fall 2014
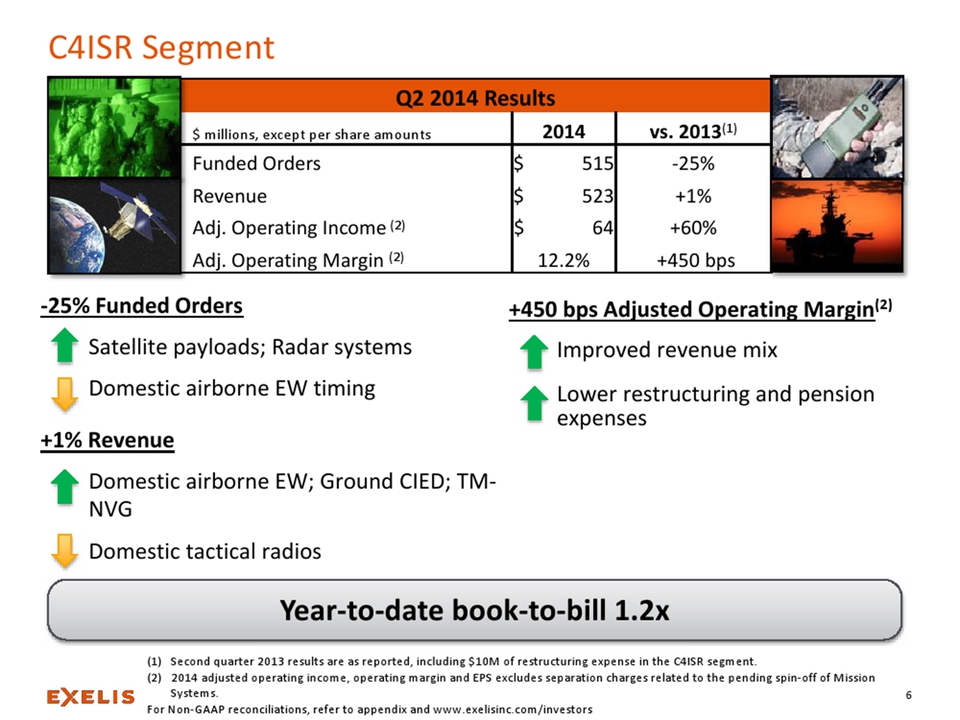
+450 bps Adjusted Operating Margin (2) Improved revenue mix Lower restructuring and pension expenses -25% Funded Orders Satellite payloads; Radar systems Domestic airborne EW timing +1% Revenue Domestic airborne EW; Ground CIED; TM-NVG Domestic tactical radios C4ISR Segment (1) Second quarter 2013 results are as reported, including $10M of restructuring expense in the C4ISR segment. (2) 2014 adjusted operating income, operating margin and EPS excludes separation charges related to the pending spin-off of Mission Systems. For Non-GAAP reconciliations, refer to appendix and www.exelisinc.com/investors Q2 2014 Results $ millions, except per share amounts 2014vs. 2013 (1) Funded Orders $ 515 -25% Revenue $ 523 +1% Adj. Operating Income (2) $ 64 +60% Adj.Operating Margin (2) 12.2% +450 bps Year-to-date book-to-bill 1.2x
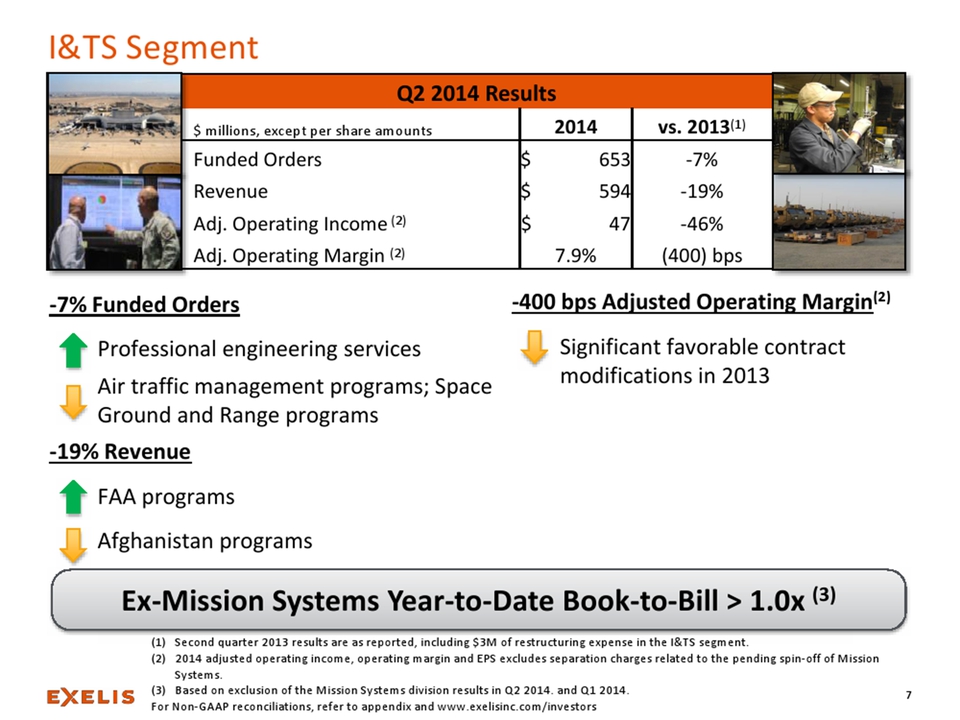
-400 bps Adjusted Operating Margin (2)Significant favorable contract modifications in 2013 -7% Funded Orders Professional engineering services Air traffic management programs; Space Ground and Range programs -19% Revenue FAA programs Afghanistan programs I&TS Segment (1) Second quarter 2013 results are as reported, including $3M of restructuring expense in the I&TS segment. (2) 2014 adjusted operating income, operating margin and EPS excludes separation charges related to the pending spin-off of Mission Systems. (3) Based on exclusion of the Mission Systems division results in Q2 2014. and Q1 2014.For Non-GAAP reconciliations, refer to appendix and www.exelisinc.com/investors Q2 2014 Results $ millions, except per share amounts 2014vs. 2013 (1) Funded Orders $ 653 -7% Revenue $ 594 19% Adj. Operating Income(2) $ 47 -46% Adj. Operating Margin (2) 7.9% (400) bps Ex-Mission Systems Year-to-Date Book-to-Bill > 1.0x (3)
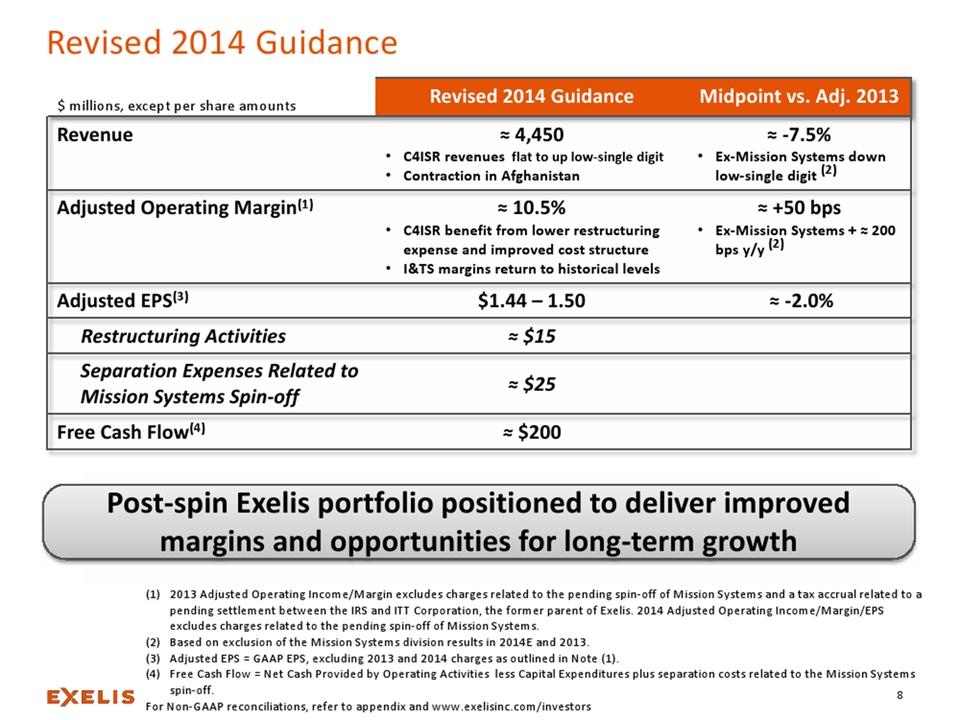
Revised 2014 Guidance Revised 2014 Guidance Midpoint vs. Adj. 2013 Revenue ≈ 4,450 C4ISR revenues flat to up low-single digit Contraction in Afghanistan ≈ -7.5% Ex-Mission Systems down low-single digit (2) Adjusted Operating Margin (1) ≈ 10.5% C4ISR benefit from lower restructuring expense and improved cost structure I&TS margins return to historical levels ≈ +50 bps Ex-Mission Systems + ≈ 200 bps y/y (2) Adjusted EPS (3) $1.44 –1.50 ≈ -2.0% Restructuring Activities ≈ $15 Separation Expenses Related to Mission Systems Spin-off ≈ $25 Free Cash Flow (4) ≈ $200 $ millions, except per share amounts (1) 2013 Adjusted Operating Income/Margin excludes charges related to the pending spin-off of Mission Systems and a tax accrual related to a pending settlement between the IRS and ITT Corporation, the former parent of Exelis. 2014 Adjusted Operating Income/Margin/EPS excludes charges related to the pending spin-off of Mission Systems. (2) Based on exclusion of the Mission Systems division results in 2014E and 2013. (3) Adjusted EPS = GAAP EPS, excluding 2013 and 2014 charges as outlined in Note (1). (4) Free Cash Flow = Net Cash Provided by Operating Activities less Capital Expenditures plus separation costs related to the Mission Systems spin-off. For Non-GAAP reconciliations, refer to appendix and www.exelisinc.com/investors Post-spin Exelis portfolio positioned to deliver improved margins and opportunities for long-term growth

Appendix
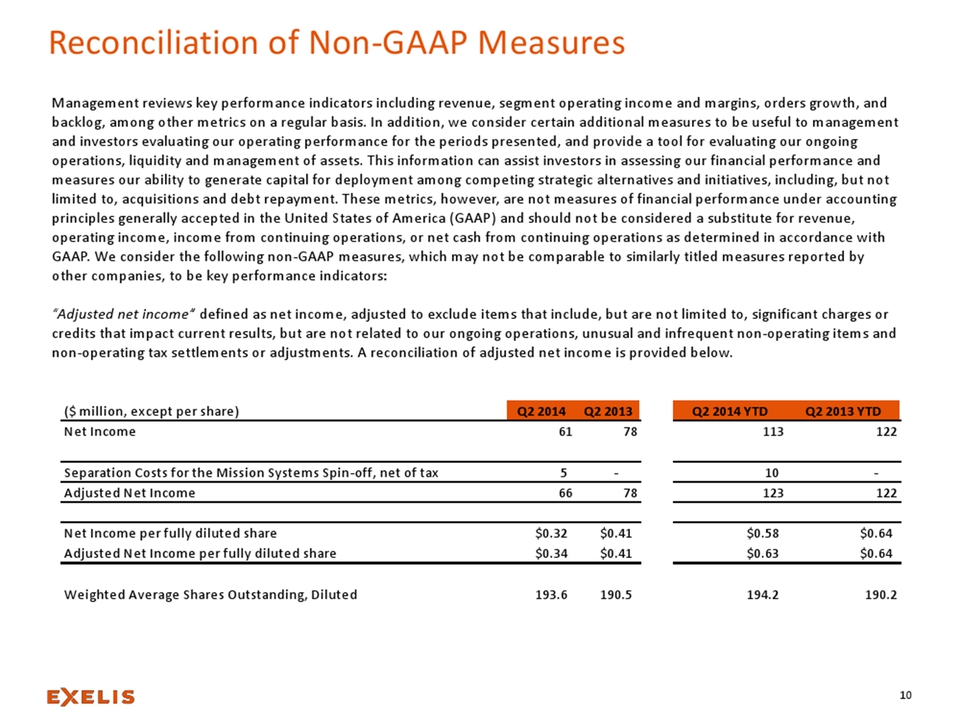
Reconciliation of Non-GAAP Measures Management reviews key performance indicators including revenue, segment operating income and margins, orders growth, and backlog, among other metrics on a regular basis. In addition, we consider certain additional measures to be useful to management and investors evaluating our operating performance for the periods presented, and provide a tool for evaluating our ongoing operations, liquidity and management of assets. This information can assist investors in assessing our financial performance and measures our ability to generate capital for deployment among competing strategic alternatives and initiatives, including, but not limited to, acquisitions and debt repayment. These metrics, however, are not measures of financial performance under accounting principles generally accepted in the United States of America (GAAP) and should not be considered a substitute for revenue, operating income, income from continuing operations, or net cash from continuing operations as determined in accordance with GAAP. We consider the following non-GAAP measures, which may not be comparable to similarly titled measures reported by other companies, to be key performance indicators: “Adjusted net income” defined as net income, adjusted to exclude items that include, but are not limited to, significant charges or credits that impact current results, but are not related to our ongoing operations, unusual and infrequent non-operating items and non-operating tax settlements or adjustments. A reconciliation of adjusted net income is provided below. ($ million, except per share)Q2 2014Q2 2013Q2 2014 YTDQ2 2013 YTD Net Income 61 78 113 122 Separation Costs for the Mission Systems Spin-off, net of tax 5 - 10 - Adjusted Net Income 66 78 123 122 Net Income per fully diluted share $0.32 $0.41 $0.58 $0.64 Adjusted Net Income per fully diluted share $0.34 $0.41 $0.63 $0.64 Weighted Average Shares Outstanding, Diluted 193.6 190.5 194.2 190.2
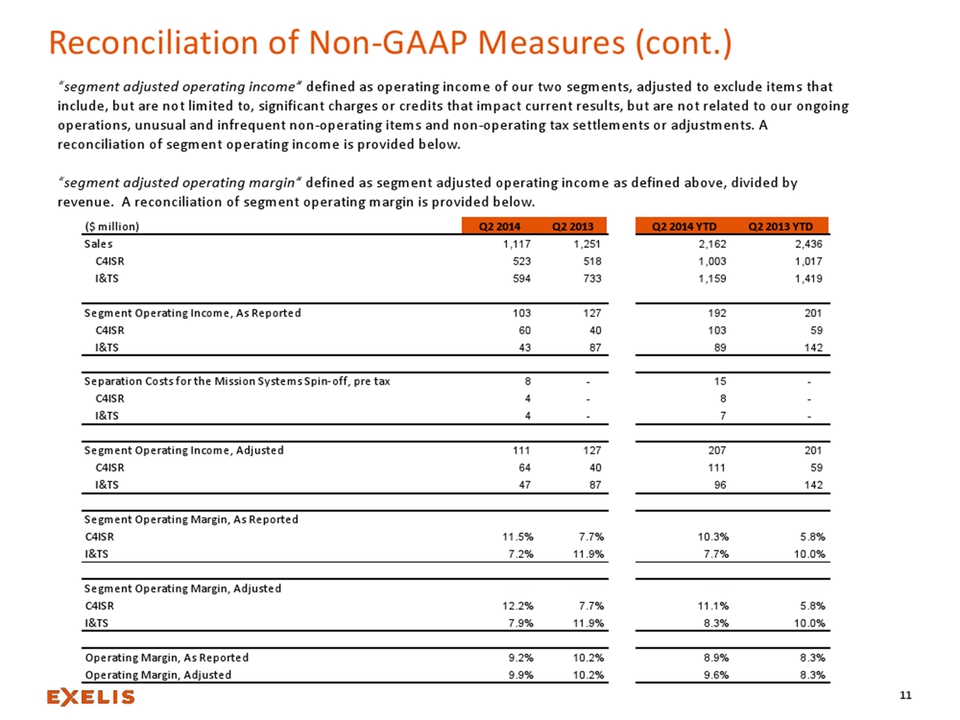
Reconciliation of Non-GAAP Measures (cont.) “segment adjusted operating income” defined as operating income of our two segments, adjusted to exclude items that include, but are not limited to, significant charges or credits that impact current results, but are not related to our ongoing operations, unusual and infrequent non-operating items and non-operating tax settlements or adjustments. A reconciliation of segment operating income is provided below. “segment adjusted operating margin” defined as segment adjusted operating income as defined above, divided by revenue. A reconciliation of segment operating margin is provided below.($ million)Q2 2014Q2 2013Q2 2014 YTDQ2 2013 YTD Sales 1,117 1,251 2,162 2,436 C4ISR 523 518 1,003 1,017 I&TS 594 733 1,159 1,419 Segment Operating Income, As Reported 103 127 192 201 C4ISR 60 40 103 59 I&TS 43 87 89 142 Separation Costs for the Mission Systems Spin-off, pre tax8 - 15 - C4ISR 4 - 8 - I&TS 4 - 7 - Segment Operating Income, Adjusted 111 127 207 201 C4ISR 64 40 111 59 I&TS 47 87 96 142 Segment Operating Margin, As Reported C4ISR 11.5 %7.7 %10.3 %5.8 % I&TS 7.2% 11.9% 7.7% 10.0% Segment Operating Margin, Adjusted 9.9% 10.2% 9.6% 8.3% C4ISR 12.2% 7.7% 11.1% 5.8% I&TS 7.9% 11.9% 8.3% 10.0% Operating Margin, As Reported 9.2% 10.2% 8.9% 8.3% Operating Margin, Adjusted 9.9% 10.2% 9.6% 8.3%
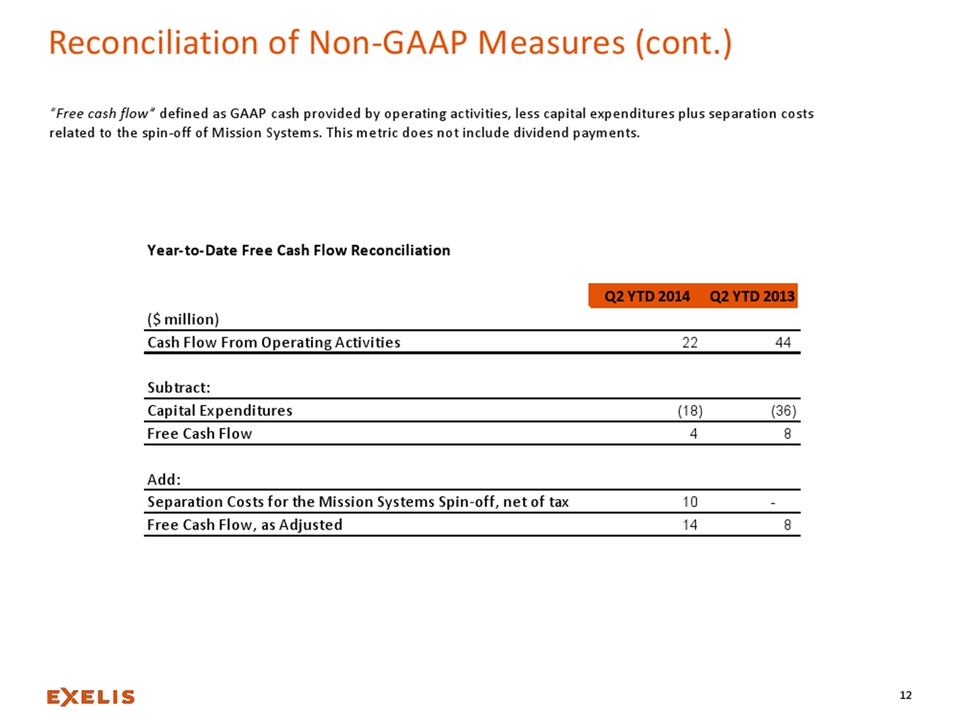
Reconciliation of Non-GAAP Measures (cont.) “Free cash flow” defined as GAAP cash provided by operating activities, less capital expenditures plus separation costs related to the spin-off of Mission Systems. This metric does not include dividend payments. Year-to-Date Free Cash Flow Reconciliation Q2 YTD 2014 Q2 YTD 2013 ($ million) Cash Flow From Operating Activities 22 44 Subtract: Capital Expenditures (18) (36) Free Cash Flow 4 8 Add: Separation Costs for the Mission Systems Spin-off, net of tax10 - Free Cash Flow, as Adjusted 14 8
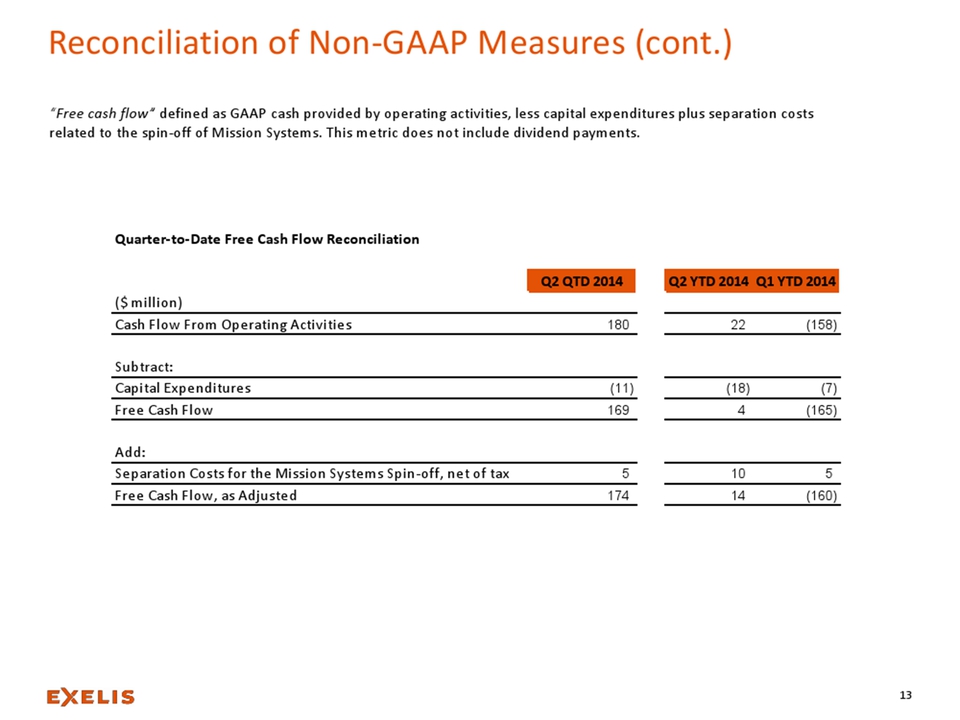
Reconciliation of Non-GAAP Measures (cont.) “Free cash flow” defined as GAAP cash provided by operating activities, less capital expenditures plus separation costs related to the spin-off of Mission Systems. This metric does not include dividend payments. Quarter-to-Date Free Cash Flow Reconciliation Q2 QTD 2014 Q2 YTD 2014 Q1 YTD 2014 ($ million) Cash Flow From Operating Activities 180 22 (158) Subtract: Capital Expenditures (11) (18) (7) Free Cash Flow169 4 (165) Add: Separation Costs for the Mission Systems Spin-off, net of tax 5 10 5 Free Cash Flow, as Adjusted 174 14 (160)