Attached files
| file | filename |
|---|---|
| 8-K - 8-K - PINNACLE WEST CAPITAL CORP | a14-17952_18k.htm |
| EX-99.2 - EX-99.2 - PINNACLE WEST CAPITAL CORP | a14-17952_1ex99d2.htm |
| EX-99.1 - EX-99.1 - PINNACLE WEST CAPITAL CORP | a14-17952_1ex99d1.htm |
Exhibit 99.3
|
|
SECOND QUARTER 2014 RESULTS July 31, 2014 |
|
|
FORWARD LOOKING STATEMENTS AND NON-GAAP FINANCIAL MEASURES This presentation contains forward-looking statements based on current expectations, including statements regarding our earnings guidance and financial outlook and goals. These forward-looking statements are often identified by words such as “estimate,” “predict,” “may,” “believe,” “plan,” “expect,” “require,” “intend,” “assume” and similar words. Because actual results may differ materially from expectations, we caution you not to place undue reliance on these statements. A number of factors could cause future results to differ materially from historical results, or from outcomes currently expected or sought by Pinnacle West or APS. These factors include, but are not limited to: our ability to manage capital expenditures and operations and maintenance costs while maintaining reliability and customer service levels; variations in demand for electricity, including those due to weather, the general economy, customer and sales growth (or decline), and the effects of energy conservation measures and distributed generation; power plant and transmission system performance and outages; competition in retail and wholesale power markets; regulatory and judicial decisions, developments and proceedings; new legislation or regulation, including those relating to environmental requirements, nuclear plant operations and potential deregulation of retail electric markets; fuel and water supply availability; our ability to achieve timely and adequate rate recovery of our costs, including returns on debt and equity capital; our ability to meet renewable energy and energy efficiency mandates and recover related costs; risks inherent in the operation of nuclear facilities, including spent fuel disposal uncertainty; current and future economic conditions in Arizona, particularly in real estate markets; the cost of debt and equity capital and the ability to access capital markets when required; environmental and other concerns surrounding coal-fired generation; volatile fuel and purchased power costs; the investment performance of the assets of our nuclear decommissioning trust, pension, and other postretirement benefit plans and the resulting impact on future funding requirements; the liquidity of wholesale power markets and the use of derivative contracts in our business; potential shortfalls in insurance coverage; new accounting requirements or new interpretations of existing requirements; generation, transmission and distribution facility and system conditions and operating costs; the ability to meet the anticipated future need for additional baseload generation and associated transmission facilities in our region; the willingness or ability of our counterparties, power plant participants and power plant land owners to meet contractual or other obligations or extend the rights for continued power plant operations; technological developments affecting the electric industry; and restrictions on dividends or other provisions in our credit agreements and ACC orders. These and other factors are discussed in Risk Factors described in Part I, Item 1A of the Pinnacle West/APS Annual Report on Form 10-K for the fiscal year ended December 31, 2013 and in Part II, Item 1A of the Pinnacle West/APS Quarterly Report on Form 10-Q for the quarter ended June 30, 2014, which you should review carefully before placing any reliance on our financial statements, disclosures or earnings outlook. Neither Pinnacle West nor APS assumes any obligation to update these statements, even if our internal estimates change, except as required by law. In this presentation, references to net income and earnings per share (EPS) refer to amounts attributable to common shareholders. We present “gross margin” per diluted share of common stock. Gross margin refers to operating revenues less fuel and purchased power expenses. Gross margin is a “non-GAAP financial measure,” as defined in accordance with SEC rules. The appendix contains a reconciliation of this non-GAAP financial measure to the referenced revenue and expense line items on our Consolidated Statements of Income, which are the most directly comparable financial measures calculated and presented in accordance with generally accepted accounting principles in the United States of America (GAAP). We view gross margin as an important performance measure of the core profitability of our operations. We refer to “on-going earnings” in this presentation, which is also a non-GAAP financial measure. We believe on-going earnings provide investors with a useful indicator of our results that is comparable among periods because it excludes the effects of unusual items that may occur on an irregular basis. Investors should note that these non-GAAP financial measures may involve judgments by management, including whether an item is classified as an unusual item. These measures are key components of our internal financial reporting and are used by our management in analyzing the operations of our business. We believe that investors benefit from having access to the same financial measures that management uses. |
|
|
Regulatory Update Operational Excellence CEO AGENDA |
|
|
2nd Quarter 2014 Results Arizona Economic Outlook Financial Outlook CFO AGENDA |
|
|
CONSOLIDATED EPS COMPARISON 2014 VS. 2013 2nd Quarter GAAP Net Income $1.19 $1.18 2nd Quarter On-Going Earnings Year-to-Date GAAP Net Income $1.34 $1.40 Year-to-Date On-Going Earnings |
|
|
D&A $(0.01) Gross Margin(1) $(0.06) = Net Increase $0.01 ON-GOING EPS VARIANCES 2ND QUARTER 2014 VS. 2ND QUARTER 2013 Excludes costs, and offsetting operating revenues, associated with renewable energy (excluding AZ Sun), demand side management and similar regulatory programs. Note: Drivers adjusted for the deferral impacts of the Four Corners transaction. See non-GAAP reconciliation in appendix. O&M(1) $0.03 Other Taxes $(0.01) |
|
|
GROSS MARGIN EPS DRIVERS 2ND QUARTER 2014 VS. 2ND QUARTER 2013 Lost Fixed Cost Recovery Mechanism $0.02 Other, Net (incl AZ Sun) $0.01 Retail kWh Sales $(0.04) Retail Transmission Revenue $(0.02) = Net Decrease $(0.06) Weather $(0.03) See non-GAAP reconciliation for gross margin in appendix. |
|
|
ARIZONA ECONOMIC INDICATORS Nonresidential Building Vacancy – Metro Phoenix Single Family & Multifamily Housing Permits Maricopa County Home Prices – Metro Phoenix Value Relative to Jan ‘05 Vacancy Rate Office Retail Job Growth (Total Nonfarm) - Arizona YoY Change E Q2 Q2 Apr |
|
|
ARIZONA ECONOMY – HOMEBUILDERS AGREE PHOENIX HAS SOLID LONG-TERM OUTLOOK “I am bullish on Phoenix over the long termI believe that going into 2015 we're going to experience a more normal market in Arizona after things get more in balance.” “We remain confident in the long-term growth of the opportunities in Arizona.” “Phoenix is a great place to live, and we're going to see growth there going forward.” “Overall, we remain positive on the Phoenix market and continue to believe it possesses strong market fundamentals.” |
|
|
FINANCING ($Millions) Debt Maturity Schedule 2014 Major Financing Activities $250 million 30-year 4.70% APS senior unsecured notes issued in January 2014 with proceeds used primarily to fund acquisition of Four Corners $250 million 10-year 3.35% APS senior unsecured notes issued June 2014 with proceeds used with other funds to pay the $300 million maturity on June 30, 2014 Currently expect up to $350 million additional long-term debt issuance in Q4 2014 In addition, there will be several tax-exempt series remarketed or refinanced 2015 Major Financing Activities Currently expect about $300 million of new long-term debt in 2015, in addition to refinancing maturing debt |

|
|
2014 ON-GOING EPS GUIDANCE Key Factors & Assumptions as of July 31, 2014 2014 Electricity gross margin* (operating revenues, net of fuel and purchased power expenses) $2.22 – $2.27 billion Retail customer growth about 2% Weather-normalized retail electricity sales volume about +0.5% to prior year taking into account effects of customer conservation, energy efficiency and distributed renewable generation initiatives Actual weather through June; normal weather patterns remainder of the year Operating and maintenance* $790 – $810 million Other operating expenses (depreciation and amortization, Four Corners deferrals, and taxes other than income taxes) $595 - $615 million Interest expense, net of allowance for borrowed and equity funds used during construction $160 - $170 million Net income attributable to non-controlling interests ~$35 million Effective tax rate 34% Average diluted common shares outstanding ~111.0 million On-Going EPS Guidance $3.60 - $3.75 * Excludes O&M of $99 million, and offsetting revenues, associated with renewable energy and demand side management programs. |
|
|
APPENDIX |
|
|
2014 KEY DATES Docket # Q1 Q2 Q3 Q4 Key Regulatory Filings Lost Fixed Cost Recovery 11-0224 Jan 15 Transmission Cost Adjustor May 15 Renewable Energy Surcharge Jul 1 10-Year Transmission Plan (Annual) 13-0002 Jan 31 2014 Integrated Resource Plan (Biennial) 13-0070 Apr 1 Net Metering (Decision No. 74202) 13-0248 Quarterly Installation Filings 13-0248 Apr 15 Jul 15 Oct 15 Value and Cost of Distributed Generation 14-0023 May 7 Jun 20 TBD TBD Innovations and Technology Development Docket Workshops – Substantive (a), Response (b) 13-0375 Mar 20 (1a) Apr 25 (1b) May 28 (2a) Jun 25 (2b) Jul 28 (3a) Aug 18 (3b) Four Corners Rate Rider 11-0224 Testimony Jun – Jul; Hearings begin Aug ACC Open Meeting TBD Energy Efficiency workshops – (a) Cost effectiveness, (b) Cost recovery and (c) EE standards/rulemaking 13-0214 Mar 18 (a) Mar 31 (b) Apr 17 (c) ACC Open Meetings (Held Monthly) - Aug: Possible vote to remove requirement that APS file its next rate case in June 2015 Elections - May 28: Nominations Aug 26: Primary Nov 4: General Arizona State Legislature - In Session Jan 13 – Apr 24 (Adjourned) Annual Shareholder Meeting - May 21 |
|
|
KEY RATE DESIGN PRINCIPLES Smarter rates for smarter grid Arizona Public Service, Tucson Electric Power, Residential Utility Consumer Office and Arizona solar developers filed a joint letter with the ACC agreeing on the following rate design principles: Customer-focused Meaningful options Meet lifestyle needs Allow customers to choose among technologies Forward-thinking Maintain reliable service Enable technology innovation Put all technologies on a level playing field Affordable & Fair For all of our 1.2 million customers Transparent Accurately reflect services and products customers use Rate design changes needed to align fixed costs and revenue |

|
|
APS IS A LEADER IN SOLAR We are committed to making Arizona the solar capital of America 3rd of all U.S. utilities for solar energy installed in 2013 (410 MW) 4th for new solar installed in 2013 (368 watts/customer) 4th for overall solar capacity (740 MW) 5th for overall solar capacity per customer (654 watts/customer) APS 2013 Rankings * AZ Sun – Includes 32 MW Gila Bend project; excludes 20 MW of approved projects which are expected online in 2015; includes 4 MW of other APS owned solar * DG includes 15 MW of APS owned DG = Distributed Generation (PV only) PPA 310 MW aps solar portfolio Residential dg (mw)- Annual Additions |
|
|
Community-scale photovoltaic solar plants to be owned by APS Constructive rate recovery through RES until included in base rates 118 MW in commercial operation to date; 150 MW by end of 2014 Commitments to date: 170 MW; $690 million estimated capital investment AZ SUN PROGRAM Owning solar resources makes sense for our customers and the environment and provides earnings growth potential Name Location Capacity Developer Actual or Target COD* Paloma Gila Bend, AZ 17 MW First Solar September 2011 Cotton Center Gila Bend, AZ 17 MW Solon October 2011 Hyder Phase 1 Hyder, AZ 11 MW SunEdison October 2011 Hyder Phase 2 Hyder, AZ 5 MW SunEdison February 2012 Chino Valley Chino Valley, AZ 19 MW SunEdison November 2012 Yuma Foothills Phase 1 Yuma, AZ 17 MW AMEC June 2013 Yuma Foothills Phase 2 Yuma, AZ 18 MW AMEC December 2013 Hyder II Hyder, AZ 14 MW McCarthy December 2013 Gila Bend Gila Bend, AZ 32 MW Black & Veatch August 2014 City of Phoenix Buckeye, AZ 10 MW TBD Mid 2015 Luke Air Force Base Glendale, AZ 10 MW TBD Mid 2015 Total 170 MW As of June 30, 2014 * In-Service or Commercial Operation Date |
|
|
As of June 30, 2014, over 26,800 residential grid-tied solar photovoltaic (PV) systems have been installed in APS’s service territory Q2 2014 applications totaled approximately 2,000, in line with Q2 2013 APS anticipates that it will be in compliance with the Renewable Energy Standard (RES) residential DG requirements through mid-2017 and with RES non-residential through 2021 RESIDENTIAL PV APPLICATIONS Residential rooftop solar applications continue to trend higher in 2014 |

|
|
APS-OWNED ROOFTOP SOLAR PROPOSAL APS proposed an option to the ACC to convert 20 MW of AZ Sun into APS-owned residential rooftop solar, equates to approximately 3,000 customers Requesting ACC review within two months (September) to ensure compliance of renewable energy commitments by the end of 2015 Benefits: Provides an alternative for those who cannot afford solar or do not want a lease Participating customers receive monthly credit on their bill through the 20-year life Support and partner with Arizona solar installers TBD APS has track record through the Flagstaff Community Power Project Launched in 2010 1.5 MW of distributed energy from solar panels owned by APS, spread across: 125 residential rooftops Schools Neighborhood-scale solar power plant |
|
|
CAPITAL EXPENDITURES 80% of capital expenditures are recovered through rate adjustors (40%) and depreciation cash flow (40%) ($ Millions) $931 $1,026 2014 – 2016 as disclosed in Second Quarter 2014 Form 10-Q Distribution Transmission Renewable Generation Environmental Traditional Generation Projected $1,263 |
|
|
OCOTILLO POWER PLANT (TEMPE, AZ) Ocotillo modernization project will maintain valley grid reliability and increase APS’s generating capacity by 290 MW Maintains system reliability through retirement of aging steam units Replacement units meet need for increased portfolio responsiveness Aids integration of renewables Estimated project cost of $600M - $700M Expected timeline: Early 2014: Stakeholder engagement and initiate permitting activities Q3 2014: ACC Certificate of Environmental Compatibility application filing Fall 2014: ACC Siting Committee hearings 2016: Begin construction Q2 2018: Project completion Site Capacity (MW) Current Future (2) Westinghouse 110 MW steam units - constructed 1960 220 Retire (2) Westinghouse 55 MW combustion turbines - constructed 1972/73 110 110 Install (5) GE 102 MW combustion turbines 0 510 Total 330 620 Net site capacity increased by 290 MW |
|
|
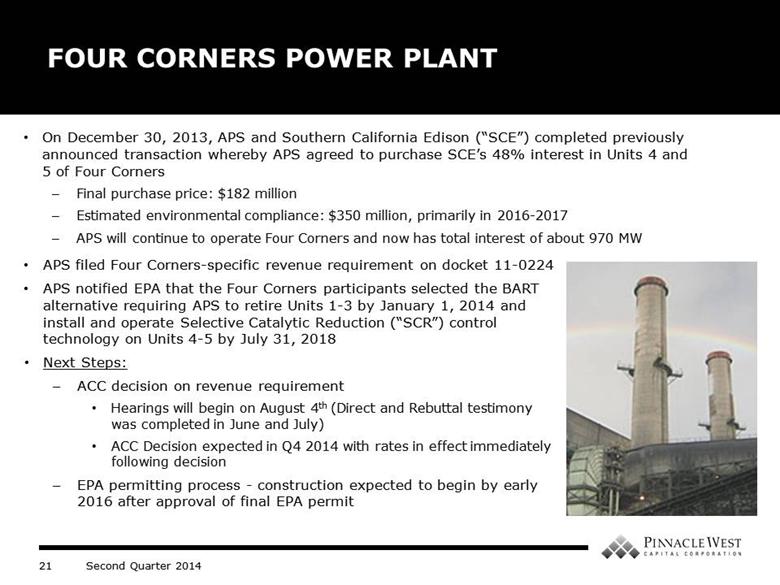
On December 30, 2013, APS and Southern California Edison (“SCE”) completed previously announced transaction whereby APS agreed to purchase SCE’s 48% interest in Units 4 and 5 of Four Corners Final purchase price: $182 million Estimated environmental compliance: $350 million, primarily in 2016-2017 APS will continue to operate Four Corners and now has total interest of about 970 MW FOUR CORNERS POWER PLANT APS filed Four Corners-specific revenue requirement on docket 11-0224 APS notified EPA that the Four Corners participants selected the BART alternative requiring APS to retire Units 1-3 by January 1, 2014 and install and operate Selective Catalytic Reduction (“SCR”) control technology on Units 4-5 by July 31, 2018 Next Steps: ACC decision on revenue requirement Hearings will begin on August 4th (Direct and Rebuttal testimony was completed in June and July) ACC Decision expected in Q4 2014 with rates in effect immediately following decision EPA permitting process - construction expected to begin by early 2016 after approval of final EPA permit |
|
|
10-Year Transmission Plan filed January 2014 (115 kV and above) $496 million of transmission investment 275 miles of new lines Includes Hassayampa-North Gila (HANG2) ~110 miles; 500 kV Construction started March 2013 Estimated in-service mid 2015 Projects to deliver renewable energy approved by ACC Transmission investment diversifies regulatory risk Constructive regulatory treatment FERC formula rates and retail adjustor APS TRANSMISSION Strategic transmission investment is essential to maintain reliability and deliver diversified resources to customers Legend Planned lines Existing lines Proposed Delaney-Colorado River line (PNW) Solar potential area Wind potential area |

|
|
PNW TRANSMISSION BRIGHT CANYON ENERGY Pinnacle West subsidiary formed to pursue new growth opportunities JOINT VENTURE WITH MIDAMERICAN TRANSMISSION Bright Canyon formed a 50/50 JV with Mid-American Transmission to pursue transmission opportunities in the western United States DELANEY-COLORADO RIVER TRANSMISSION LINE New 500kV line between the planned Delaney substation near Palo Verde Generating Station in Arizona and the Colorado River substation, located just west of Blythe, California In July 2014, California ISO Board approved DCR, which initiates a competitive bidding process to begin in August 2014 with a winner selected by mid-2015 (project expected in service in 2020) |
|
|
CUSTOMER GROWTH Annual Growth Customer growth drives 85% of retail sales (excluding impacts of customer conservation, energy efficiency and distributed renewable generation initiatives) Retail customer growth to average about 2.5% annually 2014-2016 |
|
|
RETAIL SALES GROWTH (WEATHER-NORMALIZED) YoY Retail Sales Before Customer Programs Energy Efficiency & Customer Conservation Distributed Generation Weather-normalized retail sales growth about 1% for 2014-2016 after impacts of energy efficiency, customer conservation and distributed renewable generation initiatives (excluding Lost Fixed Cost Recovery) Distributed Generation (DG) Impact DG makes up 0.5% (or less) of the negative impact to retail sales growth as shown in the chart; equates to approximately 60 GWh out of our total retail sales of over 28,000 GWh Average residential rooftop solar system produces 10,000 – 12,000 KWh per year (average metro-Phoenix customer’s usage is nearly 15,000 KWh) |

|
|
FERC Formula Rates adopted in 2008 Adjusted annually with 10.75% allowed ROE Based on FERC Form 1 and projected closings Update filed each April Annual rate true-up compares projected revenue requirement to actual, with variance incorporated into next annual update Retail portion flows through ACC Transmission Cost Adjustor (TCA) REGULATORY MECHANISMS (TCA) We have achieved constructive transmission rate treatment with annual adjustments As Filed 2014 2013 2012 Annual Rate Increase Rate Effective Date Annual Rate Increase Rate Effective Date Annual Rate Increase Rate Effective Date Retail Portion (TCA) $5 M 6/1/2014 $21 M 6/1/2013 $18 M 8/1/2012 Wholesale Portion $1 M 6/1/2014 $5 M 6/1/2013 $(2) M 6/1/2012 Total Increase (Decrease) $6 M $26 M $16 M Equity Ratio 58% 57% 55% Rate Base (Year-End) $1.3 B $1.2 B $1.2 B Test Year 2013 2012 2011 |
|
|
6/1 Rate Goes Into Effect REGULATORY MECHANISMS (TCA) We have achieved constructive transmission rate treatment with annual adjustments 2013 2014 JAN FEB MAR APR MAY JUN JUL AUG SEP OCT NOV DEC JAN FEB MAR APR MAY JUN JUL AUG SEP OCT NOV DEC 6/1 Rate Goes Into Effect ~5/15 File/Post FERC Rate ~4/15 File FERC Form 1 ~5/15 File/Post FERC Rate ~4/15 File FERC Form 1 New accounting treatment began July 1, 2012, effective with 2012 Settlement Agreement Quarterly true-ups can occur throughout the year (2013 included adjustments of 2012 revenue) Although transmission rate base is growing, 2014 transmission revenue is in line with 2013 because of the 2012 true-ups in 2013, and the large capex projects (e.g. HANG2) that are in progress, but do not come online until 2015 or later 2013 Revenue 2013 Rates (Including True-Up) 2014 Rates (Including True-Up) 2014 Revenue Quarterly True-Ups Quarterly True-Ups |
|
|
OPERATIONS & MAINTENANCE Our goal is to keep consolidated O&M growth at or below retail sales growth levels Note: Pinnacle West O&M for 2009-2014E: $10M, $9M, $8M, $11M, $27M and $15M, respectively. * 2013 includes $9M related to the closure of Four Corners Units 1, 2 and 3 deferred for regulatory recovery in depreciation. **Renewable energy and demand side management expenses are offset by revenue adjustors. $790 - $810 ($ Millions) $788* |
|
|
CONSOLIDATED FINANCIAL OUTLOOK Earned ROE Dividend Growth Goal Indicated Annual Dividend Rate at Year-End 11% PNW 9.9% Consolidated 10% goal to earn at least 9.5% annually 9% $2.27 $2.18 8% $2.10 7% 6% 2008 2009 2010 2011 2012 2013 2014 2015 Goal APS PNW* 2011 2012 2013 2014 2015 Projected * Continuing operations Future dividends subject to declaration 29 Second Quarter 2014 |

|
|
GROSS MARGIN EFFECTS OF WEATHER VARIANCES VS. NORMAL Pretax Millions $9 Million, as previously reported $11 Million, adjusted for current normals $(7) Million 11 As Previously Reported Adjusted for current 10-year Rolling Average (2003-2012) |
|
|
RENEWABLE ENERGY AND DEMAND SIDE MANAGEMENT EXPENSES* * O&M expenses related to renewable energy, demand side management and similar regulatory programs are offset by comparable revenue amounts. Pretax Millions $124 Million $137 Million $48 Million |
|
|
NON-GAAP MEASURE RECONCILIATION GROSS MARGIN Three Months Ended June 30, EPS $ millions pretax, except per share amounts 2014 2013 Impact Operating revenues* $ 906 $ 916 Fuel and purchased power expenses* (291) (278) Gross margin 615 638 $ (0.12) Adjustments: Renewable energy (excluding AZ Sun), demand side management and similar regulatory programs (17) (29) 0.06 Gross margin - adjusted $ 598 $ 609 $ (0.06) * Line items from Consolidated Statements of Income |
|
|
NON-GAAP MEASURE RECONCILIATION OTHER NON-GAAP Three Months Ended June 30, Four Corners 2014 EPS $ millions pretax, except per share amounts 2014 Deferral Adjusted 2013** Impact Operations and maintenance* $ 211 (2) $ 209 $ 229 Renewable energy (excluding AZ Sun), demand side management and similar regulatory programs 22 - 22 36 Net O&M 189 (2) 187 193 $ 0.03 Depreciation and amortization* 105 3 108 106 $ (0.01) Taxes other than income taxes* 44 (1) 43 41 $ (0.01) Allowance for equity funds used during construction* (8) - (8) (6) Interest charges* 52 (2) 50 51 Allowance for borrowed funds used during construction* (4) - (4) (4) Interest expense, net of AFUDC 40 (2) 38 41 $ 0.02 Other expenses (Operating)* 1 - 1 2 Other income* (3) 2 (1) - Other expense* 1 - 1 2 Other (1) 2 1 4 $ 0.02 * Line items from Consolidated Statements of Income ** No impact to 2Q 2013 Consolidated Statement of Income related to Four Corners deferral. 33 Second Quarter 2014 |
