Attached files
| file | filename |
|---|---|
| 8-K - CURRENT REPORT - MUTUALFIRST FINANCIAL INC | v385313_8k.htm |

KBW 2014 COMMUNITY BANK INVESTOR CONFERENCE July 29, 2014 Symbol: MFSF

Chris Cook PRESIDENT AND CEO David Heeter CHIEF FINANCIAL OFFICER

Forward Looking Statement This presentation contains statements which constitute forward looking statements within the meaning of the Private Securities Litigation Reform Act of 1995. These statements may appear in a number of places in this presentation and include statements regarding the intent, belief, outlook, estimate or expectations of the company, its directors or its officers primarily with respect to future events and the future financial performance of the company, including but not limited to preliminary estimated ProForma combined financial information. Readers of this presentation are cautioned that any such forward looking statements are not guarantees of future events or performance and involve risk and uncertainties, and that actual results may differ materially from those in the forward looking statements as a result of various factors. These factors include, but are not limited to, the loss of deposits and loan demand to competitors; substantial changes in financial markets; changes in real estate values and the real estate market; regulatory changes; or other risk factors discussed in the latest SEC form 10 - k. The Company does not undertake — and specifically disclaims any obligation — to publicly release the result of any revisions which may be made to any forward - looking statements to reflect events or circumstances after the date of such statements or to reflect the occurrence of anticipated or unanticipated events.

PRESIDENT AND CEO David Heeter

MutualBank Today • Headquartered in Muncie, Indiana • 125 years of continuous operations • $ 1.4 billion in total assets • $ 1 billion in gross loans • $ 1.1 billion in deposits • 420 staff members • Approximately 124,000 accounts

MutualBank Markets MUNCIE, INDIANA – Ball State University WARSAW, INDIANA – Orthopedic manufacturing capital of the world* SOUTH BEND, INDIANA – University of Notre Dame * http://warsaw.in.gov/ Full Service Financial Center MutualWealth Office Loan Origination Office Summit Mortgage

MutualBank Markets Unemployment Statistics *Not Seasonally Adjusted National – 6.3% State – 6.1 % 2011 Average – 9.9% 2012 Average – 9.3% 2013 Average – 6.8% 2014 (June) – 6.4% Footprint – Above Average Footprint – Below Average Contiguous County – Above Average Contiguous County – Below Average

Vision We help people live better lives. Values • Character • Compassion • Class • Competition

Strategic Plan 2012 - 2014 TO ENHANCE SHAREHOLDER VALUE THROUGH: Credit Quality Earnings Capital Market Management

Chris Cook CHIEF FINANCIAL OFFICER
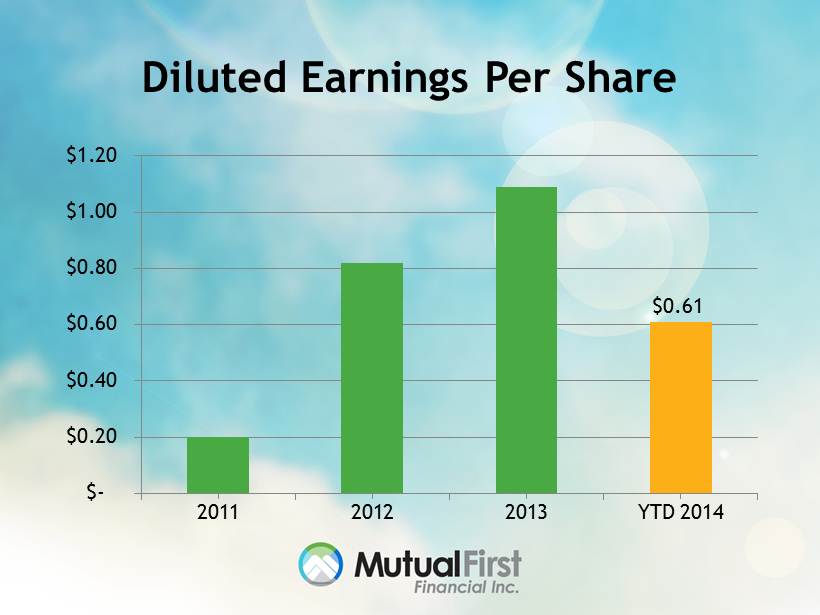
Diluted Earnings Per Share $0.61 $- $0.20 $0.40 $0.60 $0.80 $1.00 $1.20 2011 2012 2013 YTD 2014

Earnings Per Share $0.27 $0.35 $- $0.05 $0.10 $0.15 $0.20 $0.25 $0.30 $0.35 $0.40 Q4 2011 Q1 2012 Q2 2012 Q3 2012 Q4 2012 Q1 2013 Q2 2013 Q3 2013 Q4 2013 Q1 2014 Q2 2014

Earnings Per Share Momentum • Enhancing Net Interest Margin/ Net Interest Income • Increasing Non - Interest Income • Reducing Non - Interest Expenses • Elimination of SBLF
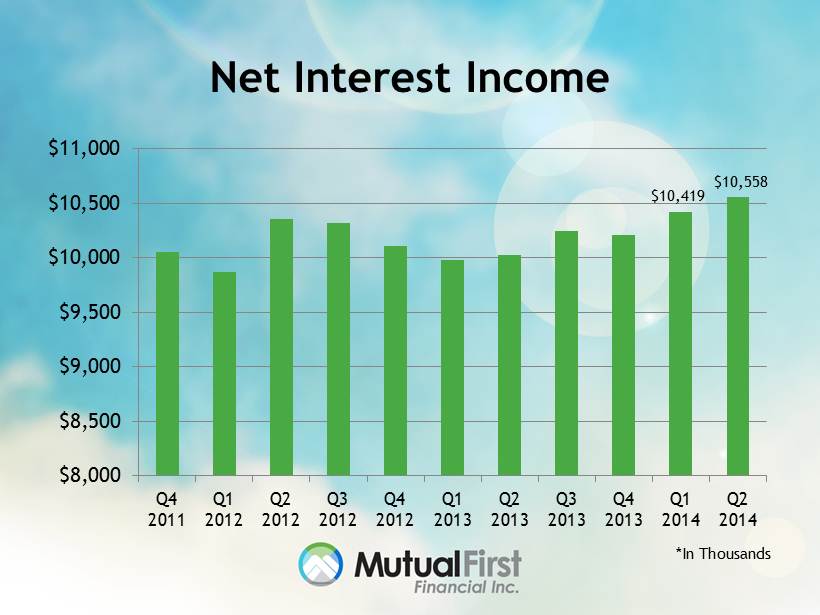
Net Interest Income $10,419 $10,558 $8,000 $8,500 $9,000 $9,500 $10,000 $10,500 $11,000 Q4 2011 Q1 2012 Q2 2012 Q3 2012 Q4 2012 Q1 2013 Q2 2013 Q3 2013 Q4 2013 Q1 2014 Q2 2014 *In Thousands

Net Interest Margin 3.26% 3.28% 2.50% 2.70% 2.90% 3.10% 3.30% 3.50% Q4 2011 Q1 2012 Q2 2012 Q3 2012 Q4 2012 Q1 2013 Q2 2013 Q3 2013 Q4 2013 Q1 2014 Q2 2014

Total Assets $1,410,522 $1,000,000 $1,050,000 $1,100,000 $1,150,000 $1,200,000 $1,250,000 $1,300,000 $1,350,000 $1,400,000 $1,450,000 2011 2012 2013 Q2 2014 *In Thousands
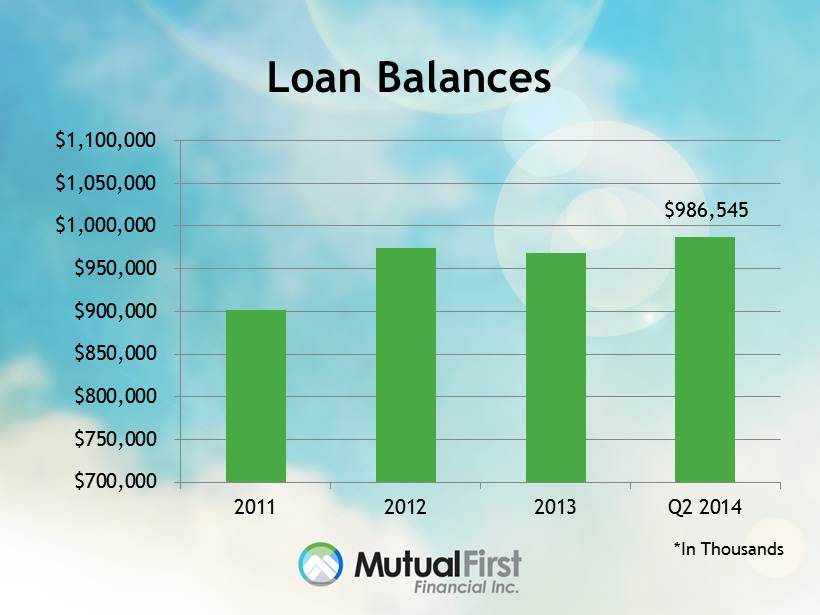
Loan Balances $986,545 $700,000 $750,000 $800,000 $850,000 $900,000 $950,000 $1,000,000 $1,050,000 $1,100,000 2011 2012 2013 Q2 2014 *In Thousands

Earning Asset Mix 26.4% 36% 6.6% 22.6% 2011 21.1% 40.9% 5.5% 23.9% Q2 2014 Investment Portfolio Consumer Closed End First Mortgage Loans Consumer Open End and Junior Liens Commercial Non - Real Estate Consumer Loans 8.4% 8.6%
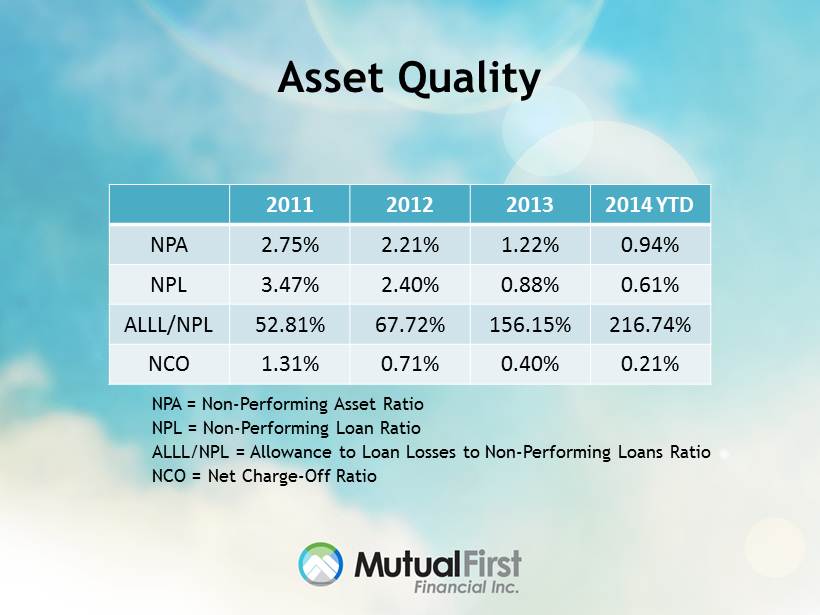
Asset Quality 2011 2012 2013 2014 YTD NPA 2.75% 2.21% 1.22% 0.94% NPL 3.47% 2.40% 0.88% 0.61% ALLL/NPL 52.81% 67.72% 156.15% 216.74% NCO 1.31% 0.71% 0.40% 0.21% NPA = Non - Performing Asset Ratio NPL = Non - Performing Loan Ratio ALLL/NPL = Allowance to Loan Losses to Non - Performing Loans Ratio NCO = Net Charge - Off Ratio
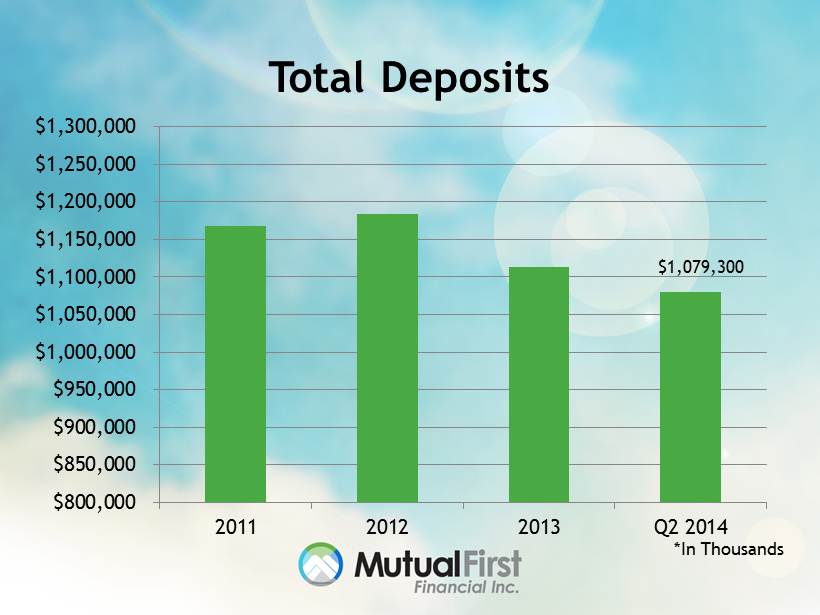
Total Deposits $1,079,300 $800,000 $850,000 $900,000 $950,000 $1,000,000 $1,050,000 $1,100,000 $1,150,000 $1,200,000 $1,250,000 $1,300,000 2011 2012 2013 Q2 2014 *In Thousands

Deposit Mix 10.6% 8.4% 18.7% 7.3% 55% 2011 13.9% 11.7% 23.2% 12.2% 39.1% Q2 2014 Non - Interest Bearing Accounts Savings Accounts Interest Bearing NOW and Demand Accounts Money Market Accounts Certificates
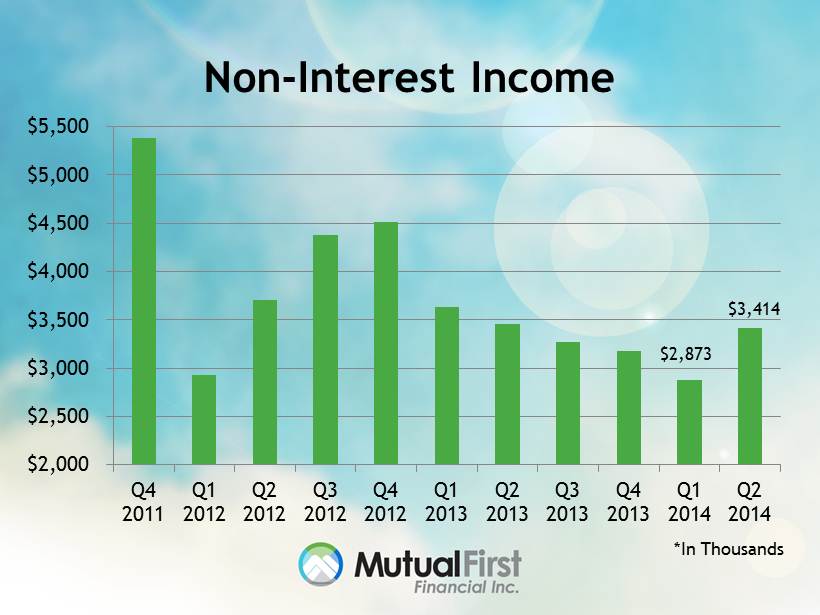
Non - Interest Income $2,873 $3,414 $2,000 $2,500 $3,000 $3,500 $4,000 $4,500 $5,000 $5,500 Q4 2011 Q1 2012 Q2 2012 Q3 2012 Q4 2012 Q1 2013 Q2 2013 Q3 2013 Q4 2013 Q1 2014 Q2 2014 *In Thousands
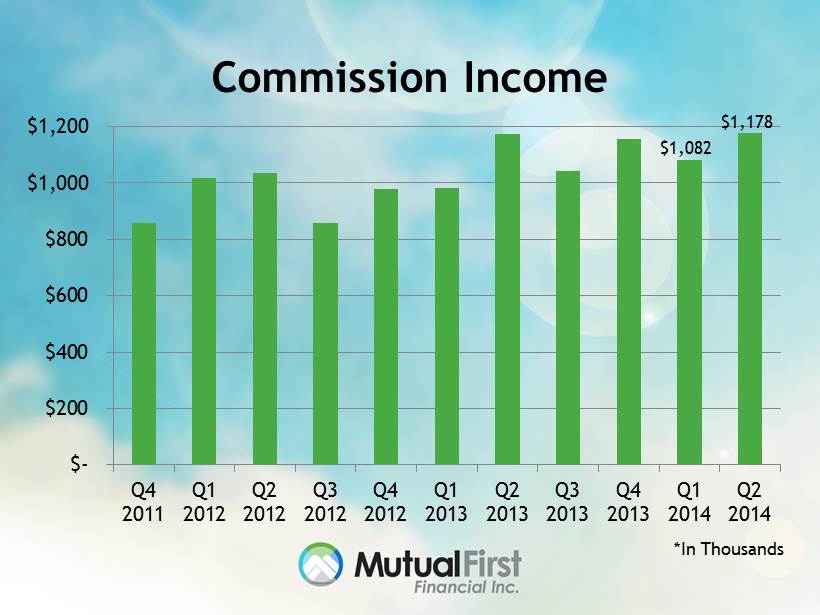
Commission Income $1,082 $1,178 $- $200 $400 $600 $800 $1,000 $1,200 Q4 2011 Q1 2012 Q2 2012 Q3 2012 Q4 2012 Q1 2013 Q2 2013 Q3 2013 Q4 2013 Q1 2014 Q2 2014 *In Thousands

Service Fee Income $1,341 $1,538 $- $200 $400 $600 $800 $1,000 $1,200 $1,400 $1,600 $1,800 $2,000 Q4 2011 Q1 2012 Q2 2012 Q3 2012 Q4 2012 Q1 2013 Q2 2013 Q3 2013 Q4 2013 Q1 2014 Q2 2014 *In Thousands

Non - Interest Expense $15,000 $20,000 $25,000 $30,000 $35,000 $40,000 $45,000 2011 2012 2013 Q2 2014 *In Thousands Annualized $40,100
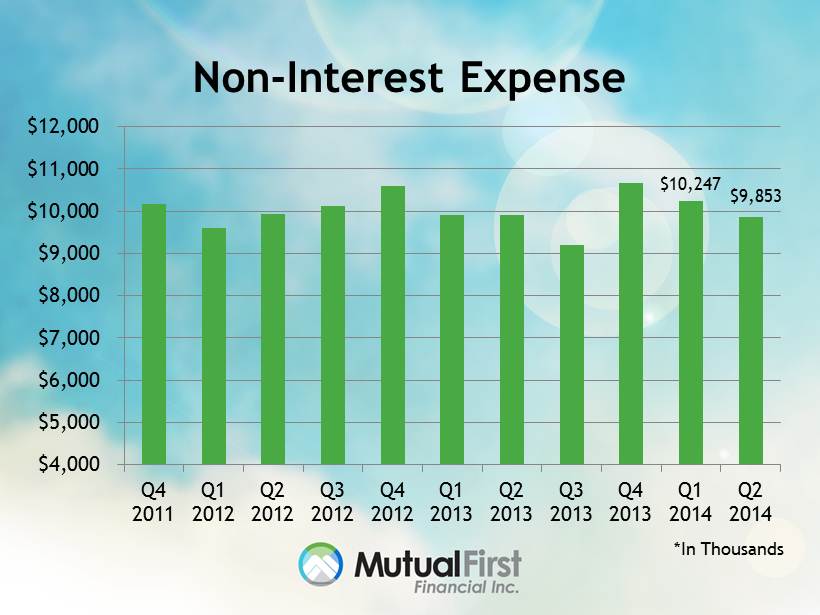
Non - Interest Expense $10,247 $9,853 $4,000 $5,000 $6,000 $7,000 $8,000 $9,000 $10,000 $11,000 $12,000 Q4 2011 Q1 2012 Q2 2012 Q3 2012 Q4 2012 Q1 2013 Q2 2013 Q3 2013 Q4 2013 Q1 2014 Q2 2014 *In Thousands
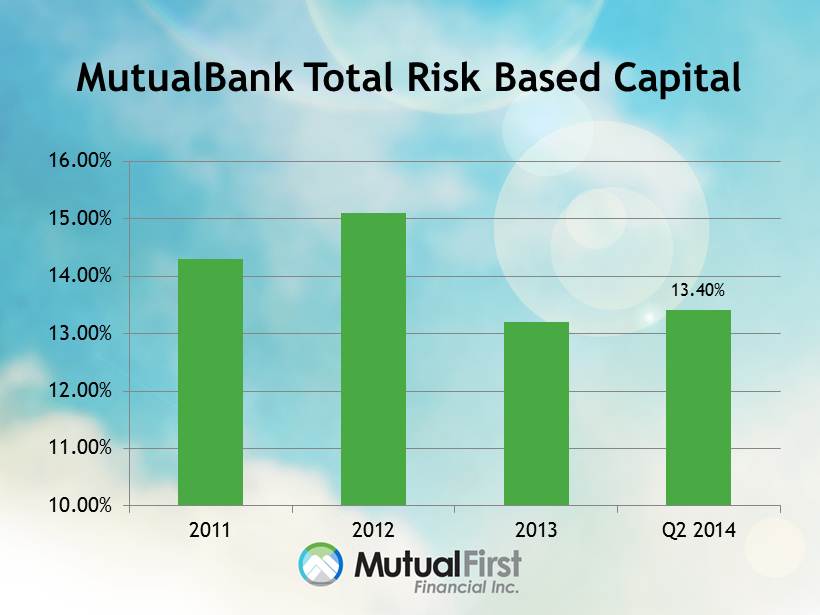
10.00% 11.00% 12.00% 13.00% 14.00% 15.00% 16.00% 2011 2012 2013 Q2 2014 MutualBank Total Risk Based Capital 13.40%
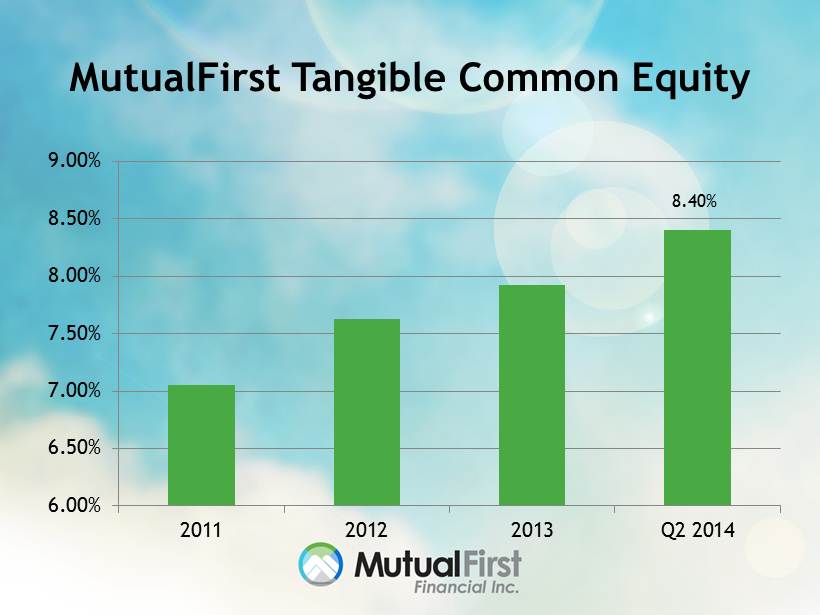
6.00% 6.50% 7.00% 7.50% 8.00% 8.50% 9.00% 2011 2012 2013 Q2 2014 MutualFirst Tangible Common Equity 8.40%

MutualFirst Tangible Book Value $- $2.00 $4.00 $6.00 $8.00 $10.00 $12.00 $14.00 $16.00 $18.00 12/31/2010 12/31/2011 12/31/2012 12/31/2013 6/30/2014 $16.54

Recap of Strategic Measures 6 Months Ended 2011 2012 2013 June 2013 June 2014 Credit Quality Non - Performing Loans 3.47% 2.40% 0.88% 1.94% 0.61% Earnings Diluted EPS $0.20 $0.82 $1.09 $0.48 $0.61 Net Interest Margin 3.16% 3.05% 3.13% 3.08% 3.27% Return on Equity 1.39% 5.47% 7.42% 6.27% 7.91% Capital Tangible Common Equity 7.05% 7.62% 7.92% 7.65% 8.40% Tangible Book Value $14.38 $15.33 $15.46 $15.14 $16.54 Market Management

New Strategic Plan

Key Takeaways • Earnings Momentum • Credit Improvement • Checking Account Growth • Business Banking Growth • Pending Summit Acquisition

MFSF Value Proposition • Price to current qtr EPS is 13.6x compared to median peer of 14.4x (last quarter ) • Price to current tangible book value 115.4% compared to median peer of 147.1 % *Peer group is Indiana Commercial Banks greater than $1.0B

Thank You