Attached files
| file | filename |
|---|---|
| 8-K - FORM 8-K - DIGITAL REALTY TRUST, INC. | d765445d8k.htm |
| Exhibit 99.1
|

Exhibit 99.1
Stable Conditions
July 29, 2014
DIGITAL REALTY
|
|
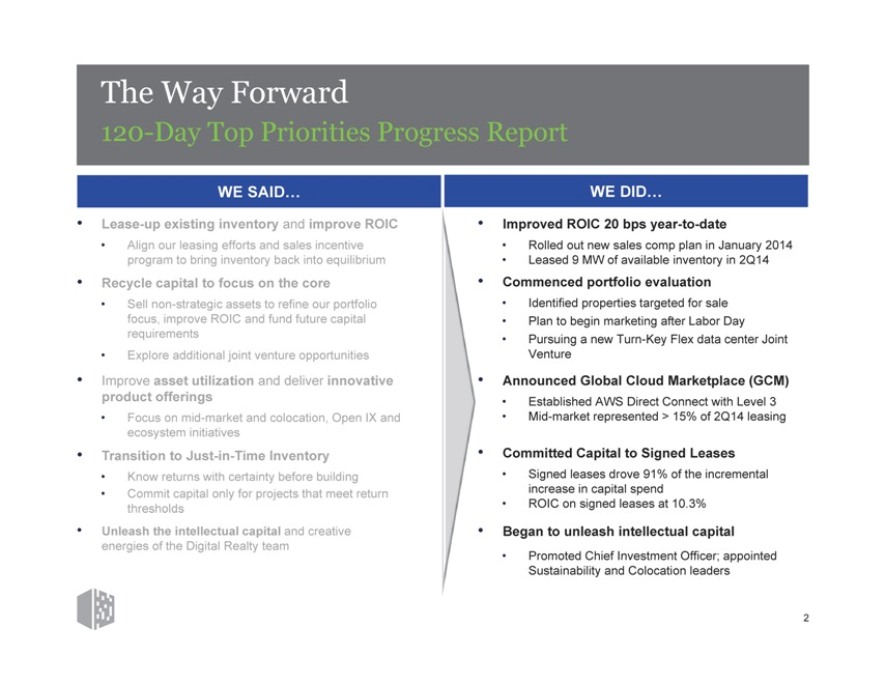
The Way Forward
120-Day Top Priorities Progress Report
WE SAID…
Lease-up existing inventory and improve ROIC
Align our leasing efforts and sales incentive program to bring inventory back into equilibrium
Recycle capital to focus on the core
Sell non-strategic assets to refine our portfolio focus, improve ROIC and fund future capital requirements
Explore additional joint venture opportunities
Improve asset utilization and deliver innovative product offerings
Focus on mid-market and colocation, Open IX and ecosystem initiatives
Transition to Just-in-Time Inventory
Know returns with certainty before building
Commit capital only for projects that meet return thresholds
Unleash the intellectual capital and creative energies of the Digital Realty team
WE DID…
Improved ROIC 20 bps year-to-date
Rolled out new sales comp plan in January 2014
Leased 9 MW of available inventory in 2Q14
Commenced portfolio evaluation
Identified properties targeted for sale
Plan to begin marketing after Labor Day
Pursuing a new Turn-Key Flex data center Joint Venture
Announced Global Cloud Marketplace (GCM)
Established AWS Direct Connect with Level 3
Mid-market represented > 15% of 2Q14 leasing
Committed Capital to Signed Leases
Signed leases drove 91% of the incremental increase in capital spend
ROIC on signed leases at 10.3%
Began to unleash intellectual capital
Promoted Chief Investment Officer; appointed Sustainability and Colocation leaders
2
|
|
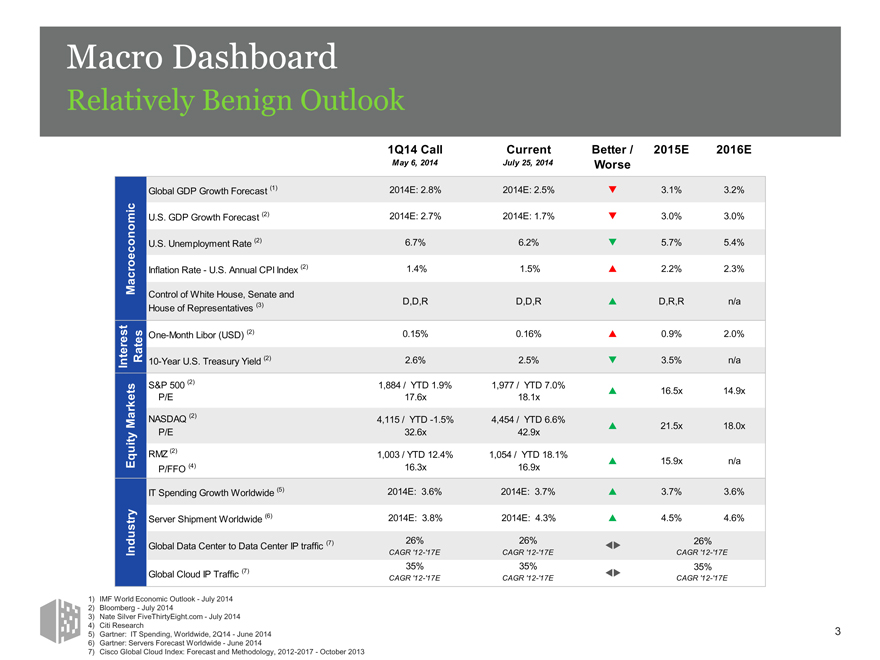
Macro Dashboard
Relatively Benign Outlook
1Q14 Call Current Better / 2015E 2016E
May 6, 2014 July 25, 2014 Worse
Global GDP Growth Forecast (1) 2014E: 2.8% 2014E: 2.5% 3.1% 3.2%
c
i
om U.S. GDP Growth Forecast (2) 2014E: 2.7% 2014E: 1.7% 3.0% 3.0%
on U.S. Unemployment Rate (2) 6.7% 6.2% 5.7% 5.4%
c
roe Inflation Rate - U.S. Annual CPI Index (2) 1.4% 1.5% 2.2% 2.3%
c
Ma Control of White House, Senate and
House of Representatives (3) D,D,R D,D,R D,R,R n/a
t
es es One-Month Libor (USD) (2) 0.15% 0.16% 0.9% 2.0%
r t
e a
n t R 10-Year U.S. Treasury Yield (2) 2.6% 2.5% 3.5% n/a
I
s S&P 500 (2) 1,884 / YTD 1.9% 1,977 / YTD 7.0%
t 16.5x 14.9x
ke P/E 17.6x 18.1x
r
Ma NASDAQ (2) 4,115 / YTD -1.5% 4,454 / YTD 6.6% 21.5x 18.0x
y P/E 32.6x 42.9x
Equit RMZ (2) 1,003 / YTD 12.4% 1,054 / YTD 18.1% 15.9x n/a
P/FFO (4) 16.3x 16.9x
Spending Growth Worldwide (5) 2014E: 3.6% 2014E: 3.7% 3.7% 3.6%
ry Server Shipment Worldwide (6) 2014E: 3.8% 2014E: 4.3% 4.5% 4.6%
dust Global Data Center to Data Center IP traffic (7) 26% 26% 26%
In CAGR ‘12-‘17E CAGR ‘12-‘17E CAGR ‘12-‘17E
35% 35% 35%
Global Cloud IP Traffic (7) CAGR ‘12-‘17E CAGR ‘12-‘17E CAGR ‘12-‘17E
1) IMF World Economic Outlook - July 2014
2) Bloomberg - July 2014
3) Nate Silver FiveThirtyEight.com - July 2014
4) Citi Research
5) Gartner: IT Spending, Worldwide, 2Q14 - June 2014
6) Gartner: Servers Forecast Worldwide - June 2014
7) Cisco Global Cloud Index: Forecast and Methodology, 2012-2017 - October 2013
3
|
|
Investment Strategy
Improve ROIC by Pruning Non-Core Assets
Non-Core Assets
Non-Core Markets
Under-Performers
At-Risk Properties
4
|
|
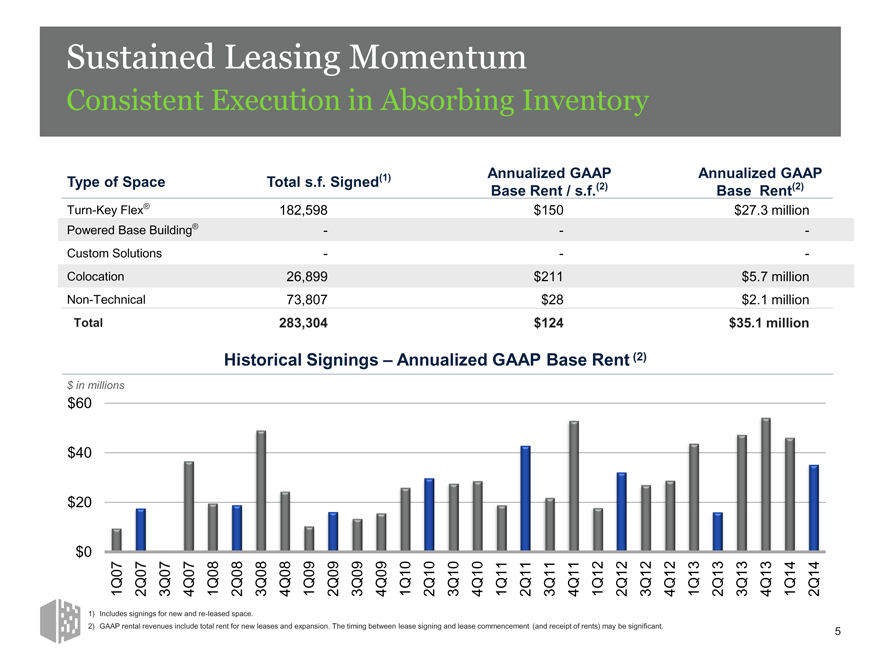
Sustained Leasing Momentum
Consistent Execution in Absorbing Inventory
Annualized GAAP Annualized GAAP
Type of Space Total s.f. Signed(1) Base Rent / s.f.(2) Base Rent(2)
Turn-Key Flex® 182,598 $150 $27.3 million
Powered Base Building® - - -
Custom Solutions - - -
Colocation 26,899 $211 $5.7 million
Non-Technical 73,807 $28 $2.1 million
Total 283,304 $124 $35.1 million
Historical Signings – Annualized GAAP Base Rent (2)
$ in millions
$60 $40 $20 $0
1Q07 2Q07 3Q07 4Q07 1Q08 2Q08 3Q08 4Q08 1Q09 2Q09 3Q09 4Q09 1Q10 2Q10 3Q10 4Q10 1Q11 2Q11 3Q11 4Q11 1Q12 2Q12 3Q12 4Q12 1Q13 2Q13 3Q13 4Q13 1Q14 2Q14
1) Includes signings for new and re-leased space.
2) GAAP rental revenues include total rent for new leases and expansion. The timing between lease signing and lease commencement (and receipt of rents) may be significant.
5
|
|
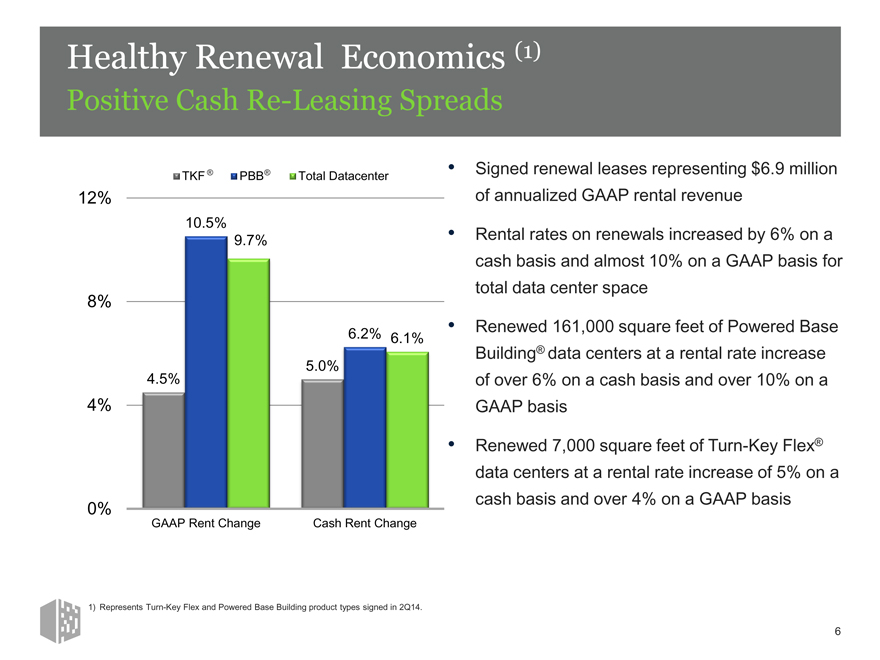
Healthy Renewal Economics (1)
Positive Cash Re-Leasing Spreads
TKF ® PBB® Total Datacenter
12%
10.5%
9.7%
8%
6.2% 6.1%
4.5% 5.0%
4%
0%
GAAP Rent Change Cash Rent Change
Signed renewal leases representing $6.9 million of annualized GAAP rental revenue
Rental rates on renewals increased by 6% on a cash basis and almost 10% on a GAAP basis for total data center space
Renewed 161,000 square feet of Powered Base Building® data centers at a rental rate increase of over 6% on a cash basis and over 10% on a GAAP basis
Renewed 7,000 square feet of Turn-Key Flex® data centers at a rental rate increase of 5% on a cash basis and over 4% on a GAAP basis
1) Represents Turn-Key Flex and Powered Base Building product types signed in 2Q14.
6
|
|
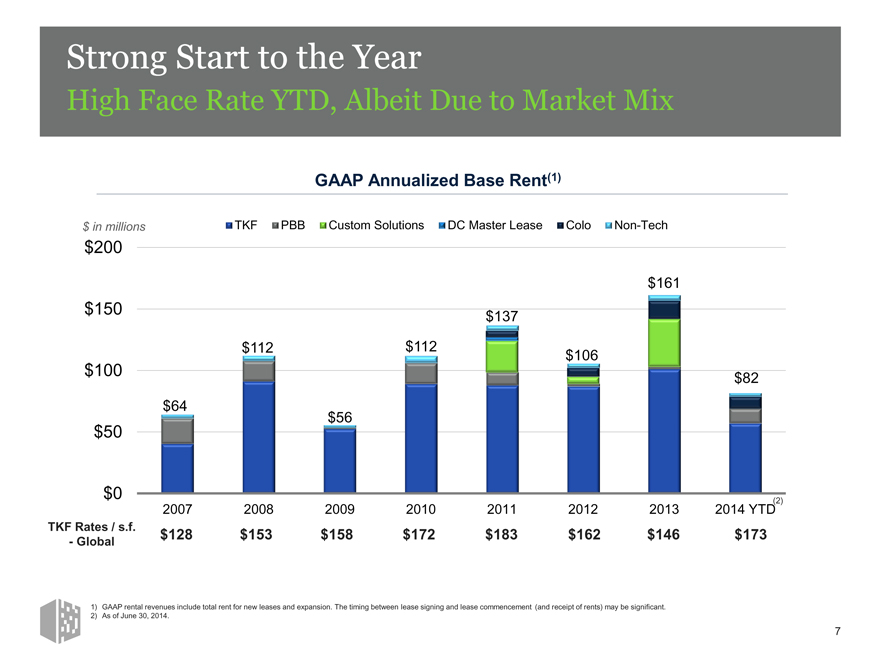
Strong Start to the Year
High Face Rate YTD, Albeit Due to Market Mix
GAAP Annualized Base Rent(1)
$ in millions TKF PBB Custom Solutions DC Master Lease Colo Non-Tech
$200
$161
$150
$137
$112 $112 $106
$100
$82 $64
$50 $56
$0
(2)
2007 2008 2009 2010 2011 2012 2013 2014 YTD
TKF Rates / s.f.
$128 $153 $158 $172 $183 $162 $146 $173
- Global
1) GAAP rental revenues include total rent for new leases and expansion. The timing between lease signing and lease commencement (and receipt of rents) may be significant.
2) As of June 30, 2014.
7
|
|
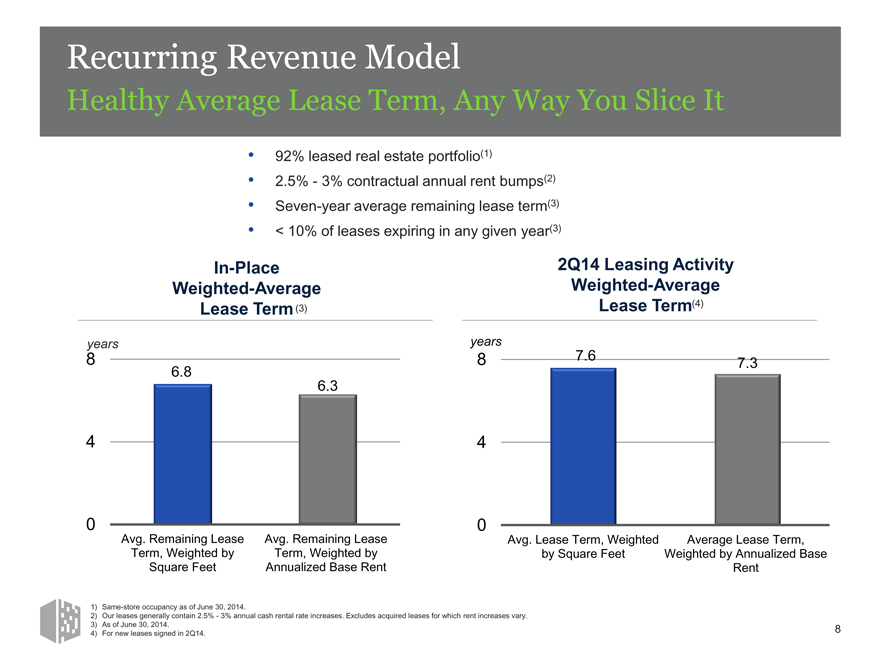
Recurring Revenue Model
Healthy Average Lease Term, Any Way You Slice It
92% leased real estate portfolio(1)
2.5%—3% contractual annual rent bumps(2) Seven-year average remaining lease term(3)
< 10% of leases expiring in any given year(3)
In-Place Weighted-Average Lease Term (3)
2Q14 Leasing Activity Weighted-Average Lease Term(4)
years
8
6.8
6.3
4
0
Avg. Remaining Lease Avg. Remaining Lease Term, Weighted by Term, Weighted by Square Feet Annualized Base Rent
years
8 7.6
7.3
4
0
Avg. Lease Term, Weighted Average Lease Term, by Square Feet Weighted by Annualized Base Rent
1) Same-store occupancy as of June 30, 2014.
2) Our leases generally contain 2.5%—3% annual cash rental rate increases. Excludes acquired leases for which rent increases vary.
3) As of June 30, 2014.
4) For new leases signed in 2Q14.
8
|
|
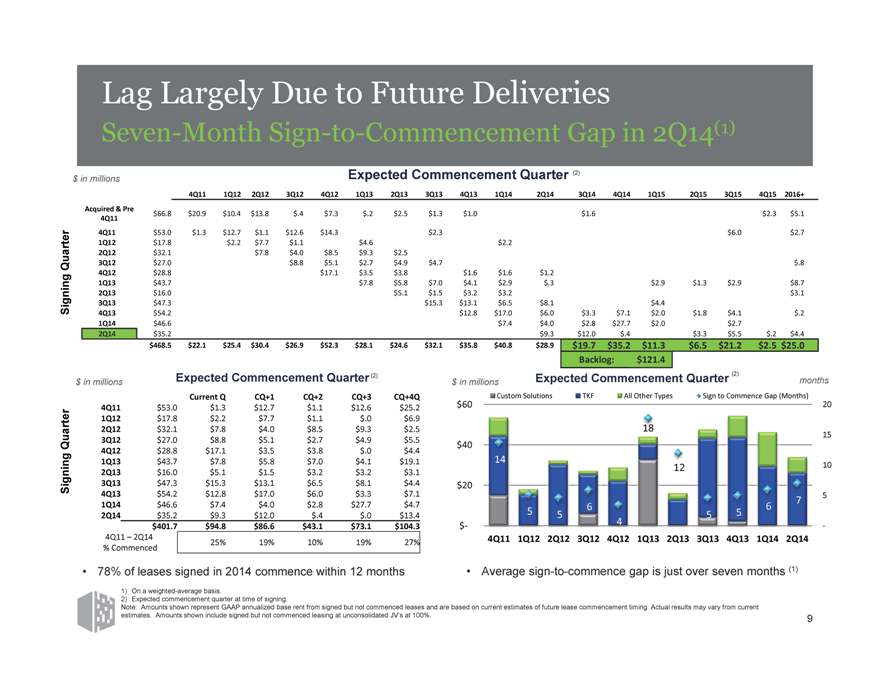
Lag Largely Due to Future Deliveries
Seven-Month Sign-to-Commencement Gap in 2Q14(1)
$ in millions Expected Commencement Quarter (2)
4Q11 1Q12 2Q12 3Q12 4Q12 1Q13 2Q13 3Q13 4Q13 1Q14 2Q14 3Q14 4Q14 1Q15 2Q15 3Q15 4Q15 2016
Acquired & Pre
$66.8 $20.9 $10.4 $13.8 $.4 $7.3 $.2 $2.5 $1.3 $1.0 $.0 $.0 $1.6 $.0 $.0 $.0 $.0 $2.3 $5.1
4Q11
4Q11 $53.0 $1.3 $12.7 $1.1 $12.6 $14.3 $.0 $.0 $2.3 $.0 $.0 $.0 $.0 $.0 $.0 $.0 $6.0 $.0 $2.7
1Q12 $17.8 $.0 $2.2 $7.7 $1.1 $.0 $4.6 $.0 $.0 $.0 $2.2 $.0 $.0 $.0 $.0 $.0 $.0 $.0 $.0
2Q12 $32.1 $.0 $.0 $7.8 $4.0 $8.5 $9.3 $2.5 $.0 $.0 $.0 $.0 $.0 $.0 $.0 $.0 $.0 $.0 $.0
Quarter 3Q12 $27.0 $.0 $.0 $.0 $8.8 $5.1 $2.7 $4.9 $4.7 $.0 $.0 $.0 $.0 $.0 $.0 $.0 $.0 $.0 $.8
4Q12 $28.8 $.0 $.0 $.0 $.0 $17.1 $3.5 $3.8 $.0 $1.6 $1.6 $1.2 $.0 $.0 $.0 $.0 $.0 $.0 $.0
1Q13 $43.7 $.0 $.0 $.0 $.0 $.0 $7.8 $5.8 $7.0 $4.1 $2.9 $.3 $.0 $.0 $2.9 $1.3 $2.9 $.0 $8.7
ning 2Q13 $16.0 $.0 $.0 $.0 $.0 $.0 $.0 $5.1 $1.5 $3.2 $3.2 $.0 $.0 $.0 $.0 $.0 $.0 $.0 $3.1
Sig 3Q13 $47.3 $.0 $.0 $.0 $.0 $.0 $.0 $.0 $15.3 $13.1 $6.5 $8.1 $.0 $.0 $4.4 $.0 $.0 $.0 $.0
4Q13 $54.2 $.0 $.0 $.0 $.0 $.0 $.0 $.0 $.0 $12.8 $17.0 $6.0 $3.3 $7.1 $2.0 $1.8 $4.1 $.0 $.2
1Q14 $46.6 $.0 $.0 $.0 $.0 $.0 $.0 $.0 $.0 $.0 $7.4 $4.0 $2.8 $27.7 $2.0 $.0 $2.7 $.0 $.0
2Q14 $35.2 $.0 $.0 $.0 $.0 $.0 $.0 $.0 $.0 $.0 $.0 $9.3 $12.0 $.4 $.0 $3.3 $5.5 $.2 $4.4
$468.5 $22.1 $25.4 $30.4 $26.9 $52.3 $28.1 $24.6 $32.1 $35.8 $40.8 $28.9 $19.7 $35.2 $11.3 $6.5 $21.2 $2.5 $25.0
$468.5 $22.1 $25.4 $30.4 $26.9 $52.3 $28.1 $24.6 $32.1 $35.8 $40.8 $28.9 $19.7 $35.2 $11.3 $6.5 $21.2 $2.5 $25.0
Backlog: $121.4
$ in millions Expected Commencement Quarter (2) $ in millions Expected Commencement Quarter (2) months
Current Q CQ+1 CQ+2 CQ+3 CQ+4Q Custom Solutions TKF All Other Types Sign to Commence Gap (Months)
4Q11 $53.0 $1.3 $12.7 $1.1 $12.6 $25.2 $60 20
1Q12 $17.8 $2.2 $7.7 $1.1 $.0 $6.9
2Q12 $32.1 $7.8 $4.0 $8.5 $9.3 $2.5 18 15
Quarter 3Q12 $27.0 $8.8 $5.1 $2.7 $4.9 $5.5 $40
4Q12 $28.8 $17.1 $3.5 $3.8 $.0 $4.4
1Q13 $43.7 $7.8 $5.8 $7.0 $4.1 $19.1 14 12 10
ning 2Q13 $16.0 $5.1 $1.5 $3.2 $3.2 $3.1
Sig 3Q13 $47.3 $15.3 $13.1 $6.5 $8.1 $4.4 $20
4Q13 $54.2 $12.8 $17.0 $6.0 $3.3 $7.15
1Q14 $46.6 $7.4 $4.0 $2.8 $27.7 $4.7 6 6 7
2Q14 $35.2 $9.3 $12.0 $.4 $.0 $13.4 5 5 5 5 4
$401.7 $94.8 $86.6 $43.1 $73.1 $104.3 $
4Q11 – 2Q14
4Q11 1Q12 2Q12 3Q12 4Q12 1Q13 2Q13 3Q13 4Q13 1Q14 2Q14
25% 19% 10% 19% 27%
% Commenced
78% of leases signed in 2014 commence within 12 months Average sign-to-commence gap is just over seven months (1)
1) On a weighted-average basis.
2) Expected commencement quarter at time of signing.
Note: Amounts shown represent GAAP annualized base rent from signed but not commenced leases and are based on current estimates of future lease commencement timing. Actual results may vary fromcurrent estimates. Amounts shown include signed but not commenced leasing at unconsolidated JV’s at 100%. 9
|
|
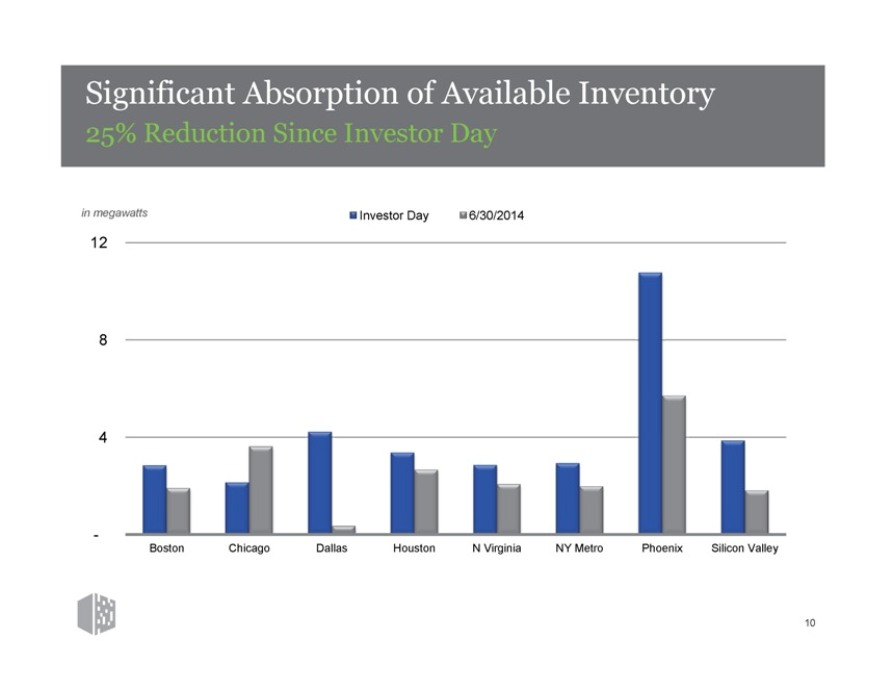
Significant Absorption of Available Inventory
25% Reduction Since Investor Day
in megawatts Investor Day 6/30/2014
12
8
4
-
Boston Chicago Dallas Houston N Virginia NY Metro Phoenix Silicon Valley
10
|
|
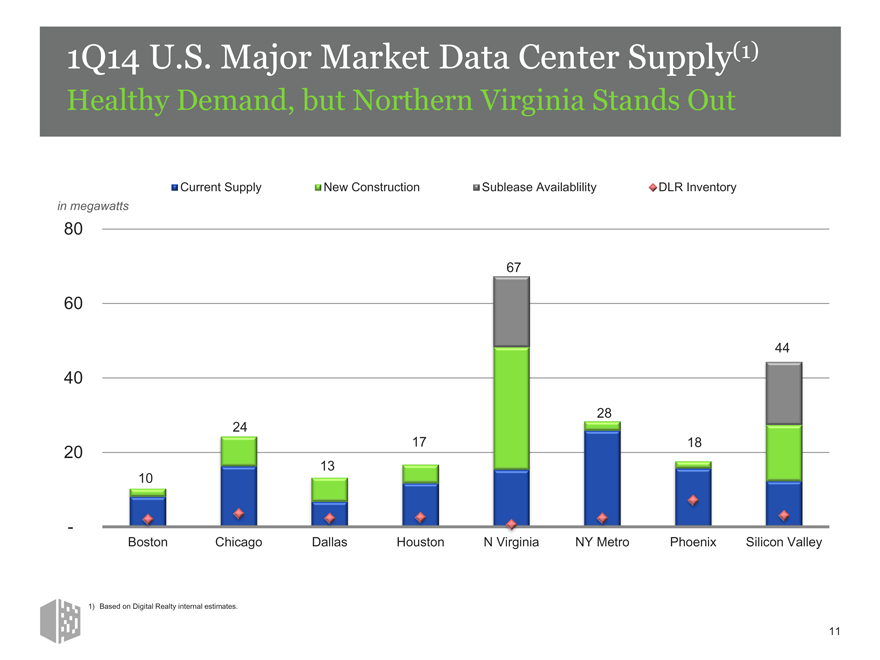
1Q14 U.S. Major Market Data Center Supply(1)
Healthy Demand, but Northern Virginia Stands Out
Current Supply New Construction Sublease Availablility DLR Inventory in megawatts
80
67
60
44
40
28 24
17 18
20
10 13
-
Boston Chicago Dallas Houston N Virginia NY Metro Phoenix Silicon Valley
1) Based on Digital Realty internal estimates.
11
|
|
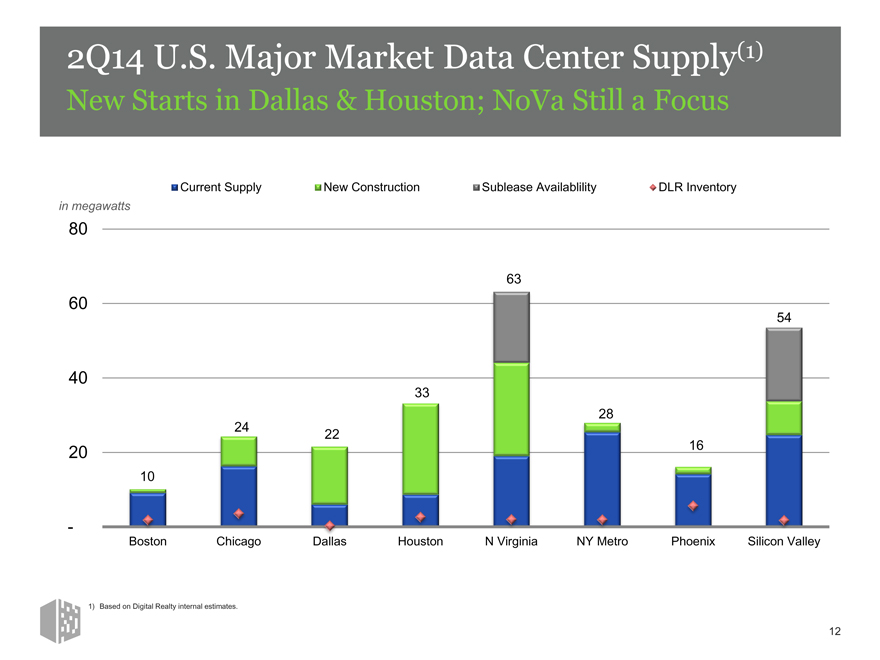
2Q14 U.S. Major Market Data Center Supply(1)
New Starts in Dallas & Houston; NoVa Still a Focus
Current Supply New Construction Sublease Availablility DLR Inventory in megawatts
80
63
60
54
40
33
28 24 22
20 16 10
-
Boston Chicago Dallas Houston N Virginia NY Metro Phoenix Silicon Valley
1) Based on Digital Realty internal estimates.
12
|
|
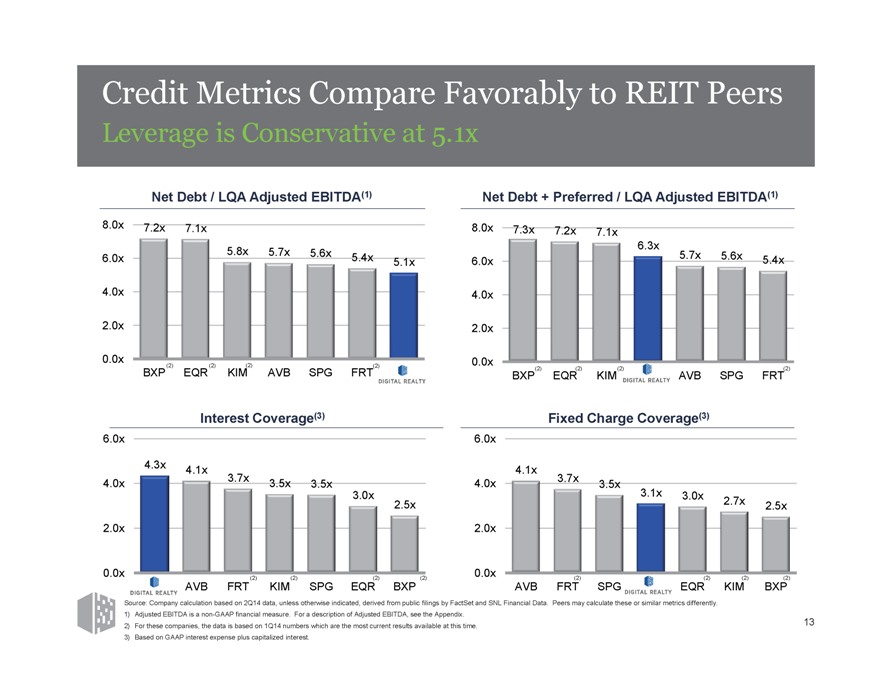
Credit Metrics Compare Favorably to REIT Peers
Leverage is Conservative at 5.1x
Net Debt / LQA Adjusted EBITDA(1) Net Debt + Preferred / LQA Adjusted EBITDA(1)
8.0x 7.2x 7.1x 8.0x 7.3x 7.2x 7.1x
5.8x 6.3x
6.0x 5.7x 5.6x 5.4x 5.1x 6.0x 5.7x 5.6x 5.4x
4.0x 4.0x
2.0x 2.0x
0.0x (2) (2) (2) (2) 0.0x
BXP EQR KIM AVB SPG FRT BXP(2) EQR(2) KIM(2) AVB SPG FRT(2)
Interest Coverage(3) Fixed Charge Coverage(3)
6.0x 6.0x
4.3x 4.1x 4.1x
3.7x 3.7x
4.0x 3.5x 3.5x 4.0x 3.5x
3.0x 3.1x 3.0x 2.7x
2.5x 2.5x
2.0x 2.0x
0.0x 0.0x
(2) (2) (2) (2) (2) (2) (2) (2)
AVB FRT KIM SPG EQR BXP AVB FRT SPG EQR KIM BXP
Source: Company calculation based on 2Q14 data, unless otherwise indicated, derived from public filings by FactSet and SNL Financial Data. Peers may calculate these or similar metrics differently.
1) Adjusted EBITDA is a non-GAAP financial measure. For a description of Adjusted EBITDA, see the Appendix.
2) For these companies, the data is based on 1Q14 numbers which are the most current results available at this time. 13
3) Based on GAAP interest expense plus capitalized interest.
|
|
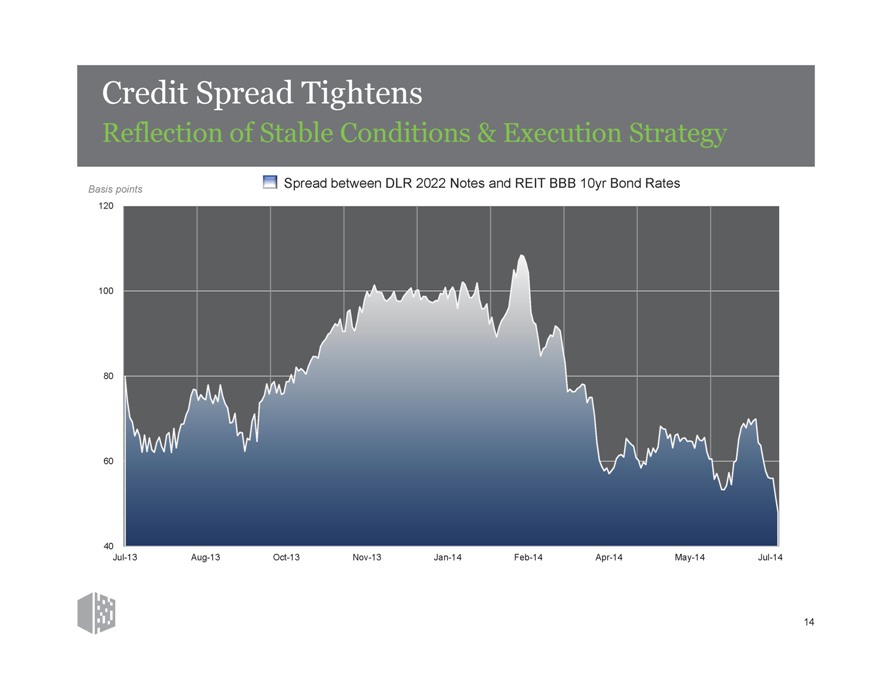
Credit Spread Tightens
Reflection of Stable Conditions & Execution Strategy
Basis points Spread between DLR 2022 Notes and REIT BBB 10yr Bond Rates
120
100
80
60
40
Jul-13 Aug-13 Oct-13 Nov-13 Jan-14 Feb-14 Apr-14 May-14 Jul-14
14
|
|
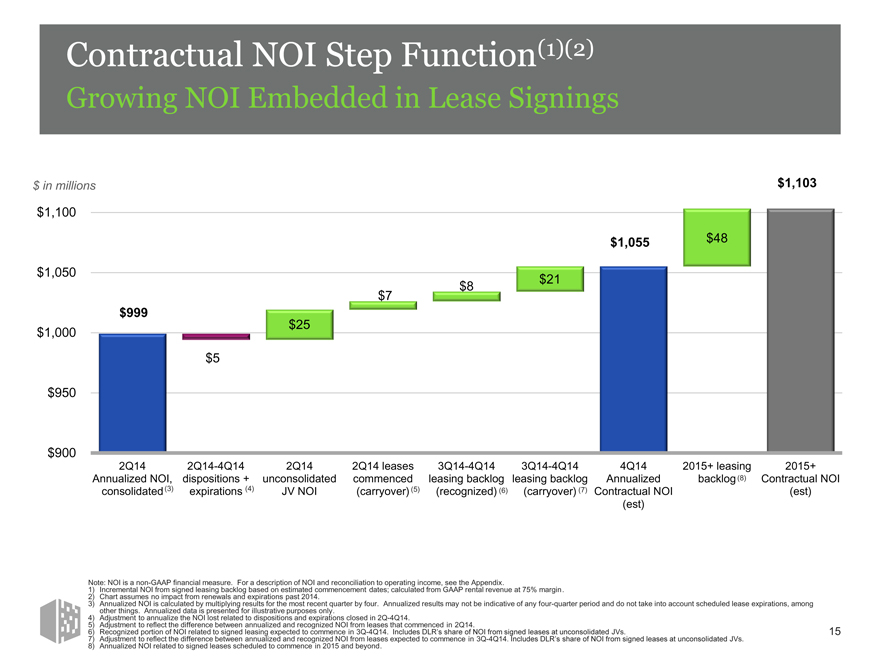
Contractual NOI Step Function(1)(2)
Growing NOI Embedded in Lease Signings
$ in millions $1,103 $1,100
$1,055 $48 $1,050 $21 $8 $7 $999 $25 $1,000
$5
$950
$900
2Q14 2Q14-4Q14 2Q14 2Q14 leases 3Q14-4Q14 3Q14-4Q14 4Q14 2015+ leasing 2015+ Annualized NOI, dispositions + unconsolidated commenced leasing backlog leasing backlog Annualized backlog (8) Contractual NOI consolidated (3) expirations (4) JV NOI (carryover) (5) (recognized) (6) (carryover) (7) Contractual NOI (est) (est)
Note: NOI is a non-GAAP financial measure. For a description of NOI and reconciliation to operating income, see the Appendix.
1) Incremental NOI from signed leasing backlog based on estimated commencement dates; calculated from GAAP rental revenue at 75% margin.
2) Chart assumes no impact from renewals and expirations past 2014.
3) Annualized NOI is calculated by multiplying results for the most recent quarter by four. Annualized results may not be indicative of any four-quarter period and do not take into account scheduled lease expirations, among other things. Annualized data is presented for illustrative purposes only.
4) Adjustment to annualize the NOI lost related to dispositions and expirations closed in 2Q-4Q14.
5) Adjustment to reflect the difference between annualized and recognized NOI from leases that commenced in 2Q14.
6) Recognized portion of NOI related to signed leasing expected to commence in 3Q-4Q14. Includes DLR’s share of NOI from signed leases at unconsolidated JVs.
7) Adjustment to reflect the difference between annualized and recognized NOI from leases expected to commence in 3Q-4Q14. Includes DLR’s share of NOI from signed leases at unconsolidated JVs.
8) Annualized NOI related to signed leases scheduled to commence in 2015 and beyond.
15
|
|
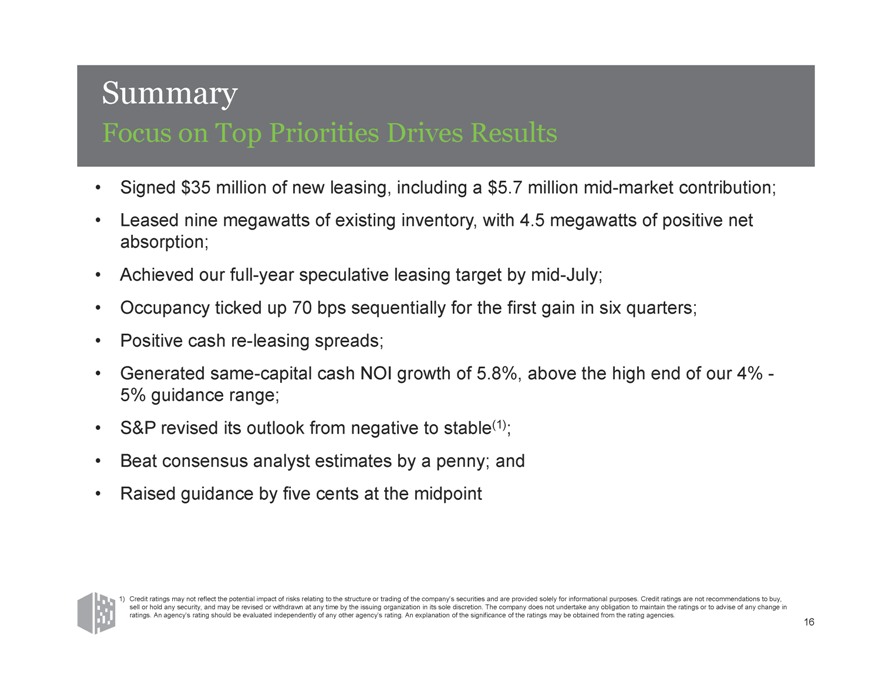
Summary
Focus on Top Priorities Drives Results
Signed $35 million of new leasing, including a $5.7 million mid-market contribution; Leased nine megawatts of existing inventory, with 4.5 megawatts of positive net absorption; Achieved our full-year speculative leasing target by mid-July; Occupancy ticked up 70 bps sequentially for the first gain in six quarters; Positive cash re-leasing spreads; Generated same-capital cash NOI growth of 5.8%, above the high end of our 4% -5% guidance range; S&P revised its outlook from negative to stable(1); Beat consensus analyst estimates by a penny; and Raised guidance by five cents at the midpoint
1) Credit ratings may not reflect the potential impact of risks relating to the structure or trading of the company’s securities and are provided solely for informational purposes. Credit ratings are not recommendations to buy, sell or hold any security, and may be revised or withdrawn at any time by the issuing organization in its sole discretion. The company does not undertake any obligation to maintain the ratings or to advise of any change in ratings. An agency’s rating should be evaluated independently of any other agency’s rating. An explanation of the significance of the ratings may be obtained from the rating agencies.
16
|
|

Appendix
17
|
|
Definitions of Non-GAAP
Financial Measures
The information included in this presentation contains certain non-GAAP financial measures that management believes are helpful in understanding our business, as further described below. Our definition and calculation of non-GAAP financial measures may differ from those of other REITs, and, therefore, may not be comparable. The non-GAAP financial measures should not be considered an alternative to net income or any other GAAP measurement of performance and should not be considered an alternative to cash flows from operating, investing or financing activities as a measure of liquidity.
FUNDS FROM OPERATIONS (FFO)
We calculate Funds from Operations, or FFO, in accordance with the standards established by the National Association of Real Estate Investment Trusts, or NAREIT. FFO represents net income (loss) (computed in accordance with GAAP), excluding gains (or losses) from sales of property, impairment charges, real estate related depreciation and amortization (excluding amortization of deferred financing costs) and after adjustments for unconsolidated partnerships and joint ventures. Management uses FFO as a supplemental performance measure because, in excluding real estate related depreciation and amortization and gains and losses from property dispositions, it provides a performance measure that, when compared year over year, captures trends in occupancy rates, rental rates and operating costs. We also believe that, as a widely recognized measure of the performance of REITs, FFO will be used by investors as a basis to compare our operating performance with that of other REITs. However, because FFO excludes depreciation and amortization and captures neither the changes in the value of our properties that result from use or market conditions, nor the level of capital expenditures and capitalized leasing commissions necessary to maintain the operating performance of our properties, all of which have real economic effect and could materially impact our financial condition and results from operations, the utility of FFO as a measure of our performance is limited. Other REITs may not calculate FFO in accordance with the NAREIT definition and, accordingly, our FFO may not be comparable to such other REITs’ FFO. Accordingly, FFO should be considered only as a supplement to net income computed in accordance with GAAP as a measure of our performance.
ADJUSTED FUNDS FROM OPERATIONS (AFFO)
We present adjusted funds from operations, or AFFO, as a supplemental operating measure because, when compared year over year, it assesses our ability to fund dividend and distribution requirements from our operating activities. We also believe that, as a widely recognized measure of the operations of REITs, AFFO will be used by investors as a basis to assess our ability to fund dividend payments in comparison to other REITs, including on a per share and unit basis. We calculate AFFO by adding to or subtracting from FFO (i) non-real estate depreciation, (ii) amortization of deferred financing costs, (iii) non-cash compensation, (iv) straight line rents, (v) fair value of lease revenue amortization, (vi) capitalized leasing payroll, (vii) recurring tenant improvements, (viii) capitalized leasing commissions and (ix) costs of redeeming our preferred stock. Other REITs may not calculate AFFO in a consistent manner. Accordingly, our AFFO may not be comparable to other REITs’ AFFO. AFFO should be considered only as a supplement to net income computed in accordance with GAAP as a measure of our performance.
CORE FUNDS FROM OPERATIONS (CFFO)
We present core funds from operations, or CFFO, as a supplemental operating measure because, in excluding certain items that do not reflect core revenue or expense streams, it provides a performance measure that, when compared year over year, captures trends in our core business operating performance. We calculate CFFO by adding to or subtracting from FFO (i) termination fees and other non-core revenues, (ii) significant transaction expenses, (iii) loss from early extinguishment of debt, (iv) costs on redemption of preferred stock, (v) significant property tax adjustments, net, (vi) change in fair value of contingent consideration and (vii) other non-core expense adjustments. Because certain of these adjustments have a real economic impact on our financial condition and results from operations, the utility of CFFO as a measure of our performance is limited. Other REITs may not calculate CFFO in a consistent manner. Accordingly, our CFFO may not be comparable to other REITs’ CFFO. CFFO should be considered only as a supplement to net income computed in accordance with GAAP as a measure of our performance.
NET OPERATING INCOME (NOI) AND CASH NOI
NOI represents rental revenue and tenant reimbursement revenue less rental property operating and maintenance expenses, property taxes and insurance expenses (as reflected in statement of operations). NOI is commonly used by stockholders, company management and industry analysts as a measurement of operating performance of the company’s rental portfolio. Cash NOI is NOI less straight-line rents and above and below market rent amortization. Cash NOI is commonly used by stockholders, company management and industry analysts as a measure of property operating performance on a cash basis. However, because NOI and cash NOI exclude depreciation and amortization and capture neither the changes in the value of our properties that result from use or market conditions, nor the level of capital expenditures and capitalized leasing commissions necessary to maintain the operating performance of our properties, all of which have real economic effect and could materially impact our results from operations, the utility of NOI and cash NOI as measures of our performance is limited. Other REITs may not calculate NOI and cash NOI in the same manner we do and, accordingly, our NOI and cash NOI may not be comparable to such other REITs’ NOI and cash NOI. Accordingly, NOI and cash NOI should be considered only as supplements to net income computed in accordance with GAAP as measures of our performance.
18
|
|
Definitions of Non-GAAP
Financial Measures
EARNINGS BEFORE INTEREST, TAXES, DEPRECIATION AND AMORTIZATION (EBITDA) AND ADJUSTED EBITDA
We believe that earnings before interest expense, income taxes, depreciation and amortization, or EBITDA and Adjusted EBITDA (as defined below), are useful supplemental performance measures because they allow investors to view our performance without the impact of non-cash depreciation and amortization or the cost of debt, and with respect to Adjusted EBITDA, straight-line rent expense adjustment attributable to prior periods, change in fair value of contingent consideration, severance accrual and equity acceleration, gain on sale of property, gain on contribution of properties to unconsolidated joint venture, preferred dividends and non-controlling interests. Adjusted EBITDA is EBITDA excluding straight-line rent expense adjustment attributable to prior periods, change in fair value of contingent consideration, severance accrual and equity acceleration, gain on sale of property, gain on contribution of properties to unconsolidated joint venture, non-controlling interests, and preferred stock dividends. In addition, we believe EBITDA and Adjusted EBITDA are frequently used by securities analysts, investors and other interested parties in the evaluation of REITs. Because EBITDA and Adjusted EBITDA are calculated before recurring cash charges including interest expense and income taxes, exclude capitalized costs, such as leasing commissions, and are not adjusted for capital expenditures or other recurring cash requirements of our business, their utility as a measure of our performance is limited. Other REITs may calculate EBITDA and Adjusted EBITDA differently than we do; accordingly, our EBITDA and Adjusted EBITDA may not be comparable to such other REITs’ EBITDA and Adjusted EBITDA. Accordingly, EBITDA and Adjusted EBITDA should be considered only as supplements to net income computed in accordance with GAAP as a measure of our financial performance.
Each of FFO, CFFO, AFFO, NOI, Cash NOI, EBITDA and Adjusted EBITDA exclude items that have real economic effect and could materially impact our results from operations, and therefore the utility of FFO, CFFO, AFFO, NOI, Cash NOI, EBITDA and Adjusted EBTIDA as measures of our performance is limited.
19
|
|
Reconciliation of Non-GAAP Items
To Their Closest GAAP Equivalent
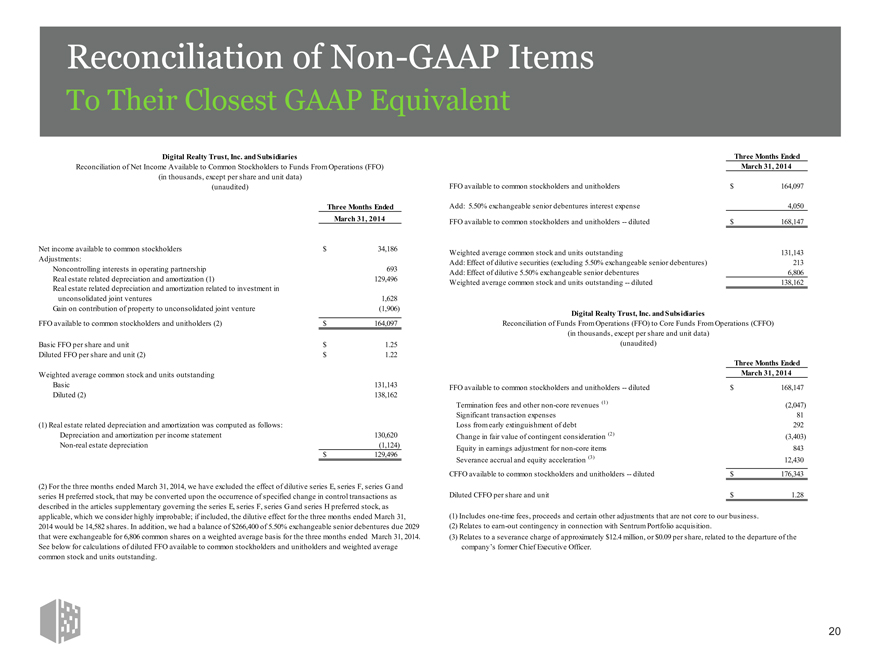
Digital Realty Trust, Inc. and Subsidiaries
Reconciliation of Net Income Available to Common Stockholders to Funds From Operations (FFO) (in thousands, except per share and unit data) (unaudited)
Three Months Ended
March 31, 2014
Net income available to common stockholders $ 34,186
Adjustments:
Noncontrolling interests in operating partnership 693
Real estate related depreciation and amortization (1) 129,496
Real estate related depreciation and amortization related to investment in
unconsolidated joint ventures 1,628
Gain on contribution of property to unconsolidated joint venture(1,906)
FFO available to common stockholders and unitholders (2) $ 164,097
Basic FFO per share and unit $ 1.25
Diluted FFO per share and unit (2) $ 1.22
Weighted average common stock and units outstanding
Basic 131,143
Diluted (2) 138,162
(1) Real estate related depreciation and amortization was computed as follows:
Depreciation and amortization per income statement 130,620
Non-real estate depreciation(1,124)
$ 129,496
(2) For the three months ended March 31, 2014, we have excluded the effect of dilutive series E, series F, series G and series H preferred stock, that may be converted upon the occurrence of specified change in control transactions as described in the articles supplementary governing the series E, series F, series G and series H preferred stock, as applicable, which we consider highly improbable; if included, the dilutive effect for the three months ended March 31, 2014 would be 14,582 shares. In addition, we had a balance of $266,400 of 5.50% exchangeable senior debentures due 2029 that were exchangeable for 6,806 common shares on a weighted average basis for the three months ended March 31, 2014. See below for calculations of diluted FFO available to common stockholders and unitholders and weighted average common stock and units outstanding.
Three Months Ended
March 31, 2014
FFO available to common stockholders and unitholders $ 164,097
Add: 5.50% exchangeable senior debentures interest expense 4,050
FFO available to common stockholders and unitholders — diluted $ 168,147
Weighted average common stock and units outstanding 131,143
Add: Effect of dilutive securities (excluding 5.50% exchangeable senior debentures) 213
Add: Effect of dilutive 5.50% exchangeable senior debentures 6,806
Weighted average common stock and units outstanding — diluted 138,162
Digital Realty Trust, Inc. and Subsidiaries
Reconciliation of Funds From Operations (FFO) to Core Funds From Operations (CFFO) (in thousands, except per share and unit data) (unaudited)
Three Months Ended
March 31, 2014
FFO available to common stockholders and unitholders — diluted $ 168,147
Termination fees and other non-core revenues (1)(2,047)
Significant transaction expenses 81
Loss from early extinguishment of debt 292
Change in fair value of contingent consideration (2)(3,403)
Equity in earnings adjustment for non-core items 843
Severance accrual and equity acceleration (3) 12,430
CFFO available to common stockholders and unitholders — diluted $ 176,343
Diluted CFFO per share and unit $ 1.28
(1) Includes one-time fees, proceeds and certain other adjustments that are not core to our business. (2) Relates to earn-out contingency in connection with Sentrum Portfolio acquisition.
(3) Relates to a severance charge of approximately $12.4 million, or $0.09 per share, related to the departure of the company’s former Chief Executive Officer.
20
|
|
Reconciliation of Non-GAAP Items
To Their Closest GAAP Equivalent
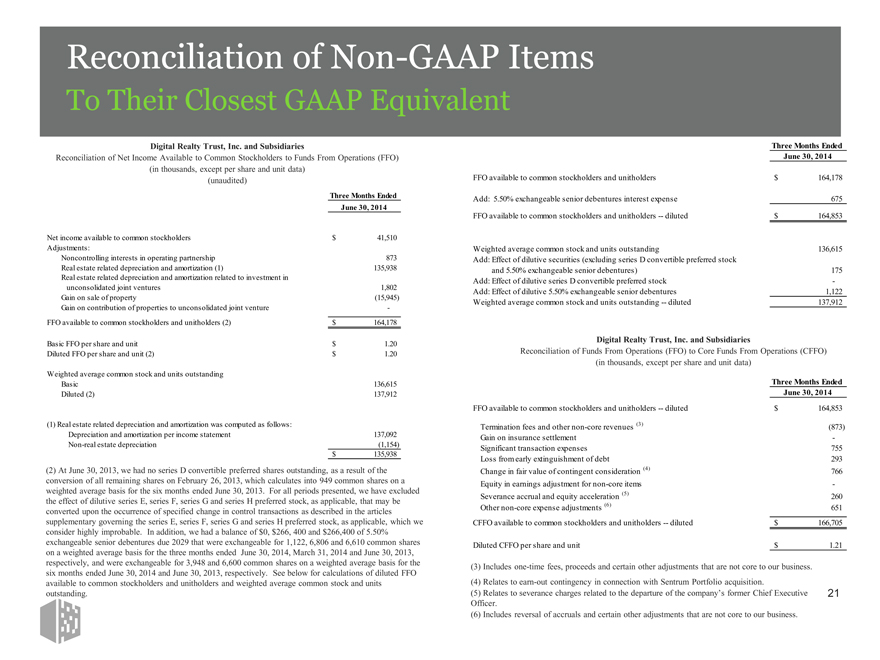
Digital Realty Trust, Inc. and Subsidiaries
Reconciliation of Net Income Available to Common Stockholders to Funds From Operations (FFO) (in thousands, except per share and unit data) (unaudited)
Three Months Ended
June 30, 2014
Net income available to common stockholders $ 41,510
Adjustments:
Noncontrolling interests in operating partnership 873
Real estate related depreciation and amortization (1) 135,938
Real estate related depreciation and amortization related to investment in
unconsolidated joint ventures 1,802
Gain on sale of property(15,945)
Gain on contribution of properties to unconsolidated joint venture -
FFO available to common stockholders and unitholders (2) $ 164,178
Basic FFO per share and unit $ 1.20
Diluted FFO per share and unit (2) $ 1.20
Weighted average common stock and units outstanding
Basic 136,615
Diluted (2) 137,912
(1) Real estate related depreciation and amortization was computed as follows:
Depreciation and amortization per income statement 137,092
Non-real estate depreciation(1,154)
$ 135,938
(2) At June 30, 2013, we had no series D convertible preferred shares outstanding, as a result of the conversion of all remaining shares on February 26, 2013, which calculates into 949 common shares on a weighted average basis for the six months ended June 30, 2013. For all periods presented, we have excluded the effect of dilutive series E, series F, series G and series H preferred stock, as applicable, that may be converted upon the occurrence of specified change in control transactions as described in the articles supplementary governing the series E, series F, series G and series H preferred stock, as applicable, which we consider highly improbable. In addition, we had a balance of $0, $266, 400 and $266,400 of 5.50% exchangeable senior debentures due 2029 that were exchangeable for 1,122, 6,806 and 6,610 common shares on a weighted average basis for the three months ended June 30, 2014, March 31, 2014 and June 30, 2013, respectively, and were exchangeable for 3,948 and 6,600 common shares on a weighted average basis for the six months ended June 30, 2014 and June 30, 2013, respectively. See below for calculations of diluted FFO available to common stockholders and unitholders and weighted average common stock and units outstanding.
Three Months Ended
June 30, 2014
FFO available to common stockholders and unitholders $ 164,178
Add: 5.50% exchangeable senior debentures interest expense 675
FFO available to common stockholders and unitholders — diluted $ 164,853
Weighted average common stock and units outstanding 136,615
Add: Effect of dilutive securities (excluding series D convertible preferred stock
and 5.50% exchangeable senior debentures) 175
Add: Effect of dilutive series D convertible preferred stock -
Add: Effect of dilutive 5.50% exchangeable senior debentures 1,122
Weighted average common stock and units outstanding — diluted 137,912
Digital Realty Trust, Inc. and Subsidiaries
Reconciliation of Funds From Operations (FFO) to Core Funds From Operations (CFFO) (in thousands, except per share and unit data)
Three Months Ended
June 30, 2014
FFO available to common stockholders and unitholders — diluted $ 164,853
Termination fees and other non-core revenues (3)(873)
Gain on insurance settlement -
Significant transaction expenses 755
Loss from early extinguishment of debt 293
Change in fair value of contingent consideration (4) 766
Equity in earnings adjustment for non-core items -
Severance accrual and equity acceleration (5) 260
Other non-core expense adjustments (6) 651
CFFO available to common stockholders and unitholders — diluted $ 166,705
Diluted CFFO per share and unit $ 1.21
(3) Includes one-time fees, proceeds and certain other adjustments that are not core to our business. (4) Relates to earn-out contingency in connection with Sentrum Portfolio acquisition.
(5) Relates to severance charges related to the departure of the company’s former Chief Executive
Officer.
(6) Includes reversal of accruals and certain other adjustments that are not core to our business.
21
|
|
Reconciliation of Non-GAAP Items
To Their Closest GAAP Equivalent
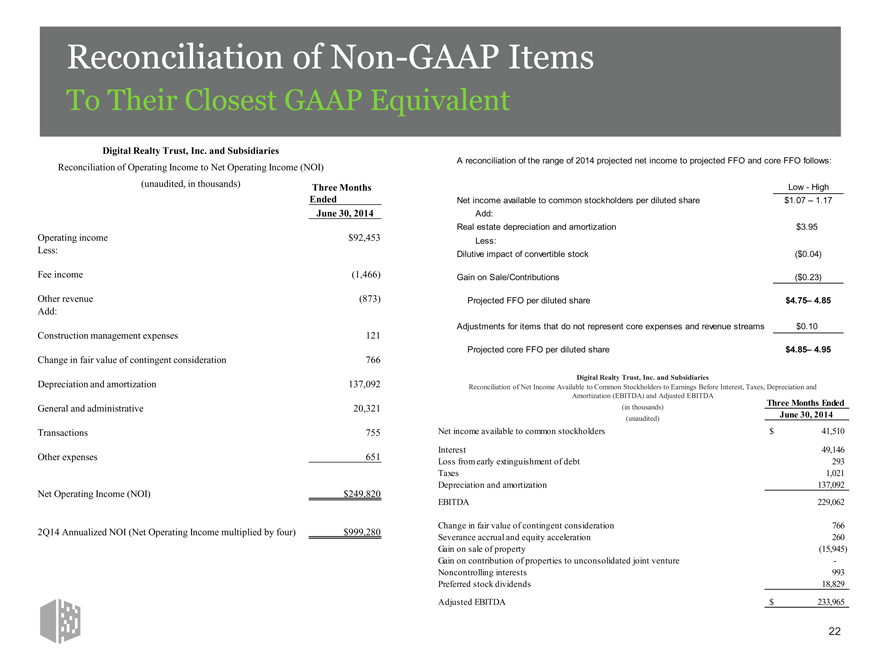
Digital Realty Trust, Inc. and Subsidiaries
Reconciliation of Operating Income to Net Operating Income (NOI) (unaudited, in thousands)
Three Months
Ended
June 30, 2014
Operating income $92,453
Less:
Fee income(1,466)
Other revenue(873)
Add:
Construction management expenses 121
Change in fair value of contingent consideration 766
Depreciation and amortization 137,092
General and administrative 20,321
Transactions 755
Other expenses 651
Net Operating Income (NOI) $249,820
2Q14 Annualized NOI (Net Operating Income multiplied by four) $999,280
A reconciliation of the range of 2014 projected net income to projected FFO and core FFO follows:
Low—High
Net income available to common stockholders per diluted share $1.07 – 1.17
Add:
Real estate depreciation and amortization $3.95
Less:
Dilutive impact of convertible stock($0.04)
Gain on Sale/Contributions($0.23)
Projected FFO per diluted share $4.75– 4.85
Adjustments for items that do not represent core expenses and revenue streams $0.10
Projected core FFO per diluted share $4.85– 4.95
Digital Realty Trust, Inc. and Subsidiaries
Reconciliation of Net Income Available to Common Stockholders to Earnings Before Interest, Taxes, Depreciation and Amortization (EBITDA) and Adjusted EBITDA
(in thousands) Three Months Ended
(unaudited) June 30, 2014
Net income available to common stockholders $ 41,510
Interest 49,146
Loss from early extinguishment of debt 293
Taxes 1,021
Depreciation and amortization 137,092
EBITDA 229,062
Change in fair value of contingent consideration 766
Severance accrual and equity acceleration 260
Gain on sale of property(15,945)
Gain on contribution of properties to unconsolidated joint venture -
Noncontrolling interests 993
Preferred stock dividends 18,829
Adjusted EBITDA $ 233,965
22
|
|

Forward-Looking Statements
The information included in this presentation contains forward-looking statements. Such statements are based on management’s beliefs and assumptions made based on information currently available to management. Such forward-looking statements include statements relating to our opportunities and strategies, including ROIC, recycling assets and capital, and sources of growth; business drivers; sources and uses; our expected development plans and completions, including timing, total square footage, IT capacity and raised floor space upon completion; expected availability for leasing efforts, sales incentive program, mid-market and colocation initiatives; organizational initiatives; joint venture opportunities; occupancy and total investment; our expected investment in our properties; our estimated time to stabilization and targeted returns at stabilization of our properties; our expected future acquisitions; acquisitions strategy; available inventory and development strategy; the signing and commencement of leases, and related rental revenue; lag between signing and commencement of leases; our expected same store portfolio growth; our expected growth and stabilization of development completions and acquisitions; our expected mark-to-market rates on lease expirations, lease rollovers and expected rental rate changes; our expected yields on investments; our expectations with respect to capital investments at lease expiration on existing Turn-Key Flex space; barriers to entry; competition; debt maturities; lease maturities; our expected returns on invested capital; estimated absorption rates; our other expected future financial and other results, and the assumptions underlying such results; our top investment markets and market opportunities; our ability to access the capital markets; expected time and cost savings to our customers; our strategies, plans and intentions; future data center utilization, utilization rates, growth rates, trends, supply and demand, and demand drivers; datacenter outsourcing trends; datacenter expansion plans; estimated kW/MW requirements; growth in the overall Internet infrastructure sector and segments thereof; the market effects of regulatory requirements; the replacement cost of our assets; the development costs of our buildings, and lead times; estimated costs for customers to deploy or migrate to a new data center; capital expenditures; the effect new leases and increases in rental rates will have on our rental revenues and results of operations; lease expiration rates; our ability to borrow funds under our credit facilities; estimates of the value of our development portfolio; our ability to meet our liquidity needs, including the ability to raise additional capital; credit ratings; capitalization rates, or cap rates, potential new markets; dividend payments and our dividend policy; projected financial information and covenant metrics; annualized, projected and run-rate NOI and Core FFO; other forward-looking financial data; leasing expectations; Digital Realty Ecosystem, our connectivity initiative; Digital Open Internet Exchange; and the sufficiency of our capital to fund future requirements. You can identify forward-looking statements by the use of forward-looking terminology such as
“believes,” “expects,” “may,” “will,” “should,” “seeks,” “approximately,” “intends,” “plans,” “pro forma,” “estimates” or “anticipates” or the negative of these words and phrases or similar words or phrases which are predictions of or indicate future events or trends and discussions which do not relate solely to historical matters. Such statements are subject to risks, uncertainties and assumptions, are not guarantees of future performance and may be affected by known and unknown risks, trends, uncertainties and factors that are beyond our control that may cause actual results to vary materially. Some of the risks and uncertainties include, among others, the following: the impact of current global economic, credit and market conditions; current local economic conditions in our geographic markets; decreases in information technology spending, including as a result of economic slowdowns or recession; adverse economic or real estate developments in our industry or the industry sectors that we sell to (including risks relating to decreasing real estate valuations and impairment charges); our dependence upon significant tenants; bankruptcy or insolvency of a major tenant or a significant number of smaller tenants; defaults on or non-renewal of leases by tenants; our failure to obtain necessary debt and equity financing; risks associated with using debt to fund our business activities, including re-financing and interest rate risks, our failure to repay debt when due, adverse changes in our credit ratings or our breach of covenants or other terms contained in our loan facilities and agreements; financial market fluctuations; changes in foreign currency exchange rates; our inability to manage our growth effectively; difficulty acquiring or operating properties in foreign jurisdictions; our failure to successfully integrate and operate acquired or developed properties or businesses; the suitability for our properties and data center infrastructure, delays or disruptions in connectivity, failure of our physical infrastructure or services or availability of power; risks related to joint venture investments, including as a result of our lack of control of such investments; delays or unexpected costs in development of properties; decreased rental rates, increased operating costs or increased vacancy rates; increased competition or available supply of data center space; our inability to successfully develop and lease new properties and development space; difficulties in identifying properties to acquire and completing acquisitions; our inability to acquire off-market properties; our inability to comply with the rules and regulations applicable to reporting companies; our failure to maintain our status as a REIT; possible adverse changes to tax laws; restrictions on our ability to engage in certain business activities; environmental uncertainties and risks related to natural disasters; losses in excess of our insurance coverage; changes in foreign laws and regulations, including those related to taxation and real estate ownership and operation; and changes in local, state and federal regulatory requirements, including changes in real estate and zoning laws and increases in real property tax rates. The risks described above are not exhaustive, and additional factors could adversely affect our business and financial performance, including those discussed in our annual report on Form 10-K for the year ended December 31, 2013, as amended, and subsequent filings with the Securities and Exchange Commission. We expressly disclaim any responsibility to update forward-looking statements, whether as a result of new information, future events or otherwise.
23