Attached files
| file | filename |
|---|---|
| 8-K - 8-K - A. M. Castle & Co. | cas-8xkx63014.htm |
| EX-99.1 - PRESS RELEASE, DATED JULY 29, 2014 - A. M. Castle & Co. | cas-ex991x63014.htm |

A.M. Castle & Co. ® A. M. Castle & Co. NYSE: CAS July 29, 2014 A. M. Castle & Co. Supplement: Q2 2014 Earnings Conference Call EX-8- EXHIBIT 99.2 1
A. M. Castle & Co. ® Forward Looking Statements Information provided and statements contained in this presentation that are not purely historical are forward-looking statements within the meaning of Section 27A of the Securities Act of 1933, as amended (“Securities Act”), Section 21E of the Securities Exchange Act of 1934, as amended (“Exchange Act”), and the Private Securities Litigation Reform Act of 1995. Such forward-looking statements only speak as of the date of this release and the company assumes no obligation to update the information included in this release. Such forward-looking statements include, but are not limited to, statements concerning our possible or assumed future results of operations, and our expectations and estimates relating to restructuring activities, including restructuring charges and timing of cash payments related thereto, and operational flexibility, savings, and efficiencies from such restructuring actions. These statements often include words such as “believe,” “expect,” “anticipate,” “intend,” “goal,” “plan,” “should,” or similar expressions. These statements are not guarantees of performance or results, and they involve risks, uncertainties, and assumptions. Although we believe that these forward-looking statements are based on reasonable assumptions, there are many factors that could affect our actual financial results or results of operations and could cause actual results to differ materially from those in the forward-looking statements. For a further description of these risk factors, see the risk factors identified in our filings with the Securities and Exchange Commission, including our Annual Report on Form 10-K for the fiscal year ended December 31, 2013. All future written and oral forward-looking statements by us or persons acting on our behalf are expressly qualified in their entirety by the cautionary statements contained or referred to above. Except as required by the federal securities laws, we do not have any obligations or intention to release publicly any updates or revisions to any forward-looking statements to reflect events or circumstances in the future, to reflect the occurrence of unanticipated events or for any other reason. EX-9- 2

A. M. Castle & Co. ® This presentation includes non-GAAP financial measures to assist the reader in understanding our business. The non-GAAP financial information should be considered supplemental to, and not as a substitute for, or superior to, financial measures calculated in accordance with U. S. GAAP (“GAAP”). However, we believe that non-GAAP reporting, giving effect to the adjustments shown in the reconciliation contained in the appendix to this presentation, provides meaningful information and therefore we use it to supplement our GAAP guidance. Management often uses this information to assess and measure the performance of our business. We have chosen to provide this supplemental information to investors, analysts and other interested parties to enable them to perform additional analyses of operating results, to illustrate the results of operations giving effect to the non-GAAP adjustments shown in the reconciliations and to assist with period-over-period comparisons of such operations. The exclusion of the charges indicated herein from the non-GAAP financial measures presented does not indicate an expectation by the Company that similar charges will not be incurred in subsequent periods. In addition, the Company believes that the use and presentation of EBITDA, which is defined by the Company as income before provision/benefit for income taxes plus depreciation and amortization, and interest expense, less interest income, is widely used by the investment community for evaluation purposes and provides the investors, analysts and other interested parties with additional information in analyzing the Company’s operating results. EBITDA should not be considered as an alternative to net income or any other item calculated in accordance with U.S. GAAP, or as an indicator of operating performance. Our definition of EBITDA used here may differ from that used by other companies. Adjusted non-GAAP net income and adjusted EBITDA, which are defined as reported net income and EBITDA adjusted for non-cash items and items which are not considered by management to be indicative of the underlying results, are presented as the Company believes the information is important to provide investors, analysts and other interested parties additional information about the Company’s financial performance. Management uses EBITDA, adjusted non-GAAP net income and adjusted EBITDA to evaluate the performance of the business. The financial information herein contains information generated from audited financial statements and unaudited information and has been prepared by management in good faith and based on data currently available to the Company. Regulation G & Other Cautionary Notes EX-10- 3

A. M. Castle & Co. ® Macro Data Points and Metals Segment Markets • PMI: (Institute for Supply Management - ISM) • Average PMI was 55.2 for Q2'14 versus 50.2 for Q2'13 and 52.7 for Q1'14 • North American Rig Count: (Baker Hughes) • Average weekly rig count for Q2'14 was 2,051 compared to 1,914 for Q2'13 and 2,304 for Q1'14 • Industrial: • 1% decrease in Industrial tons sold per day compared to Q2'13 and constant compared to Q1'14 • Oil & Gas: • 3% decrease in Oil & Gas tons sold per day compared to Q2'13 and 7% decrease compared to Q1'14 • Aerospace: • 5% decrease in Aerospace tons sold per day compared to Q2'13 and 3% increase compared to Q1'14 EX-11- 4

A. M. Castle & Co. ® Selected Results SELECTED CONSOLIDATED RESULTS (Unaudited - $ in Millions, except per share data) Three Months Ended June 30, Six Months Ended June 30, 2014 2013 2014 2013 Net Sales $ 249.5 $ 273.4 $ 502.9 $ 566.1 Metals $ 214.1 $ 239.5 $ 433.2 $ 497.8 Plastics $ 35.4 $ 34.0 $ 69.7 $ 68.3 Gross Material Margins1 23.2% 26.3% 24.4% 25.7% Operating Expenses $ 129.8 $ 75.7 $ 202.0 $ 150.0 Operating Expenses as a % of Net Sales 52.0% 27.7% 40.2% 26.5% Operating Loss $ (71.9) $ (3.8) $ (79.2) $ (4.7) Operating Loss as a % of Net Sales -28.8% -1.4% -15.8% -0.8% Interest Expense, Net $ 9.9 $ 10.1 $ 19.8 $ 20.3 EBITDA2 $ (62.0) $ 5.1 $ (61.6) $ 9.9 EBITDA Margin -24.8% 1.9% -12.3% 1.7% Net Loss, as Reported $ (72.3) $ (3.8) $ (88.3) $ (14.4) Net Loss per diluted share, as Reported $ (3.10) $ (0.16) $ (3.78) $ (0.62) Adjusted Non-GAAP Net Loss3 $ (22.9) $ 0.4 $ (38.6) $ (7.7) Adjusted Non-GAAP Net Loss per diluted share $ (0.98) $ 0.02 $ (1.65) $ (0.33) 1 Non-GAAP information. Refer to calculation in the Appendix. 2 Earnings before interest, taxes and depreciation and amortization. Non-GAAP information. Refer to reconciliation in the Appendix. 3 Non-GAAP net loss adjustments relate to unrealized (gains) losses on commodity hedges and restructuring charges for all periods and impairment of goodwill for the 2014 periods. All amounts are net of tax. Refer to reconciliation in the Appendix. EX-12- 5

A. M. Castle & Co. ® Liquidity and Balance Sheet SELECTED CONSOLIDATED RESULTS (Unaudited - $ in Millions) Six Months Ended June 30, 2014 2013 Cash From (Used in) Operations $ (32.5) $ 56.1 Cash Paid for CapEx $ (4.3) $ (5.4) Avg Days Sales in Inventory 164 174 Avg Receivables Days Outstanding 51 51 SELECTED CONSOLIDATED RESULTS As of (Unaudited - $ in Millions) June 30, December 31, 2014 2013 Total Debt (net of unamortized discounts)1 $ 270.9 $ 246.0 Cash and Cash Equivalents 17.1 30.8 Total Debt less Cash and Cash Equivalents (“Net Debt”) $ 253.8 $ 215.2 Stockholders’ Equity 223.4 309.9 Total Debt plus Stockholders’ Equity (“Capital”) $ 494.3 $ 555.9 Net Debt to Total Capital 51.3% 38.7% 1 There were $22.9 million of cash borrowings under the revolving credit facility as of June 30, 2014 and no cash borrowings as of December 31, 2013. EX-13- 6
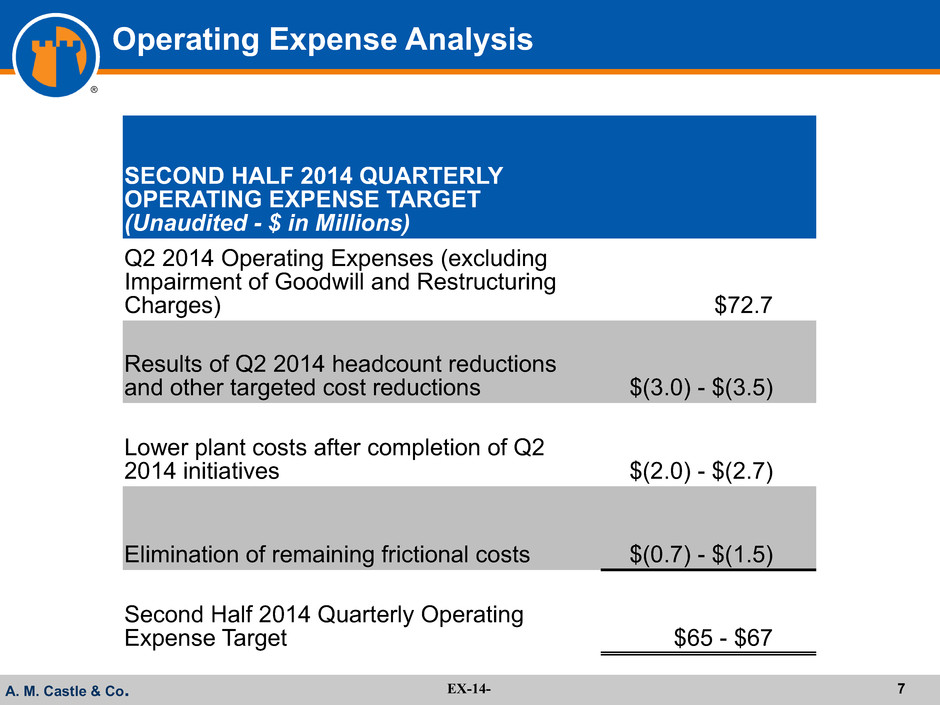
A. M. Castle & Co. ® Operating Expense Analysis SECOND HALF 2014 QUARTERLY OPERATING EXPENSE TARGET (Unaudited - $ in Millions) Q2 2014 Operating Expenses (excluding Impairment of Goodwill and Restructuring Charges) $72.7 Results of Q2 2014 headcount reductions and other targeted cost reductions $(3.0) - $(3.5) Lower plant costs after completion of Q2 2014 initiatives $(2.0) - $(2.7) Elimination of remaining frictional costs $(0.7) - $(1.5) Second Half 2014 Quarterly Operating Expense Target $65 - $67 EX-14- 7
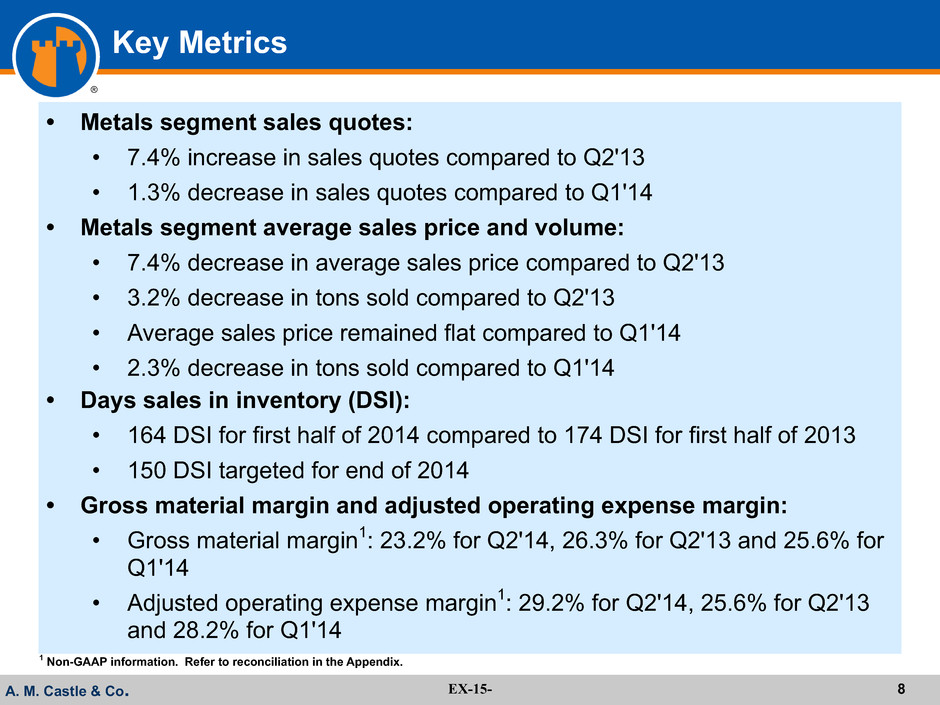
A. M. Castle & Co. ® Key Metrics • Metals segment sales quotes: • 7.4% increase in sales quotes compared to Q2'13 • 1.3% decrease in sales quotes compared to Q1'14 • Metals segment average sales price and volume: • 7.4% decrease in average sales price compared to Q2'13 • 3.2% decrease in tons sold compared to Q2'13 • Average sales price remained flat compared to Q1'14 • 2.3% decrease in tons sold compared to Q1'14 • Days sales in inventory (DSI): • 164 DSI for first half of 2014 compared to 174 DSI for first half of 2013 • 150 DSI targeted for end of 2014 • Gross material margin and adjusted operating expense margin: • Gross material margin1: 23.2% for Q2'14, 26.3% for Q2'13 and 25.6% for Q1'14 • Adjusted operating expense margin1: 29.2% for Q2'14, 25.6% for Q2'13 and 28.2% for Q1'14 1 Non-GAAP information. Refer to reconciliation in the Appendix. EX-15- 8
A. M. Castle & Co. ® APPENDIX EX-16- 9
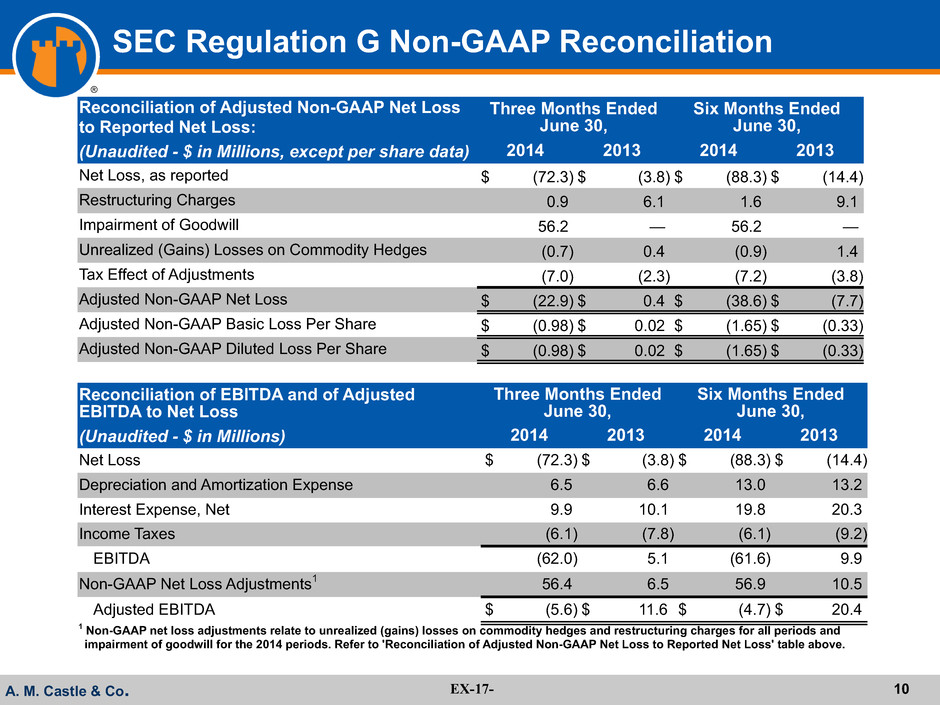
A. M. Castle & Co. ® SEC Regulation G Non-GAAP Reconciliation Reconciliation of Adjusted Non-GAAP Net Loss to Reported Net Loss: Three Months Ended June 30, Six Months Ended June 30, (Unaudited - $ in Millions, except per share data) 2014 2013 2014 2013 Net Loss, as reported $ (72.3) $ (3.8) $ (88.3) $ (14.4) Restructuring Charges 0.9 6.1 1.6 9.1 Impairment of Goodwill 56.2 — 56.2 — Unrealized (Gains) Losses on Commodity Hedges (0.7) 0.4 (0.9) 1.4 Tax Effect of Adjustments (7.0) (2.3) (7.2) (3.8) Adjusted Non-GAAP Net Loss $ (22.9) $ 0.4 $ (38.6) $ (7.7) Adjusted Non-GAAP Basic Loss Per Share $ (0.98) $ 0.02 $ (1.65) $ (0.33) Adjusted Non-GAAP Diluted Loss Per Share $ (0.98) $ 0.02 $ (1.65) $ (0.33) Reconciliation of EBITDA and of Adjusted EBITDA to Net Loss Three Months Ended June 30, Six Months Ended June 30, (Unaudited - $ in Millions) 2014 2013 2014 2013 Net Loss $ (72.3) $ (3.8) $ (88.3) $ (14.4) Depreciation and Amortization Expense 6.5 6.6 13.0 13.2 Interest Expense, Net 9.9 10.1 19.8 20.3 Income Taxes (6.1) (7.8) (6.1) (9.2) EBITDA (62.0) 5.1 (61.6) 9.9 Non-GAAP Net Loss Adjustments1 56.4 6.5 56.9 10.5 Adjusted EBITDA $ (5.6) $ 11.6 $ (4.7) $ 20.4 1 Non-GAAP net loss adjustments relate to unrealized (gains) losses on commodity hedges and restructuring charges for all periods and impairment of goodwill for the 2014 periods. Refer to 'Reconciliation of Adjusted Non-GAAP Net Loss to Reported Net Loss' table above. EX-17- 10

A. M. Castle & Co. ® SEC Regulation G Non-GAAP Reconciliation Reconciliation of Adjusted Operating Three Months Ended Six Months Ended Expenses to Operating Expenses June 30, March 31, June 30, (Unaudited - $ in Millions) 2014 2013 2014 2014 2013 Operating Expenses $ 129.8 $ 75.7 $ 72.2 $ 202.0 $ 150.0 Restructuring Charges in Operating Expenses (0.9) (5.6) (0.7) (1.6) (7.8) Impairment of Goodwill (56.2) — — (56.2) — Adjusted Operating Expenses $ 72.7 $ 70.1 $ 71.5 $ 144.2 $ 142.2 Adjusted Operating Expense Margin - calculated as Adjusted Operating Expenses divided by Net Sales 29.2% 25.6% 28.2% 28.7% 25.1% Gross Material Margin Calculation Three Months Ended Six Months Ended (Unaudited - $ in Millions) June 30, March 31, June 30, 2014 2013 2014 2014 2013 Net Sales $ 249.5 $ 273.4 $ 253.4 $ 502.9 $ 566.1 Cost of Materials - exclusive of depreciation and amortization (191.6) (201.5) (188.5) (380.1) (420.9) Gross Profit $ 57.9 $ 71.9 $ 64.9 $ 122.8 $ 145.2 Gross Material Margin - calculated as Gross Profit divided by Net Sales 23.2% 26.3% 25.6% 24.4% 25.7% EX-18- 11

A.M. Castle & Co. ® A. M. Castle & Co. NYSE: CAS Thank You EX-19- 12
