Attached files
| file | filename |
|---|---|
| 8-K - 8-K - Bridge Capital Holdings | v385027_8k.htm |
Exhibit 99.1

Investor Update Second Quarter 2014 Daniel P. Myers President Chief Executive Officer NASDAQ Global Select Market : BBNK www.bridgecapitalholdings.com Thomas A. Sa Executive Vice President Chief Financial Officer Chief Strategy Officer
FORWARD LOOKING STATEMENTS Certain matters discussed herein constitute forward - looking statements within the meaning of the Private Securities Litigation Reform Act of 1995, and are subject to the safe harbors created by that Act. Forward - looking statements describe future plans, strategies, and expectations, and are based on currently available information, expectations, assumptions, projections, and management's judgment about the Bank, the banking industry and general economic conditions. These forward looking statements are subject to certain risks and uncertainties that could cause the actual results, performance or achievements to differ materially from those expressed, suggested or implied by the forward looking statements. These risks and uncertainties include, but are not limited to: (1) competitive pressures in the banking industry; (2) changes in interest rate environment; (3) general economic conditions, nationally, regionally, and in operating markets; (4) changes in the regulatory environment; (5) changes in business conditions and inflation; (6) changes in securities markets; (7) future credit loss experience; (8) the ability to satisfy requirements related to the Sarbanes - Oxley Act and other regulation on internal control; (9) civil disturbances or terrorist threats or acts, or apprehension about the possible future occurrences of acts of this type; and (10) the involvement of the United States in war or other hostilities. The reader should refer to the more complete discussion of such risks in Bridge Capital Holdings reports on Forms 10 - K and 10 - Q on file with the SEC. 2

FINANCIAL HIGHLIGHTS Balance sheet data at QE 06 - 30 - 14; operating data 2Q14 The only small - and mid - market specialist crafting the flexible solutions that businesses need to thrive in the modern economy Be bold , venture wisely . 3 ■ Total Assets $ 1.63 billion ■ Total Loans $ 1.18 b illion ■ Total Deposits $ 1.42 billion ■ Total Stockholders' Equity $ 173.4 million ■ Market Cap $ 384.2 million ■ TBV/Share $ 10.93 ■ TCE/TA 10.66% ■ Tier 1 RBC Ratio 12.74% ■ Total RBC Ratio 14.00% ■ Cost of Deposits 8 bps ■ Net Interest Margin 5.03% ■ Efficiency Ratio 63.39% ■ ROAA 1.07% ■ ROAE 9.98% ■ Net Income $ 4.27 million ■ Diluted EPS $ 0 .27

BRIDGE BANK FRANCHISE • Focus – Business banking • 71% business C&I loan portfolio • 69% DDA funding base – San Francisco Bay A rea core geography • National technology - centric regions • Fundamental Value Drivers – Relationship banking model – Core deposit driven model to fund the business • 98% core deposits • 8 bps cost of deposits – “Fit” among diversified revenue streams • Execution – Full range of corporate banking products delivered through experienced advisors – 1 regional business center + 7 business offices – Strategic use of banking technology 4

ATTRACTIVE MARKET POTENTIAL 39.60 21.83 6.39 5.20 5.15 3.23 2.29 2.13 1.42 1.06 0.40 0 5 10 15 20 25 30 35 40 45 50 B of A Wells Fargo Citibank Chase SVB Union Comerica B of West US Bank East West 1 Office of Economic Development, City of San Jose; 2013 2 US Census estimate 2012 3 Bureau of Labor Statistics September 26, 2013 4 FDIC data at June 30, 2013 5 PricewaterhouseCoopers Money Tree Survey as of June 30, 2014 6 CA Employment Development Department Q3 2012 data (most recent available ) • San Jose 10 th largest US city 1 • 5 million regional population 2 • Among highest median family and per capita incomes in US 3 • $327 billion deposit market 4 • Largest concentration of technology company formation and finance in the world 1 • Silicon Valley received 53% of US venture capital investment ($12.0b of $22.7b – YTD 2014) 5 • 216k HQ businesses 6 % Deposits Santa Clara, San Mateo, San Francisco and Alameda Counties* 5

NATIONAL INNOVATION SECTOR INNOVATION SECTOR Active in tech - centric regions receiving 80%+ of US VC investment into technology companies - Silicon Valley – 53% of US venture capital investment ($12.0b of $22.7b – YTD2014) 1 - California leads nation in tech employment o LA/Orange County – 5% of US venture capital investment ($1.1b of $22.7b – YTD 2014) 1 - Massachusetts – 2 nd highest concentration of tech workers 2 o New England – 10% of US venture capital investment ($2.2b of $22.7b – YTD 2014) 1 - Virginia – 4 th highest concentration of tech workers 2 - Dallas among the nation’s fastest - growing areas – 6 th largest concentration of tech workers 2 1 PricewaterhouseCoopers Money Tree Survey as of June 30, 2014 2 Tech America Foundation: Cyberstates 2013 San Jose Palo Alto East Bay San Francisco Dallas Boston Reston 6 Orange County
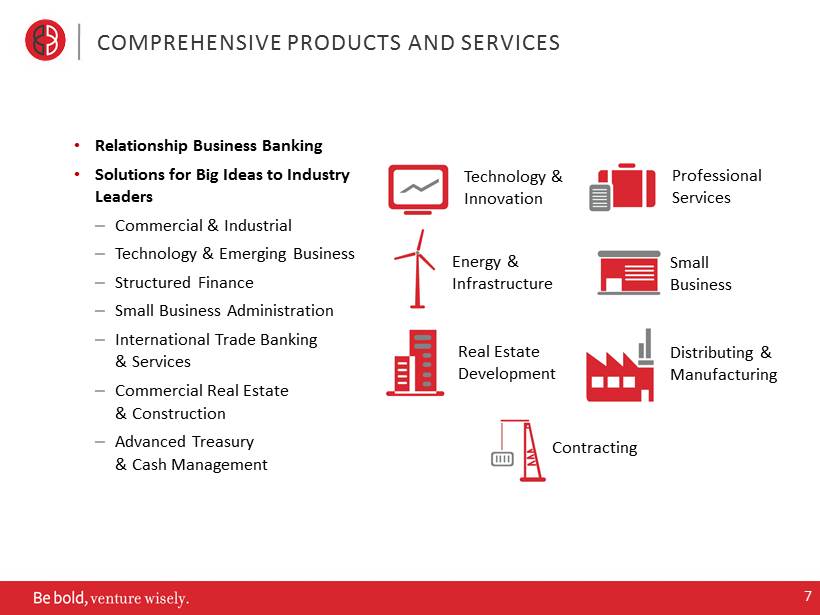
COMPREHENSIVE PRODUCTS AND SERVICES Distributing & Manufacturing Energy & Infrastructure Professional Services Real Estate Development Small Business Technology & Innovation Contracting • Relationship Business Banking • Solutions for Big Ideas to Industry Leaders – Commercial & Industrial – Technology & Emerging Business – Structured Finance – Small Business Administration – I nternational Trade Banking & Services – Commercial Real Estate & Construction – Advanced Treasury & Cash Management 7
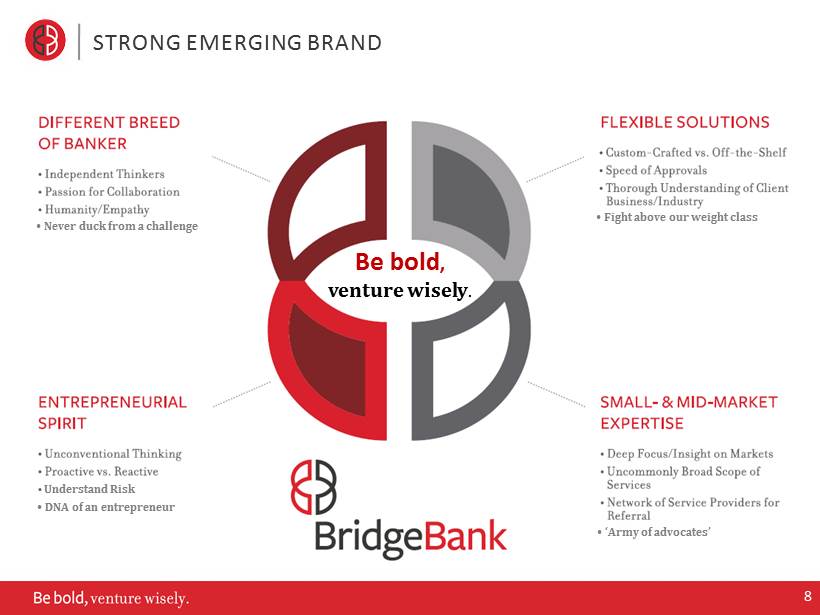
Be bold , venture wisely . STRONG EMERGING BRAND 8 Understand Risk • DNA of an entrepreneur • Never duck from a challenge • Fight above our weight class • ‘Army of advocates’

Q2 2014 SUMMARY – GROWING FORWARD • Robust growth driven by new client acquisition – +12% deposit growth ( YoY ) – +18% loan growth ( YoY ) • Increasing revenue and earnings – Revenue +11% ( YoY ) – +26% pre - tax, pre - provision income ( QoQ ) – YTD ‘14 Net Income $ 8 .0 million +52% ( YoY ) – YTD ’14 EPS $0.51 +46% ( YoY ) • Consistent high quality funding base – 98% core – 69 % DDA – 8 bps cost of deposits • Strong asset quality – NPAs 0.79% of total assets • Capital to support growth and opportunity – TCE of 10.66% 9 We believe that when entrepreneurs and business owners succeed, everyone benefits.

EXPANDING MARKET PRESENCE $250 $500 $750 $1,000 $1,250 $1,500 $1,750 2005 2006 2007 2008 2009 2010 2011 2012 2013 2Q14 $ Millions Average Total Assets • Purely organic growth • Core deposit driven $ 1.63b Total Assets EOP Q2 ’14 10

FOCUS ON CORE DEPOSITS 40% 31% 30% 34% 47% 52% 67% 63% 69% 69% $0 $250 $500 $750 $1,000 $1,250 $1,500 2005 2006 2007 2008 2009 2010 2011 2012 2013 2Q14 $ Millions (EOP) Deposit Mix Noninterest-bearing Demand MM / IBD Certificates of Deposit • 98% core deposits • Cost of deposits – 8 bps 11
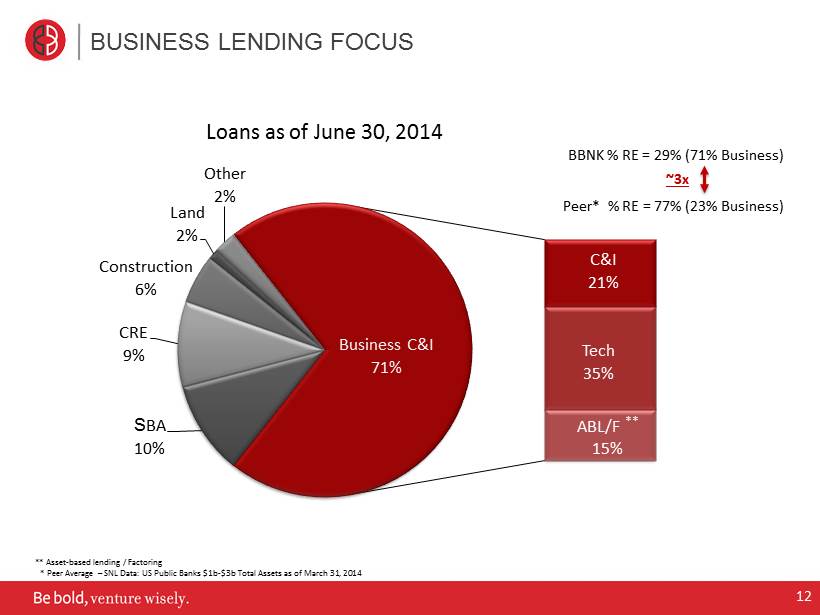
BUSINESS LENDING FOCUS S BA 10% CRE 9% Construction 6% Land 2% Other 2% C&I 21% Tech 35% ABL/F ** 15% Business C&I 71% Loans as of June 30, 2014 BBNK % RE = 29% (71% Business) Peer* % RE = 77% (23% Business) ~3x 12 * Peer Average – SNL Data: US Public Banks $1b - $3b Total Assets as of March 31, 2014 ** Asset - based lending / Factoring
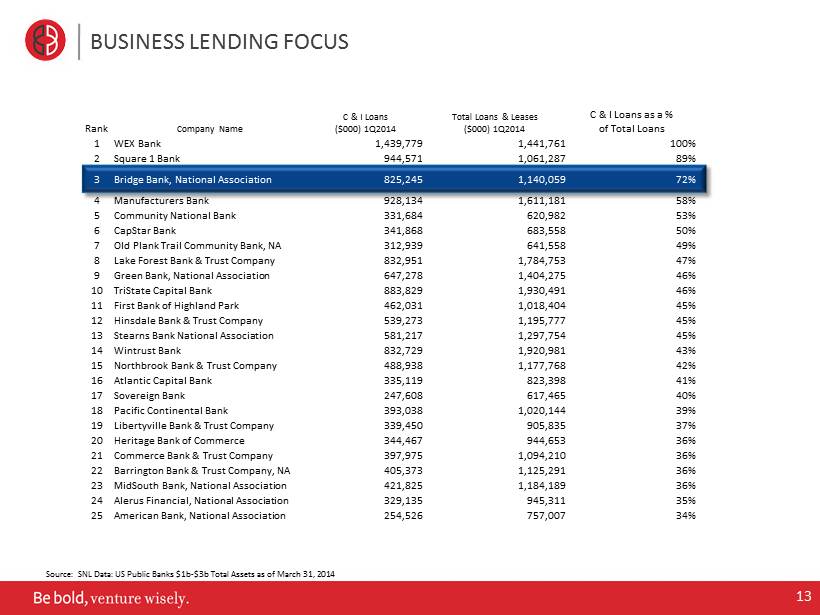
BUSINESS LENDING FOCUS Source: SNL Data: US Public Banks $1b - $3b Total Assets as of March 31, 2014 13 Rank Company Name C & I Loans ($000) 1Q2014 Total Loans & Leases ($000) 1Q2014 C & I Loans as a % of Total Loans 1 WEX Bank 1,439,779 1,441,761 100% 2 Square 1 Bank 944,571 1,061,287 89% 3 Bridge Bank, National Association 825,245 1,140,059 72% 4 Manufacturers Bank 928,134 1,611,181 58% 5 Community National Bank 331,684 620,982 53% 6 CapStar Bank 341,868 683,558 50% 7 Old Plank Trail Community Bank, NA 312,939 641,558 49% 8 Lake Forest Bank & Trust Company 832,951 1,784,753 47% 9 Green Bank, National Association 647,278 1,404,275 46% 10 TriState Capital Bank 883,829 1,930,491 46% 11 First Bank of Highland Park 462,031 1,018,404 45% 12 Hinsdale Bank & Trust Company 539,273 1,195,777 45% 13 Stearns Bank National Association 581,217 1,297,754 45% 14 Wintrust Bank 832,729 1,920,981 43% 15 Northbrook Bank & Trust Company 488,938 1,177,768 42% 16 Atlantic Capital Bank 335,119 823,398 41% 17 Sovereign Bank 247,608 617,465 40% 18 Pacific Continental Bank 393,038 1,020,144 39% 19 Libertyville Bank & Trust Company 339,450 905,835 37% 20 Heritage Bank of Commerce 344,467 944,653 36% 21 Commerce Bank & Trust Company 397,975 1,094,210 36% 22 Barrington Bank & Trust Company, NA 405,373 1,125,291 36% 23 MidSouth Bank, National Association 421,825 1,184,189 36% 24 Alerus Financial, National Association 329,135 945,311 35% 25 American Bank, National Association 254,526 757,007 34%

2.00% 3.00% 4.00% 5.00% 6.00% 7.00% 8.00% 2005 2006 2007 2008 2009 2010 2011 2012 2013 1Q14 2Q14 Net Interest Margin BBNK BAC WFC CMA SIVB HTBK HIGH VALUE BUSINESS BBNK: 5.03% * Peer Average – SNL Data: US Public Banks $1b - $3b Total Assets as of March 31, 2014 Peer* 3.75% 14
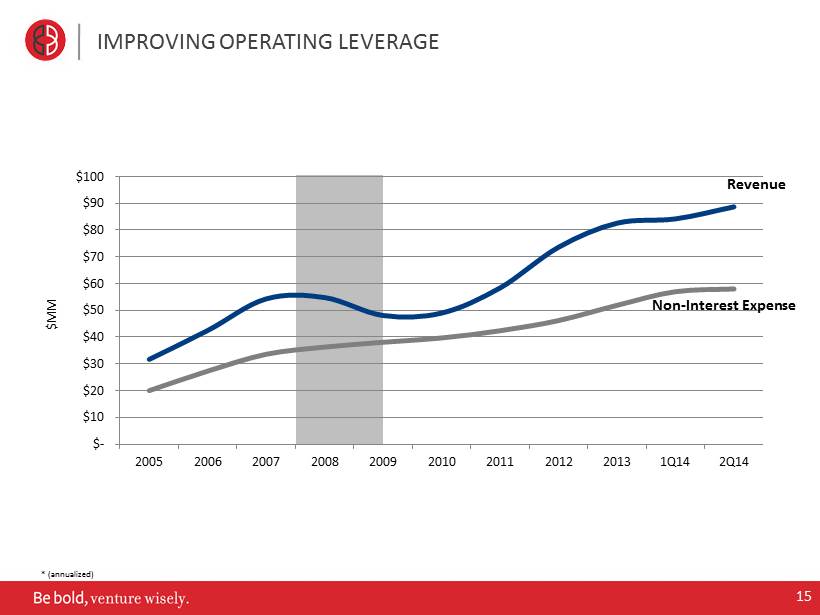
$- $10 $20 $30 $40 $50 $60 $70 $80 $90 $100 2005 2006 2007 2008 2009 2010 2011 2012 2013 1Q14 2Q14 $MM Revenue Non - Interest Expense IMPROVING OPERATING LEVERAGE * (annualized) 15

$100 $200 $300 $400 2005 2006 2007 2008 2009 2010 2011 2012 2013 1Q14 2Q14 Revenue Per Employee ( $000) BBNK Peer Group* EFFECTIVE REVENUE GENERATION *= Peer Average Rev/Employee – SNL Data: US Public Banks $1b - $3b Total Assets as of March 31, 2014 (annualized) BBNK 182% of Peer* Group Average 16

0% 1% 2% 3% 4% 5% Q3 '08 Q4 '08 Q1 '09 Q2 '09 Q3 '09 Q4 '09 Q1 '10 Q2 '10 Q3 '10 Q4 '10 Q1 '11 Q2 '11 Q3 '11 Q4 '11 Q1 '12 Q2 '12 Q3 '12 Q4 '12 Q1 '13 Q2 '13 Q3 '13 Q4 '13 Q1 '14 Q2 '14 NPL/Total Loans NPA/Total Assets STRONG CREDIT QUALITY Peer* NPA/Assets 1.25% * Peer Average – SNL Data: US Public Banks $1b - $3b Total Assets as of March 31, 2014 17

$(5) $- $5 $10 $15 $20 $25 $30 $35 -0.5% 0.0% 0.5% 1.0% 1.5% 2.0% 2.5% 3.0% 3.5% NCO/Total Loans (%) ** ALLR/Loans (%) Provision ($) ROBUST RESERVES 1.96% * Peer Average – SNL Data: US Public Banks $1b - $3b Total Assets as of March 31, 2014 $0 Peer* 1.56% 18 • NPL Coverage Ratio 179.2%
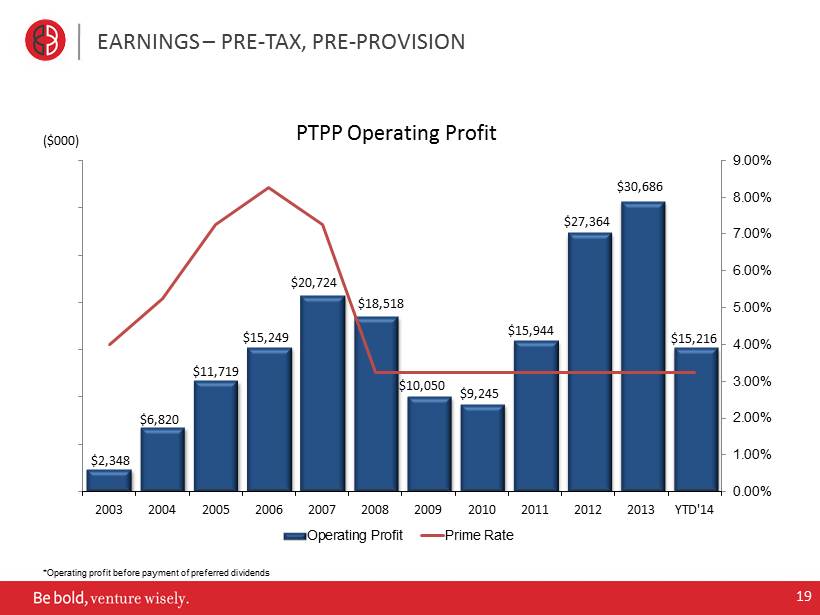
$2,348 $6,820 $11,719 $15,249 $20,724 $18,518 $10,050 $9,245 $15,944 $27,364 $30,686 $15,216 0.00% 1.00% 2.00% 3.00% 4.00% 5.00% 6.00% 7.00% 8.00% 9.00% $0 $5,000 $10,000 $15,000 $20,000 $25,000 $30,000 $35,000 2003 2004 2005 2006 2007 2008 2009 2010 2011 2012 2013 YTD'14 PTPP Operating Profit Operating Profit Prime Rate EARNINGS – PRE - TAX, PRE - PROVISION ($000) *Operating profit before payment of preferred dividends 19

$(7,341) $1,505 $3,037 $5,725 $8,634 $10,866 $ 1,435 $2,591 $ 7,847 $13,804 $14,711 $7,983 2003 2004 2005 2006 2007 2008 2009 2010 2011 2012 2013 2Q14 EARNINGS ($000) *Operating profit before payment of preferred dividends 20

CAPITAL FOR GROWTH AND OPPORTUNITY * Peer Average – SNL Data: US Public Banks $1b - $3b Total Assets as of March 31, 2014 TCE Ratio Leverage Total RBC Regulatory Minimum 5.00% 10.00% Peer* 8.96% 10.33% 15.62% BBNK 10.66% 11.74% 14.00% 0% 5% 10% 15% 20% As of June 30, 2014 21

CATALYSTS FOR EARNINGS GROWTH • Continued organic growth opportunities • Unique strategic profile • Increased utilization rates on LOC – Currently in the mid - high 30% range • NIM expansion – B enefit from asset sensitivity as rates rise • Low levels of credit stress • Noninterest income opportunities 22

CONTACT INFORMATION Investor Relations Contact: Thomas A. Sa Bridge Capital Holdings 55 Almaden Blvd., Suite 100 San Jose, CA 95113 (408) 423 - 8500 ir@bridgebank.com 23 NASDAQ Global Select Market: BBNK www.bridgecapitalholdings.com