Attached files
| file | filename |
|---|---|
| 8-K - 8-K - BERKSHIRE HILLS BANCORP INC | a14-17965_18k.htm |
Exhibit 99.1
|
|
KBW 2014 Community Bank Conference July 29-30 |

|
|
Who We Are Full Service Regional Bank with a distinctive brand and culture, strong middle market opportunities and a solid foundation for growth Assets: $6.3 billion Loans: $4.5 billion Deposits: $4.5 billion Wealth AUM: $1.3 billion Annualized Revenue: $235 million Branches: 90 plus lending offices Footprint: New England and Central New York Market Capitalization: $580 million NYSE: BHLB 1 |

|
|
Current Initiatives Growth Organic Market Share Growth Fee Income Growth Footprint New York Branch Acquisition Redefining Customer Engagement Culture New Chairman – Bill Ryan New CFO – Josephine Iannelli Team Recruitment 2 |

|
|
Focus on Loan Growth $ Millions 8% 14% 12% 21% Double Digit Annualized Loan Growth Relationship model Multiple regions Leveraging deal flow from team recruitment Expanded cross sales across footprint Resource for smaller banks 3 |

|
|
Focus on Loan Growth Success with recruited commercial lending teams in middle-market space driving growth Key Characteristics Established, well respected teams formerly attached to large banks focused outside of our regions Solid relationships within community Breakeven within first year Teams producing solid results 4 *NY small business team added July 2014 * |

|
|
Focus on Fee Income Growth Emphasis on building fee income and enhancing cross-sell initiatives Strong swap fee demand Solid referral pipeline Re-engineered across footprint New cross sell initiatives launched NY Branch Acquisition New leadership and geographic reach 5 |

|
|
Focus on Retail Growth 6 Redefining Customer Engagement Branch initiatives CNY acquisition Right-sized footprint Building for the future Relationship banking Online/Mobile Demand deposit account focus |

|
|
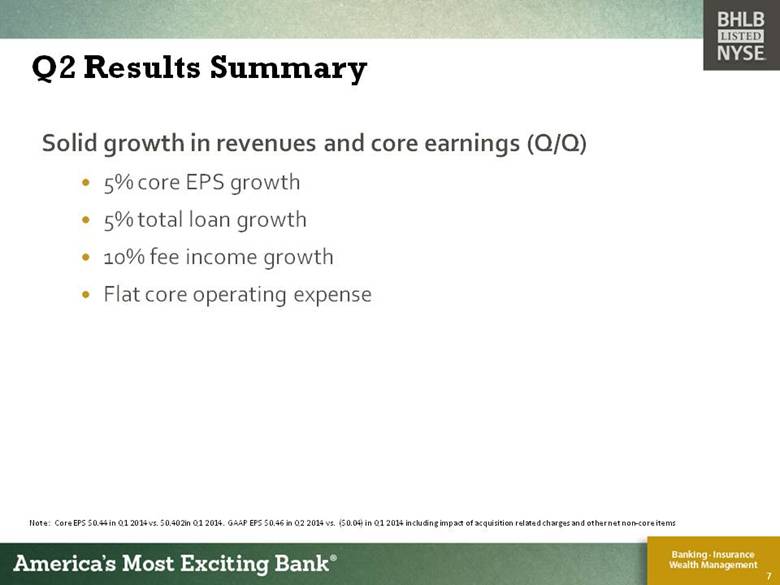
Q2 Results Summary Solid growth in revenues and core earnings (Q/Q) 5% core EPS growth 5% total loan growth 10% fee income growth Flat core operating expense 7 Note: Core EPS $0.44 in Q1 2014 vs. $0.402in Q1 2014. GAAP EPS $0.46 in Q2 2014 vs. ($0.04) in Q1 2014 including impact of acquisition related charges and other net non-core items |
|
|
Focus on Profitability Grew EPS 20% before purchased loan accretion 1H14 Positive operating leverage from strong revenue growth and flat core expenses Efficiency ratio below 63% - with goal of returning to sub-60% Y/Y core expenses down 30 bps in relation to average assets Improved asset sensitivity of interest income Double-digit core ROTE drives TBV growth and sustains revenue growth Core ROTE 11.3% (up 5% q/q) 4% TBV growth (q/q) 9% annualized core revenue growth (q/q) 8 Note: EPS accretion based on comparison to 4Q13; Please see appendix for discussion of non-GAAP numbers. |

|
|
Why Invest in Us Strong top and bottom line growth Diversified revenue drivers Established footprint in attractive markets Experienced leadership team AMEB culture Solid internal capital generation supports growth Focused on long-term profitability goals and shareholder value 9 |

|
|
Forward Looking Statements. This document contains certain forward-looking statements as defined in the Private Securities Litigation Reform Act of 1995. These statements include statements about anticipated financial results. Forward-looking statements can be identified by the fact that they do not relate strictly to historical or current facts. They often include words like "believe," "expect," "anticipate," "estimate," and "intend" or future or conditional verbs such as "will," "would," "should," "could" or "may.“ There are several factors that could cause actual results to differ significantly from expectations described in the forward-looking statements. For a discussion of such factors, please see Berkshire’s most recent reports on Forms 10-K and 10-Q filed with the Securities and Exchange Commission and available on the SEC's website at www.sec.gov. Berkshire does not undertake any obligation to update forward-looking statements made in this document. NON-GAAP FINANCIAL MEASURES. This presentation references non-GAAP financial measures incorporating tangible equity and related measures, and core earnings excluding merger and other non-recurring costs. These measures are commonly used by investors in evaluating business combinations and financial condition. GAAP earnings are lower than core earnings primarily due to merger and systems conversion related expenses. Reconciliations are in earnings releases at www.berkshirebank.com. 10 |

|
|
Financial Performance & Goals Note: Core results exclude merger, divestiture, systems conversion, accounting correction and restructuring net charges after tax totaling $10.4 million in 2011, $11.1 million in 2012 and $5.6million in 2013. GAAP EPS for those periods was $0.97, $1.49 and $1.65 respectively. Core ROTE includes after-tax amortization of intangible assets in core return. Book value per share was $26.09, $26.53 and $27.08 for the above respective periods. Financial goals are future run-rate targeted in stages over the medium term. 1H14 core revenue growth compared to 4Q13. GAAP measures in 1H14 were EPS of $0.84 annualized, book value per share of $27.49 and net non-core charges were $11.0 million. 11 2011 2012 2013 1H14 Financial Goals Core revenue growth 31% 40% 13% 13% ann 7 - 10%+ ann Net interest margin 3.57% 3.62% 3.63% 3.31% 3.30%+ Fee income/revenue 24% 26% 22% 25% 25%+ Efficiency ratio 63% 59% 61% 63% < 60% Core ROA 0.80% 0.98% 0.88% 0.71% 1%+ Core ROE 5.8% 7.5% 6.9% 6.2% 10%+ Core ROTE 11.3% 13.8% 12.4% 11.1% 15%+ Core EPS $1.54 $1.98 $1.87 $1.72 ann 10%+ann growth Dividends/share $0.65 $0.69 $0.72 $0.72 ann Competitive yield Tangible BV per share $15.53 $15.63 $16.27 $16.40 5%+ ann growth |

|
|
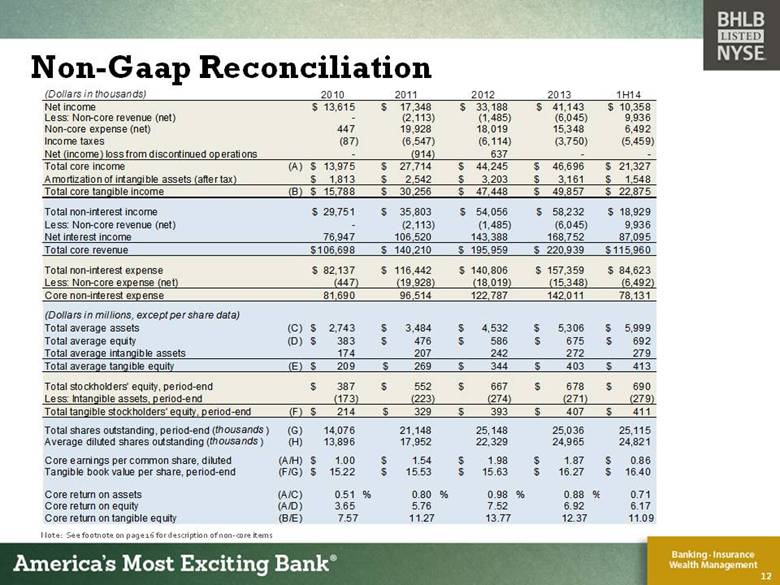
Non-Gaap Reconciliation Note: See footnote on page 16 for description of non-core items 12 (Dollars in thousands) 2010 2011 2012 2013 1H14 Net income 13,615 $ 17,348 $ 33,188 $ 41,143 $ 10,358 $ Less: Non-core revenue (net) - (2,113) (1,485) (6,045) 9,936 Non-core expense (net) 447 19,928 18,019 15,348 6,492 Income taxes (87) (6,547) (6,114) (3,750) (5,459) Net (income) loss from discontinued operations - (914) 637 - - Total core income (A) 13,975 $ 27,714 $ 44,245 $ 46,696 $ 21,327 $ Amortization of intangible assets (after tax) 1,813 $ 2,542 $ 3,203 $ 3,161 $ 1,548 $ Total core tangible income (B) 15,788 $ 30,256 $ 47,448 $ 49,857 $ 22,875 $ Total non-interest income 29,751 $ 35,803 $ 54,056 $ 58,232 $ 18,929 $ Less: Non-core revenue (net) - (2,113) (1,485) (6,045) 9,936 Net interest income 76,947 106,520 143,388 168,752 87,095 Total core revenue 106,698 $ 140,210 $ 195,959 $ 220,939 $ 115,960 $ Total non-interest expense 82,137 $ 116,442 $ 140,806 $ 157,359 $ 84,623 $ Less: Non-core expense (net) (447) (19,928) (18,019) (15,348) (6,492) Core non-interest expense 81,690 96,514 122,787 142,011 78,131 (Dollars in millions, except per share data) Total average assets (C) 2,743 $ 3,484 $ 4,532 $ 5,306 $ 5,999 $ Total average equity (D) 383 $ 476 $ 586 $ 675 $ 692 $ Total average intangible assets 174 207 242 272 279 Total average tangible equity (E) 209 $ 269 $ 344 $ 403 $ 413 $ Total stockholders' equity, period-end 387 $ 552 $ 667 $ 678 $ 690 $ Less: Intangible assets, period-end (173) (223) (274) (271) (279) Total tangible stockholders' equity, period-end (F) 214 $ 329 $ 393 $ 407 $ 411 $ Total shares outstanding, period-end ( thousands ) (G) 14,076 21,148 25,148 25,036 25,115 Average diluted shares outstanding ( thousands ) (H) 13,896 17,952 22,329 24,965 24,821 Core earnings per common share, diluted (A/H) 1.00 $ 1.54 $ 1.98 $ 1.87 $ 0.86 $ Tangible book value per share, period-end (F/G) 15.22 $ 15.53 $ 15.63 $ 16.27 $ 16.40 $ Core return on assets (A/C) 0.51 % 0.80 % 0.98 % 0.88 % 0.71 Core return on equity (A/D) 3.65 5.76 7.52 6.92 6.17 Core return on tangible equity (B/E) 7.57 11.27 13.77 12.37 11.09 |
|
|
If you have any questions, please contact: Allison O’Rourke 99 North Street Pittsfield, MA 01202 Investor Relations Officer (413) 236-3149 aorourke@berkshirebank.com |
