Attached files
| file | filename |
|---|---|
| 8-K - 8-K - NTELOS HOLDINGS CORP. | d766266d8k.htm |
| EX-99.3 - EX-99.3 - NTELOS HOLDINGS CORP. | d766266dex993.htm |
| EX-99.1 - EX-99.1 - NTELOS HOLDINGS CORP. | d766266dex991.htm |
 2Q14 Earnings Presentation
July 28, 2014
NASDAQ: NTLS
Exhibit 99.2 |
 Presentation of Financial and Other Important Information
2
USE OF NON-GAAP FINANCIAL MEASURES
Included in this presentation are certain non-GAAP financial measures that are
not determined in accordance with US generally accepted accounting
principles (“GAAP”). These financial performance measures are not indicative of cash provided or used by operating activities and
exclude the effects of certain operating, capital and financing costs and may
differ from comparable information provided by other companies, and they
should not be considered in isolation, as an alternative to, or more meaningful than measures of financial performance determined in
accordance with US generally accepted accounting principles. These financial
performance measures are commonly used in the industry and are presented
because NTELOS believes they provide relevant and useful information to investors. NTELOS utilizes these financial
performance measures to assess its ability to meet future capital expenditure and
working capital requirements, to incur indebtedness if necessary,
and
to
fund
continued
growth.
NTELOS
also
uses
these
financial
performance
measures
to
evaluate
the
performance
of
its
business, for budget planning purposes and as factors in its employee compensation
programs. Adjusted EBITDA is defined as net income attributable to NTELOS
Holdings Corp. before interest, income taxes, depreciation and amortization, accretion of asset retirement obligations,
deferred SNA revenue, gain/loss on derivatives, net income attributable to
non-controlling interests, other expenses/income, equity based
compensation charges, business separation charges, certain employee separation
charges, gain/loss on sale of assets, secondary offering costs and net loss
from discontinued operations and costs related to the separation of the wireless and wireline companies.
SPECIAL NOTE REGARDING FORWARD-LOOKING STATEMENTS
Any
statements
contained
in
this
presentation
that
are
not
statements
of
historical
fact,
including
statements
about
our
beliefs
and
expectations,
are forward-looking
statements
and
should
be
evaluated
as
such.
The
words
“anticipates,”
“believes,”
“expects,”
“intends,”
“plans,”
“estimates,”
“targets,”
“projects,”
“should,”
“may,”
“will”
and similar words and expressions are intended to identify forward-looking
statements. Such forward-looking statements reflect, among other things,
our current expectations, plans and strategies, and anticipated financial results, all of
which are subject to known and unknown risks, uncertainties and factors that may
cause our actual results to differ materially from those expressed or
implied by these forward-looking statements. Many of these risks are beyond our ability to control or predict. Because of these
risks,
uncertainties
and
assumptions,
you
should
not
place
undue
reliance
on
these
forward-looking
statements.
Furthermore,
forward-looking
statements speak only as of the date they are made. We do not undertake any
obligation to update or review any forward-looking information, whether
as a result of new information, future events or otherwise. Important factors with respect to any such forward-looking statements,
including certain risks and uncertainties that could cause actual results to differ
from those contained in the forward-looking statements, include, but are
not limited to: our ability to attract and retain retail subscribers to our services; our dependence on our strategic relationship
with Sprint Corporation (“Sprint”); a potential increase in roaming rates
and wireless handset subsidy costs; rapid development and intense
competition in the telecommunications industry; our ability to finance, design,
construct and realize the benefits of any planned network technology
upgrade; our ability to acquire or gain access to additional spectrum; the potential to experience a high rate of customer turnover;
the potential for competitors to build networks in our markets; cash and capital
requirements; operating and financial restrictions imposed by our credit
agreement; adverse economic conditions; federal and state regulatory fees, requirements and developments; loss of ability to use
our current cell sites; our continued reliance on indirect channels of retail
distribution; our reliance on certain suppliers and vendors; and other
unforeseen
difficulties
that
may
occur.
These
risks
and
uncertainties
are
not
intended
to
represent
a
complete
list
of
all
risks
and
uncertainties
inherent in our business, and should be read in conjunction with
the more detailed cautionary statements and risk factors included in our SEC
filings, including our most recent Annual Report filed on Form
10-K. |
 Agenda
3
Michael Huber, Chairman
Steb Chandor, Chief Financial Officer
Financial and Operational Highlights
Guidance Review
Q&A Session
Management Transition Update |
 Rod will be nTelos’s principal executive officer and have responsibility for
day-to-day operations
Michael Huber, Chairman of the nTelos Board of Directors, will assume oversight of
strategic relationships and external communications, including with
investors Management Transition
4
Effective July 28, 2014, Jim Hyde resigned as President & CEO, and from Board
of Directors Rod Dir, currently an nTelos Director, will assume the role of
President and COO Three decades of wireless and telecommunications
experience Former COO of Cincinnati Bell |
 Strategic Objectives
5
Implementing our
strategic
relationship with
Sprint to enhance
nTelos’s operations
Strengthening our
retail sales
performance
Improving our
processes and
becoming more
efficient
Increasing the
strategic relevance
of our assets |
 Select Second Quarter Developments
6
Renewal of Sprint agreement
Postpay subscriber growth continues while prepay weakens
Retail wireless environment increasingly competitive
4G LTE roll out continues |
 Provides access to Sprint’s 800 MHz/1.9 GHz/2.5 GHz spectrum and vendor
relationships Solidifies Sprint relationship through 2022 and allows for
additional collaboration Extended
SNA
Agreement
–
Beneficial
Impact
Contributes significant and recurring wholesale revenues to nTelos
Attracts high-value customers by facilitating a robust LTE experience in SNA
territory Provides 4G LTE nationwide roaming for nTelos retail
customers 7 |
 Retail Growth Drivers Going Forward
8
nPower 2.0
Equipment Installment Plan (EIP)
4G LTE roll out
Prepay plan rate resets
Prices as of July 28, 2014 |
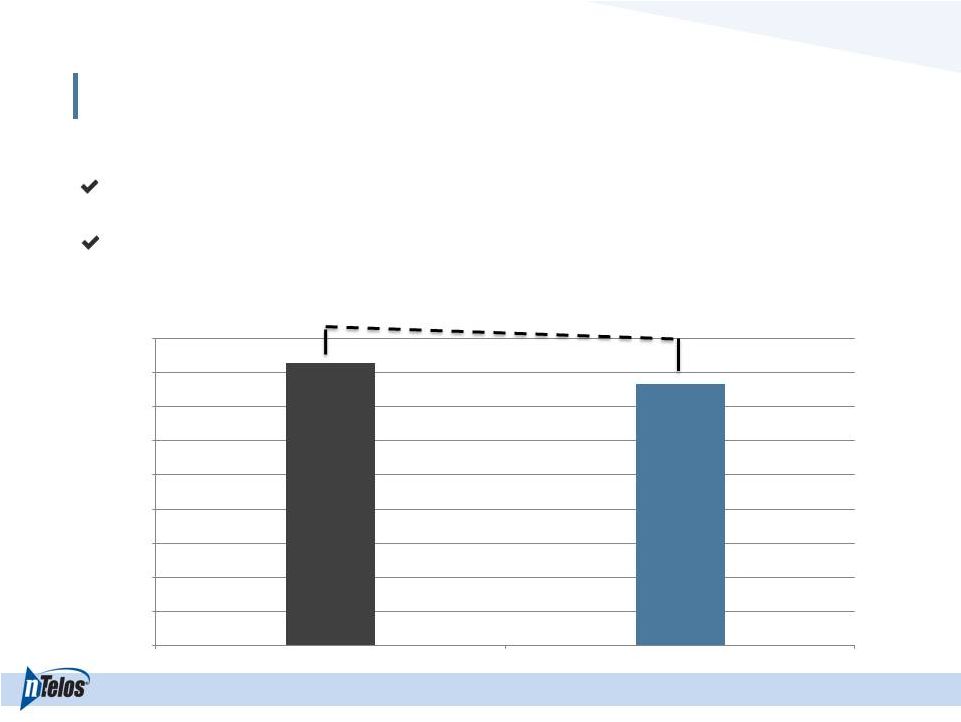
 Operating Revenue Remains Steady
9
millions
-2%
2Q14 revenue decreased 2% from 2Q13 to $117.8 million
$0.0
$20.0
$40.0
$60.0
$80.0
$100.0
$120.0
$140.0
2Q 2013
2Q 2014
Retail
Wholesale & Other |
 Retail Revenue Remains Stable
10
millions
+1%
2Q14 retail revenue decreased 2% sequentially and increased 1% from 2Q13 to $79.5
million
$0.0
$10.0
$20.0
$30.0
$40.0
$50.0
$60.0
$70.0
$80.0
$90.0
2Q 2013
2Q 2014 |
 Wholesale/Other Revenue Impacted By SNA Rate Reset
11
millions
-8%
2Q14 wholesale/other revenue decreased 8% from 2Q13 to $38.3 million
2Q14 billed SNA revenue decreased 3% from 1Q14 to $38.0 million (reconciliation
provided in earnings release)
$0.0
$5.0
$10.0
$15.0
$20.0
$25.0
$30.0
$35.0
$40.0
$45.0
2Q 2013
2Q 2014 |
 Total Subscribers
12
+1%
Subscribers up 1% year-over-year to approximately 458,100
1
Reflects
reduction
of
2,100
postpay
and
8,200
prepay
subscribers
from
Company-initiated
terminations
and
changes
in
business
rules
As of June 30, 2014, postpay subscribers made up 67% of subscriber base
1
0
50,000
100,000
150,000
200,000
250,000
300,000
350,000
400,000
450,000
500,000
2Q 2013
Prepaid
Subscribers
Postpaid
Subscribers
2Q 2014 |
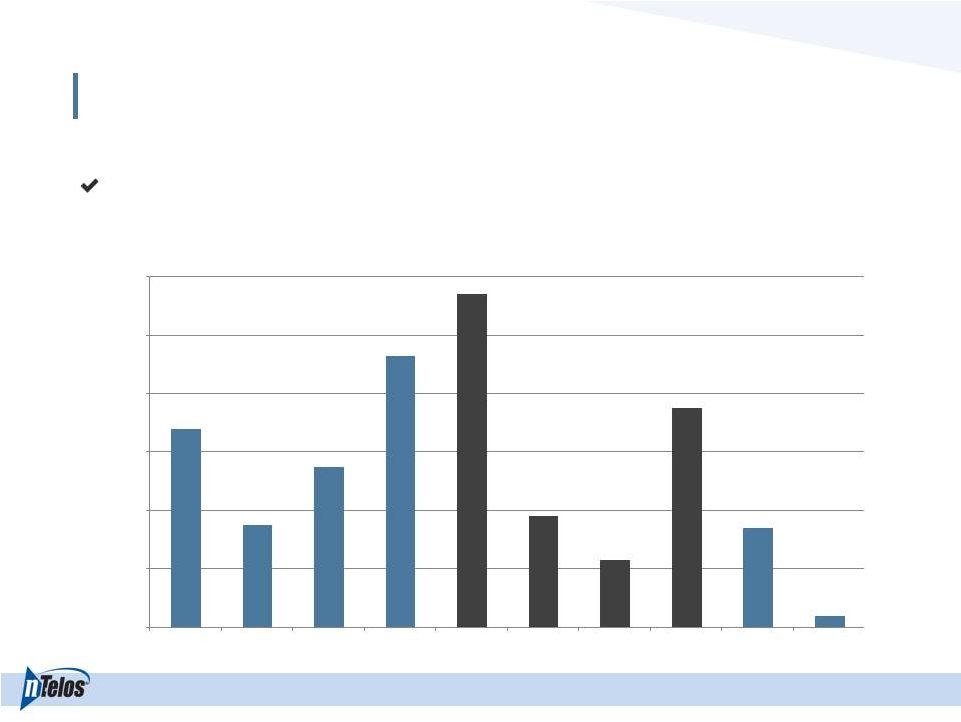 Subscribers –
Net Addition Trend
13
Tenth consecutive quarter of positive net adds
6,800
3,500
5,500
9,300
11,400
3,800
2,300
7,500
3,400
400
0
2,000
4,000
6,000
8,000
10,000
12,000
1Q 2012
2Q 2012
3Q 2012
4Q 2012
1Q 2013
2Q 2013
3Q 2013
4Q 2013
1Q 2014
2Q 2014 |
 Average Revenue Per Account (ARPA)
14
ARPA
Subscribers Per Account
2Q14 ARPA up 3% year-over-year to $137.20
2Q14 postpay subscribers per account of 2.2
+3%
$133.34
$136.90
$136.88
$137.47
$137.20
2.0
2.1
2.2
2.3
$0.00
$20.00
$40.00
$60.00
$80.00
$100.00
$120.00
$140.00
$160.00
2Q 2013
3Q 2013
4Q 2013
1Q 2014
2Q 2014
Subscribers Per Account |
 Operational Expenses
15
($ in millions)
2Q14
2Q13
Cost of sales and services
$47.4
$42.6
Customer operations
$31.3
$30.0
Corporate operations
$9.2
$7.8
Depreciation & Amortization
$19.9
$20.4
Gain on Sale of Intangible Assets
-
($4.4)
$107.9
$96.3
Increase of 12% (or 7% excluding the 2013 one-time gain) driven by higher
retention and network costs |
 Adjusted EBITDA
16
millions
Recent EBITDA performance reflects:
Increased network expense associated with LTE upgrade
Increased retention expense driven by upgrades
Steady overall revenues
$41
$46
$27
$34
$34
$0
$5
$10
$15
$20
$25
$30
$35
$40
$45
$50
2Q 2013
3Q 2013
4Q 2013
1Q 2014
2Q 2014 |
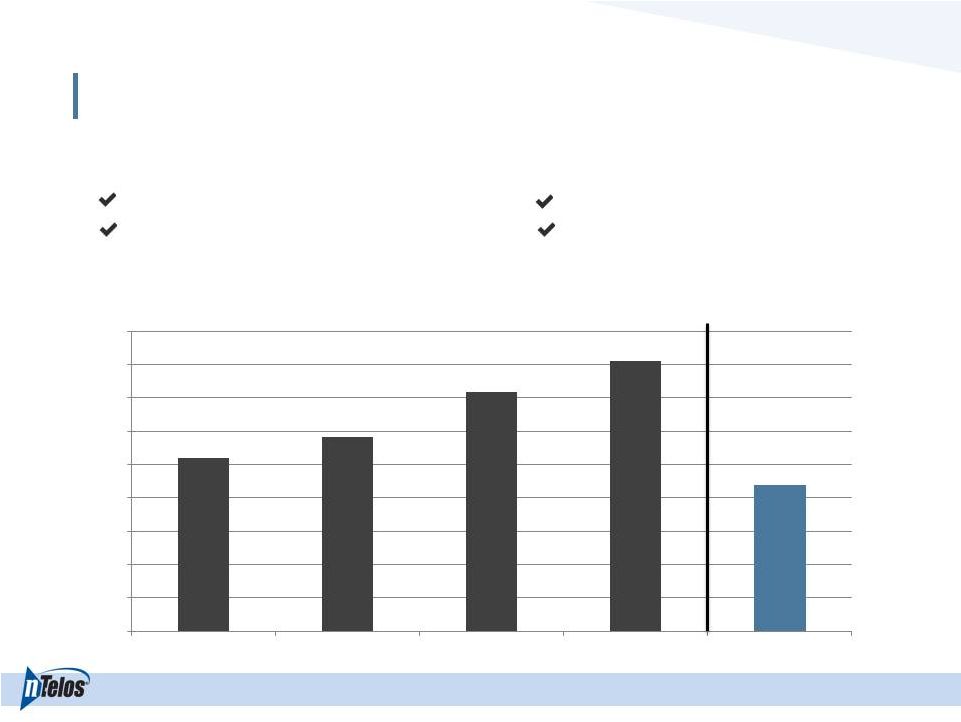 Capital Investment
17
millions
Catalysts:
2011-2012 Cell site expansion
2013-2014 Initial LTE deployment
Status:
1,445 cell sites as of June 30, 2014
LTE network covers over 2.8 million POPs
$52
$58
$72
$81
$44
$0
$10
$20
$30
$40
$50
$60
$70
$80
$90
FY 2010
FY 2011
FY 2012
FY 2013
YTD 2014 |
  Capitalization Overview
($ in millions)
June 30, 2014
Cash, unrestricted
$108.3
Total Debt
$527.8
Net Debt
$419.5
LTM Adjusted EBITDA
$140.6
Secured Term Loan
$526.9
Net Debt Leverage
3.0x
18 |
 Guidance (as of July 28, 2014)
19
For the year ended December 31, 2014 (unchanged):
Adjusted
EBITDA
of
$128
-
$135
million
CapEx
of
$110
-
$120
million |
 Summary
20
Implementing our
strategic
relationship with
Sprint to enhance
nTelos’s operations
Strengthening our
retail sales
performance
Improving our
processes and
becoming more
efficient
Increasing the
strategic relevance
of our assets |
 Questions & Answers |
 Appendix |
 Adjusted EBITDA Reconciliation
23
NTELOS Holdings Corp.
Reconciliation of Net Income Attributable to NTELOS Holdings Corp. to Adjusted EBITDA
(In thousands)
2Q14
1Q14
4Q13
3Q13
2Q13
Net Income Attributable to NTELOS Holdings Corp.
484
$
1,286
$
(784)
$
10,583
$
9,386
$
Net income attributable to noncontrolling interests
373
436
403
588
541
Net Income
857
1,722
(381)
11,171
9,927
Interest expense
8,315
7,959
7,504
7,480
7,398
Income taxes
640
1,110
80
8,340
6,380
Other expense (income), net
92
1,072
161
431
(151)
Operating income
9,904
11,863
7,364
27,422
23,554
Depreciation and amortization
19,929
19,067
17,486
16,559
20,443
Gain on sale of intangible assets
-
-
-
-
(4,442)
Accretion of asset retirement obligations
331
315
171
135
173
Equity-based compensation
1,283
1,311
1,330
1,442
1,460
SNA Straight Line Adjustment
2,043
1
-
-
-
-
Other
874
2
1,367
3
375
4
-
-
Adjusted EBITDA
34,364
$
33,923
$
26,726
$
45,558
$
41,188
$
See Form 8-K filed with the SEC on March 18, 2014 for
additional information. 4
4Q13 $0.4 million related to secondary offering cost.
3
2014 includes $1.4 million charge related to certain employee separation
expenses. 1
Adjustment for impact of recognizing a portion of the billed SNA contract on a
straight line basis 2
2Q 2014 includes $0.9 million legal costs related to new Sprint agreement.
|
 ARPA Reconciliation
24
ARPA Reconciliation - Postpay
Average Monthly Revenue per Account (ARPA) ¹
2Q14
1Q14
4Q13
3Q13
2Q13
FY 2013
FY 2012
(In thousands, except for accounts and ARPA)
Operating revenues
117,795
$
122,082
$
121,766
$
130,912
$
119,859
$
491,882
$
453,989
$
Less: prepay service revenues
(16,206)
(16,960)
(16,956)
(16,478)
(16,182)
(65,300)
(58,036)
Less: equipment revenues
(6,560)
(7,491)
(6,573)
(6,541)
(5,499)
(25,251)
(30,078)
Less: wholesale and other adjustments
(37,900)
(40,018)
(40,525)
(50,142)
(41,179)
(172,764)
(165,765)
Postpay service revenues
57,129
$
57,613
$
57,712
$
57,751
$
56,999
$
228,567
$
200,110
$
Average number of postpay accounts
138,800
139,700
140,500
140,600
142,500
141,700
141,700
Postpay ARPA
137.20
$
137.47
$
136.88
$
136.90
$
133.34
$
134.43
$
117.65
$
¹
Average
monthly
revenue
per
account
(ARPA)
is
computed
by
dividing
postpay
service
revenues
per
period
by
the
average
number
of
postpay
accounts
during
that
period.
As
defined,
ARPA
may
not
be
similar
to
ARPA
measures
of
other
companies,
is
not
a
measurement
under
GAAP
and
should
be
considered
in
addition
to,
but
not
as
a
substitute
for,
the
information
contained
in
the
Company’s
consolidated
Income
Statement.
The
Company
closely
monitors
the
effects
of
new
rate
plans
and
service
offerings
on
ARPA
in
order
to
determine
their
effectiveness.
ARPA
provides
management
useful
information
concerning
the
appeal
of
NTELOS
rate
plans
and
service
offerings
and
the
Company’s performance in attracting and retaining high-value customers.
|
 2Q14 Earnings Presentation
July 28, 2014
NASDAQ: NTLS |