Attached files
| file | filename |
|---|---|
| 8-K - CURRENT REPORT - ASB Bancorp Inc | v384861_8k.htm |
| EX-99.1 - EXHIBIT 99.1 - ASB Bancorp Inc | v384861_ex99-1.htm |

KBW 2014 Community Bank Investor Conference New York, New York July 29 - 30, 2014 NASDAQ | ASBB Exhibit 99.2
This presentation, as well as other written communications made from time to time by the Company and its subsidiaries and oral communications made from time to time by authorized officers of the Company, may contain statements relating to the future results of the Company (including certain projections and business trends) that are considered “forward - looking statements” as defined in the Private Securities Litigation Reform Act of 1995 (the PSLRA). Such forward - looking statements may be identified by the use of such words as “believe,” “expect,” “anticipate,” “should,” “planned,” “estimated,” “intend” and “potential.” For these statements, the Company claims the protection of the safe harbor for forward - looking statements contained in the PSLRA. The Company cautions you that a number of important factors could cause actual results to differ materially from those currently anticipated in any forward - looking statement. Such factors include, but are not limited to: prevailing economic and geopolitical conditions; changes in interest rates, loan demand, real estate values and competition; changes in accounting principles, policies, and guidelines; changes in any applicable law, rule, regulation or practice with respect to tax or legal issues; and other economic, competitive, governmental, regulatory and technological factors affecting the Company’s operations, pricing, products and services and other factors that may be described in the Company’s annual report on Form 10 - K and quarterly reports on Form 10 - Q as filed with the Securities and Exchange Commission. The forward - looking statements are made as of the date of this presentation, and, except as may be required by applicable law or regulation, the Company assumes no obligation to update the forward - looking statements or to update the reasons why actual results could differ from those projected in the forward - looking statements. NASDAQ | ASBB Forward - Looking Statements | 2

Introduction o Profile and Executive Management o Market Area and Geographic Footprint Financial Performance o Stock Information o Selected Balance Sheet Data o Selected Income Statement Data Competitive Environment o Deposit Market Share Strategic Vision NASDAQ | ASBB Overview | 3

NASDAQ | ASBB Introduction | 4

Headquartered in Asheville, North Carolina Community bank founded in 1936 with total assets of $754 million – 13 offices in 5 Western North Carolina counties – 162 full - time equivalent employees Converted from the mutual form of ownership on October 11, 2011 NASDAQ | ASBB ASBB Profile | 5

NASDAQ | ASBB Executive Management | 6 Role Years in Banking Suzanne DeFerie President & Chief Executive Officer 22 years Kirby Tyndall Executive Vice President & Chief Financial Officer 25 years David Kozak Executive Vice President & Chief Lending Officer 30 years Vikki Bailey Executive Vice President & Chief Retail Officer 38 years
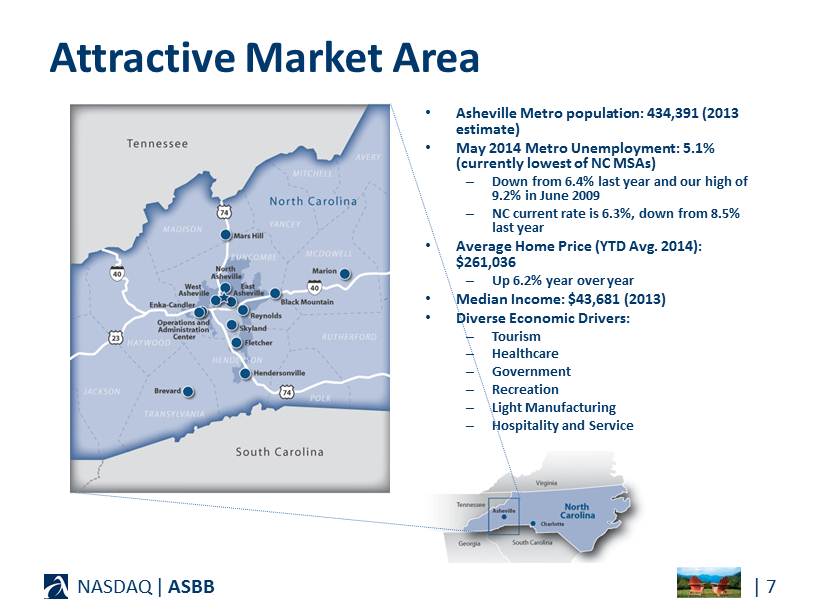
• Asheville Metro population: 434,391 (2013 estimate) • May 2014 Metro Unemployment: 5.1% (currently lowest of NC MSAs) – Down from 6.4% last year and our high of 9.2% in June 2009 – NC current rate is 6.3%, down from 8.5% last year • Average Home Price (YTD Avg. 2014): $261,036 – Up 6.2% year over year • Median Income: $43,681 (2013) • Diverse Economic Drivers: – Tourism – Healthcare – Government – Recreation – Light Manufacturing – Hospitality and Service | 7 NASDAQ | ASBB Attractive Market Area

NASDAQ | ASBB Financial Performance | 8

As of June 30, 2014 NASDAQ Global Market ASBB Closing price $20.97 Book value per share $21.06 Price to book value 99% Shares outstanding 4,831,311 shares Shares repurchased (Jan 1, 2013 ‒ Jun 30, 2014) 754,840 shares NASDAQ | ASBB Stock Information | 9
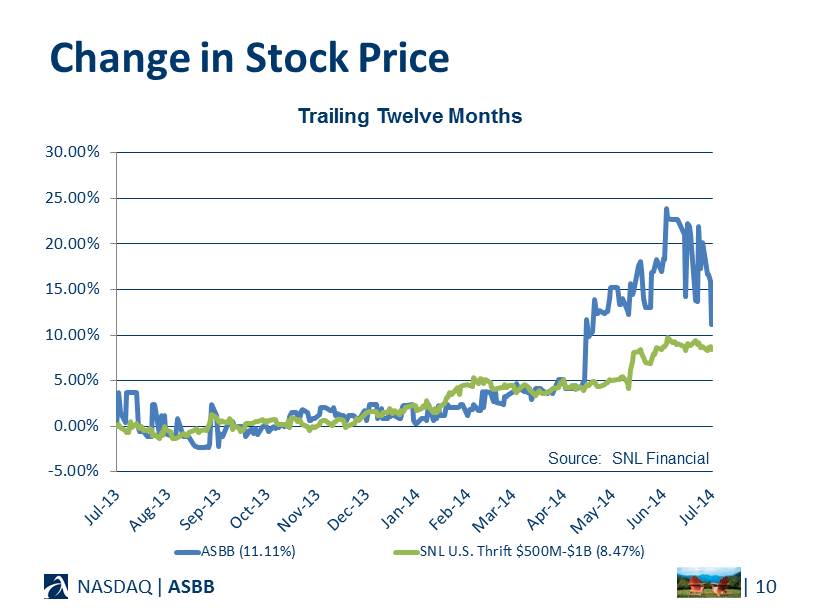
NASDAQ | ASBB Change in Stock Price | 10 -5.00% 0.00% 5.00% 10.00% 15.00% 20.00% 25.00% 30.00% Trailing Twelve Months ASBB (11.11%) SNL U.S. Thrift $500M-$1B (8.47%) Source: SNL Financial

NASDAQ | ASBB Balance Sheet — Assets | 11 Cash Equivalents $93.8 13% Investment Securities $153.9 20% Loans Held for Sale $2.8 0% Loans, Net of Reserves $466.2 62% Foreclosed Properties $10.4 1% Other $27.4 4% Composition, As of June 30, 2014 ($ millions)

NASDAQ | ASBB Balance Sheet — Liabilities & Equity | 12 Core Deposits $432.2 57% Time Deposits $160.5 21% Borrowings $50.4 7% Other Liabilities $9.7 1% Equity $101.7 14% Composition, As of June 30, 2014 ($ millions)

NASDAQ | ASBB Balance Sheet — Loans | 13 Commer Const/Dev $17.0 3% Commer Mortgage $180.6 38% Commer & Industrial $15.2 3% Residential Constr/Dev $12.4 3% Residential Mortgage $168.6 36% Revolving Mortgage $51.8 11% Consumer $27.1 6% Composition, As of June 30, 2014 ($ millions)
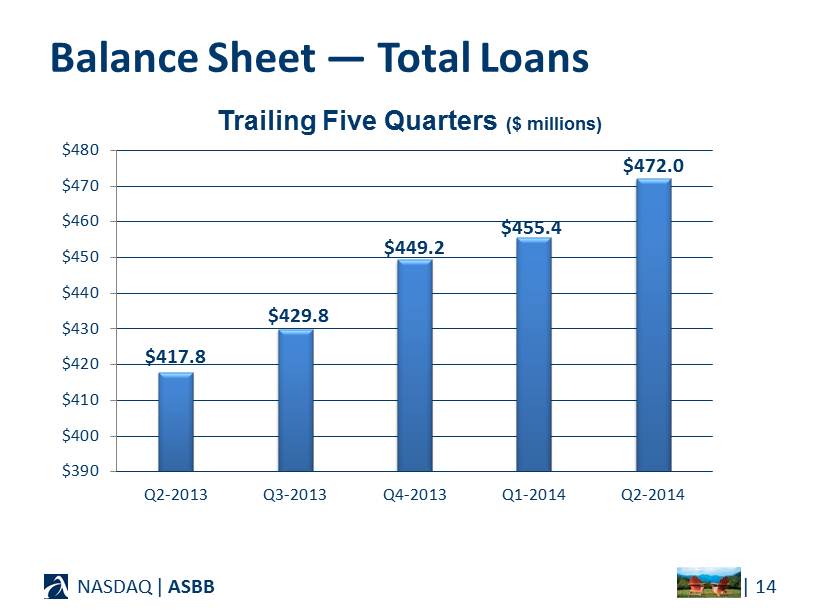
NASDAQ | ASBB Balance Sheet — Total Loans | 14 $417.8 $429.8 $449.2 $455.4 $472.0 $390 $400 $410 $420 $430 $440 $450 $460 $470 $480 Q2-2013 Q3-2013 Q4-2013 Q1-2014 Q2-2014 Trailing Five Quarters ($ millions)

NASDAQ | ASBB Balance Sheet — Asset Quality | 15 $1.5 $1.7 $1.2 $1.9 $2.0 $16.7 $15.4 $14.2 $13.6 $10.4 2.42% 2.27% 2.10% 2.07% 1.64% 0.25% 0.75% 1.25% 1.75% 2.25% 2.75% $0 $5 $10 $15 $20 $25 Q2-2013 Q3-2013 Q4-2013 Q1-2014 Q2-2014 ($ millions) Foreclosed Properties Nonperforming Loans Nonperforming Assets as % of Assets (right scale) Nonperforming Assets, Trailing Five Quarters *
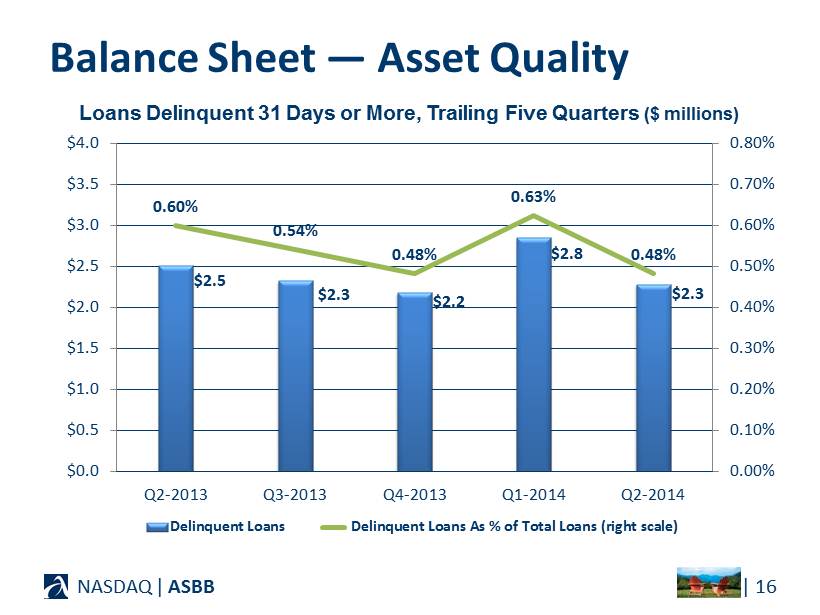
NASDAQ | ASBB Balance Sheet — Asset Quality | 16 $2.5 $2.3 $2.2 $2.8 $2.3 0.60% 0.54% 0.48% 0.63% 0.48% 0.00% 0.10% 0.20% 0.30% 0.40% 0.50% 0.60% 0.70% 0.80% $0.0 $0.5 $1.0 $1.5 $2.0 $2.5 $3.0 $3.5 $4.0 Q2-2013 Q3-2013 Q4-2013 Q1-2014 Q2-2014 Delinquent Loans Delinquent Loans As % of Total Loans (right scale) Loans Delinquent 31 Days or More, Trailing Five Quarters ($ millions)

NASDAQ | ASBB Balance Sheet — Deposits | 17 Demand $88.8 15% NOW $151.3 26% Savings $38.5 6% Money Market $153.6 26% Certificates $160.5 27% Core Deposits * $432.2 73% Composition, As of June 30, 2014 ($ millions) * ASBB defines core deposits as demand, savings and money market deposits and excludes all certificates of deposits — retail , jumbo and brokered.

NASDAQ | ASBB Balance Sheet — Core Deposits * | 18 $401.8 $406.7 $405.7 $423.6 $432.2 68.32% 69.66% 70.83% 72.31% 72.92% 0% 20% 40% 60% 80% $275 $325 $375 $425 $475 Q2-2013 Q3-2013 Q4-2013 Q1-2014 Q2-2014 Core Deposits Core Deposits as % of Deposits (right scale) * ASBB defines core deposits as demand, savings and money market deposits and excludes all certificates of deposits — retail , jumbo and brokered. Trailing Five Quarters ($ millions)

NASDAQ | ASBB Balance Sheet — Regulatory Capital | 19 0% 5% 10% 15% 20% 25% 30% Q2-2013 Q3-2013 Q4-2013 Q1-2014 Q2-2014 Tier I Leverage (well = 5.00%) Tier I Risk-Based (well = 6.00%) Total Risk-Based (well = 10.00%) Trailing Five Quarters

$(0.04) $0.12 $0.08 $0.09 $0.21 ($0.10) ($0.05) $0.00 $0.05 $0.10 $0.15 $0.20 $0.25 Q2-2013 Q3-2013 Q4-2013 Q1-2014 Q2-2014 NASDAQ | ASBB Per Share Data | 20 Earnings (Loss) Per Share, Trailing Five Quarters
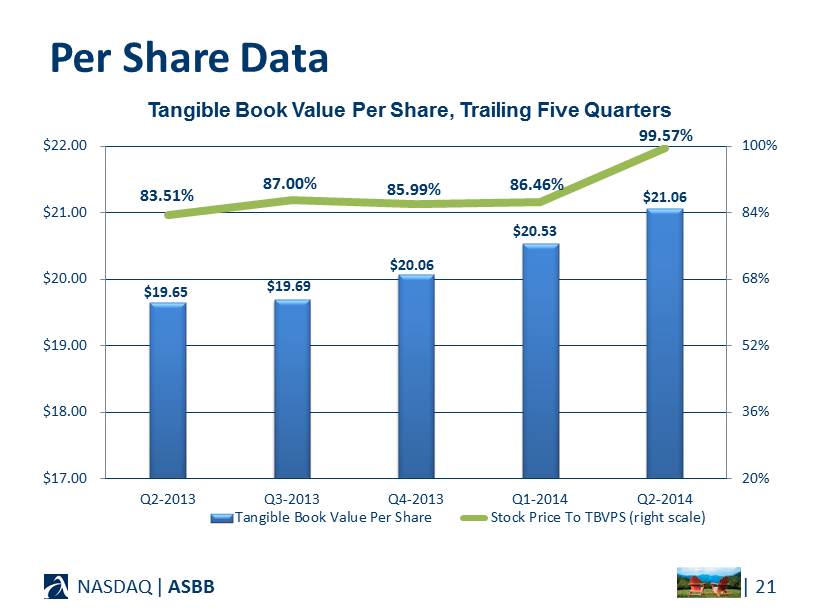
$19.65 $19.69 $20.06 $20.53 $21.06 83.51% 87.00% 85.99% 86.46% 99.57% 20% 36% 52% 68% 84% 100% $17.00 $18.00 $19.00 $20.00 $21.00 $22.00 Q2-2013 Q3-2013 Q4-2013 Q1-2014 Q2-2014 Tangible Book Value Per Share Stock Price To TBVPS (right scale) NASDAQ | ASBB Per Share Data | 21 Tangible Book Value Per Share, Trailing Five Quarters

$(206) $560 $360 $404 $941 ($220) $0 $220 $440 $660 $880 $1,100 Q2-2013 Q3-2013 Q4-2013 Q1-2014 Q2-2014 NASDAQ | ASBB Income Statement Trends | 22 Net Income (Loss), Trailing Five Quarters ($ thousands)
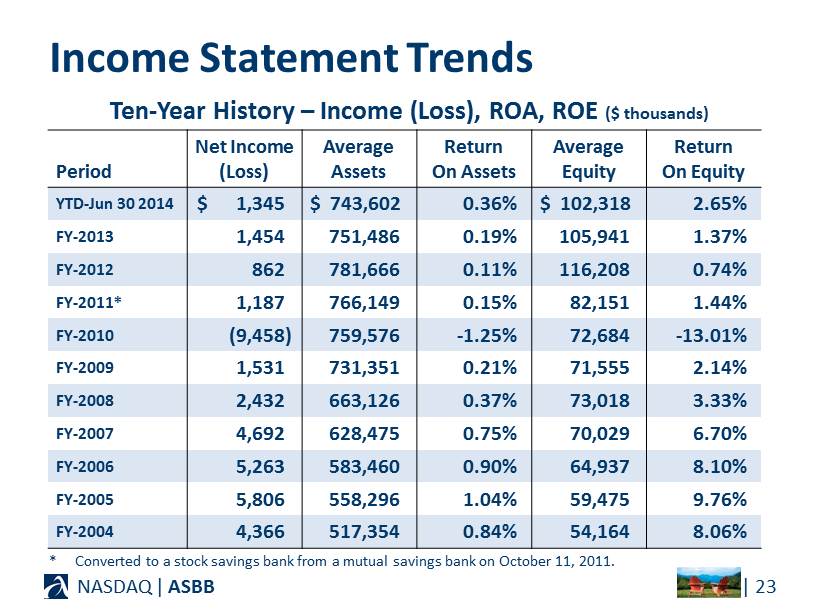
NASDAQ | ASBB Income Statement Trends | 23 Period Net Income (Loss) Average Assets Return On Assets Average Equity Return On Equity YTD - Jun 30 2014 $ 1,345 $ 743,602 0.36% $ 102,318 2.65% FY - 2013 1,454 751,486 0.19% 105,941 1.37% FY - 2012 862 781,666 0.11% 116,208 0.74% FY - 2011* 1,187 766,149 0.15% 82,151 1.44% FY - 2010 (9,458) 759,576 - 1.25% 72,684 - 13.01% FY - 2009 1,531 731,351 0.21% 71,555 2.14% FY - 2008 2,432 663,126 0.37% 73,018 3.33% FY - 2007 4,692 628,475 0.75% 70,029 6.70% FY - 2006 5,263 583,460 0.90% 64,937 8.10% FY - 2005 5,806 558,296 1.04% 59,475 9.76% FY - 2004 4,366 517,354 0.84% 54,164 8.06% Ten - Year History – Income (Loss), ROA, ROE ($ thousands) * Converted to a stock savings bank from a mutual savings bank on October 11, 2011.

NASDAQ | ASBB Income Statement Trends | 24 3.27% 3.30% 3.34% 3.42% 3.32% 0.78% 0.72% 0.68% 0.65% 0.64% 2.65% 2.72% 2.79% 2.90% 2.82% 0.50% 1.00% 1.50% 2.00% 2.50% 3.00% 3.50% Q2-2013 Q3-2013 Q4-2013 Q1-2014 Q2-2014 Earning Asset Yield Cost of Funds Net Interest Margin Earning Asset Yield, Cost of Funds and Net Interest Margin Trailing Five Quarters

$2,522 $1,868 $1,756 $1,456 $1,554 $1,826 $1,688 $1,755 $1,342 $1,461 $0 $500 $1,000 $1,500 $2,000 $2,500 $3,000 Q2-2013 Q3-2013 Q4-2013 Q1-2014 Q2-2014 Noninterest Income Excluding Securities Gains NASDAQ | ASBB Income Statement Trends | 25 Noninterest Income, Trailing Five Quarters ($ thousands)
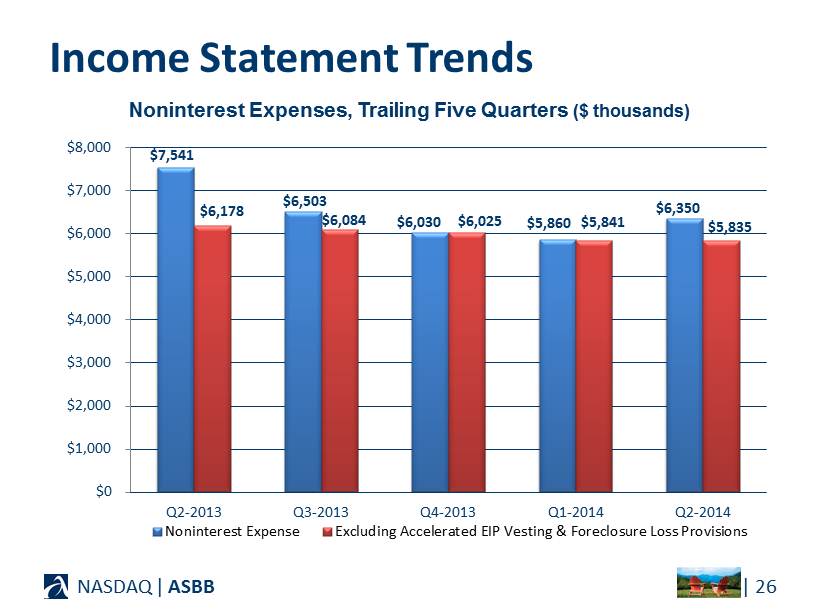
$7,541 $6,503 $6,030 $5,860 $6,350 $6,178 $6,084 $6,025 $5,841 $5,835 $0 $1,000 $2,000 $3,000 $4,000 $5,000 $6,000 $7,000 $8,000 Q2-2013 Q3-2013 Q4-2013 Q1-2014 Q2-2014 Noninterest Expense Excluding Accelerated EIP Vesting & Foreclosure Loss Provisions NASDAQ | ASBB Income Statement Trends | 26 Noninterest Expenses, Trailing Five Quarters ($ thousands)

NASDAQ | ASBB Competitive Environment | 27
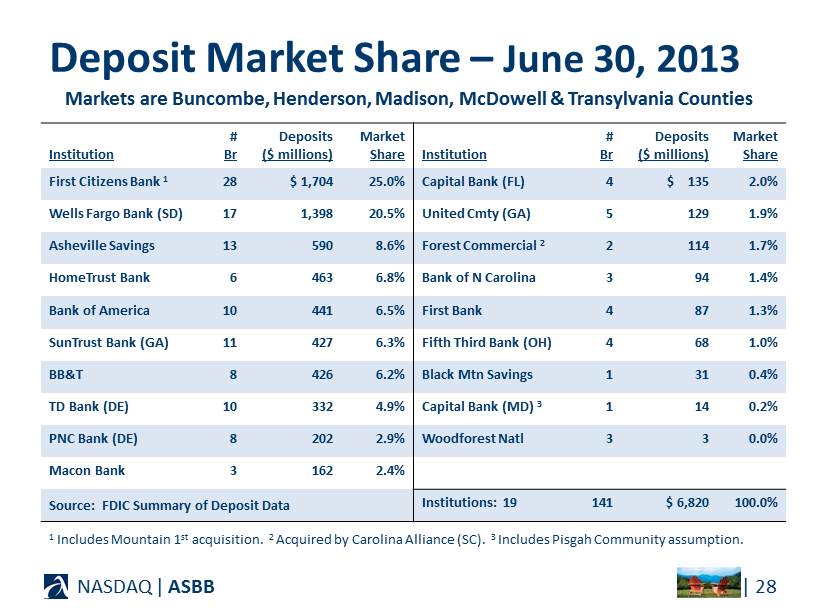
NASDAQ | ASBB Deposit Market Share – June 30, 2013 | 28 Institution # Br Deposits ($ millions) Market Share Institution # Br Deposits ($ millions) Market Share First Citizens Bank 1 28 $ 1,704 25.0% Capital Bank (FL) 4 $ 135 2.0% Wells Fargo Bank (SD) 17 1,398 20.5% United Cmty (GA) 5 129 1.9% Asheville Savings 13 590 8.6% Forest Commercial 2 2 114 1.7% HomeTrust Bank 6 463 6.8% Bank of N Carolina 3 94 1.4% Bank of America 10 441 6.5% First Bank 4 87 1.3% SunTrust Bank (GA) 11 427 6.3% Fifth Third Bank (OH) 4 68 1.0% BB&T 8 426 6.2% Black Mtn Savings 1 31 0.4% TD Bank (DE) 10 332 4.9% Capital Bank (MD) 3 1 14 0.2% PNC Bank (DE) 8 202 2.9% Woodforest Natl 3 3 0.0% Macon Bank 3 162 2.4% Institutions: 19 141 $ 6,820 100.0% Markets are Buncombe, Henderson, Madison, McDowell & Transylvania Counties 1 Includes Mountain 1 st acquisition. 2 Acquired by Carolina Alliance (SC). 3 Includes Pisgah Community assumption. Source: FDIC Summary of Deposit Data

$0 $200 $400 $600 $800 $1,000 $1,200 $1,400 $1,600 $1,800 June 30, 2012 June 30, 2013 NASDAQ | ASBB | 29 Markets are Buncombe, Henderson, Madison, McDowell & Transylvania Counties June 30 ($ millions) Deposit Market Share – 2012 vs. 2013 Source: FDIC Summary of Deposit Data

NASDAQ | ASBB Strategic Vision | 30
Goal: Smart Asset Growth funded by Core Deposits Focus: Commercial and Small Business Relationships for improved NIM Focus: Mortgage Banking for improved Fee Income and NIM Focus: Increased Efficiencies and Productivity, including further reduction of nonperforming assets, for improved expense ratio NASDAQ | ASBB Strategic Vision: Sustainable, Superior Performance | 31

Goal: Continue to Increase Shareholder Value Focus: Sustained Financial Performance Focus: Strong Risk Management Process Focus: Capital Management Strategies o Since conversion, repurchased 1.2 million shares or 22% of total outstanding at an average cost of $18.25 per share o Future Cash Dividend decisions will depend on current earnings and other uses of capital NASDAQ | ASBB Strategic Vision: Creating Shareholder Value | 32

NASDAQ | ASBB Inquiries may be directed to : Suzanne DeFerie, President & Chief Executive Officer Kirby Tyndall, Executive Vice President & Chief Financial Officer Investor Relations (828) 250 - 8516