Attached files
| file | filename |
|---|---|
| 8-K - FORM 8-K - BENCHMARK ELECTRONICS INC | 8-k.htm |
| EX-99.1 - EX 99.1 - BENCHMARK ELECTRONICS INC | ex99-1.htm |
Second Quarter Fiscal 2014 July 24, 2014 Financial Results
design develop deliver advanced technology 2 Forward - Looking Statements This document contains forward - looking statements within the meaning of Section 27 A of the Securities Act of 1933 , as amended, and Section 21 E of the Securities Exchange Act of 1934 , as amended . In addition, from time to time, Benchmark Electronics, Inc . (the “Company ”) or its representatives have made or may make forward - looking statements, orally or in writing . Such forward - looking statements may be included in, but are not limited to, various filings made by the Company with the Securities and Exchange Commission, press releases or oral statements made with the approval of an authorized executive officer of the Company . Actual results could differ materially from those projected or suggested in any forward - looking statements as a result of many factors, some of which have been described in the section of the Company’s Annual Report on Form 10 - K for the year ended December 31 , 2013 , entitled “Risk Factors,” and in other documents the Company’s files from time to time, with the Securities and Exchange Commission, including annual reports on Form 10 - K, quarterly reports on Form 10 - Q and current reports on Form 8 - K . This document includes financial measures for earnings and earnings per share that exclude certain items and therefore are not in accordance with generally accepted accounting principles (“GAAP”) . A detailed reconciliation between GAAP results and results excluding special items (non - GAAP) is included in our press release and in the Appendix of this presentation .
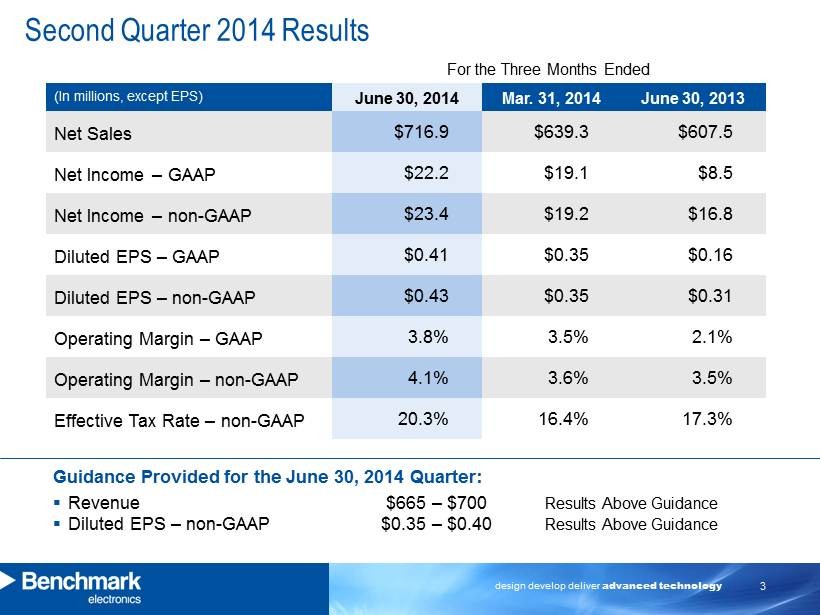
design develop deliver advanced technology 3 Second Quarter 2014 Results (In millions, except EPS) June 30, 2014 Mar. 31, 2014 June 30, 2013 Net Sales $716.9 $639.3 $607.5 Net Income – GAAP $22.2 $19.1 $8.5 Net Income – non - GAAP $23.4 $19.2 $16.8 Diluted EPS – GAAP $0.41 $0.35 $0.16 Diluted EPS – non - GAAP $0.43 $0.35 $0.31 Operating Margin – GAAP 3.8% 3.5% 2.1% Operating Margin – non - GAAP 4.1% 3.6% 3.5% Effective Tax Rate – non - GAAP 20.3% 16.4% 17.3% For the Three Months Ended Guidance Provided for the June 30, 2014 Quarter: ▪ Revenue $665 – $700 Results Above Guidance ▪ Diluted EPS – non - GAAP $0.35 – $0.40 Results Above Guidance
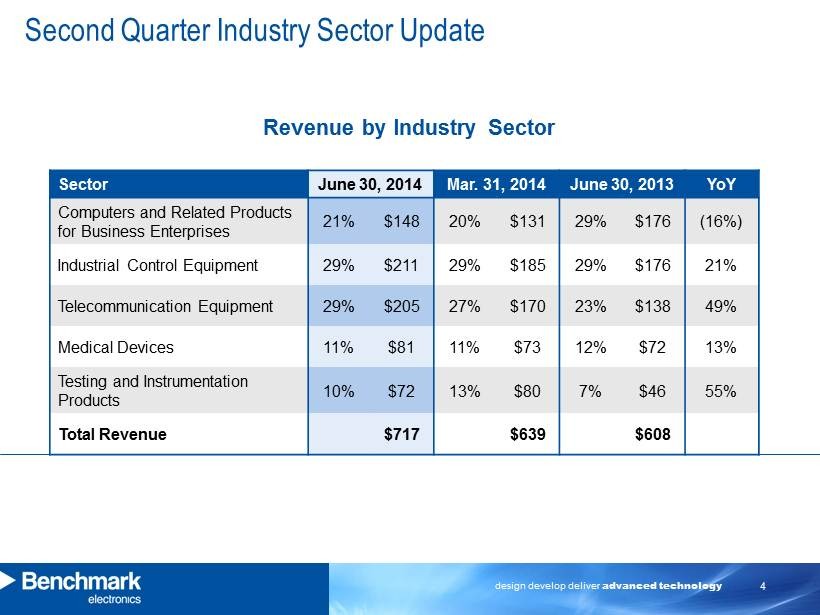
design develop deliver advanced technology 4 Second Quarter Industry Sector Update Sector June 30, 2014 Mar. 31, 2014 June 30, 2013 YoY Computers and Related Products for Business Enterprises 21% $148 20% $131 29% $176 (16%) Industrial Control Equipment 29% $211 29% $185 29% $176 21% Telecommunication Equipment 29% $205 27% $170 23% $138 49% Medical Devices 11% $81 11% $73 12% $72 13% Testing and Instrumentation Products 10% $72 13% $80 7% $46 55% Total Revenue $717 $639 $608 Revenue by Industry Sector
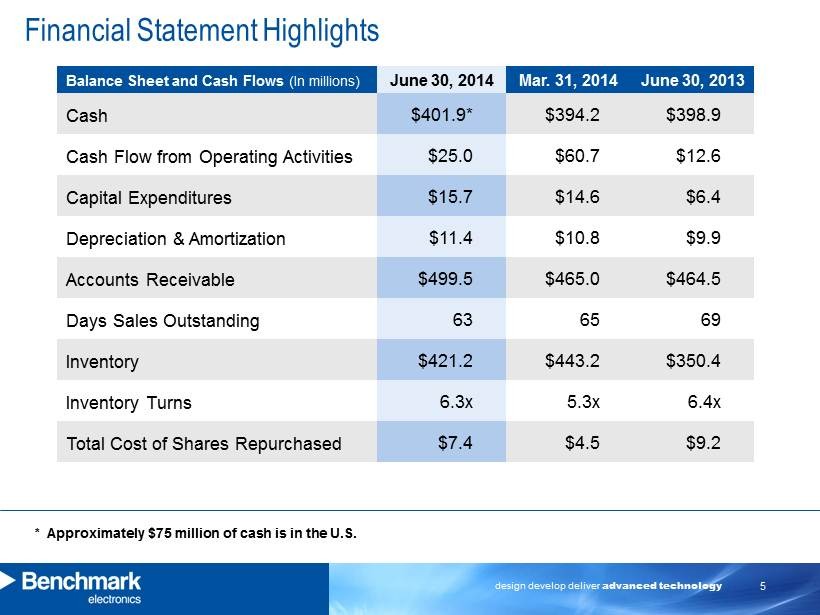
design develop deliver advanced technology 5 Financial Statement Highlights Balance Sheet and Cash Flows (In millions) June 30, 2014 Mar. 31, 2014 June 30, 2013 Cash $401.9* $394.2 $398.9 Cash Flow from Operating Activities $25.0 $60.7 $12.6 Capital Expenditures $15.7 $14.6 $6.4 Depreciation & Amortization $11.4 $10.8 $9.9 Accounts Receivable $499.5 $465.0 $464.5 Days Sales Outstanding 63 65 69 Inventory $421.2 $443.2 $350.4 Inventory Turns 6.3x 5.3x 6.4x Total Cost of Shares Repurchased $7.4 $4.5 $9.2 * Approximately $75 million of cash is in the U.S.
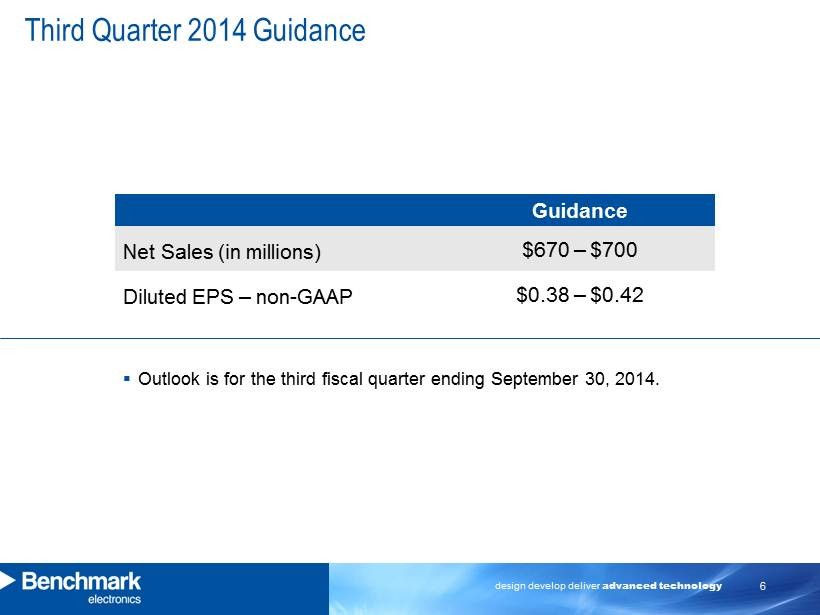
design develop deliver advanced technology 6 Third Quarter 2014 Guidance Guidance Net Sales (in millions) $670 – $700 Diluted EPS – non - GAAP $0.38 – $0.42 ▪ Outlook is for the third fiscal quarter ending September 30, 2014.

design develop deliver advanced technology 7 CEO and President Commentary
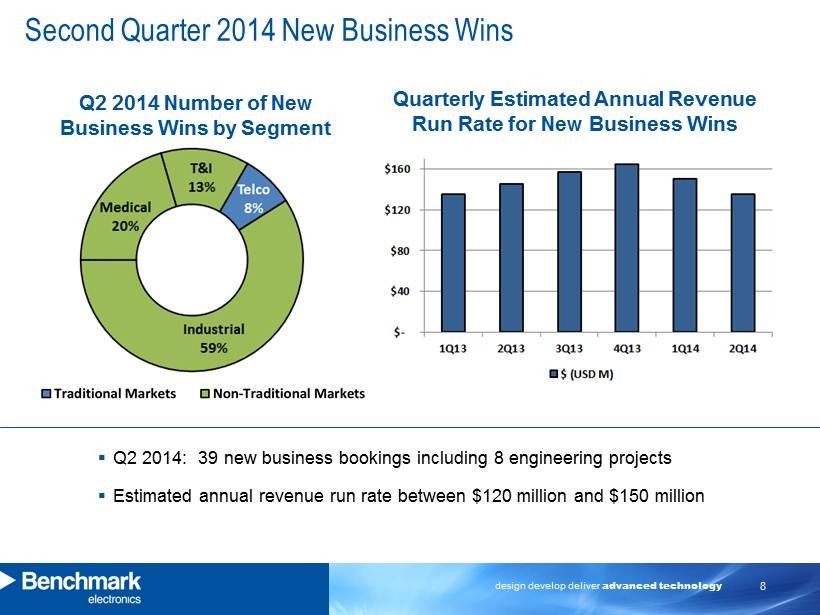
design develop deliver advanced technology 8 Second Quarter 2014 New Business Wins Q2 2014 Number of New Business Wins by Segment ▪ Q2 2014: 39 new business bookings including 8 engineering projects ▪ E stimated annual revenue run rate between $120 million and $150 million Quarterly Estimated Annual Revenue Run Rate for New Business Wins
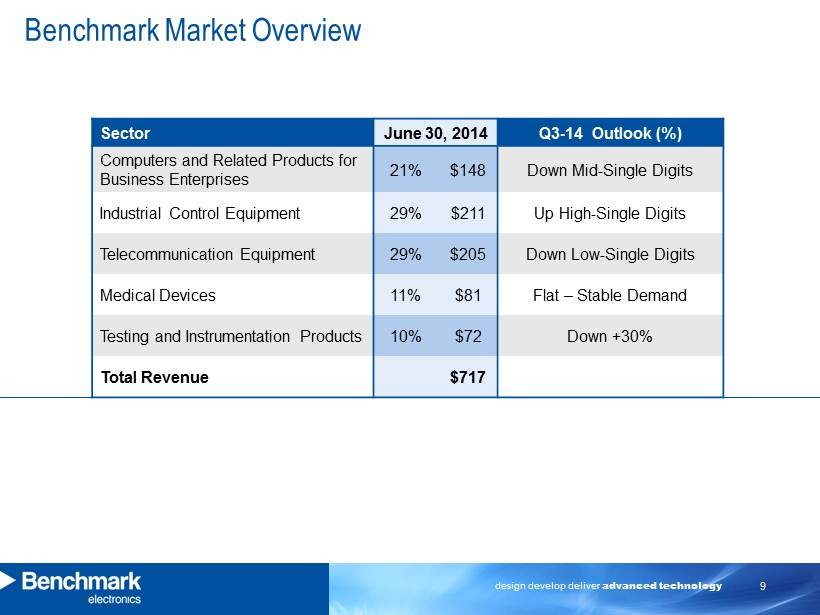
design develop deliver advanced technology 9 Benchmark Market Overview Sector June 30, 2014 Q3 - 14 Outlook (%) Computers and Related Products for Business Enterprises 21% $148 Down Mid - Single Digits Industrial Control Equipment 29% $211 Up High - Single Digits Telecommunication Equipment 29% $205 Down Low - Single Digits Medical Devices 11% $81 Flat – Stable Demand Testing and Instrumentation Products 10% $72 Down +30% Total Revenue $717
design develop deliver advanced technology 10 ▪ Second Quarter Results – Sustained Strong Performance in 2014 ▪ Continued Focus on Results in Operating Margin ▪ Strategic Priorities: o Portfolio Management o Operational Excellence o Customer Focus Summary Second Quarter 2014

design develop deliver advanced technology 11 Appendix
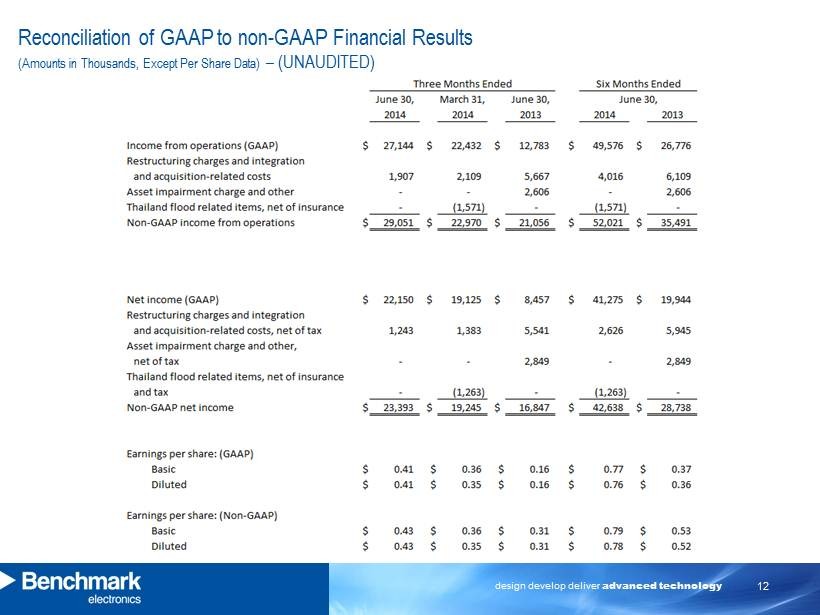
design develop deliver advanced technology 12 Reconciliation of GAAP to non - GAAP Financial Results (Amounts in Thousands, Except Per Share Data) – (UNAUDITED)