Attached files
| file | filename |
|---|---|
| EX-99.1 - EX-99.1 - SunCoke Energy, Inc. | d763112dex991.htm |
| 8-K - 8-K - SunCoke Energy, Inc. | d763112d8k.htm |
Exhibit 99.2
SunCoke Energy, Inc.
Q2
2014 Earnings
Conference Call
July 24, 2014
SunCoke Energy TM
Forward-Looking Statements
This slide presentation should be reviewed in conjunction with the Second Quarter 2014 earnings release of SunCoke Energy, Inc. (SXC) and the conference call held
on July 24, 2014 at 11:30 a.m. ET.
Some of the information included in this presentation constitutes “forward-looking statements” as defined in Section
27A of the Securities Act of 1933, as amended and Section 21E of the Securities Exchange Act of 1934, as amended. All statements in this presentation that express opinions, expectations, beliefs, plans, objectives, assumptions or projections with
respect to anticipated future performance of SXC or SunCoke Energy Partners, L.P. (SXCP), in contrast with statements of historical facts, are forward-looking statements. Such forward-looking statements are based on management’s beliefs and
assumptions and on information currently available. Forward-looking statements include information concerning possible or assumed future results of operations, business strategies, financing plans, competitive position, potential growth
opportunities, potential operating performance improvements, the effects of competition and the effects of future legislation or regulations. Forward-looking statements include all statements that are not historical facts and may be identified by
the use of forward-looking terminology such as the words “believe,” “expect,” “plan,” “intend,” “anticipate,” “estimate,” “predict,” “potential,” “continue,”
“may,” “will,” “should” or the negative of these terms or similar expressions.
Although management believes that its plans,
intentions and expectations reflected in or suggested by the forward-looking statements made in this presentation are reasonable, no assurance can be given that these plans, intentions or expectations will be achieved when anticipated or at all.
Moreover, such statements are subject to a number of assumptions, risks and uncertainties. Many of these risks are beyond the control of SXC and SXCP, and may cause actual results to differ materially from those implied or expressed by the
forward-looking statements. Each of SXC and SXCP has included in its filings with the Securities and Exchange Commission cautionary language identifying important factors (but not necessarily all the important factors) that could cause actual
results to differ materially from those expressed in any forward-looking statement. For more information concerning these factors, see the Securities and Exchange Commission filings of SXC and SXCP. All forward-looking statements included in this
presentation are expressly qualified in their entirety by such cautionary statements. Although forward-looking statements are based on current beliefs and expectations, caution should be taken not to place undue reliance on any such forward-looking
statements because such statements speak only as of the date hereof. SXC and SXCP do not have any intention or obligation to update publicly any forward-looking statement (or its associated cautionary language) whether as a result of new information
or future events or after the date of this presentation, except as required by applicable law.
This presentation includes certain non-GAAP financial measures
intended to supplement, not substitute for, comparable GAAP measures. Reconciliations of non-GAAP financial measures to GAAP financial measures are provided in the Appendix at the end of the presentation. Investors are urged to consider carefully
the comparable GAAP measures and the reconciliations to those measures provided in the Appendix.
SXC Q2 2014 Earnings Call 1
Q2 2014 Highlights
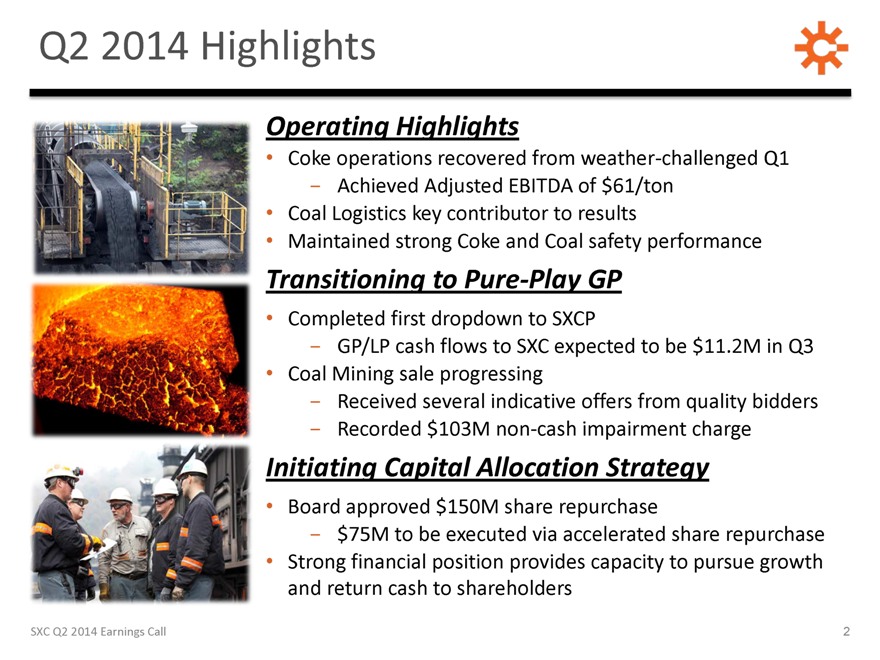
Operating Highlights
Coke operations recovered from weather-challenged Q1
- Achieved Adjusted EBITDA of $61/ton
Coal Logistics key contributor to
results
Maintained strong Coke and Coal safety performance
Transitioning to
Pure-Play GP
Completed first dropdown to SXCP
- GP/LP cash flows to SXC
expected to be $11.2M in Q3
Coal Mining sale progressing
- Received several
indicative offers from quality bidders
- Recorded $103M non-cash impairment charge
Initiating Capital Allocation Strategy
Board approved $150M share repurchase
- $75M to be executed via accelerated share repurchase
Strong financial position provides
capacity to pursue growth and return cash to shareholders
SXC Q2 2014 Earnings Call 2
3
Q2 2014 Earnings Overview
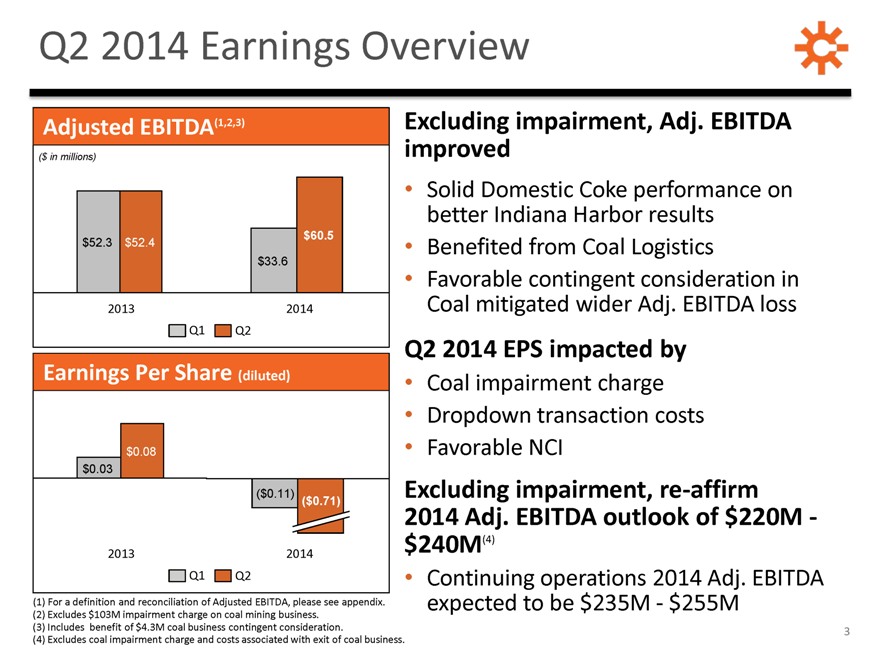
Adjusted EBITDA(1,2,3)
($ in millions)
$52.3 $52.4 $33.6 $60.5
2013 2014
Q1 Q2
Earnings Per Share (diluted)
$0.03 $0.08
($0.11) ($0.71)
2013 2014
Q1 Q2
(1) For a definition and reconciliation of Adjusted EBITDA, please see appendix.
(2) Excludes
$103M impairment charge on coal mining business.
(3) Includes benefit of $4.3M coal business contingent consideration.
(4) Excludes coal impairment charge and costs associated with exit of coal business.
Excluding
impairment, Adj. EBITDA improved
Solid Domestic Coke performance on better Indiana Harbor results
Benefited from Coal Logistics
Favorable contingent consideration in Coal mitigated wider Adj.
EBITDA loss
Q2 2014 EPS impacted by
Coal impairment charge
Dropdown transaction costs
Favorable NCI
Excluding impairment, re-affirm 2014 Adj. EBITDA outlook of $220M - $240M(4)
Continuing
operations 2014 Adj. EBITDA expected to be $235M - $255M
Q2 2014 Financial Results
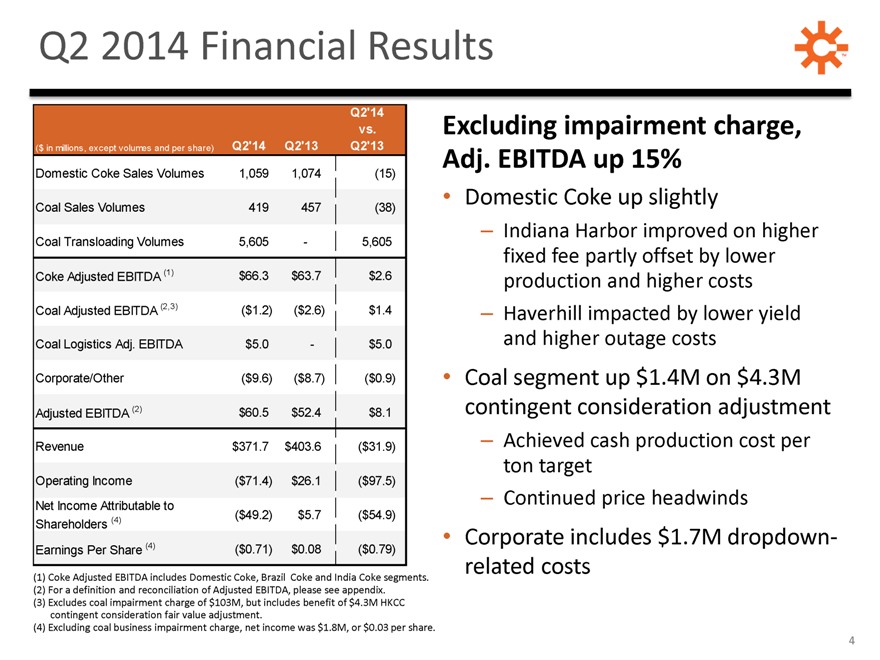
($ in millions, except volumes and per share) Q2’14 Q2’13 Q2’14 vs. Q2’13
Domestic Coke Sales Volumes 1,059 1,074 (15)
Coal Sales Volumes 419 457 (38)
Coal Transloading Volumes 5,605 - 5,605
Coke Adjusted EBITDA (1) $66.3 $63.7 $2.6
Coal Adjusted EBITDA (2,3) ($1.2) ($2.6) $1.4
Coal Logistics Adj. EBITDA $5.0 - $5.0
Corporate/Other ($9.6) ($8.7) ($0.9)
Adjusted EBITDA (2) $60.5 $52.4 $8.1
Revenue $371.7 $403.6 ($31.9)
Operating Income ($71.4) $26.1 ($97.5)
Net Income Attributable to Shareholders (4) ($49.2) $5.7 ($54.9)
Earnings Per
Share (4) ($0.71) $0.08 ($0.79)
(1) Coke Adjusted EBITDA includes Domestic Coke, Brazil Coke and India Coke segments.
(2) For a definition and reconciliation of Adjusted EBITDA, please see appendix.
(3) Excludes
coal impairment charge of $103M, but includes benefit of $4.3M HKCC contingent consideration fair value adjustment.
(4) Excluding coal business impairment charge,
net income was $1.8M, or $0.03 per share.
Excluding impairment charge, Adj. EBITDA up 15%
Domestic Coke up slightly
– Indiana Harbor improved on higher fixed fee partly offset by
lower production and higher costs
– Haverhill impacted by lower yield and higher outage costs
Coal segment up $1.4M on $4.3M contingent consideration adjustment
– Achieved cash
production cost per ton target
– Continued price headwinds
Corporate
includes $1.7M dropdown-related costs
4
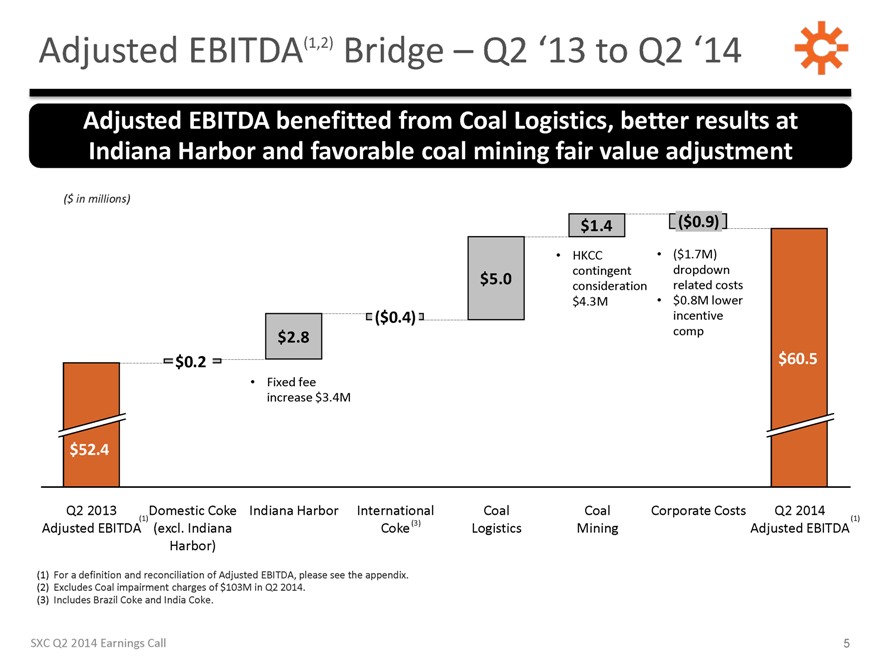
Adjusted EBITDA(1,2) Bridge – Q2 ‘13 to Q2 ‘14
Adjusted EBITDA benefitted from Coal Logistics, better results at Indiana Harbor and favorable coal mining fair value adjustment
($ in millions)
$1.4 ($0.9)
$5.0 HKCC contingent consideration $4.3M
($1.7M) dropdown related costs
$0.8M lower incentive comp
$60.5
($0.4)
$2.8
$0.2
Fixed fee increase $3.4M
$52.4
Q2 2013
Adjusted EBITDA(1)
Domestic Coke
(excl. Indiana Harbor)
Indiana Harbor
International Coke (3)
Coal Logistics
Coal Mining
Corporate Costs
Q2 2014
Adjusted EBITDA (1)
(1) For a definition and reconciliation of Adjusted EBITDA, please see the appendix.
(2)
Excludes Coal impairment charges of $103M in Q2 2014.
(3) Includes Brazil Coke and India Coke.
SXC Q2 2014 Earnings Call 5
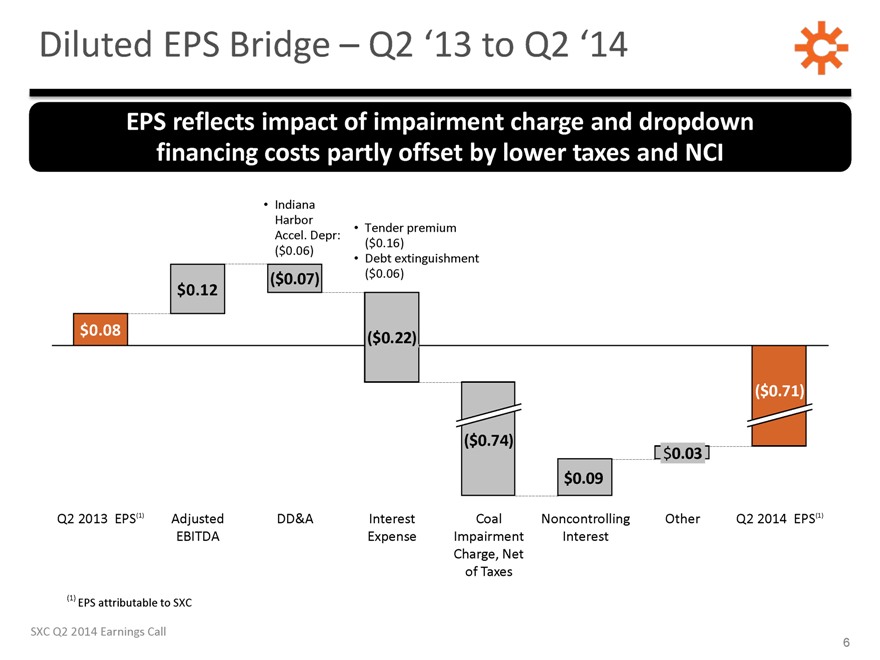
Diluted EPS Bridge – Q2 ’13 to Q2 ’14
EPS reflects impact of impairment charge and dropdown financing costs partly offset by lower taxes and NCI
Indiana Harbor
Accel. Depr: ($0.06)
Tender premium ($0.16)
Debt extinguishment ($0.06)
$0.08 $0.12 ($0.07) ($0.22) ($0.74) $0.09 $0.03 ($0.71)
Q2 2013 EPS(1)
Adjusted EBITDA
DD&A
Interest Expense
Coal Impairment Charge, Net of Taxes
Noncontrolling Interest
Other
Q2 2014 EPS(1)
(1) EPS attributable to SXC
SXC Q2 2014 Earnings Call 6
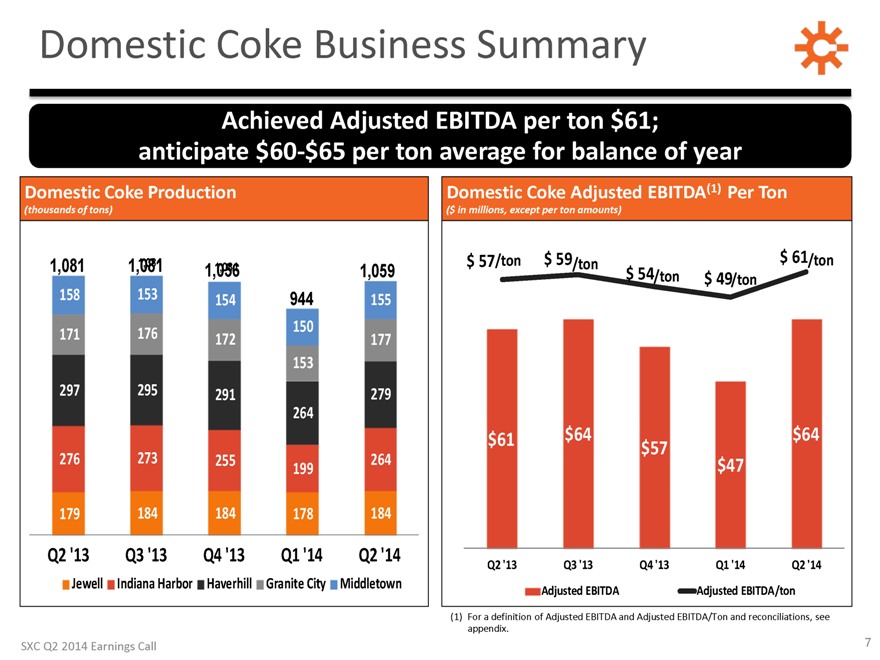
Domestic Coke Business Summary
Achieved Adjusted EBITDA per ton $61; anticipate $60-$65 per ton average for balance of year
Domestic Coke Production
(thousands of tons)
1,081 1,0811,081 1,0561,081 944 1,059
158 153 154 150 155
171 176 172 153 177
297 295 291 264 279
276 273 255 199 264
179 184 184 178 184
Q2 ’13 Q3 ’13 Q4 ’13 Q1 ’14 Q2 ’14
Jewell Indiana Harbor Haverhill
Granite City Middletown
Domestic Coke Adjusted EBITDA(1) Per Ton
($ in
millions, except per ton amounts)
$ 57/ton $ 59/ton $ 54/ton $ 49/ton $ 61/ton
$61 $64 $57 $47 $64
Q2 ’13 Q3 ’13 Q4 ’13 Q1 ’14 Q2
’14
Adjusted EBITDA Adjusted EBITDA/ton
(1) For a definition of Adjusted
EBITDA and Adjusted EBITDA/Ton and reconciliations, see appendix.
SXC Q2 2014 Earnings Call 7
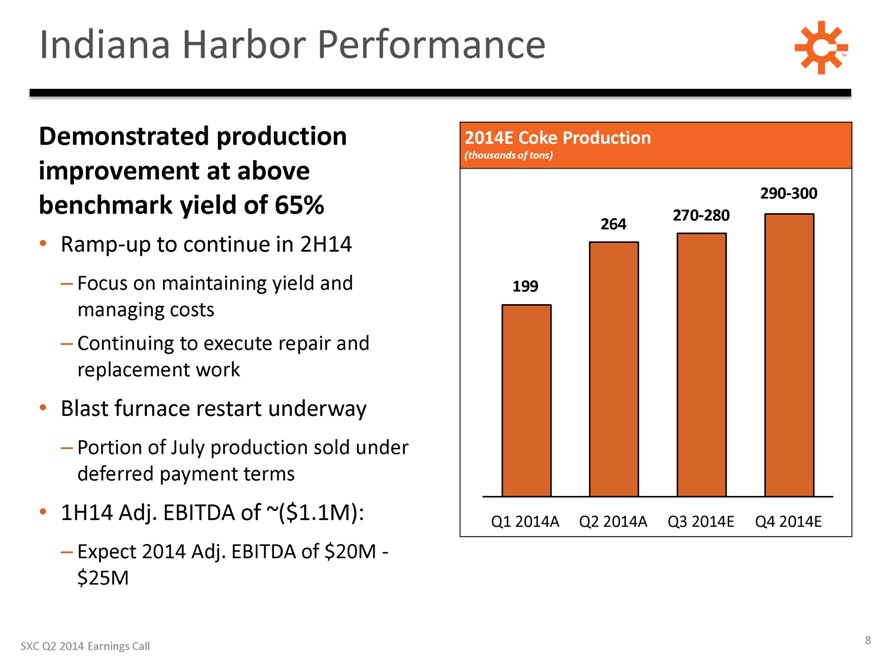
Indiana Harbor Performance
Demonstrated production improvement at above benchmark yield of 65%
Ramp-up
to continue in 2H14
– Focus on maintaining yield and managing costs
– Continuing to execute repair and replacement work
Blast furnace
restart underway
– Portion of July production sold under deferred payment terms
1H14 Adj. EBITDA of ~($1.1M):
– Expect 2014 Adj. EBITDA of $20M - $25M
2014E Coke Production
(thousands of tons)
199 264 270-280 290-300
Q1 2014A Q2 2014A Q3 2014E Q4 2014E
SXC Q2 2014 Earnings Call 8
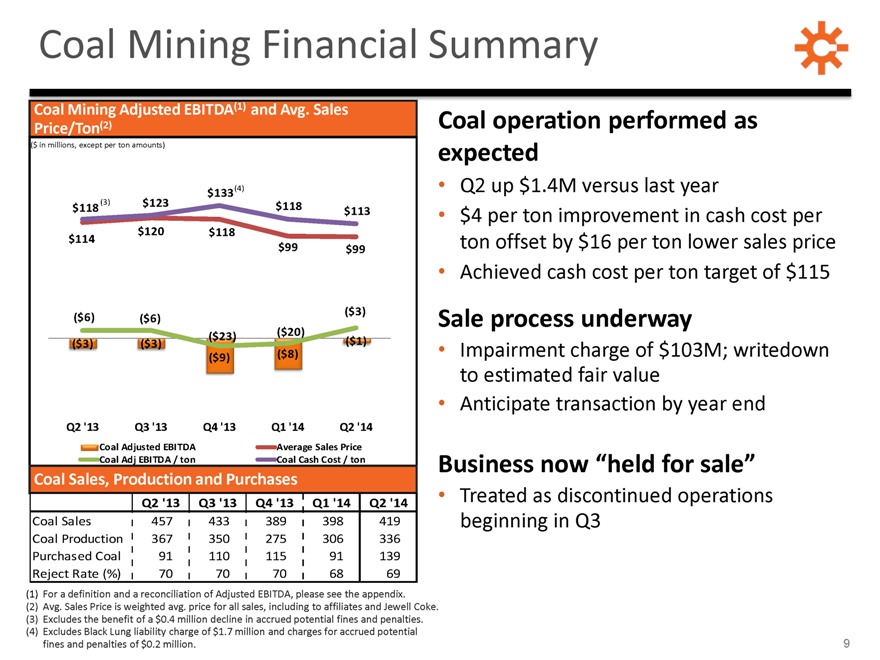
Coal Mining Financial Summary
Coal Mining Adjusted EBITDA(1) and Avg. Sales
Price/Ton(2)
($ in millions, except per ton amounts)
$133(4) $118 (3) $123 $118 $113 $114
$120 $118 $99 $99 ($6) ($6)
($3) ($23) ($20) ($3) ($3) ($1)
($9)($8)
Q2 ‘13
Q3 ’13
Q4 ’13
Q1 ’14
Q2 ’14
Coal Adjusted EBITDA
Average Sales Price
Coal Adj EBITDA / ton
Coal Cash Cost / ton
Coal Sales, Production and Purchases
Q2 ’13
Q3 ’13
Q4 ’13
Q1 ’14
Q2 ’14
Coal Sales
457 433 389 398 419
Coal Production
367 350 275 306 336
Purchased Coal
91 110 115 91 139
Reject Rate (%)
70 70 70 68 69
(1) For a definition and a reconciliation of Adjusted EBITDA, please see the appendix.
(2)
Avg. Sales Price is weighted avg. price for all sales, including to affiliates and Jewell Coke.
(3) Excludes the benefit of a $0.4 million decline in accrued
potential fines and penalties.
(4) Excludes Black Lung liability charge of $1.7 million and charges for accrued potential fines and penalties of $0.2 million.
Coal operation performed as expected
Q2 up $1.4M versus last year
$4 per ton improvement in cash cost per ton offset by $16 per ton lower sales price
Achieved
cash cost per ton target of $115
Sale process underway
Impairment charge of
$103M; writedown to estimated fair value
Anticipate transaction by year end
Business now “held for sale”
Treated as discontinued operations
beginning in Q3
9
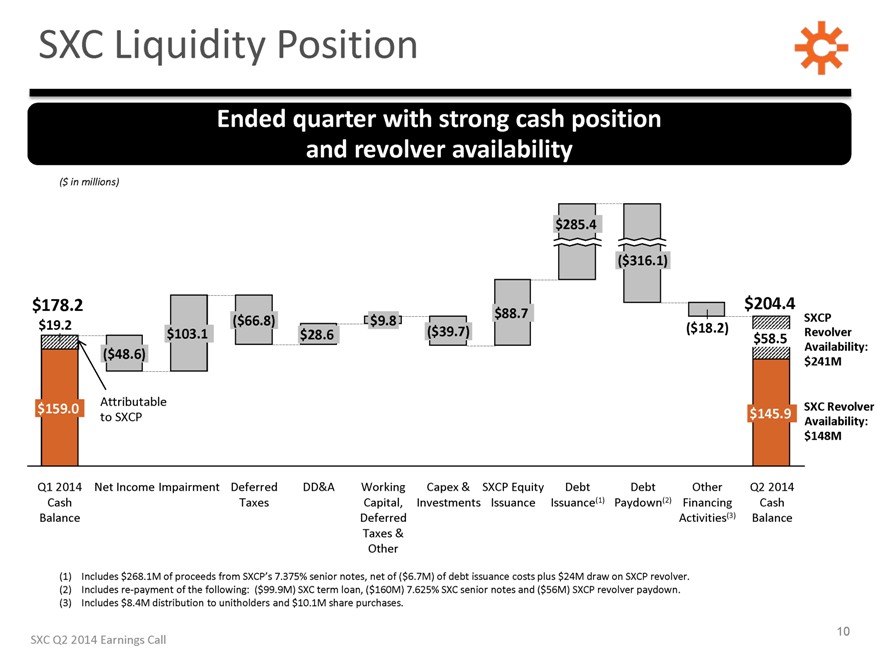
SXC Liquidity Position
Ended quarter with strong cash position and revolver availability
($ in
millions)
$285.4
($316.1)
$178.2
$204.4
$88.7
SXCP
$19.2
$103.1 ($66.8)
$28.6
$9.8 ($39.7) ($18.2)
$58.5
Revolver
($48.6)
Availability:
$241M
$159.0
Attributable
SXC Revolver
to SXCP
$145.9
Availability:
$148M
Q1 2014 Cash Balance
Net Income Impairment
Deferred Taxes
DD&A
Working Capital, Deferred Taxes & Other
Capex & Investments
SXCP Equity Issuance
Debt Issuance(1)
Debt Paydown(2)
Other Financing Activities(3)
Q2 2014 Cash Balance
(1) Includes $268.1M of proceeds from SXCP’s 7.375% senior notes,
net of ($6.7M) of debt issuance costs plus $24M draw on SXCP revolver.
(2) Includes re-payment of the following: ($99.9M) SXC term loan, ($160M) 7.625% SXC senior
notes and ($56M) SXCP revolver paydown.
(3) Includes $8.4M distribution to unitholders and $10.1M share purchases.
SXC Q2 2014 Earnings Call
10
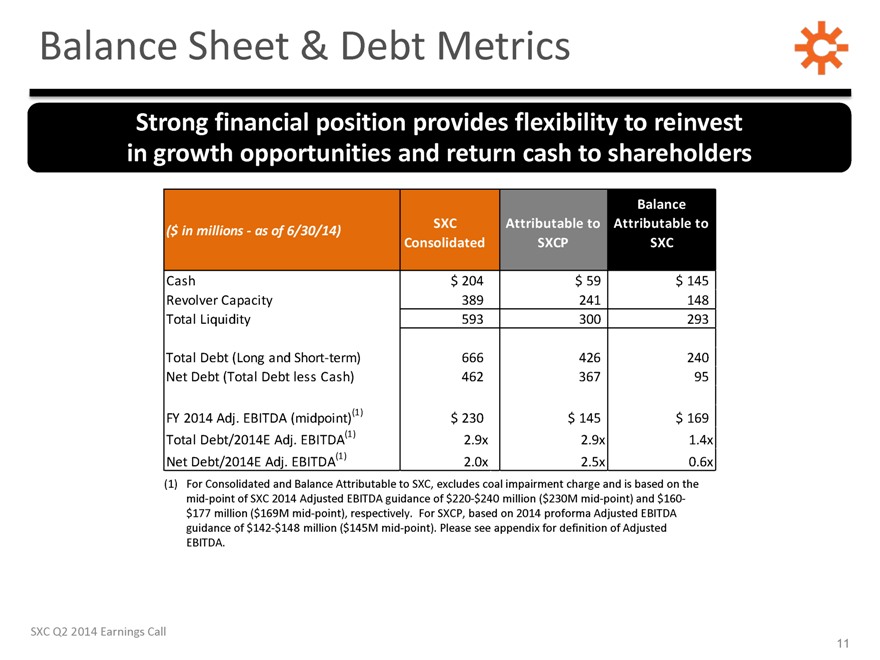
Balance Sheet & Debt Metrics
Strong financial position provides flexibility to reinvest in growth opportunities and return cash to shareholders
($ in millions - as of 6/30/14)
SXC Consolidated
Attributable to SXCP
Balance Attributable to SXC
Cash $204 $59 $145
Revolver Capacity 389 241 148
Total Liquidity 593 300 293
Total Debt (Long and Short-term) 666 426 240
Net Debt (Total Debt less Cash) 462 367 95
FY 2014 Adj. EBITDA (midpoint)(1) $230 $145 $169
Total Debt/2014E Adj. EBITDA(1) 2.9x 2.9x 1.4x
Net Debt/2014E Adj. EBITDA(1)
2.0x 2.5x 0.6x
(1) For Consolidated and Balance Attributable to SXC, excludes coal impairment charge and is based on the mid-point of SXC 2014 Adjusted EBITDA
guidance of $220-$240 million ($230M mid-point) and $160- $177 million ($169M mid-point), respectively. For SXCP, based on 2014 proforma Adjusted EBITDA guidance of $142-$148 million ($145M mid-point). Please see appendix for definition of Adjusted
EBITDA.
SXC Q2 2014 Earnings Call 11
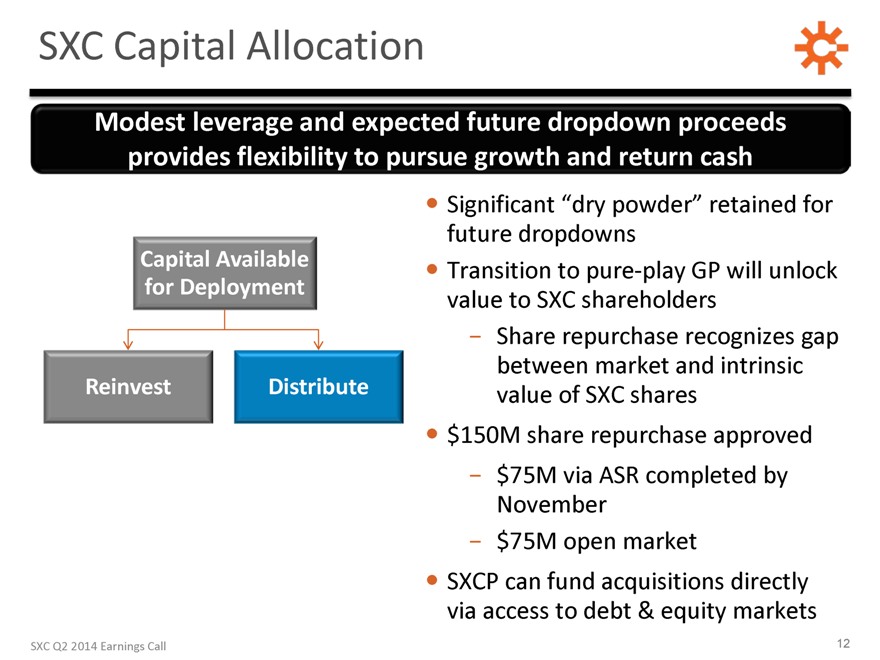
SXC Capital Allocation
Modest leverage and expected future dropdown proceeds provides flexibility to pursue growth and return cash
Capital Available
for Deployment
Reinvest
Distribute
Significant “dry powder” retained for future dropdowns
Transition to pure-play GP
will unlock value to SXC shareholders
Share repurchase recognizes gap between market and intrinsic value of SXC shares
$150M share repurchase approved
$75M via ASR completed by November
$75M open market
SXCP can fund acquisitions directly via access to debt & equity
markets
SXC Q2 2014 Earnings Call
12
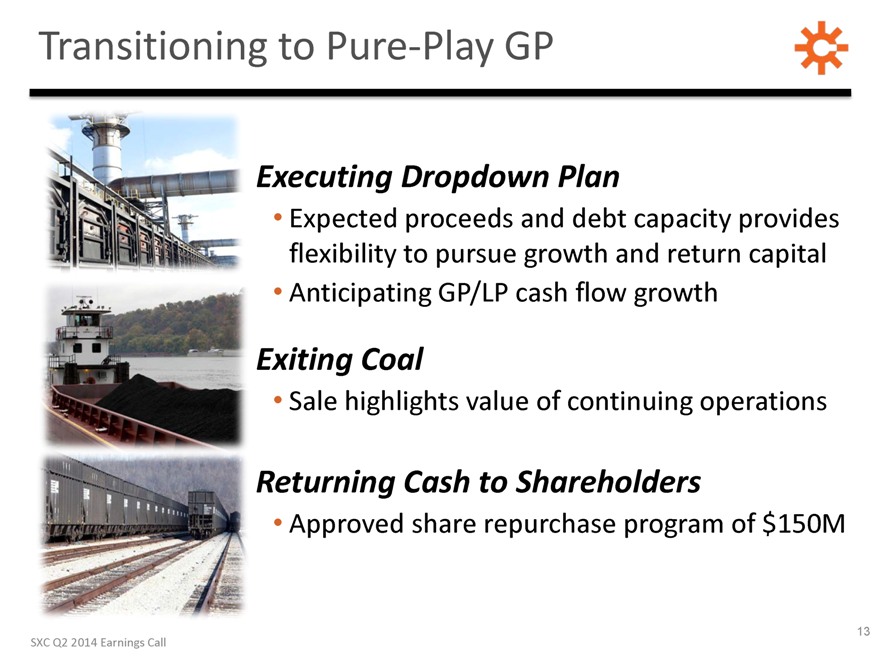
Transitioning to Pure-Play GP
Executing Dropdown Plan
Expected proceeds and debt capacity provides flexibility to pursue
growth and return capital
Anticipating GP/LP cash flow growth
Exiting Coal
Sale highlights value of continuing operations
Returning Cash to Shareholders
Approved share repurchase program of $150M
13
SXC Q2 2014 Earnings Call

QUESTIONS
SunCoke Energy
TM
SXC Q2 2014 Earnings Call
14

Investor Relations: 630-824-1907 www.suncoke.com
SunCoke Energy TM
APPENDIX
SunCoke Energy
TM
SXC Q2 2014 Earnings Call 16
Definitions
Adjusted
EBITDA represents earnings before interest, taxes, depreciation, depletion and amortization (“EBITDA”) adjusted for asset and goodwill impairment, sales discounts and the interest, taxes, depreciation, depletion and amortization
attributable to our equity method investment. EBITDA reflects sales discounts included as a reduction in sales and other operating revenue. The sales discounts represent the sharing with customers of a portion of nonconventional fuel tax credits,
which reduce our income tax expense. However, we believe our Adjusted EBITDA would be inappropriately penalized if these discounts were treated as a reduction of EBITDA since they represent sharing of a tax benefit that is not included in EBITDA.
Accordingly, in computing Adjusted EBITDA, we have added back these sales discounts. Our Adjusted EBITDA also includes EBITDA attributable to our equity method investment. EBITDA and Adjusted EBITDA do not represent and should not be considered
alternatives to net income or operating income under GAAP and may not be comparable to other similarly titled measures in other businesses. Management believes Adjusted EBITDA is an important measure of the operating performance of the
Company’s net assets and provides useful information to investors because it highlights trends in our business that may not otherwise be apparent when relying solely on GAAP measures and because it eliminates items that have less bearing on our
operating performance. Adjusted EBITDA is a measure of operating performance that is not defined by GAAP, does not represent and should not be considered a substitute for net income as determined in accordance with GAAP. Calculations of Adjusted
EBITDA may not be comparable to those reported by other companies.
EBITDA represents earnings before interest, taxes, depreciation, depletion and amortization.
Adjusted EBITDA attributable to SXC/SXCP equals Adjusted EBITDA less Adjusted EBITDA attributable to noncontrolling interests.
Adjusted EBITDA/Ton represents Adjusted EBITDA divided by tons sold.
SXC Q2 2014 Earnings Call
17
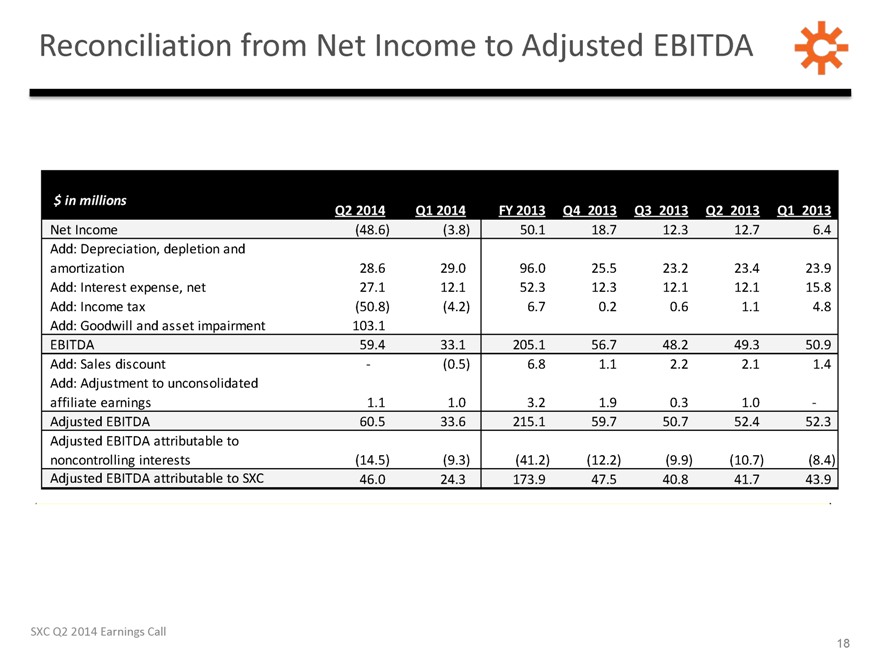
Reconciliation from Net Income to Adjusted EBITDA
$ in millions
Q2 2014
Q1 2014
FY 2013
Q4 2013
Q3 2013
Q2 2013
Q1 2013
Net Income (48.6) (3.8) 50.1 18.7 12.3 12.7 6.4
Add: Depreciation, depletion and amortization
28.6 29.0 96.0 25.5 23.2 23.4 23.9
Add: Interest expense, net 27.1 12.1 52.3 12.3 12.1 12.1 15.8
Add: Income tax (50.8) (4.2) 6.7 0.2 0.6 1.1 4.8
Add: Goodwill and asset impairment 103.1
EBITDA 59.4 33.1 205.1 56.7 48.2 49.3 50.9
Add: Sales discount - (0.5) 6.8
1.1 2.2 2.1 1.4
Add: Adjustment to unconsolidated affiliate earnings 1.1 1.0 3.2 1.9 0.3 1.0 -
Adjusted EBITDA 60.5 33.6 215.1 59.7 50.7 52.4 52.3
Adjusted EBITDA attributable to
noncontrolling interests (14.5) (9.3) (41.2) (12.2) (9.9) (10.7) (8.4)
Adjusted EBITDA attributable to SXC 46.0 24.3 173.9 47.5 40.8 41.7 43.9
SXC Q2 2014 Earnings Call
18
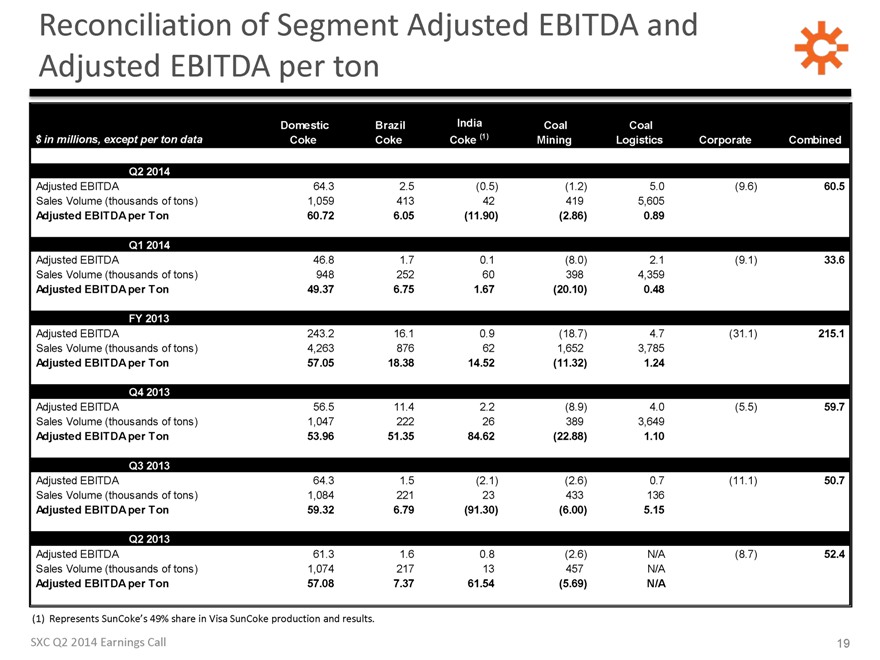
Reconciliation of Segment Adjusted EBITDA and Adjusted EBITDA per ton
$ in millions, except per ton data
Domestic Coke
Brazil Coke
India Coke (1)
Coal Mining
Coal Logistics
Corporate
Combined
Q2 2014
Adjusted EBITDA 64.3 2.5 (0.5) (1.2) 5.0 (9.6) 60.5
Sales Volume (thousands of tons) 1,059 413 42 419 5,605
Adjusted EBITDA per Ton 60.72 6.05
(11.90) (2.86) 0.89
Q1 2014
Adjusted EBITDA 46.8 1.7 0.1 (8.0) 2.1 (9.1) 33.6
Sales Volume (thousands of tons) 948 252 60 398 4,359
Adjusted EBITDA per Ton
49.37 6.75 1.67 (20.10) 0.48
FY 2013
Adjusted EBITDA 243.2 16.1 0.9 (18.7)
4.7 (31.1) 215.1
Sales Volume (thousands of tons) 4,263 876 62 1,652 3,785
Adjusted EBITDA per Ton 57.05 18.38 14.52 (11.32) 1.24
Q4 2013
Adjusted EBITDA 56.5 11.4 2.2 (8.9) 4.0 (5.5) 59.7
Sales Volume (thousands of tons) 1,047 222
26 389 3,649
Adjusted EBITDA per Ton 53.96 51.35 84.62 (22.88) 1.10
Q3 2013
Adjusted EBITDA 64.3 1.5 (2.1) (2.6) 0.7 (11.1) 50.7
Sales Volume (thousands
of tons) 1,084 221 23 433 136
Adjusted EBITDA per Ton 59.32 6.79 (91.30) (6.00) 5.15
Q2 2013
Adjusted EBITDA 61.3 1.6 0.8 (2.6) N/A (8.7) 52.4
Sales Volume (thousands of tons) 1,074 217 13 457 N/A
Adjusted EBITDA per Ton 57.08 7.37 61.54
(5.69) N/A
(1) Represents SunCoke’s 49% share in Visa SunCoke production and results.
SXC Q2 2014 Earnings Call
19
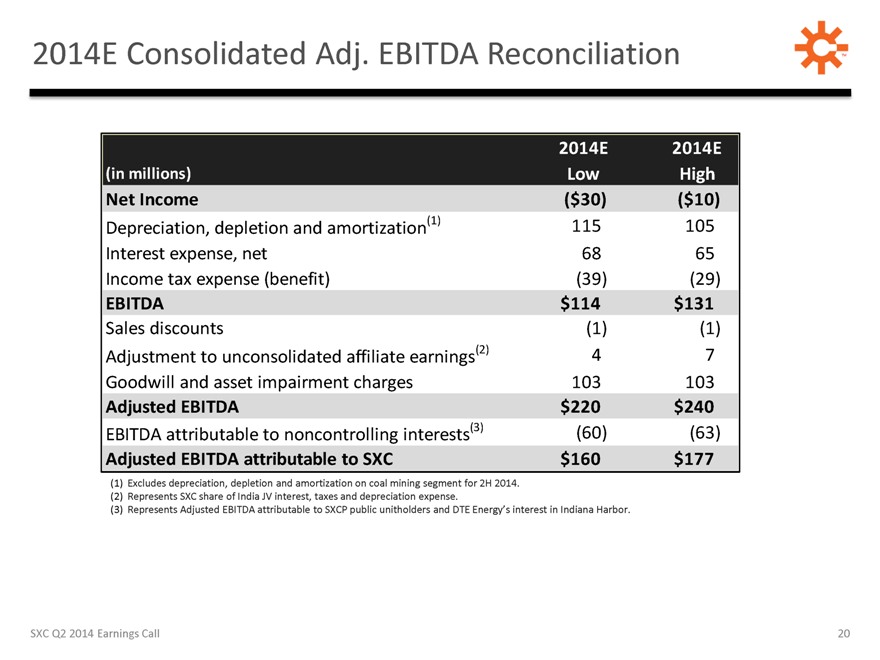
2014E Consolidated Adj. EBITDA Reconciliation TM
2014E 2014E
(in millions) Low High
Net Income ($30) ($10)
Depreciation, depletion and amortization(1) 115 105
Interest expense, net 68 65
Income tax expense (benefit) (39) (29)
EBITDA $114 $131
Sales discounts (1) (1)
Adjustment to unconsolidated affiliate earnings(2) 4 7
Goodwill and asset impairment charges
103 103
Adjusted EBITDA $220 $240
EBITDA attributable to noncontrolling
interests(3) (60) (63)
Adjusted EBITDA attributable to SXC $160 $177
(1)
Excludes depreciation, depletion and amortization on coal mining segment for 2H 2014.
(2) Represents SXC share of India JV interest, taxes and depreciation
expense.
(3) Represents Adjusted EBITDA attributable to SXCP public unitholders and DTE Energy’s interest in Indiana Harbor.
SXC Q2 2014 Earnings Call
20
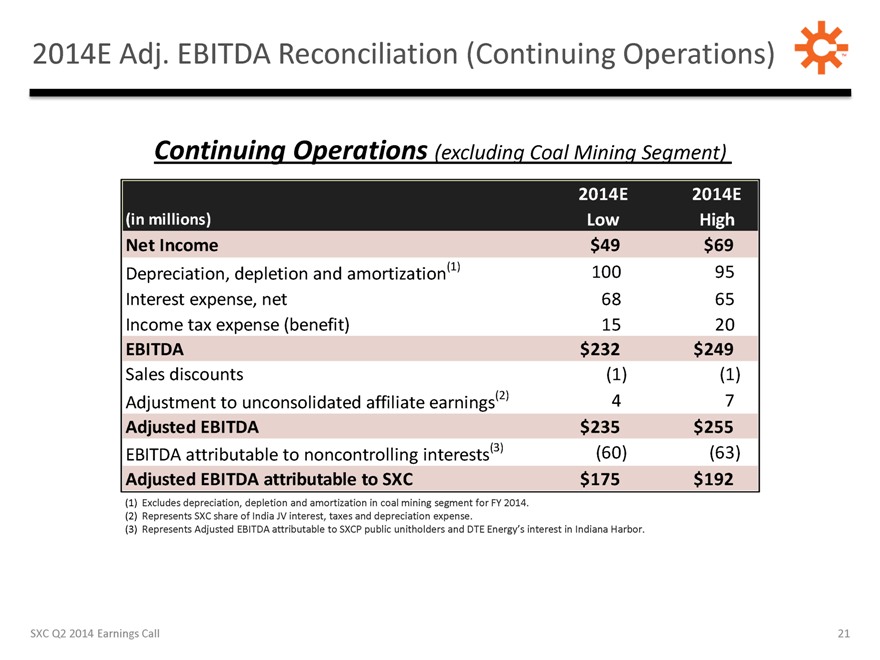
2014E Adj. EBITDA Reconciliation (Continuing Operations) TM
Continuing Operations (excluding Coal Mining Segment)
2014E 2014E
(in millions) Low High
Net Income $49 $69
Depreciation, depletion and amortization(1) 100 95
Interest expense, net 68 65
Income tax expense (benefit) 15 20
EBITDA $232 $249
Sales discounts (1) (1)
Adjustment to unconsolidated affiliate earnings(2) 4 7
Adjusted EBITDA $235 $255
EBITDA attributable to noncontrolling interests(3) (60) (63)
Adjusted EBITDA attributable to SXC $175 $192
(1) Excludes depreciation,
depletion and amortization in coal mining segment for FY 2014.
(2) Represents SXC share of India JV interest, taxes and depreciation expense.
(3) Represents Adjusted EBITDA attributable to SXCP public unitholders and DTE Energy’s interest in Indiana Harbor.
SXC Q2 2014 Earnings Call
21
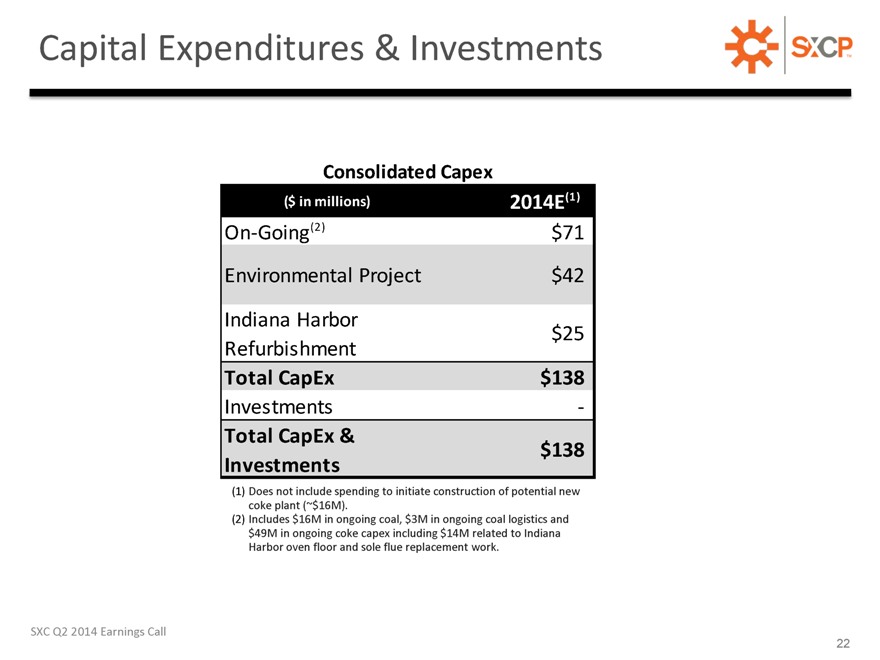
Capital Expenditures & Investments
SXCP TM
Consolidated Capex
($ in millions)
2014E(1)
On-Going(2) $71
Environmental Project $42
Indiana Harbor $25
Refurbishment
Total CapEx $138
Investments -
Total CapEx & Investments $138
(1) Does not include spending to initiate construction of
potential new coke plant (~$16M).
(2) Includes $16M in ongoing coal, $3M in ongoing coal logistics and $49M in ongoing coke capex including $14M related to Indiana
Harbor oven floor and sole flue replacement work.
SXC Q2 2014 Earnings Call
22