Attached files
| file | filename |
|---|---|
| 8-K - FORM 8-K - GENERAL DYNAMICS CORP | d759950d8k.htm |
Exhibit 99.1

| 2941 Fairview Park Drive | ||
| Suite 100 | ||
| Falls Church, VA 22042-4513 www.generaldynamics.com |
News |
July 23, 2014
Contact: Lucy Ryan
Tel: 703 876 3631
lryan@generaldynamics.com
General Dynamics Reports Second-Quarter 2014 Results
| • | Diluted EPS from continuing operations rises 3.9 percent over second-quarter 2013 |
| • | Company-wide operating margins increase to 12.7 percent |
| • | Total backlog rises to $71.1 billion, 27 percent over first-quarter 2014 |
FALLS CHURCH, Va. – General Dynamics (NYSE: GD) today reported 2014 second-quarter earnings from continuing operations of $646 million, or $1.88 per share on a diluted basis, compared to second-quarter earnings from continuing operations in 2013 of $640 million, or $1.81 per diluted share. Second-quarter 2014 revenues were $7.5 billion.
There is a charge in the quarter of $105 million in discontinued operations for the sale of a business within Combat Systems, which results in net earnings for the second quarter of $541 million, or $1.58 fully diluted earnings per share.
Margins
Company-wide operating margins for the second quarter of 2014 were 12.7 percent, a 40 basis-point improvement when compared to 12.3 percent in second-quarter 2013.
Cash
Net cash provided by operating activities in the quarter totaled $866 million. Free cash flow from operations, defined as net cash provided by operating activities less capital expenditures, was $791 million in second-quarter 2014, or 122 percent of earnings from continuing operations.
Capital Deployment
The company repurchased 10.7 million outstanding shares in the second quarter, for $1.2 billion. Year-to-date, the company has repurchased 25 million outstanding shares, for $2.7 billion.
– more –
Backlog
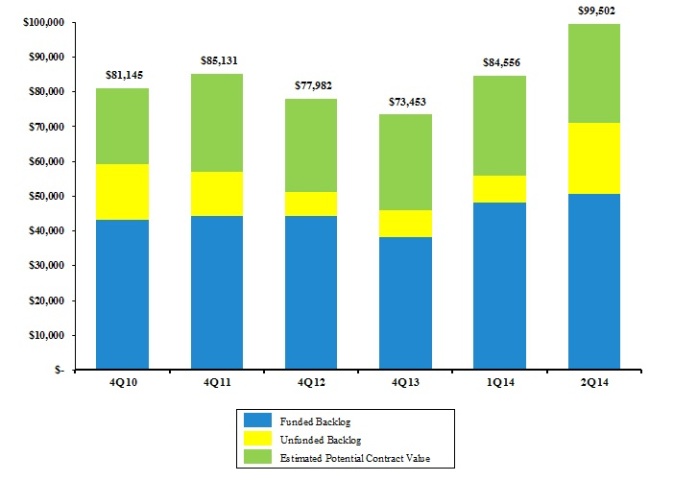
Total backlog at the end of second-quarter 2014 was $71.1 billion. Estimated potential contract value, representing management’s estimate of value in unfunded indefinite delivery, indefinite quantity (IDIQ) contracts and unexercised options, was $28.4 billion. At the end of the quarter, total potential contract value, the sum of all backlog components, was $99.5 billion.
Orders in the Aerospace group were strong in the quarter, including healthy activity across the group’s portfolio. Additional significant awards received include a $17.8 billion multi-year contract from the U.S. Navy for the construction of 10 additional Virginia-class submarines, $645 million for support on the Canadian Maritime Helicopter Project, $425 million from the Centers for Medicare & Medicaid Services for contact-center services, $290 million from the U.S. Army for the production of 93 Stryker double-V-hulled vehicles and contractor logistics support, and $125 million for the construction of an additional product carrier from an affiliate of American Petroleum Tankers.
“General Dynamics’ strong second quarter performance reflects our continued focus on program execution and operational improvements,” said Phebe N. Novakovic, chairman and chief executive officer. “We have a solid building block for the future with an increased defense backlog and robust order activity across the portfolio of Gulfstream business jets.”
General Dynamics, headquartered in Falls Church, Virginia, employs approximately 89,600 people worldwide. The company is a market leader in business aviation; combat vehicles, weapons systems and munitions; shipbuilding; and communication and information technology systems and solutions. More information about the company is available at www.generaldynamics.com.
Certain statements made in this press release, including any statements as to future results of operations and financial projections, may constitute “forward-looking statements” within the meaning of the Private Securities Litigation Reform Act of 1995, as amended. Forward-looking statements are based on management’s expectations, estimates, projections and assumptions. These statements are not guarantees of future performance and involve certain risks and uncertainties, which are difficult to predict. Therefore, actual future results and trends may differ materially from what is forecast in forward-looking statements due to a variety of factors. Additional information regarding these factors is contained in the company’s filings with the Securities and Exchange Commission, including, without limitation, its Annual Report on Form 10-K and its Quarterly Reports on Form 10-Q.
– more –
All forward-looking statements speak only as of the date they were made. The company does not undertake any obligation to update or publicly release any revisions to any forward-looking statements to reflect events, circumstances or changes in expectations after the date of this press release.
WEBCAST INFORMATION: General Dynamics will webcast its second-quarter securities analyst conference call, scheduled for 9 a.m. EDT on Wednesday, July 23, 2014. The webcast will be a listen-only audio event, available at www.generaldynamics.com. An on-demand replay of the webcast will be available by 12 p.m. EDT on July 23 and will continue for 12 months. To hear a recording of the conference call by telephone, please call 888-286-8010 (international: 617-801-6888); passcode 66081812. The phone replay will be available from 12 p.m. July 23 through July 30, 2014.
– more –
EXHIBIT A
CONSOLIDATED STATEMENTS OF EARNINGS - (UNAUDITED)
DOLLARS IN MILLIONS, EXCEPT PER SHARE AMOUNTS
| Second Quarter | Variance | |||||||||||||||
| 2013 | 2014 | $ | % | |||||||||||||
| Revenues |
$ | 7,834 | $ | 7,474 | $ | (360 | ) | (4.6 | )% | |||||||
| Operating costs and expenses |
6,873 | 6,525 | 348 | |||||||||||||
|
|
|
|
|
|
|
|||||||||||
| Operating earnings |
961 | 949 | (12 | ) | (1.2 | )% | ||||||||||
| Interest, net |
(18 | ) | (24 | ) | (6 | ) | ||||||||||
|
|
|
|
|
|
|
|||||||||||
| Earnings before income taxes |
943 | 925 | (18 | ) | (1.9 | )% | ||||||||||
| Provision for income taxes |
303 | 279 | 24 | |||||||||||||
|
|
|
|
|
|
|
|||||||||||
| Earnings from continuing operations |
$ | 640 | $ | 646 | $ | 6 | 0.9 | % | ||||||||
|
|
|
|
|
|
|
|||||||||||
| Discontinued operations, net of tax |
— | (105 | ) | (105 | ) | |||||||||||
|
|
|
|
|
|
|
|||||||||||
| Net earnings |
$ | 640 | $ | 541 | $ | (99 | ) | (15.5 | )% | |||||||
|
|
|
|
|
|
|
|||||||||||
| Earnings per share—basic |
||||||||||||||||
| Continuing operations |
$ | 1.82 | $ | 1.92 | $ | 0.10 | 5.5 | % | ||||||||
| Discontinued operations |
$ | — | $ | (0.31 | ) | $ | (0.31 | ) | ||||||||
|
|
|
|
|
|
|
|||||||||||
| Earnings per share—basic |
$ | 1.82 | $ | 1.61 | $ | (0.21 | ) | (11.5 | )% | |||||||
|
|
|
|
|
|
|
|||||||||||
| Basic weighted average shares outstanding |
351.1 | 336.7 | ||||||||||||||
|
|
|
|
|
|||||||||||||
| Earnings per share—diluted |
||||||||||||||||
| Continuing operations |
$ | 1.81 | $ | 1.88 | $ | 0.07 | 3.9 | % | ||||||||
| Discontinued operations |
$ | — | $ | (0.30 | ) | $ | (0.30 | ) | ||||||||
|
|
|
|
|
|
|
|||||||||||
| Earnings per share—diluted |
$ | 1.81 | $ | 1.58 | $ | (0.23 | ) | (12.7 | )% | |||||||
|
|
|
|
|
|
|
|||||||||||
| Diluted weighted average shares outstanding |
352.9 | 342.8 | ||||||||||||||
|
|
|
|
|
|||||||||||||
Note: Prior period information has been restated to reflect our axle business in discontinued operations.
– more –
EXHIBIT B
CONSOLIDATED STATEMENTS OF EARNINGS - (UNAUDITED)
DOLLARS IN MILLIONS, EXCEPT PER SHARE AMOUNTS
| Six Months | Variance | |||||||||||||||
| 2013 | 2014 | $ | % | |||||||||||||
| Revenues |
$ | 15,148 | $ | 14,739 | $ | (409 | ) | (2.7 | )% | |||||||
| Operating costs and expenses |
13,344 | 12,916 | 428 | |||||||||||||
|
|
|
|
|
|
|
|||||||||||
| Operating earnings |
1,804 | 1,823 | 19 | 1.1 | % | |||||||||||
| Interest, net |
(41 | ) | (46 | ) | (5 | ) | ||||||||||
| Other, net |
— | 1 | 1 | |||||||||||||
|
|
|
|
|
|
|
|||||||||||
| Earnings before income taxes |
1,763 | 1,778 | 15 | 0.9 | % | |||||||||||
| Provision for income taxes |
553 | 536 | 17 | |||||||||||||
|
|
|
|
|
|
|
|||||||||||
| Earnings from continuing operations |
$ | 1,210 | $ | 1,242 | $ | 32 | 2.6 | % | ||||||||
|
|
|
|
|
|
|
|||||||||||
| Discontinued operations, net of tax |
1 | (106 | ) | (107 | ) | |||||||||||
|
|
|
|
|
|
|
|||||||||||
| Net earnings |
$ | 1,211 | $ | 1,136 | $ | (75 | ) | (6.2 | )% | |||||||
|
|
|
|
|
|
|
|||||||||||
| Earnings per share—basic |
||||||||||||||||
| Continuing operations |
$ | 3.45 | $ | 3.66 | $ | 0.21 | 6.1 | % | ||||||||
| Discontinued operations |
$ | — | $ | (0.31 | ) | $ | (0.31 | ) | ||||||||
|
|
|
|
|
|
|
|||||||||||
| Net earnings |
$ | 3.45 | $ | 3.35 | $ | (0.10 | ) | (2.9 | )% | |||||||
|
|
|
|
|
|
|
|||||||||||
| Basic weighted average shares outstanding |
351.5 | 339.5 | ||||||||||||||
|
|
|
|
|
|||||||||||||
| Earnings per share—diluted |
||||||||||||||||
| Continuing operations |
$ | 3.43 | $ | 3.60 | $ | 0.17 | 5.0 | % | ||||||||
| Discontinued operations |
$ | — | $ | (0.31 | ) | $ | (0.31 | ) | ||||||||
|
|
|
|
|
|
|
|||||||||||
| Net earnings |
$ | 3.43 | $ | 3.29 | $ | (0.14 | ) | (4.1 | )% | |||||||
|
|
|
|
|
|
|
|||||||||||
| Diluted weighted average shares outstanding |
353.2 | 345.4 | ||||||||||||||
|
|
|
|
|
|||||||||||||
Note: Prior period information has been restated to reflect our axle business in discontinued operations.
– more –
EXHIBIT C
REVENUES AND OPERATING EARNINGS BY SEGMENT - (UNAUDITED)
DOLLARS IN MILLIONS
| Second Quarter | Variance | |||||||||||||||
| 2013 | 2014 | $ | % | |||||||||||||
| Revenues: |
||||||||||||||||
| Aerospace |
$ | 2,053 | $ | 1,995 | $ | (58 | ) | (2.8 | )% | |||||||
| Combat Systems |
1,472 | 1,465 | (7 | ) | (0.5 | )% | ||||||||||
| Marine Systems |
1,759 | 1,851 | 92 | 5.2 | % | |||||||||||
| Information Systems and Technology |
2,550 | 2,163 | (387 | ) | (15.2 | )% | ||||||||||
|
|
|
|
|
|
|
|||||||||||
| Total |
$ | 7,834 | $ | 7,474 | $ | (360 | ) | (4.6 | )% | |||||||
|
|
|
|
|
|
|
|||||||||||
| Operating earnings: |
||||||||||||||||
| Aerospace |
$ | 389 | $ | 384 | $ | (5 | ) | (1.3 | )% | |||||||
| Combat Systems |
219 | 220 | 1 | 0.5 | % | |||||||||||
| Marine Systems |
178 | 174 | (4 | ) | (2.2 | )% | ||||||||||
| Information Systems and Technology |
198 | 188 | (10 | ) | (5.1 | )% | ||||||||||
| Corporate |
(23 | ) | (17 | ) | 6 | 26.1 | % | |||||||||
|
|
|
|
|
|
|
|||||||||||
| Total |
$ | 961 | $ | 949 | $ | (12 | ) | (1.2 | )% | |||||||
|
|
|
|
|
|
|
|||||||||||
| Operating margins: |
||||||||||||||||
| Aerospace |
18.9 | % | 19.2 | % | ||||||||||||
| Combat Systems |
14.9 | % | 15.0 | % | ||||||||||||
| Marine Systems |
10.1 | % | 9.4 | % | ||||||||||||
| Information Systems and Technology |
7.8 | % | 8.7 | % | ||||||||||||
| Total |
12.3 | % | 12.7 | % | ||||||||||||
Note: Prior period information has been restated to reflect our axle business in discontinued operations.
– more –
EXHIBIT D
REVENUES AND OPERATING EARNINGS BY SEGMENT - (UNAUDITED)
DOLLARS IN MILLIONS
| Six Months | Variance | |||||||||||||||
| 2013 | 2014 | $ | % | |||||||||||||
| Revenues: |
||||||||||||||||
| Aerospace |
$ | 3,831 | $ | 4,120 | $ | 289 | 7.5 | % | ||||||||
| Combat Systems |
2,935 | 2,723 | (212 | ) | (7.2 | )% | ||||||||||
| Marine Systems |
3,385 | 3,452 | 67 | 2.0 | % | |||||||||||
| Information Systems and Technology |
4,997 | 4,444 | (553 | ) | (11.1 | )% | ||||||||||
|
|
|
|
|
|
|
|||||||||||
| Total |
$ | 15,148 | $ | 14,739 | $ | (409 | ) | (2.7 | )% | |||||||
|
|
|
|
|
|
|
|||||||||||
| Operating earnings: |
||||||||||||||||
| Aerospace |
$ | 699 | $ | 788 | $ | 89 | 12.7 | % | ||||||||
| Combat Systems |
430 | 359 | (71 | ) | (16.5 | )% | ||||||||||
| Marine Systems |
337 | 340 | 3 | 0.9 | % | |||||||||||
| Information Systems and Technology |
383 | 371 | (12 | ) | (3.1 | )% | ||||||||||
| Corporate |
(45 | ) | (35 | ) | 10 | 22.2 | % | |||||||||
|
|
|
|
|
|
|
|||||||||||
| Total |
$ | 1,804 | $ | 1,823 | $ | 19 | 1.1 | % | ||||||||
|
|
|
|
|
|
|
|||||||||||
| Operating margins: |
||||||||||||||||
| Aerospace |
18.2 | % | 19.1 | % | ||||||||||||
| Combat Systems |
14.7 | % | 13.2 | % | ||||||||||||
| Marine Systems |
10.0 | % | 9.8 | % | ||||||||||||
| Information Systems and Technology |
7.7 | % | 8.3 | % | ||||||||||||
| Total |
11.9 | % | 12.4 | % | ||||||||||||
Note: Prior period information has been restated to reflect our axle business in discontinued operations.
– more –
EXHIBIT E
CONSOLIDATED BALANCE SHEETS - (UNAUDITED)
DOLLARS IN MILLIONS
| December 31, 2013 | June 29, 2014 | |||||||
| ASSETS |
||||||||
| Current assets: |
||||||||
| Cash and equivalents |
$ | 5,301 | $ | 3,841 | ||||
| Accounts receivable |
4,370 | 4,474 | ||||||
| Contracts in process |
4,780 | 4,934 | ||||||
| Inventories |
2,890 | 3,158 | ||||||
| Other current assets |
821 | 776 | ||||||
|
|
|
|
|
|||||
| Total current assets |
18,162 | 17,183 | ||||||
|
|
|
|
|
|||||
| Noncurrent assets: |
||||||||
| Property, plant and equipment, net |
3,359 | 3,327 | ||||||
| Intangible assets, net |
1,044 | 983 | ||||||
| Goodwill |
11,932 | 11,927 | ||||||
| Other assets |
997 | 912 | ||||||
|
|
|
|
|
|||||
| Total noncurrent assets |
17,332 | 17,149 | ||||||
|
|
|
|
|
|||||
| Total assets |
$ | 35,494 | $ | 34,332 | ||||
|
|
|
|
|
|||||
| LIABILITIES AND SHAREHOLDERS’ EQUITY |
||||||||
| Current liabilities: |
||||||||
| Short-term debt and current portion of long-term debt |
$ | 1 | $ | 501 | ||||
| Accounts payable |
2,216 | 2,486 | ||||||
| Customer advances and deposits |
6,584 | 6,694 | ||||||
| Other current liabilities |
3,458 | 3,541 | ||||||
|
|
|
|
|
|||||
| Total current liabilities |
12,259 | 13,222 | ||||||
|
|
|
|
|
|||||
| Noncurrent liabilities: |
||||||||
| Long-term debt |
3,908 | 3,409 | ||||||
| Other liabilities |
4,826 | 4,582 | ||||||
|
|
|
|
|
|||||
| Total noncurrent liabilities |
8,734 | 7,991 | ||||||
|
|
|
|
|
|||||
| Shareholders’ equity: |
||||||||
| Common stock |
482 | 482 | ||||||
| Surplus |
2,226 | 2,415 | ||||||
| Retained earnings |
19,428 | 20,142 | ||||||
| Treasury stock |
(6,450 | ) | (8,816 | ) | ||||
| Accumulated other comprehensive loss |
(1,185 | ) | (1,104 | ) | ||||
|
|
|
|
|
|||||
| Total shareholders’ equity |
14,501 | 13,119 | ||||||
|
|
|
|
|
|||||
| Total liabilities and shareholders’ equity |
$ | 35,494 | $ | 34,332 | ||||
|
|
|
|
|
|||||
Note: Prior period information has been restated to reflect our axle business in discontinued operations.
– more –
EXHIBIT F
CONSOLIDATED STATEMENTS OF CASH FLOWS - (UNAUDITED)
DOLLARS IN MILLIONS
| Six Months Ended | ||||||||
| June 30, 2013 | June 29, 2014 | |||||||
| Cash flows from operating activities—continuing operations: |
||||||||
| Net earnings |
$ | 1,211 | $ | 1,136 | ||||
| Adjustments to reconcile net earnings to net cash provided by operating activities: |
||||||||
| Depreciation of property, plant and equipment |
186 | 191 | ||||||
| Amortization of intangible assets |
79 | 61 | ||||||
| Stock-based compensation expense |
61 | 64 | ||||||
| Excess tax benefit from stock-based compensation |
(16 | ) | (54 | ) | ||||
| Deferred income tax provision |
47 | 64 | ||||||
| Discontinued operations, net of tax |
(1 | ) | 106 | |||||
| Increase in assets, net of effects of business acquisitions: |
||||||||
| Accounts receivable |
(102 | ) | (104 | ) | ||||
| Contracts in process |
(125 | ) | (130 | ) | ||||
| Inventories |
(161 | ) | (278 | ) | ||||
| Increase (decrease) in liabilities, net of effects of business acquisitions: |
||||||||
| Accounts payable |
(10 | ) | 270 | |||||
| Customer advances and deposits |
(54 | ) | 25 | |||||
| Income taxes payable |
50 | 188 | ||||||
| Other current liabilities |
(149 | ) | (81 | ) | ||||
| Other, net |
71 | (164 | ) | |||||
|
|
|
|
|
|||||
| Net cash provided by operating activities |
1,087 | 1,294 | ||||||
|
|
|
|
|
|||||
| Cash flows from investing activities—continuing operations: |
||||||||
| Capital expenditures |
(165 | ) | (162 | ) | ||||
| Other, net |
4 | 17 | ||||||
|
|
|
|
|
|||||
| Net cash used by investing activities |
(161 | ) | (145 | ) | ||||
|
|
|
|
|
|||||
| Cash flows from financing activities—continuing operations: |
||||||||
| Purchases of common stock |
(485 | ) | (2,691 | ) | ||||
| Proceeds from option exercises |
212 | 415 | ||||||
| Dividends paid |
(198 | ) | (411 | ) | ||||
| Excess tax benefit from stock-based compensation |
16 | 54 | ||||||
|
|
|
|
|
|||||
| Net cash used by financing activities |
(455 | ) | (2,633 | ) | ||||
|
|
|
|
|
|||||
| Net cash (used) provided by discontinued operations |
(10 | ) | 24 | |||||
|
|
|
|
|
|||||
| Net increase (decrease) in cash and equivalents |
461 | (1,460 | ) | |||||
| Cash and equivalents at beginning of period |
3,296 | 5,301 | ||||||
|
|
|
|
|
|||||
| Cash and equivalents at end of period |
$ | 3,757 | $ | 3,841 | ||||
|
|
|
|
|
|||||
Note: Prior period information has been restated to reflect our axle business in discontinued operations.
– more –
EXHIBIT G
PRELIMINARY FINANCIAL INFORMATION - (UNAUDITED)
DOLLARS IN MILLIONS EXCEPT PER SHARE AND EMPLOYEE AMOUNTS
| Second Quarter 2013 |
Second Quarter 2014 |
|||||||||||||||
| Other Financial Information(g): |
||||||||||||||||
| Debt-to-equity (a) |
33.2 | % | 29.8 | % | ||||||||||||
| Debt-to-capital (b) |
24.9 | % | 23.0 | % | ||||||||||||
| Book value per share (c) |
$ | 33.60 | $ | 39.24 | ||||||||||||
| Total taxes paid |
$ | 442 | $ | 214 | ||||||||||||
| Company-sponsored research and development (d) |
$ | 77 | $ | 98 | ||||||||||||
| Employment |
90,100 | 89,600 | ||||||||||||||
| Sales per employee (e) |
$ | 339,500 | $ | 327,100 | ||||||||||||
| Shares outstanding |
349,867,839 | 334,315,950 | ||||||||||||||
| Non-GAAP Financial Measures(g): |
||||||||||||||||
| Quarter | Year-to-date | Quarter | Year-to-date | |||||||||||||
| Free cash flow from operations: |
||||||||||||||||
| Net cash provided by operating activities |
$ | 582 | $ | 1,087 | $ | 866 | $ | 1,294 | ||||||||
| Capital expenditures |
(92 | ) | (165 | ) | (75 | ) | (162 | ) | ||||||||
|
|
|
|
|
|
|
|
|
|||||||||
| Free cash flow from operations (f) |
$ | 490 | $ | 922 | $ | 791 | $ | 1,132 | ||||||||
|
|
|
|
|
|
|
|
|
|||||||||
| (a) | Debt-to-equity ratio is calculated as total debt divided by total equity as of the end of the period. |
| (b) | Debt-to-capital ratio is calculated as total debt divided by the sum of total debt plus total equity as of the end of the period. |
| (c) | Book value per share is calculated as total equity divided by total outstanding shares as of the end of the period. |
| (d) | Includes independent research and development and Gulfstream product-development costs. |
| (e) | Sales per employee is calculated by dividing revenues for the latest 12-month period by our average number of employees during that period. |
| (f) | We believe free cash flow from operations is a measurement that is useful to investors because it portrays our ability to generate cash from our core businesses for such purposes as repaying maturing debt, funding business acquisitions and paying dividends. We use free cash flow from operations to assess the quality of our earnings and as a performance measure in evaluating management. The most directly comparable GAAP measure to free cash flow from operations is net cash provided by operating activities. |
| (g) | Prior period information has been restated to reflect our axle business in discontinued operations. |
– more –
EXHIBIT H
BACKLOG - (UNAUDITED)
DOLLARS IN MILLIONS
| Funded | Unfunded | Total Backlog |
Estimated Potential Contract Value* |
Total Potential Contract Value |
||||||||||||||||
| Second Quarter 2014 |
||||||||||||||||||||
| Aerospace |
$ | 12,556 | $ | 172 | $ | 12,728 | $ | 1,920 | $ | 14,648 | ||||||||||
| Combat Systems |
15,363 | 852 | 16,215 | 8,074 | 24,289 | |||||||||||||||
| Marine Systems |
15,458 | 17,747 | 33,205 | 1,938 | 35,143 | |||||||||||||||
| Information Systems and Technology |
7,343 | 1,602 | 8,945 | 16,477 | 25,422 | |||||||||||||||
|
|
|
|
|
|
|
|
|
|
|
|||||||||||
| Total |
$ | 50,720 | $ | 20,373 | $ | 71,093 | $ | 28,409 | $ | 99,502 | ||||||||||
|
|
|
|
|
|
|
|
|
|
|
|||||||||||
| First Quarter 2014 |
||||||||||||||||||||
| Aerospace |
$ | 12,747 | $ | 199 | $ | 12,946 | $ | 2,000 | $ | 14,946 | ||||||||||
| Combat Systems |
15,870 | 885 | 16,755 | 8,143 | 24,898 | |||||||||||||||
| Marine Systems |
12,447 | 5,248 | 17,695 | 2,046 | 19,741 | |||||||||||||||
| Information Systems and Technology |
7,134 | 1,343 | 8,477 | 16,494 | 24,971 | |||||||||||||||
|
|
|
|
|
|
|
|
|
|
|
|||||||||||
| Total |
$ | 48,198 | $ | 7,675 | $ | 55,873 | $ | 28,683 | $ | 84,556 | ||||||||||
|
|
|
|
|
|
|
|
|
|
|
|||||||||||
| Second Quarter 2013 |
||||||||||||||||||||
| Aerospace |
$ | 14,480 | $ | 183 | $ | 14,663 | $ | — | $ | 14,663 | ||||||||||
| Combat Systems |
5,790 | 1,129 | 6,919 | 3,025 | 9,944 | |||||||||||||||
| Marine Systems |
12,771 | 5,149 | 17,920 | 3,900 | 21,820 | |||||||||||||||
| Information Systems and Technology |
7,943 | 1,856 | 9,799 | 20,788 | 30,587 | |||||||||||||||
|
|
|
|
|
|
|
|
|
|
|
|||||||||||
| Total |
$ | 40,984 | $ | 8,317 | $ | 49,301 | $ | 27,713 | $ | 77,014 | ||||||||||
|
|
|
|
|
|
|
|
|
|
|
|||||||||||
| * | The estimated potential contract value represents management’s estimate of our future contract value under unfunded indefinite delivery, indefinite quantity (IDIQ) contracts and unexercised options associated with existing firm contracts, including options to purchase new aircraft and long-term agreements with fleet customers, as applicable. Because the value in the unfunded IDIQ arrangements is subject to the customer’s future exercise of an indeterminate quantity of orders, we recognize these contracts in backlog only when they are funded. Unexercised options are recognized in backlog when the customer exercises the option and establishes a firm order. |
Note: Prior period information has been restated to reflect our axle business in discontinued operations.
– more –
EXHIBIT H-1
BACKLOG AND ESTIMATED CONTRACT VALUE - UNAUDITED
DOLLARS IN MILLIONS
Note: Prior period information has been restated to reflect our axle business in discontinued operations.
– more –
EXHIBIT I
SECOND QUARTER 2014 SIGNIFICANT ORDERS (UNAUDITED)
DOLLARS IN MILLIONS
We received the following significant orders during the second quarter of 2014:
Combat Systems
| • | $290 from the U.S. Army under the Stryker wheeled armored vehicle program for the production of 93 double-V-hulled vehicles and for contractor logistics support. |
| • | $50 from the U.S. Marine Corps for production of seven light armored vehicle (LAV) upgrade kits, testing and customer support. |
Marine Systems
| • | $17.8 billion from the U.S. Navy for the construction of 10 Virginia-class submarines under the multi-year Block IV contract, including $1.2 billion that was previously recognized as orders for long-lead material. |
| • | $125 for the construction of a Jones Act product carrier from an affiliate of American Petroleum Tankers. |
| • | $85 from the Navy for design work, including advanced nuclear plant studies, for the next-generation ballistic-missile submarine. |
| • | $65 from the Navy for long-lead material for the fourth Mobile Landing Platform (MLP), configured as an Afloat Forward Staging Base (AFSB). |
Information Systems and Technology
| • | $645 to extend the period of performance for support on the Canadian Maritime Helicopter Project (MHP). |
| • | $425 from the Centers for Medicare & Medicaid Services (CMS) for contact-center services. |
| • | $105 from the Navy for the procurement of material to support production of guidance and missile hardware. |
| • | $80 from the Army under the Warfighter Information Network-Tactical (WIN-T) program for equipment and support services. |
| • | $75 to provide design and support services on the U.S. Air Force’s Space Fence program. |
| • | $70 from the Army for ruggedized computing equipment under the Common Hardware Systems-4 (CHS-4) program. |
| • | $60 from the U.K. Ministry of Defence for tactical communication systems spares and services. |
| • | An indefinite delivery, indefinite quantity (IDIQ) contract from the Department of Homeland Security (DHS) to enhance mission effectiveness and create economies of scale through enhanced integration and consolidation. The program has a maximum potential value of $700 over seven years. |
– more –
EXHIBIT J
AEROSPACE SUPPLEMENTAL DATA - (UNAUDITED)
| Second Quarter | Six Months | |||||||||||||||
| 2013 | 2014 | 2013 | 2014 | |||||||||||||
| Gulfstream Green Deliveries (units): |
||||||||||||||||
| Large-cabin aircraft |
30 | 26 | 55 | 55 | ||||||||||||
| Mid-cabin aircraft |
5 | 7 | 10 | 13 | ||||||||||||
|
|
|
|
|
|
|
|
|
|||||||||
| Total |
35 | 33 | 65 | 68 | ||||||||||||
|
|
|
|
|
|
|
|
|
|||||||||
| Gulfstream Outfitted Deliveries (units): |
||||||||||||||||
| Large-cabin aircraft |
30 | 26 | 55 | 59 | ||||||||||||
| Mid-cabin aircraft |
6 | 12 | 10 | 18 | ||||||||||||
|
|
|
|
|
|
|
|
|
|||||||||
| Total |
36 | 38 | 65 | 77 | ||||||||||||
|
|
|
|
|
|
|
|
|
|||||||||
| Pre-owned Deliveries (units): |
3 | — | 5 | — | ||||||||||||
|
|
|
|
|
|
|
|
|
|||||||||
###