Attached files
| file | filename |
|---|---|
| 8-K - FORM 8-K - AVIENT CORP | d760082d8k.htm |

NEWS RELEASE
FOR IMMEDIATE RELEASE
PolyOne Announces Second Quarter 2014 Results
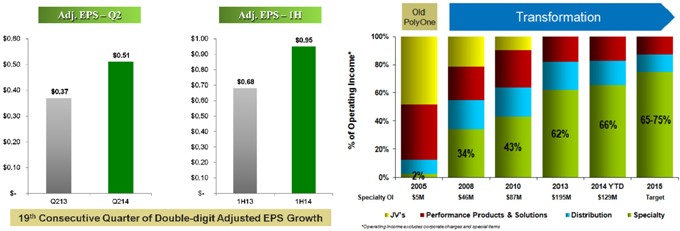
| • | Adjusted earnings per share increased 38% to $0.51, marking the 19th consecutive quarter of double-digit adjusted EPS growth; GAAP EPS totaled $0.33 versus $0.39 in the prior year quarter |
| • | Led by the Specialty Platform, all segments delivered year-over-year operating income gains driven by continued mix improvement and synergies from the Spartech acquisition |
| • | Free cash flow for the quarter increased to $100 million, expanding capacity for further investment to drive growth |
CLEVELAND – July 21, 2014 – PolyOne Corporation (NYSE: POL) today reported its second quarter results. As expected and to drive earnings growth, the company continued to exit certain unprofitable products associated with the Spartech acquisition completed in March of last year. Accordingly, revenues were $1.01 billion for the second quarter of 2014, compared to $1.04 billion in the second quarter of 2013.
These actions, coupled with other ongoing initiatives to expand margins, resulted in a 38% increase in adjusted earnings per share to $0.51 for the second quarter of 2014, up from $0.37 in the second quarter of 2013. Recently announced asset realignment actions taken in Brazil led to higher restructuring costs this quarter. As a result, GAAP earnings per share totaled $0.33 for the second quarter of 2014 versus $0.39 in the second quarter of 2013.
“I am pleased to report adjusted earnings per share increased 38% to $0.51 for the second quarter representing an all-time high for PolyOne,” said president and chief executive officer Robert M. Patterson. “This marks our 19th consecutive quarter of year-over-year double-digit adjusted EPS growth – an impressive accomplishment reflecting the power and sustainability of our strategy.”
Mr. Patterson added, “Mix improvement continues to be at the heart of our transformation as our specialty businesses reached record levels of operating income and profitability for the quarter. Driven by an expanding portfolio of specialty solutions, our underlying mix of earnings has never been stronger with specialty now contributing two-thirds of our segment income.”
“Our strong track record of converting earnings to cash continued this quarter as we generated $100 million of free cash flow,” said executive vice president and chief financial officer Bradley C. Richardson.
Mr. Richardson continued, “We ended the quarter with $261.5 million in cash. This, coupled with our availability under our asset-based revolver, gives us significant capacity to invest in innovation, aggressively pursue acquisition opportunities and deliver cash to shareholders. During the quarter, we repurchased approximately 1.8 million shares at an average price of $38.15, bringing the total share buyback since early 2013 to 8.2 million shares.”
Commenting on the company’s outlook, Mr. Patterson said, “We are very pleased with our first half performance in 2014 and the underlying momentum and strength of our earnings growth. While our second quarter is seasonally our strongest, we expect to deliver strong year-over-year double-digit EPS expansion for the balance of 2014. With a growing pipeline of new and differentiated solutions, we are very confident in our ability to continue to create value for our customers and deliver market-beating performance for our shareholders.”
2
About PolyOne
PolyOne Corporation, with 2013 revenues of $3.8 billion, is a premier provider of specialized polymer materials, services and solutions. The company is dedicated to serving customers in diverse industries around the globe, by creating value through collaboration, innovation and an unwavering commitment to excellence. Guided by its Core Values, Sustainability Promise and No Surprises Pledge(SM), PolyOne is committed to its customers, employees, communities and shareholders through ethical, sustainable and fiscally responsible principles. For more information, visit www.polyone.com.
To access PolyOne’s news library online, please visit www.polyone.com/news.
# # #
Investor Relations Contact:
Isaac D. DeLuca
Vice President, Investor Relations
PolyOne Corporation
+1 440-930-1226
isaac.deluca@polyone.com
Media Contact:
Kyle Rose
Director, Corporate Communications
PolyOne Corporation
+1 440-930-3162
kyle.rose@polyone.com
3
Forward-looking Statements
In this press release, statements that are not reported financial results or other historical information are “forward-looking statements” within the meaning of the Private Securities Litigation Reform Act of 1995. Forward-looking statements give current expectations or forecasts of future events and are not guarantees of future performance. They are based on management’s expectations that involve a number of business risks and uncertainties, any of which could cause actual results to differ materially from those expressed in or implied by the forward-looking statements. They use words such as “will,” “anticipate,” “estimate,” “expect,” “project,” “intend,” “plan,” “believe,” and other words and terms of similar meaning in connection with any discussion of future operating or financial condition, performance and/or sales. Factors that could cause actual results to differ materially from those implied by these forward-looking statements include, but are not limited to: our ability to realize anticipated savings and operational benefits from the realignment of assets, including the planned closure of certain manufacturing facilities; the timing of closings and shifts of production to new facilities related to asset realignments and any unforeseen disruptions of service or quality caused by such closings and/or production shifts; separation and severance amounts that differ from original estimates, amounts for non-cash charges related to asset write-offs and accelerated depreciation realignments of property, plant and equipment, that differ from original estimates; our ability to identify and evaluate acquisition targets and consummate acquisitions; the ability to successfully integrate acquired companies into our operations, retain the management teams of acquired companies and retain relationships with customers of acquired companies including without limitations Spartech Corporation; disruptions, uncertainty or volatility in the credit markets that could adversely impact the availability of credit already arranged and the availability and cost of credit in the future; the financial condition of our customers, including the ability of customers (especially those that may be highly leveraged and those with inadequate liquidity) to maintain their credit availability; the speed and extent of an economic recovery, including the recovery of the housing market; our ability to achieve new business gains; the effect on foreign operations of currency fluctuations, tariffs and other political, economic and regulatory risks; changes in polymer consumption growth rates where we conduct business; changes in global industry capacity or in the rate at which anticipated changes in industry capacity come online; fluctuations in raw material prices, quality and supply and in energy prices and supply; production outages or material costs associated with scheduled or unscheduled maintenance programs; unanticipated developments that could occur with respect to contingencies such as litigation and environmental matters; an inability to achieve or delays in achieving or achievement of less than the anticipated financial benefit from initiatives related to working capital reductions, cost reductions and employee productivity goals; an inability to raise or sustain prices for products or services; an inability to maintain appropriate relations with unions and employees; our ability to continue to pay cash dividends; the amount and timing of repurchases of our common shares, if any; and other factors affecting our business beyond our control, including, without limitation, changes in the general economy, changes in interest rates and changes in the rate of inflation. The above list of factors is not exhaustive.
We undertake no obligation to publicly update forward-looking statements, whether as a result of new information, future events or otherwise. You are advised to consult any further disclosures we make on related subjects in our reports on Form 10-Q, 8-K and 10-K that we provide to the Securities and Exchange Commission.
4
Attachment 1
PolyOne Corporation
Summary of Condensed Consolidated Statements of Income (Unaudited)
(In millions, except per share data)
| Three Months Ended June 30, |
Six Months Ended June 30, |
|||||||||||||||
| 2014 | 2013 | 2014 | 2013 | |||||||||||||
| Sales |
$ | 1,005.5 | $ | 1,037.6 | $ | 2,007.8 | $ | 1,838.7 | ||||||||
| Operating income |
49.4 | 80.7 | 105.8 | 121.2 | ||||||||||||
| Net income from continuing operations attributable to PolyOne shareholders |
30.9 | 38.6 | 60.3 | 49.8 | ||||||||||||
| Basic earnings per share from continuing operations attributable to PolyOne shareholders |
$ | 0.33 | $ | 0.39 | $ | 0.64 | $ | 0.52 | ||||||||
| Diluted earnings per share from continuing operations attributable to PolyOne shareholders |
$ | 0.33 | $ | 0.39 | $ | 0.63 | $ | 0.52 | ||||||||
Senior management uses comparisons of adjusted net income from continuing operations attributable to PolyOne shareholders and diluted earnings per share (EPS) from continuing operations attributable to PolyOne shareholders excluding special items to assess performance and facilitate comparability of results. Below is a reconciliation of these non-GAAP financial measures to their most directly comparable measures calculated and presented in accordance with U.S. GAAP (GAAP).
| Three Months Ended June 30, 2014 |
Three Months Ended June 30, 2013 |
|||||||||||||||
| Reconciliation to Condensed Consolidated Statements of Income | $ | EPS | $ | EPS | ||||||||||||
| Net income from continuing operations attributable to PolyOne shareholders |
$ | 30.9 | $ | 0.33 | $ | 38.6 | $ | 0.39 | ||||||||
| Special items, after tax (Attachment 3) |
22.6 | 0.24 | (2.2 | ) | (0.02 | ) | ||||||||||
| Tax adjustments (a) |
(5.2 | ) | (0.06 | ) | 0.2 | — | ||||||||||
|
|
|
|
|
|
|
|
|
|||||||||
| Adjusted net income / EPS |
$ | 48.3 | $ | 0.51 | $ | 36.6 | $ | 0.37 | ||||||||
|
|
|
|
|
|
|
|
|
|||||||||
| Six Months Ended June 30, 2014 |
Six Months Ended June 30, 2013 |
|||||||||||||||
| Reconciliation to Condensed Consolidated Statements of Income | $ | EPS | $ | EPS | ||||||||||||
| Net income from continuing operations attributable to PolyOne shareholders |
$ | 60.3 | $ | 0.63 | $ | 49.8 | $ | 0.52 | ||||||||
| Special items, after tax (Attachment 3) |
36.7 | 0.39 | 15.0 | 0.16 | ||||||||||||
| Tax adjustments (a) |
(6.8 | ) | (0.07 | ) | 0.7 | — | ||||||||||
|
|
|
|
|
|
|
|
|
|||||||||
| Adjusted net income / EPS |
$ | 90.2 | $ | 0.95 | $ | 65.5 | $ | 0.68 | ||||||||
|
|
|
|
|
|
|
|
|
|||||||||
| (a) | Tax adjustments include the net tax expense (benefit) from one-time income tax items and deferred income tax valuation allowance adjustments. |
5
Attachment 2
PolyOne Corporation
Condensed Consolidated Statements of Income (Unaudited)
(In millions, except per share data)
| Three Months Ended June 30, |
Six Months Ended June 30, |
|||||||||||||||
| 2014 | 2013 | 2014 | 2013 | |||||||||||||
| Sales |
$ | 1,005.5 | $ | 1,037.6 | $ | 2,007.8 | $ | 1,838.7 | ||||||||
| Cost of sales |
821.0 | 833.9 | 1,635.1 | 1,472.7 | ||||||||||||
|
|
|
|
|
|
|
|
|
|||||||||
| Gross margin |
184.5 | 203.7 | 372.7 | 366.0 | ||||||||||||
| Selling and administrative expense |
135.1 | 123.0 | 266.9 | 244.9 | ||||||||||||
| Income related to previously owned equity affiliates |
— | — | — | 0.1 | ||||||||||||
|
|
|
|
|
|
|
|
|
|||||||||
| Operating income |
49.4 | 80.7 | 105.8 | 121.2 | ||||||||||||
| Interest expense, net |
(15.7 | ) | (16.6 | ) | (31.2 | ) | (32.2 | ) | ||||||||
| Debt extinguishment costs |
— | — | — | (10.6 | ) | |||||||||||
| Other (expense) income, net |
(0.4 | ) | (1.2 | ) | (1.4 | ) | 0.2 | |||||||||
|
|
|
|
|
|
|
|
|
|||||||||
| Income from continuing operations before income taxes |
33.3 | 62.9 | 73.2 | 78.6 | ||||||||||||
| Income tax expense |
(2.6 | ) | (24.6 | ) | (13.3 | ) | (29.3 | ) | ||||||||
|
|
|
|
|
|
|
|
|
|||||||||
| Net income from continuing operations |
30.7 | 38.3 | 59.9 | 49.3 | ||||||||||||
| Income from discontinued operations, net of income taxes |
0.8 | 142.3 | 0.8 | 146.4 | ||||||||||||
|
|
|
|
|
|
|
|
|
|||||||||
| Net income |
31.5 | 180.6 | 60.7 | 195.7 | ||||||||||||
| Net loss attributable to noncontrolling interests |
0.2 | 0.3 | 0.4 | 0.5 | ||||||||||||
|
|
|
|
|
|
|
|
|
|||||||||
| Net income attributable to PolyOne common shareholders |
$ | 31.7 | $ | 180.9 | $ | 61.1 | $ | 196.2 | ||||||||
|
|
|
|
|
|
|
|
|
|||||||||
| Earnings per common share attributable to PolyOne common shareholders - Basic: |
||||||||||||||||
| Continuing operations |
$ | 0.33 | $ | 0.39 | $ | 0.64 | $ | 0.52 | ||||||||
| Discontinued operations |
0.01 | 1.46 | 0.01 | 1.55 | ||||||||||||
|
|
|
|
|
|
|
|
|
|||||||||
| Total |
$ | 0.34 | $ | 1.85 | $ | 0.65 | $ | 2.07 | ||||||||
| Earnings per common share attributable to PolyOne common shareholders - Diluted: |
||||||||||||||||
| Continuing operations |
$ | 0.33 | $ | 0.39 | $ | 0.63 | $ | 0.52 | ||||||||
| Discontinued operations |
0.01 | 1.44 | 0.01 | 1.53 | ||||||||||||
|
|
|
|
|
|
|
|
|
|||||||||
| Total |
$ | 0.34 | $ | 1.83 | $ | 0.64 | $ | 2.05 | ||||||||
| Cash dividends declared per share of common stock |
$ | 0.08 | $ | 0.06 | $ | 0.16 | $ | 0.12 | ||||||||
| Weighted-average shares used to compute earnings per share: |
||||||||||||||||
| Basic |
93.0 | 97.7 | 93.7 | 94.7 | ||||||||||||
| Diluted |
94.3 | 99.1 | 94.9 | 95.8 | ||||||||||||
6
Attachment 3
PolyOne Corporation
Summary of Special Items (Unaudited)
(In millions, except per share data)
| Special items (1) | Three Months Ended June 30, |
Six Months Ended June 30, |
||||||||||||||
| 2014 | 2013 | 2014 | 2013 | |||||||||||||
| Cost of sales: |
||||||||||||||||
| Plant phase-out costs |
$ | (22.1 | ) | $ | — | $ | (33.1 | ) | $ | — | ||||||
| Reimbursement of previously incurred environmental costs |
— | 14.9 | — | 20.1 | ||||||||||||
| Environmental remediation costs |
(0.9 | ) | (1.3 | ) | (1.8 | ) | (3.3 | ) | ||||||||
| Acquisition related costs |
— | (3.5 | ) | — | (7.6 | ) | ||||||||||
|
|
|
|
|
|
|
|
|
|||||||||
| Impact on cost of sales |
(23.0 | ) | 10.1 | (34.9 | ) | 9.2 | ||||||||||
| Selling and administrative expense: |
||||||||||||||||
| Employee separation and plant phase-out costs |
(19.6 | ) | (3.1 | ) | (29.7 | ) | (14.8 | ) | ||||||||
| Unrealized gain on foreign currency option contracts |
— | 0.2 | — | 0.6 | ||||||||||||
| Acquisition/divestiture related costs |
(0.5 | ) | (1.4 | ) | (0.7 | ) | (6.0 | ) | ||||||||
| Legal related and other |
3.3 | (0.6 | ) | 2.6 | (0.5 | ) | ||||||||||
|
|
|
|
|
|
|
|
|
|||||||||
| Impact on selling and administrative expense |
(16.8 | ) | (4.9 | ) | (27.8 | ) | (20.7 | ) | ||||||||
| Gain on sale of investment in equity affiliates |
— | — | — | 0.1 | ||||||||||||
|
|
|
|
|
|
|
|
|
|||||||||
| Impact on operating income |
(39.8 | ) | 5.2 | (62.7 | ) | (11.4 | ) | |||||||||
| Debt extinguishment costs |
— | — | — | (10.6 | ) | |||||||||||
| Bridge loan commitment fees – interest expense |
— | — | — | (1.9 | ) | |||||||||||
| Other income, net |
0.5 | — | 0.5 | 1.4 | ||||||||||||
|
|
|
|
|
|
|
|
|
|||||||||
| Impact on income from continuing operations before income taxes |
(39.3 | ) | 5.2 | (62.2 | ) | (22.5 | ) | |||||||||
| Income tax benefit (expense) on special items |
16.7 | (3.0 | ) | 25.5 | 7.5 | |||||||||||
|
|
|
|
|
|
|
|
|
|||||||||
| Impact of special items on net income attributable to PolyOne Shareholders |
$ | (22.6 | ) | $ | 2.2 | $ | (36.7 | ) | $ | (15.0 | ) | |||||
|
|
|
|
|
|
|
|
|
|||||||||
| Basic earnings per common share impact |
$ | (0.24 | ) | $ | 0.02 | $ | (0.39 | ) | $ | (0.16 | ) | |||||
| Diluted earnings per common share impact |
$ | (0.24 | ) | $ | 0.02 | $ | (0.39 | ) | $ | (0.16 | ) | |||||
| Weighted average shares used to compute earnings per share: |
||||||||||||||||
| Basic |
93.0 | 97.7 | 93.7 | 94.7 | ||||||||||||
| Diluted |
94.3 | 99.1 | 94.9 | 95.8 | ||||||||||||
| (1) | Special items are a non-GAAP financial measure. Special items include charges related to specific strategic initiatives or financial restructurings such as: consolidation of operations; debt extinguishment costs; employee separation costs resulting from personnel reduction programs, plant phase-out costs, executive separation agreements; asset impairments; mark-to-market adjustments associated with actuarial gains and losses on pension and other postretirement benefit plans; environmental remediation costs, fines, penalties, remediation costs and related insurance recoveries related to facilities no longer owned or closed in prior years; gains and losses on the divestiture of operating businesses, joint ventures and equity investments; gains and losses on facility or property sales or disposals; results of litigation, fines or penalties, where such litigation (or action relating to the fines or penalties) arose prior to the commencement of the performance period; unrealized gains and losses from foreign currency option contracts; one-time, non-recurring items; and the effect of changes in accounting principles or other such laws or provisions affecting reported results. |
7
Attachment 4
PolyOne Corporation
Condensed Consolidated Balance Sheets
(In millions)
| (Unaudited) June 30, 2014 |
December 31, 2013 |
|||||||
| Assets |
||||||||
| Current assets: |
||||||||
| Cash and cash equivalents |
$ | 261.5 | $ | 365.2 | ||||
| Accounts receivable, net |
501.3 | 428.0 | ||||||
| Inventories, net |
315.7 | 342.5 | ||||||
| Other current assets |
100.5 | 117.9 | ||||||
|
|
|
|
|
|||||
| Total current assets |
1,179.0 | 1,253.6 | ||||||
| Property, net |
612.3 | 646.2 | ||||||
| Goodwill |
568.9 | 559.0 | ||||||
| Intangible assets, net |
354.5 | 365.8 | ||||||
| Other non-current assets |
132.0 | 119.5 | ||||||
|
|
|
|
|
|||||
| Total assets |
$ | 2,846.7 | $ | 2,944.1 | ||||
|
|
|
|
|
|||||
| Liabilities and Shareholders’ Equity |
||||||||
| Current liabilities: |
||||||||
| Short-term and current portion of long-term debt |
$ | 12.7 | $ | 12.7 | ||||
| Accounts payable |
422.5 | 386.9 | ||||||
| Accrued expenses and other liabilities |
170.8 | 209.3 | ||||||
|
|
|
|
|
|||||
| Total current liabilities |
606.0 | 608.9 | ||||||
| Non-current liabilities: |
||||||||
| Long-term debt |
967.9 | 976.2 | ||||||
| Pension and other post-retirement benefits |
63.7 | 77.3 | ||||||
| Deferred income taxes |
113.7 | 133.8 | ||||||
| Other non-current liabilities |
182.4 | 169.4 | ||||||
|
|
|
|
|
|||||
| Total non-current liabilities |
1,327.7 | 1,356.7 | ||||||
| Shareholders’ equity: |
||||||||
| PolyOne shareholders’ equity |
911.7 | 976.8 | ||||||
| Noncontrolling interests |
1.3 | 1.7 | ||||||
|
|
|
|
|
|||||
| Total equity |
913.0 | 978.5 | ||||||
|
|
|
|
|
|||||
| Total liabilities and shareholders’ equity |
$ | 2,846.7 | $ | 2,944.1 | ||||
|
|
|
|
|
|||||
8
Attachment 5
PolyOne Corporation
Condensed Consolidated Statements of Cash Flows (Unaudited)
(In millions)
| Six Months Ended June 30, |
||||||||
| 2014 | 2013 | |||||||
| Operating Activities |
||||||||
| Net income |
$ | 60.7 | $ | 195.7 | ||||
| Adjustments to reconcile net income to net cash provided (used) by operating activities: |
||||||||
| Depreciation and amortization |
72.2 | 45.8 | ||||||
| Debt extinguishment costs |
— | 10.6 | ||||||
| Provision for doubtful accounts |
0.3 | — | ||||||
| Stock based compensation expense |
10.1 | 10.1 | ||||||
| Gain on sale of business |
(0.8 | ) | (223.6 | ) | ||||
| Change in assets and liabilities, net of effect of acquisitions and divestitures: |
||||||||
| Increase in accounts receivable |
(74.0 | ) | (70.6 | ) | ||||
| Decrease (increase) in inventories |
23.4 | (3.9 | ) | |||||
| Increase in accounts payable |
35.9 | 15.5 | ||||||
| Decrease in pension and other post-retirement benefits |
(21.1 | ) | (65.7 | ) | ||||
| (Decrease) increase in accrued expenses and other assets and liabilities - net |
(62.9 | ) | 60.9 | |||||
|
|
|
|
|
|||||
| Net cash provided (used) by operating activities |
43.8 | (25.2 | ) | |||||
| Investing Activities |
||||||||
| Capital expenditures |
(38.0 | ) | (26.7 | ) | ||||
| Business acquisitions, net of cash acquired |
— | (259.4 | ) | |||||
| Proceeds from sale of equity affiliate and other assets |
27.3 | 274.1 | ||||||
|
|
|
|
|
|||||
| Net cash used by investing activities |
(10.7 | ) | (12.0 | ) | ||||
| Financing Activities |
||||||||
| Repayment of long-term debt |
(8.0 | ) | (297.0 | ) | ||||
| Proceeds from long-term debt |
— | 600.0 | ||||||
| Debt financing costs |
— | (13.0 | ) | |||||
| Borrowings under credit facilities |
20.9 | 125.0 | ||||||
| Repayments under credit facilities |
(20.9 | ) | (117.5 | ) | ||||
| Purchase of common shares |
(119.9 | ) | (71.2 | ) | ||||
| Exercise of stock awards |
6.3 | 3.3 | ||||||
| Cash dividends paid |
(15.1 | ) | (9.9 | ) | ||||
|
|
|
|
|
|||||
| Net cash (used) provided by financing activities |
(136.7 | ) | 219.7 | |||||
| Effect of exchange rate changes on cash |
(0.1 | ) | (0.1 | ) | ||||
|
|
|
|
|
|||||
| (Decrease) increase in cash and cash equivalents |
(103.7 | ) | 182.4 | |||||
| Cash and cash equivalents at beginning of period |
365.2 | 210.0 | ||||||
|
|
|
|
|
|||||
| Cash and cash equivalents at end of period |
$ | 261.5 | $ | 392.4 | ||||
|
|
|
|
|
|||||
9
Attachment 6
PolyOne Corporation
Business Segment and Platform Operations (Unaudited)
(In millions)
Operating income at the segment level does not include: special items as defined on Attachment 3; corporate general and administration costs that are not allocated to segments; intersegment sales and profit eliminations; share-based compensation costs; and certain other items that are not included in the measure of segment profit and loss that is reported to and reviewed by the chief operating decision maker. These costs are included in Corporate and eliminations.
| Three Months Ended June 30, |
Six Months Ended June 30, |
|||||||||||||||
| 2014 | 2013 | 2014 | 2013 | |||||||||||||
| Sales: |
||||||||||||||||
| Global Color, Additives and Inks |
$ | 228.7 | $ | 229.4 | $ | 448.3 | $ | 434.7 | ||||||||
| Global Specialty Engineered Materials |
157.8 | 158.8 | 315.2 | 311.7 | ||||||||||||
| Designed Structures and Solutions |
164.0 | 198.9 | 337.6 | 240.4 | ||||||||||||
|
|
|
|
|
|
|
|
|
|||||||||
| Specialty Platform |
550.5 | 587.1 | 1,101.1 | 986.8 | ||||||||||||
| Performance Products and Solutions |
211.2 | 210.3 | 418.8 | 376.9 | ||||||||||||
| PolyOne Distribution |
287.0 | 275.1 | 571.1 | 543.1 | ||||||||||||
| Corporate and eliminations |
(43.2 | ) | (34.9 | ) | (83.2 | ) | (68.1 | ) | ||||||||
|
|
|
|
|
|
|
|
|
|||||||||
| Sales |
$ | 1,005.5 | $ | 1,037.6 | $ | 2,007.8 | $ | 1,838.7 | ||||||||
|
|
|
|
|
|
|
|
|
|||||||||
| Gross margin: |
||||||||||||||||
| Global Color, Additives and Inks |
$ | 81.7 | $ | 75.2 | $ | 156.6 | $ | 142.9 | ||||||||
| Global Specialty Engineered Materials |
43.5 | 39.0 | 86.1 | 78.2 | ||||||||||||
| Designed Structures and Solutions |
26.3 | 25.5 | 52.5 | 30.7 | ||||||||||||
|
|
|
|
|
|
|
|
|
|||||||||
| Specialty Platform |
151.5 | 139.7 | 295.2 | 251.8 | ||||||||||||
| Performance Products and Solutions |
29.0 | 26.9 | 57.0 | 50.9 | ||||||||||||
| PolyOne Distribution |
28.8 | 28.1 | 58.6 | 56.3 | ||||||||||||
| Corporate and eliminations |
(24.8 | ) | 9.0 | (38.1 | ) | 7.0 | ||||||||||
|
|
|
|
|
|
|
|
|
|||||||||
| Gross margin |
$ | 184.5 | $ | 203.7 | $ | 372.7 | $ | 366.0 | ||||||||
|
|
|
|
|
|
|
|
|
|||||||||
| Selling and administrative expense: |
||||||||||||||||
| Global Color, Additives and Inks |
$ | 44.0 | $ | 44.3 | $ | 88.5 | $ | 87.8 | ||||||||
| Global Specialty Engineered Materials |
24.6 | 24.0 | 48.9 | 47.4 | ||||||||||||
| Designed Structures and Solutions |
13.4 | 16.5 | 28.4 | 20.2 | ||||||||||||
|
|
|
|
|
|
|
|
|
|||||||||
| Specialty Platform |
82.0 | 84.8 | 165.8 | 155.4 | ||||||||||||
| Performance Products and Solutions |
11.4 | 11.6 | 23.4 | 22.0 | ||||||||||||
| PolyOne Distribution |
11.5 | 11.2 | 24.1 | 23.2 | ||||||||||||
| Corporate and eliminations |
30.2 | 15.4 | 53.6 | 44.3 | ||||||||||||
|
|
|
|
|
|
|
|
|
|||||||||
| Selling and administrative expense |
$ | 135.1 | $ | 123.0 | $ | 266.9 | $ | 244.9 | ||||||||
|
|
|
|
|
|
|
|
|
|||||||||
| Operating income: |
||||||||||||||||
| Global Color, Additives and Inks |
$ | 37.7 | $ | 30.9 | $ | 68.1 | $ | 55.1 | ||||||||
| Global Specialty Engineered Materials |
18.9 | 15.0 | 37.2 | 30.8 | ||||||||||||
| Designed Structures and Solutions |
12.9 | 9.0 | 24.1 | 10.5 | ||||||||||||
|
|
|
|
|
|
|
|
|
|||||||||
| Specialty Platform |
69.5 | 54.9 | 129.4 | 96.4 | ||||||||||||
| Performance Products and Solutions |
17.6 | 15.3 | 33.6 | 28.9 | ||||||||||||
| PolyOne Distribution |
17.3 | 16.9 | 34.5 | 33.1 | ||||||||||||
| Corporate and eliminations |
(55.0 | ) | (6.4 | ) | (91.7 | ) | (37.2 | ) | ||||||||
|
|
|
|
|
|
|
|
|
|||||||||
| Operating income |
$ | 49.4 | $ | 80.7 | $ | 105.8 | $ | 121.2 | ||||||||
|
|
|
|
|
|
|
|
|
|||||||||
Specialty Platform consists of our three specialty segments: Global Specialty Engineered Materials; Global Color, Additives and Inks; and Designed Structures and Solutions. We present Specialty Platform sales, gross margin, selling and administration, and operating income because management believes that this is useful information to investors by highlighting our collective progress in advancing our specialization strategy.
10
Attachment 7
PolyOne Corporation
Reconciliation of Non-GAAP Financial Measures (Unaudited)
(In millions, except per share data)
Senior management uses gross margin before special items and operating income before special items to assess performance and allocate resources because senior management believes that these measures are useful in understanding current profitability levels and that current levels may serve as a base for future performance. In addition, operating income before the effect of special items is a component of various PolyOne annual and long-term employee incentive plans and is used in debt covenant computations. Below is a reconciliation of non-GAAP financial measures to the most directly comparable measures calculated and presented in accordance with GAAP. See Attachment 3 for a definition of special items.
| Three Months Ended June 30, |
Six Months Ended June 30, |
|||||||||||||||
| Reconciliation to Consolidated Statements of Income | 2014 | 2013 | 2014 | 2013 | ||||||||||||
| Sales |
$ | 1,005.5 | $ | 1,037.6 | $ | 2,007.8 | $ | 1,838.7 | ||||||||
| Gross margin before special items |
207.5 | 193.6 | 407.6 | 356.8 | ||||||||||||
| Special items in gross margin (Attachment 3) |
(23.0 | ) | 10.1 | (34.9 | ) | 9.2 | ||||||||||
|
|
|
|
|
|
|
|
|
|||||||||
| Gross margin - GAAP |
$ | 184.5 | $ | 203.7 | $ | 372.7 | $ | 366.0 | ||||||||
|
|
|
|
|
|
|
|
|
|||||||||
| Gross margin before special items as a percent of sales |
20.6 | % | 18.7 | % | 20.3 | % | 19.4 | % | ||||||||
| Operating income adjusted |
89.2 | 75.5 | 168.5 | 132.6 | ||||||||||||
| Special items in operating income (Attachment 3) |
(39.8 | ) | 5.2 | (62.7 | ) | (11.4 | ) | |||||||||
|
|
|
|
|
|
|
|
|
|||||||||
| Operating income - GAAP |
$ | 49.4 | $ | 80.7 | $ | 105.8 | $ | 121.2 | ||||||||
|
|
|
|
|
|
|
|
|
|||||||||
| Operating income before special items as a percent of sales |
8.9 | % | 7.3 | % | 8.4 | % | 7.2 | % | ||||||||
Senior management uses the “Mix Shift Highlights Specialty Transformation” graph to show PolyOne’s progression toward its specialty targets.
| Specialty Platform % of Operating Income | 2005Y* | 2008Y* | 2010Y* | 2013Y | Q2 2014Y | |||||||||||||||
| Global Color, Additives and Inks |
$ | 4.3 | $ | 28.1 | $ | 37.7 | $ | 104.0 | $ | 68.1 | ||||||||||
| Global Specialty Engineered Materials |
0.4 | 17.6 | 49.7 | 57.2 | 37.2 | |||||||||||||||
| Designed Structures and Solutions |
— | — | — | 33.4 | 24.1 | |||||||||||||||
|
|
|
|
|
|
|
|
|
|
|
|||||||||||
| Specialty Platform |
$ | 4.7 | $ | 45.7 | $ | 87.4 | $ | 194.6 | $ | 129.4 | ||||||||||
| Performance Products and Solutions |
75.7 | 31.3 | 54.0 | 56.0 | 33.6 | |||||||||||||||
| Distribution |
19.5 | 28.1 | 42.0 | 63.3 | 34.5 | |||||||||||||||
| Joint ventures |
91.9 | 28.6 | 18.9 | — | — | |||||||||||||||
| Corporate and eliminations |
(51.5 | ) | (425.1 | ) | (27.7 | ) | (82.4 | ) | (91.7 | ) | ||||||||||
|
|
|
|
|
|
|
|
|
|
|
|||||||||||
| Operating income (loss) |
$ | 140.3 | $ | (291.4 | ) | $ | 174.6 | $ | 231.5 | $ | 105.8 | |||||||||
| Less: Corporate and special items |
51.5 | 425.1 | 27.7 | 82.4 | 91.7 | |||||||||||||||
|
|
|
|
|
|
|
|
|
|
|
|||||||||||
| Operating income excluding Corporate and special items |
$ | 191.8 | $ | 133.7 | $ | 202.3 | $ | 313.9 | $ | 197.5 | ||||||||||
|
|
|
|
|
|
|
|
|
|
|
|||||||||||
| Specialty platform operating mix percentage |
2 | % | 34 | % | 43 | % | 62 | % | 66 | % | ||||||||||
| * | Historical results are shown as presented in prior filings and have not been updated to reflect subsequent changes in accounting principal or discontinued operations. |
11