Attached files
| file | filename |
|---|---|
| EX-10.22.1 - EX-10.22.1 - YODLEE INC | d684206dex10221.htm |
| EX-10.1 - EX-10.1 - YODLEE INC | d684206dex101.htm |
| EX-10.14 - EX-10.14 - YODLEE INC | d684206dex1014.htm |
| EX-23.1 - EX-23.1 - YODLEE INC | d684206dex231.htm |
Table of Contents
As filed with the Securities and Exchange Commission on July 18, 2014.
Registration No. 333-197116
UNITED STATES
SECURITIES AND EXCHANGE COMMISSION
Washington, D.C. 20549
AMENDMENT NO. 1
TO
FORM S-1
REGISTRATION STATEMENT
UNDER
THE SECURITIES ACT OF 1933
Yodlee, Inc.
(Exact name of Registrant as specified in its charter)
| Delaware | 7372 | 33-0843318 | ||
| (State or other jurisdiction of incorporation or organization) |
(Primary Standard Industrial Classification Code Number) |
(I.R.S. Employer Identification Number) |
3600 Bridge Parkway, Suite 200
Redwood City, California 94065
(650) 980-3600
(Address, including zip code, and telephone number, including area code, of Registrant’s principal executive offices)
Anil Arora, President and Chief Executive Officer
Michael Armsby, Chief Financial Officer
Yodlee, Inc.
3600 Bridge Parkway, Suite 200
Redwood City, California 94065
(650) 980-3600
(Name, address, including zip code, and telephone number, including area code, of agent for service)
Copies to:
| Barry E. Taylor, Esq. Allison B. Spinner, Esq. Wilson Sonsini Goodrich & Rosati Professional Corporation 650 Page Mill Road Palo Alto, CA 94304 (650) 493-9300 |
Chad A. Wiechers, Esq. Vice President and General Counsel Yodlee, Inc. 3600 Bridge Parkway, Suite 200 Redwood City, California 94065 (650) 980-3600 |
John L. Savva, Esq. Sullivan & Cromwell LLP 1870 Embarcadero Road Palo Alto, CA 94303 (650) 461-5600 |
Approximate date of commencement of proposed sale to the public: As soon as practicable after this registration statement becomes effective.
If any of the securities being registered on this Form are to be offered on a delayed or continuous basis pursuant to Rule 415 under the Securities Act, check the following box: ¨
If this Form is filed to register additional securities for an offering pursuant to Rule 462(b) under the Securities Act, please check the following box and list the Securities Act registration statement number of the earlier effective registration statement for the same offering. ¨
If this Form is a post-effective amendment filed pursuant to Rule 462(c) under the Securities Act, check the following box and list the Securities Act registration statement number of the earlier effective registration statement for the same offering. ¨
If this Form is a post-effective amendment filed pursuant to Rule 462(d) under the Securities Act, check the following box and list the Securities Act registration statement number of the earlier effective registration statement for the same offering. ¨
Indicate by check mark whether the registrant is a large accelerated filer, an accelerated filer, a non-accelerated filer, or a smaller reporting company. See the definitions of “large accelerated filer,” “accelerated filer” and “smaller reporting company” in Rule 12b-2 of the Exchange Act. (Check one):
| Large Accelerated Filter | ¨ | Accelerated Filter | ¨ | |||
| Non-accelerated filter | x (Do not check if a smaller reporting company) | Smaller reporting company | ¨ |
The Registrant hereby amends this registration statement on such date or dates as may be necessary to delay its effective date until the Registrant shall file a further amendment which specifically states that this registration statement shall thereafter become effective in accordance with Section 8(a) of the Securities Act of 1933 or until the registration statement shall become effective on such date as the Securities and Exchange Commission, acting pursuant to said Section 8(a), may determine.
Table of Contents
The information in this preliminary prospectus is not complete and may be changed. These securities may not be sold until the registration statement filed with the Securities and Exchange Commission is effective. This preliminary prospectus is not an offer to sell nor does it seek an offer to buy these securities in any jurisdiction where the offer or sale is not permitted.
Subject To Completion. Dated July 18, 2014.
Shares

Yodlee, Inc.
Common Stock
This is an initial public offering of shares of common stock of Yodlee, Inc.
Prior to this offering, there has been no public market for the common stock. It is currently estimated that the initial public offering price per share will be between $ and $ . We have applied to list the common stock on The NASDAQ Global Market under the symbol “YDLE”.
We are an “emerging growth company” as that term is used in the Jumpstart Our Business Startups Act of 2012 and, as such, may elect to comply with certain reduced public company reporting requirements in future reports after the completion of this offering.
See “Risk Factors” on page 19 to read about factors you should consider before buying shares of the common stock.
Neither the Securities and Exchange Commission nor any other regulatory body has approved or disapproved of these securities or passed upon the accuracy or adequacy of this prospectus. Any representation to the contrary is a criminal offense.
| Per Share | Total | |||||||
| Initial public offering price |
$ | $ | ||||||
| Underwriting discounts and commissions(1) |
$ | $ | ||||||
| Proceeds, before expenses, to Yodlee |
$ | $ | ||||||
| (1) | See the section titled “Underwriting (Conflict of Interest)” for a description of the compensation payable to the underwriters. |
To the extent that the underwriters sell more than shares of common stock, the underwriters have the option to purchase up to an additional shares from Yodlee at the initial public offering price less the underwriting discounts and commissions.
The underwriters expect to deliver the shares against payment in New York, New York on , 2014.
| Goldman, Sachs & Co. | Credit Suisse | BofA Merrill Lynch | ||
| UBS Investment Bank | ||||
| Pacific Crest Securities | ||||
Prospectus dated , 2014
Table of Contents

Financial Cloud YODLEE
Table of Contents
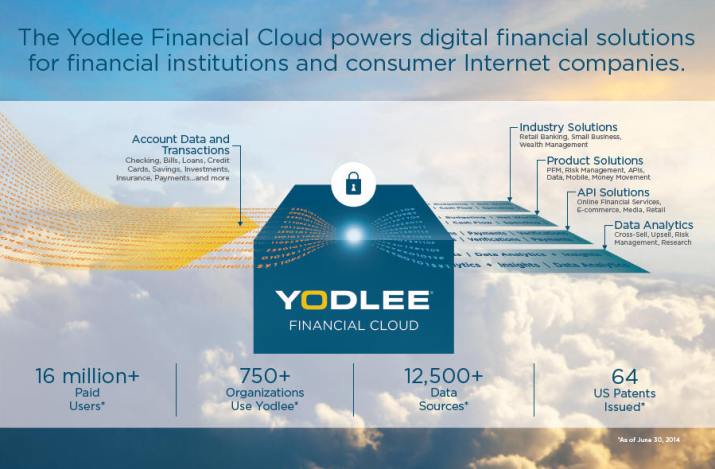
The Yodlee Financial Cloud powers digital nancial solutions for nancial institutions and consumer Internet companies. Account Transactions Data and Checking, Bills, Loans, Credit Cards, Savings, Investments, Insurance, Payments…and more YODLEE FINANCIAL CLOUD Industry Solutions Retail Banking, Small Business, Wealth Management Product Solutions PFM, Risk Management, APIs, Data, Mobile, Money Movement API Solutions Online Financial Services, E-commerce, Media, Retail Data Analytics Cross-Sell, Upsell, Risk Management, Research 16 million+ Paid Users* 750+ Organizations Use Yodlee* 12,500+ Data Sources* 64 US Patents Issued* *As of June 30, 2014
Table of Contents
Prospectus
| Page | ||||
| 1 | ||||
| 19 | ||||
| 47 | ||||
| 48 | ||||
| 49 | ||||
| 50 | ||||
| 51 | ||||
| 53 | ||||
| 56 | ||||
| Management’s Discussion and Analysis of Financial Condition and Results of Operations |
58 | |||
| 94 | ||||
| 119 | ||||
| 130 | ||||
| 147 | ||||
| 150 | ||||
| 153 | ||||
| 158 | ||||
| Material United States Federal Income Tax Consequences to Non-U.S. Holders of our Common Stock |
161 | |||
| 165 | ||||
| 171 | ||||
| 171 | ||||
| 171 | ||||
| F-1 | ||||
Through and including, 2014 (the 25th day after the date of this prospectus), all dealers effecting transactions in these securities, whether or not participating in this offering, may be required to deliver a prospectus. This is in addition to a dealer’s obligation to deliver a prospectus when acting as an underwriter and with respect to an unsold allotment or subscription.
We have not authorized anyone to provide any information or to make any representations other than those contained in this prospectus or in any free writing prospectuses we have prepared. We take no responsibility for, and can provide no assurance as to the reliability of, any information that others may give you. This prospectus is an offer to sell only the shares offered hereby, but only under circumstances and in jurisdictions where it is lawful to do so. The information contained in this prospectus is current only as of its date.
For investors outside the United States: Neither we nor the underwriters have done anything that would permit our initial public offering or possession or distribution of this prospectus in any jurisdiction where action for that purpose is required, other than in the United States. Persons outside the United States who come into possession of this prospectus must inform themselves about, and observe any restrictions relating to, the offering of the shares of our common stock and the distribution of this prospectus outside of the United States.
-i-
Table of Contents
This summary highlights selected information appearing elsewhere in this prospectus. You should read the following summary together with the more detailed information appearing in this prospectus, including our consolidated financial statements and related notes, and the sections titled “Risk Factors” beginning on page 19 and “Management’s Discussion and Analysis of Financial Condition and Results of Operations” beginning on page 58, before deciding whether to purchase shares of our common stock. Unless the context otherwise requires, the terms “Yodlee,” “the company,” “we,” “us” and “our” in this prospectus refer to the consolidated operations of Yodlee, Inc. and its consolidated subsidiary as a whole.
Yodlee, Inc.
Overview
Yodlee is a leading technology and applications platform powering dynamic innovation for digital financial services in the cloud. We refer to our platform as the Yodlee Financial Cloud. Our vision is to empower lives with innovative digital financial services. Our customers include financial institutions, Internet services companies providing innovative financial solutions and third-party developers of financial applications. More than 750 organizations in over 10 countries use the Yodlee platform to power their consumer-facing digital offerings, and we receive subscription fees for 16.8 million of these consumers, whom we refer to as our paid users.
Our financial institution customers encompass many of the leading financial institutions, including 9 of the 15 largest banks in the United States, which hold 85% of the total assets of the top 15 U.S. banks (based on total assets as of September 30, 2013). These institutions subscribe to the Yodlee platform to power offerings that improve consumer satisfaction and enhance engagement, while capturing cross-sell and up-sell opportunities. We estimate that our current network of financial institution customers alone reaches more than 100 million end users, representing a significant opportunity to grow our paid user base within existing customers. Our customers that are Internet services companies have an increasingly large and diverse base of users that also provides additional growth opportunities.
The Yodlee Financial Cloud delivers a wide variety of financial applications, or FinApps, targeted at the retail financial, wealth management, small business, card and other financial solutions sectors. These FinApps help consumers and small businesses simplify and manage their finances, review their financial accounts, track their spending, calculate their net worth, and perform a variety of other activities. Examples of FinApps include our Expense FinApp, which helps consumers track their spending, and a Payroll FinApp from a third party, which helps small businesses process their payroll. Our platform also enables our customers to develop their own applications through our open application programming interfaces, or APIs, that deliver trusted and secure data, money movement solutions, and other feature functionality.
We provide subscription services on a business-to-business-to-consumer, or B2B2C, basis to financial services clients, whereby our customers offer Yodlee-based solutions to their customers, whom we refer to as end users. On a business-to-business, or B2B, basis we deliver the same platform to third-party developers. We are a big data practitioner providing our customers with data analytics and market research services that enhance the value of our solutions and anonymized data derived from a massive and dynamic set of end user-permissioned transaction-level data that we
-1-
Table of Contents
gather and refine. We believe that our brand leadership, innovative technology and intellectual property, large customer base, and unique data gathering and enrichment provide us with competitive advantages that have enabled us to generate strong growth.
Financial institutions today operate in a highly fragmented, complex and regulated environment. At the same time, consumers and small businesses struggle to manage their increasingly complex finances, often across multiple online financial accounts at a variety of financial institutions, each with a different interface and login procedure. In addition, a new wave of Internet services companies is changing the way that consumers and small businesses manage their finances and transact online. As competition in the financial services industry has increased and financial institutions have concentrated resources on the sale of financial products, these institutions are seeking innovative technology solutions to improve their end users’ experience and enhance engagement, while capturing data-driven cross-sell and up-sell opportunities.
The financial services industry is undergoing a technological shift. Outdated enterprise hardware and software is being replaced by cloud-driven solutions that are easier and less expensive to implement, update and manage. Banks continue to spend heavily on IT in order to compete effectively in an increasingly competitive environment. Celent, an international financial research and consulting firm, estimates that in 2013 U.S. and Canadian banks alone spent a total of $11.3 billion on external software, which includes purchasing costs and licensing fees associated with third-party packaged software solutions. In addition, Celent estimates that European banks spent $13.4 billion on external software in 2013, bringing total spend on external software by U.S., Canadian and European banks to $24.7 billion. Celent projects that this combined spending will increase to $29.5 billion in 2015. We believe as financial institutions continue to spend on technology, a growing portion of that spending will shift from outdated internally-developed or custom-built enterprise software to cloud-based solutions. In addition to the large opportunity that we have with traditional financial institutions, we believe that we also have a significant opportunity with Internet services companies providing innovative financial solutions.
We serve two main customer groups, financial institutions, or FI, customers and Internet services companies providing innovative financial solutions, which we refer to as our Yodlee Interactive, or YI, customers. Yodlee provides FI customers with access to FinApps, which can be subscribed to individually or in combinations, that include personal financial management, wealth management, card, payments and small-medium business, or SMB, solutions. We also provide our FI customers with trusted and secure access to our platform via APIs that enable them to receive end user-permissioned data that we aggregate, cleanse, and distribute, as well as our money movement solutions. Our YI customers are Internet services companies and third-party developers, who use our platform to develop new applications and enhance existing solutions. Our YI customers operate in a number of sub-vertical markets, including wealth management, personal financial management, small business accounting, small business lending and authentication. These customers use the Yodlee platform to build solutions that leverage our open APIs and access to a large end user base. In addition to aggregated transaction-level account data, we provide YI customers with secure access to account verification, money movement and risk assessment tools via our APIs. We play a critical role in bringing innovation from Internet services companies to financial institutions through the Yodlee Financial Cloud. For example, our YI customers use our solutions in such diverse applications as providing working capital to small businesses online; personalized financial management, planning and advisory services; ecommerce payment solutions; and online accounting systems for small businesses. We provide access to our solutions across multiple channels, including web, tablet and mobile.
-2-
Table of Contents
We also offer data analytics and market research services that enhance the value of our solutions to our customers and provide anonymized data derived from a massive and dynamic set of end user-permissioned transaction-level data that we gather and refine. Our platform collects a wide variety of end user data from over 12,500 sources and puts it in a common repository. Beyond collecting the data, our platform performs a data refining process and augments the data with additional information from a variety of other sources. We enrich the data with a proprietary twelve-step process, adding such elements as categorization and merchant identification for bank or credit card account data and investment holding identification for investment account data. With this enhanced data, we enable our customers to offer better applications and more personalized solutions to end users.
Our solutions benefit our customers and their end users in a wide variety of ways. For both our FI and YI customers, providing Yodlee-powered solutions improves their end user satisfaction and retention, accelerates speed to market, creates technology savings and enhances their data analytics and market research capabilities. For our customers’ end users, our solutions provide better access to their financial information and more control over their finances, leading to more informed and personalized decision making. For our customers who are members of the developer community, our solutions provide access to critical data and payments solutions, faster speed to market and enhanced distribution.
We believe a large addressable market and the need for innovative digital financial services give us the opportunity to grow considerably in the near term. Our growth strategy addresses two key drivers of our business: number of paid users and revenue per paid user. As we look to grow the number of paid users on our platform, we intend to focus on increasing penetration within our existing customer base, signing new customers, and expanding internationally. We also intend to drive additional revenue per paid user by introducing new solutions like data analytics and market research services and by pursuing revenue-sharing opportunities from premium FinApps.
In 2013, our revenue increased by 21% to $70.2 million, driven largely by an increase in subscription revenue, which grew 28% from the year ended December 31, 2012, offset by a 1% decrease in professional services and other revenue. During the six months ended June 30, 2014, our revenue increased by 29% to $41.1 million, driven by an increase in subscription revenue, which grew 34% from the six months ended June 30, 2013. A substantial portion of our revenues has been derived from contractually-recurring subscription and support revenues, and our solutions are integrated into our customers’ business processes driving strong customer retention. Our subscription and support revenue net retention rate, which we use as a measure of our ability to retain our customers through renewals of subscription agreements and to expand the number of our paid users, was 115%, 114% and 123% for the years ended December 31, 2011, 2012, and 2013, and 119% and 123% for the six months ended June 30, 2013 and 2014, respectively. We generate revenues primarily from subscription and support fees and professional service fees. Subscription and support revenue has been a growing majority of our revenues and accounted for 81% and 85% of our revenue during the year ended December 31, 2013, and the six months ended June 30, 2014, respectively.
Except in 2010, we have not been profitable on an annual basis since our formation. We experienced a net loss of $2.1 million, $6.5 million and $1.2 million for the years ended December 31, 2011, 2012 and 2013, respectively, and $2.6 million and $0.9 million for the six months ended June 30, 2013 and 2014, respectively. As of June 30, 2014, our accumulated deficit was $351.2 million.
-3-
Table of Contents
Industry Background
Consumers and Small Businesses are Struggling to Effectively Manage Their Finances
The complex and fragmented nature of the financial industry makes managing finances a stressful and frustrating activity for consumers and small businesses. Maintaining multiple disparate accounts can be complex, frustrating and time consuming as consumers struggle to gain an accurate and holistic view of their personal finances and to manage financial tasks like monitoring cash balances, budgeting and paying bills. Small businesses also struggle with effectively managing basic financial tasks, such as cash flow and expense management, invoicing and payroll. These event-driven processes are fragmented, giving rise to the need for a centralized platform that can consolidate consumers’ and small businesses’ finances and make these necessary everyday tasks seamless, integrated and able to be performed across multiple channels.
Financial Institutions Have Challenges and Opportunities to Engage and Retain Their Customers
As FIs compete for more of their customers’ business, customer experience and satisfaction has become increasingly important. Today, customer satisfaction is driven by the ease and functionality of digital financial services, rather than the branch banking experience. Innovators in financial services have begun to build solutions designed for the digital world that provide a superior customer experience—the use of technology to drive both a highly automated and highly personalized experience—to deepen and strengthen the relationship and engagement with their customers. Enabling deeper and better engagement in financial services demands new technology solutions that offer speed to market, security, efficiency and sophisticated data capabilities.
Emerging Internet-Based Financial Services Companies are Paving the Path of Innovation
While FIs invest heavily in new initiatives to enhance their digital capabilities, a new wave of hundreds of Internet services companies is also changing the way consumers and small businesses execute transactions and manage their finances. Offerings like eWallets, virtual currencies and Amazon Payments, and companies like LifeLock, PayPal and Xero, are driving accelerated new user adoption with a range of solutions across multiple markets geared towards simplifying financial interactions, processes, transactions and management. These entities require scalable and secure technology platforms, data and payment capabilities to continue to accelerate their rate of adoption.
Cloud-Based Platforms are Simplifying Software Delivery
The rise of cloud-based platforms is the result of rapid and significant technological improvements. Because cloud computing enables the delivery of Software-as-a-Service, it is helping to reduce costs, increase speed to market, and enable greater levels of innovation relative to outdated enterprise software. Mission critical applications can now be delivered reliably without the purchase of costly on-premise software or hardware. Cloud-based platforms permit the development of applications without affecting the common capabilities maintained at the platform layer. Therefore, cloud-based platforms can be leveraged by multiple participants in the ecosystem, including customers and third-party developers, to create better solutions. The shared utility of cloud-based platforms permits a deeper level of vertical and functional specialization and creates an environment conducive to rapid and disruptive innovation.
Open Platforms and Application-Level Developer Ecosystems are Driving Innovation Forward
Open platform systems can result in an improved experience for the end user, developer, institutional customer and platform provider alike. Products can come to market faster, with better
-4-
Table of Contents
functionality, and these improved solutions can benefit customers, leading to heightened levels of end user demand. For the institutions utilizing these open platforms, developer community-led innovation helps to keep pace with rapidly evolving consumer expectations.
New Technology Platforms are Leveraging Big Data
In the financial services industry, data is highly fragmented and complex and often siloed at not only individual institutions but also within the various business units at a specific institution. We believe there is an opportunity to leverage this data to transform and improve existing processes and procedures around financial management, customer engagement and credit and risk management. As new technologies emerge to organize, process and access this siloed data, new business models that aggregate and syndicate intelligence are turning vast amounts of otherwise unusable information into actionable data used for superior process management and business insight.
Large Addressable Market
In an increasingly mobile and digital world, consumer expectations of financial service providers continue to rise. Consumers are evaluating these providers based in part on the functionality and user experience of their digital services. In this environment, a financial service provider’s ability to create a differentiated user experience for its customers is increasingly important in sustaining a competitive advantage, which requires innovation to help address unsolved consumer problems and an ability to bring these innovations to market quickly. Cloud-based platforms facilitate rapid discovery and implementation of new solutions and enable financial service providers to integrate new solutions more efficiently.
Against this industry backdrop, we believe we have a significant market opportunity. Celent estimates that in 2013 U.S. and Canadian banks alone spent a total of $11.3 billion on external software, which includes purchasing costs and licensing fees associated with third-party packaged software solutions. In addition, Celent estimates that European banks spent $13.4 billion on external software in 2013, bringing the total spend on external software by U.S., Canadian and European banks to $24.7 billion. Celent projects that this combined spending will increase to $29.5 billion in 2015.
We also have a significant market opportunity with our YI customer base. Our Internet services customers such as Kabbage, LearnVest, PayPal and Xero have an increasingly large and diverse number of users and the need for a variety of financial solutions to support their development and delivery of innovative financial services. We believe our services have the potential to address a wide variety of additional financial and data marketing needs of our YI customers.
We believe a portion of our future growth and addressable market will also come from expansion into large and rapidly growing markets, such as cross-selling within financial institutions, data analytics and market research services, and online credit information services.
As we continue to expand our presence in the markets outlined above, the number of potential end users who use our solutions increases dramatically. Our potential end user base includes any consumer of financial services on the Internet—and this end user could be a paid user of Yodlee many times over across multiple customers and products. This multiplier effect greatly increases our addressable end user base.
Our Solution
Yodlee is a leading technology and applications platform powering dynamic innovation for digital financial services in the cloud. We refer to our platform as the Yodlee Financial Cloud. We provide
-5-
Table of Contents
subscription services on a B2B2C basis to financial services clients, whereby our customers offer solutions based on our platform to their end users. On a B2B basis we deliver the same platform to third-party developers. We also provide transaction-level data for data analytics and market research services. We serve two main customer groups or channels, FI and YI customers.
Our platform powers hundreds of FinApps created and made available by us, our customers and third-party developers. FinApps can be sold individually or in combinations and include personal financial management, wealth management, card, payments and SMB solutions. Our open APIs enable us, our FI and YI customers and third-party developers to create new FinApps that can be made available across our broad end user base.
We also provide our customers with trusted and secure access to our platform via APIs that enable them to receive end user-permissioned transaction-level data that we aggregate and cleanse. Access to this data enables our customers to create a much more complete view of their end users’ finances, allowing them to make better informed, targeted decisions. We also offer data for data analytics and market research services that enhance the value of our solutions to our customers and provide anonymized data derived from a massive and dynamic set of end user-permissioned transaction-level data that we gather and refine.
In addition to aggregated transaction-level account data, we provide our customers with secure access to account verification, money movement and risk assessment tools via our APIs. By using our account verification solutions, customers can verify an end user’s account information, ownership and balance in real time, reducing risk for our customers when interacting with an end user’s checking account. By using our money movement solutions, end users can debit and credit consumer and small business accounts in real time or in batches, route payments between accounts or to other people and pay bills.
We have developed best-in-class security procedures and technologies that are embedded into our platform and applications and meet industry standards as well as the stringent security requirements of our largest FI customers. Our platform is available across multiple channels, including web, tablet and mobile.
Key Benefits
Our solutions drive tangible results for our customers:
| • | Enabling Innovation—The Yodlee platform enables our FI and YI customers to satisfy their mission-critical need to innovate by providing an open platform for the rapid development and deployment of their own financial applications, as well as direct access to applications developed by Yodlee and by a broad third-party developer community. Our platform provides solutions, including secure access to aggregated financial data, account verification, money movement and risk assessment tools, that form the core technology allowing many of our YI customers to provide innovative financial solutions. |
| • | Customer Satisfaction / Retention—By deploying the Yodlee platform, our customers are able to provide features and functionality that significantly increase their end users’ engagement with their personal finances, which increases their satisfaction and reduces churn. |
| • | Speed to Market—Our open platform makes it easier for FIs, Internet services companies and third-party developers to create new applications on our platform that can be deployed across our customer base. Our broad network of developers enables solutions to be more rapidly distributed to our customers via our established channels. |
-6-
Table of Contents
| • | Technology Savings—Our solutions often provide our customers with extensive cost savings as compared to outdated internally-developed or custom-built enterprise software solutions, without the need to purchase additional hardware or software. Because the Yodlee platform is cloud-based, updates can be made readily available in a cost-effective manner. |
| • | Enhanced Data Analytics and Market Research Capabilities—Our data aggregation platform provides an opportunity for our customers to leverage transaction-level data for data analytics and market research uses. Through the data we make available, our customers can create a much more complete view of their end users’ finances, allowing them to make better informed targeting decisions. In addition, our comprehensive sets of anonymized data enable various market research and trend analyses for multiple use cases. |
Our solutions also provide tangible benefits for end users:
| • | Better Access and Functionality—Our solutions enable customers to aggregate information into a single view of multiple accounts across several financial institutions. We provide end users with access to highly engaging personalized financial applications across multiple channels, such as web, mobile and tablet. |
| • | More Control—Our solutions provide end users with more control over their finances, by providing access to applications designed to make financial tasks like budgeting, saving for a goal and investing for the future easier. |
| • | Informed Personalized Decision Making—Our FinApps ecosystem, built on top of the Yodlee platform, provides end users with relevant content and applications when they need to take action or make decisions. |
Our solutions also offer benefits to our customers that are members of the developer community:
| • | Enhanced Distribution—We estimate that our current network of FI customers alone reaches more than 100 million end users. This provides developers with large-scale distribution opportunities for their solutions. |
| • | Speed to Market—Access to our unique data platform and our open, secure and trusted APIs enhances speed to market for our developers. |
| • | Access to Critical Data and Payments Capabilities—Our solutions provide developers with critical data and payments capabilities which allows them to focus their innovation on their unique offerings. |
Competitive Strengths
Since our founding in 1999, we have built a premier and trusted brand in digital financial services. Our competitive strengths include:
Market Leadership with Customers and End Users
We have developed a leading market presence with over 750 organizations, including 9 of the 15 largest banks in the United States, which hold 85% of the total assets of the top 15 U.S. banks (based on total assets as of September 30, 2013). These organizations include some of the largest and best known retail banks, brokerages, insurance companies, wealth management firms, private banking institutions and card companies. Our platform also enables the emergence or functionality of many innovative Internet services companies. We have 16.8 million paid users and estimate that our current
-7-
Table of Contents
network of FI customers alone reaches more than 100 million end users. We have significant opportunity to grow the number of paid users with existing customers, as well as leverage our market leadership with new customers across our platform.
Brand Leadership as a Secure and Trusted Partner
Our brand is reinforced by our stable and growing customer base. A large part of the reputation we have established comes from our commitment to scalability, security, privacy and compliance throughout all of our solutions. We have developed robust security procedures and technologies that are embedded into our platform and applications and meet industry standards as well as the stringent security requirements of our largest FI customers.
Unique Big Data Gathering and Enrichment
We are a big data practitioner providing our customers with data analytics and market research services that enhance the value of our solutions and anonymized data derived from a massive and dynamic set of end user-permissioned transaction-level data that we gather and refine. Our platform collects a wide variety of end user-permissioned transaction-level data from over 12,500 sources and puts it in a common repository. Currently, over 75% of this data is collected from structured data feeds that are provided under the terms of our contracts with most of our FI customers. This direct data connectivity to large FIs is a significant competitive advantage for us. Where we do not have direct connections, we capture data using our proprietary information-gathering techniques. Beyond collecting data, our platform performs a data refining process and augments the data with additional information from a variety of other sources. With this enhanced data, we enable our customers to offer better applications and more personalized solutions, which provide end users insights that allow them to take better control of, and better manage, their finances.
Innovative Technology and Intellectual Property
We have a history of innovation leadership. As of June 30, 2014, we had been granted 64 U.S. patents and had 23 U.S. patent applications pending. We also had 8 issued patents and 13 patent applications pending in foreign jurisdictions such as the European Patent Office, Canada, Australia and India.
Flexible, Scalable, Open Platform
Our solutions are built on a scalable open cloud-based technology platform that allows us to address the challenges facing FI and YI customers. Our platform was created to support the existing challenges of our customers and to evolve with them to address their future needs.
Powerful Network Effects
The Yodlee Financial Cloud brings together FIs, Internet services companies, end users and third-party developers by providing a unified, flexible, cloud-based platform that can deliver applications and new solutions at scale with powerful network effects. As our platform usage grows and is exposed to more users and use cases, the system benefits from machine learning algorithms to better normalize, categorize and process high volumes of transaction-level data captured on our platform, allowing our network to become more effective, efficient and valuable to our customers. As more developers build on our platform, the number of solutions we can offer to our FI and YI customers increases, expanding the number of end users on the platform, and further enhancing our network,
-8-
Table of Contents
accelerating the pace of innovation. As our end user community grows, users will be able to leverage our platform by establishing connections to other end users to form financially relevant social groups, contributing further network effects.
Growth Strategy
Our growth strategy is currently divided into two primary areas of focus: user growth and revenue per paid user growth. Key elements of our growth strategy include:
User Growth
| • | Expand End User Usage with Existing Customers—Our FI customers encompass many of the leading FIs, including 9 of the 15 largest banks in the United States, which hold 85% of the total assets of the top 15 U.S. banks (based on total assets as of September 30, 2013). We estimate that our current network of FI customers alone reaches more than 100 million end users, representing a significant opportunity to grow our paid user base within existing customers. We believe we can increase penetration among our existing customer base, both by increasing the adoption of our solutions in business units that we currently serve and by expanding into new business units. We intend to grow our business in the retail, financial, wealth management, small business, card and other financial solutions sectors in part by distributing FinApp solutions tailored to the needs of those sectors. |
| • | Grow the Number of Customers—We continue to drive efforts to deploy solutions with leading FIs while also driving penetration in smaller FIs through channel partners. We intend to employ a land and expand strategy to target these institutions with simple initial product offerings and continually grow use cases over time. In addition, we believe demand for our YI solutions will continue to grow outside our current areas of focus. Lastly, our emerging data analytics and market research efforts are developing new product and customer base opportunities as we expand. |
| • | Increase our Global Market Presence—We intend to deepen our presence in Canada, the United Kingdom, South Africa, India and Australia and to establish a presence in select markets in Latin America, Europe and Asia. |
Revenue per Paid User Growth
In addition to generating revenue directly from our platform and FinApps with our FI and YI customers, we also intend to grow our revenue by providing additional data analytics and market research services and are pursuing revenue-sharing opportunities from premium FinApps developed by our developer partners.
| • | Data Analytics and Market Research—We believe there is significant value inherent in our data analytics and market research services which we can realize through several different channels. The transaction-level data we gather can be used by our customers to enhance the efficacy of their marketing strategies, to power FI customer relationship management systems, to develop data products by aggregating anonymized financial transactions for multiple research uses, to improve real-time authentication and risk management and to enhance predictive analysis. |
| • | FinApps—We are pursuing opportunities to grow revenue from premium FinApps through revenue sharing with developer partners and our customers. |
-9-
Table of Contents
Risks Affecting Us
Our business is subject to numerous risks and uncertainties, including those highlighted in the section titled “Risk Factors” immediately following this prospectus summary. These risks include, but are not limited to, the following:
| • | we have a history of losses and we may not maintain profitability in the future; |
| • | we derive our revenue from subscriptions to a single software platform; |
| • | we derive a significant portion of our revenue from a small number of customers; |
| • | we face prolonged sales cycles with some of our prospective customers; |
| • | failure of our customers to deploy our solutions in a timely and successful manner could negatively affect us; |
| • | our future success depends upon our customers’ active and effective promotion of our solutions; |
| • | if our reputation is harmed, our business and operating results could be adversely affected; |
| • | a data security breach could harm our business; |
| • | privacy concerns could adversely impact us; |
| • | our business could be harmed if sources from which we obtain information limit our access; |
| • | failure by us or our customers to comply with government regulation could adversely affect us; |
| • | if we fail to expand our business within existing customers, our business and revenue growth will suffer; |
| • | our revenue growth depends in part on our ability to successfully sell solutions to new customers, including Internet services companies; and |
| • | if we fail to derive revenue from data analytics and market research services and premium FinApps, our revenue growth will suffer. |
A majority of our directors are affiliated with management or our principal stockholders. In addition, our directors and executive officers and holders of more than five percent of our outstanding shares of common stock (on an as-converted basis) beneficially owned, in the aggregate, approximately 87% of our outstanding capital stock as of June 30, 2014. As a result, acting together, this group has the ability to exercise significant control over most matters requiring our stockholders’ approval, including the election and removal of directors and significant corporate transactions.
Corporate Information
We were incorporated in Delaware in February 1999 under the name Yodlee.com, Inc. and changed our name to Yodlee, Inc. in June 2001. Our principal executive offices are located at 3600 Bridge Parkway, Suite 200, Redwood City, California 94065. The phone number of our principal executive offices is (650) 980-3600, and our main corporate website is www.yodlee.com. The information on, or that can be accessed through, our website is not part of this prospectus.
The names “Yodlee”, “Yodlee Moneycenter”, “Yodlee Personalpay”, “Paytoday”, “Payitall”, “Innovation Applied”, “Finapp” and our logo are our trademarks. This prospectus also contains trademarks and trade names of other businesses that are the property of their respective holders. We have omitted the ® and ™ designations, as applicable, for the trademarks we name in this prospectus.
-10-
Table of Contents
Emerging Growth Company
The Jumpstart Our Business Startups Act, or the JOBS Act, was enacted in April 2012 with the intention of encouraging capital formation in the United States and reducing the regulatory burden on newly public companies that qualify as “emerging growth companies.” We are an emerging growth company within the meaning of the JOBS Act. As an emerging growth company, we may take advantage of certain exemptions from various public reporting requirements, including the requirement that our internal control over financial reporting be audited by our independent registered public accounting firm pursuant to Section 404 of the Sarbanes-Oxley Act of 2002, certain requirements related to the disclosure of executive compensation in this prospectus and in our periodic reports and proxy statements, and the requirement that we hold a nonbinding advisory vote on executive compensation and any golden parachute payments. We may take advantage of these exemptions until we are no longer an emerging growth company.
We will remain an emerging growth company until the earliest to occur of (i) the last day of the fiscal year in which we have $1.0 billion or more in annual revenue; (ii) the date we qualify as a “large accelerated filer,” with at least $700 million of equity securities held by non-affiliates; (iii) the date on which we have issued, in any three-year period, more than $1.0 billion in non-convertible debt securities; or (iv) the last day of the fiscal year ending after the fifth anniversary of our initial public offering.
Section 107 of the JOBS Act also provides that an “emerging growth company” can take advantage of an extended transition period for complying with new or revised accounting standards. However, we chose to “opt out” of such extended transition period, and as a result, we will comply with new or revised accounting standards on the relevant dates adoption of such standards is required for non-emerging growth companies. Our decision to opt out of the extended transition period for complying with new or revised accounting standards is irrevocable.
For certain risks related to our status as an emerging growth company, see the disclosure elsewhere in this prospectus under “Risk Factors—Risks Related to this Offering and Ownership of Our Common Stock—We are an emerging growth company, and we cannot be certain if the reduced disclosure requirements applicable to emerging growth companies will make our common stock less attractive to investors.”
-11-
Table of Contents
The Offering
| Common stock offered by us |
Shares | |
| Common stock to be outstanding immediately after this offering |
Shares | |
| Option to purchase additional shares of common stock from us |
Shares | |
| Use of proceeds |
We currently intend to use the net proceeds we receive from this offering primarily for general corporate purposes, including working capital, research and development activities, sales and marketing activities, general and administrative matters and capital expenditures, to fund our growth plans, and to pay the entire outstanding balance under our credit facility, although we do not otherwise currently have any specific or preliminary plans with respect to the use of proceeds for such purposes. See “Use of Proceeds.”
| |
| Directed Share Program |
At our request, the underwriters have reserved up to 5% of the common stock being offered by this prospectus for sale at the initial public offering price to certain individuals associated with us and members of their families. None of our directors, executive officers or employees will participate in the directed share program. The sales will be made by UBS Financial Services Inc., a selected dealer affiliated with UBS Securities LLC, an underwriter of this offering, through a directed share program. We do not know if these individuals will choose to purchase all or any portion of these reserved shares, but any purchases they do make will reduce the number of shares that are available to the general public. Any reserved shares that are not so purchased will be offered by the underwriters to the general public on the same terms as the other shares of common stock. | |
| Risk Factors |
See “Risk Factors” and other information included in this prospectus for a discussion of factors you should carefully consider before deciding to invest in shares of our common stock. | |
| Conflict of Interest |
Merrill Lynch, Pierce, Fenner & Smith Incorporated, an underwriter of this offering, is a wholly-owned subsidiary of Bank of America Corporation, or BAC, which beneficially owned in the aggregate 12.6% of our outstanding common | |
-12-
Table of Contents
| stock as of June 30, 2014. Since BAC beneficially owns more than 10% of our outstanding common stock, a “conflict of interest” is deemed to exist under Rule 5121(f)(5)(B) of the Conduct Rules of the Financial Industry Regulatory Authority. Accordingly, this offering will be made in compliance with the requirements of Rule 5121, which requires that no sale be made to discretionary accounts by underwriters having a conflict of interest without the prior written approval of the account holder, and that a qualified independent underwriter participate in the preparation of the registration statement and prospectus and perform the usual standards of due diligence with respect thereto. In accordance with this rule, Goldman, Sachs & Co. has assumed the responsibilities of acting as a qualified independent underwriter. In its role as qualified independent underwriter, Goldman, Sachs & Co. has participated in due diligence and the preparation of this prospectus and the registration statement of which this prospectus is a part. Goldman, Sachs & Co. will receive a fee of $5,000 for serving as a qualified independent underwriter in connection with this offering. We have agreed to indemnify Goldman, Sachs & Co. against certain liabilities incurred in connection with it acting as qualified independent underwriter in this offering, including liabilities under the Securities Act. In accordance with Rule 5121, Merrill Lynch, Pierce, Fenner & Smith Incorporated (and its affiliates) will not sell our common stock to a discretionary account without receiving prior written approval from the account holder. See “Underwriting (Conflict of Interest)—Conflict of Interest.” | ||
| Proposed symbol |
“YDLE” | |
The number of shares of our common stock that will be outstanding after this offering is based on 220,702,831 shares of our common stock outstanding as of June 30, 2014, and excludes:
| • | 51,971,275 shares of our common stock issuable upon the exercise of options to purchase shares of our common stock outstanding as of June 30, 2014, with a weighted-average exercise price of $0.67 per share; |
| • | 6,194,372 shares of our common stock subject to restricted stock units, or RSUs, outstanding as of June 30, 2014; |
| • | 1,134,614 shares of our common stock, on an as-converted basis, issuable upon the exercise of warrants to purchase shares of our convertible preferred stock outstanding as of June 30, 2014, with an exercise price of $0.65 per share; and |
-13-
Table of Contents
| • | shares of our common stock reserved for future issuance under our stock-based compensation plans, consisting of (i) 16,793,052 shares of common stock reserved for future awards under the 2009 Equity Incentive Plan, or our 2009 Plan, as of June 30, 2014 (which will terminate as of the completion of this offering and no awards will be granted under our 2009 Plan thereafter), and (ii) shares of common stock reserved for issuance under our 2014 Employee Stock Purchase Plan, or our 2014 ESPP, which will become effective on the date of this prospectus. Any shares that, as of the effective date of the registration statement of which this prospectus forms a part, have been reserved but not issued pursuant to awards granted under our 2009 Plan and are not subject to any awards granted under our 2009 Plan, plus any shares covering awards granted under our 2009 Plan that, on or after the effective date of the registration statement of which this forms a part, expire or terminate without having been exercised in full or are forfeited to or repurchased by us, will become available for issuance under our 2014 Equity Incentive Plan, or our 2014 Plan, with the maximum number of shares to be added to our 2014 Plan, from our 2009 Plan equal to shares. Our 2014 Plan and our 2014 ESPP also provide for automatic annual increases in the number of shares reserved under the plans, as more fully described in “Executive Compensation—Employee Benefit and Stock Plans.” |
Except as otherwise indicated, all information in this prospectus assumes:
| • | the automatic conversion of all outstanding shares of our convertible preferred stock into an aggregate of 144,452,172 shares of our common stock, which conversion will occur immediately prior to the completion of this offering; |
| • | the filing and effectiveness of our amended and restated certificate of incorporation in Delaware and the adoption of our amended and restated bylaws, each of which will occur immediately prior to the completion of this offering; |
| • | no exercise of outstanding options or vesting of RSUs subsequent to June 30, 2014; and |
| • | no exercise by the underwriters of their option to purchase up to an additional shares of our common stock from us. |
-14-
Table of Contents
SUMMARY CONSOLIDATED FINANCIAL DATA
The following tables summarize our consolidated financial data. You should read this summary consolidated financial data together with the sections titled “Selected Consolidated Financial Data” and “Management’s Discussion and Analysis of Financial Condition and Results of Operations” and our consolidated financial statements and related notes included elsewhere in this prospectus.
The consolidated statements of operations data for the years ended December 31, 2011, 2012 and 2013 and the consolidated balance sheet data as of December 31, 2013 are derived from our audited consolidated financial statements that are included elsewhere in this prospectus. The consolidated statements of operations data for the years ended December 31, 2009 and 2010 are derived from our audited consolidated financial statements not included in this prospectus. We have derived the consolidated statements of operations data for the six months ended June 30, 2013 and 2014 and the consolidated balance sheet data as of June 30, 2014 from our unaudited interim consolidated financial statements included elsewhere in this prospectus. Our unaudited consolidated financial statements have been prepared on the same basis as our audited consolidated financial statements and, in the opinion of management, reflect all adjustments, which consist only of normal recurring adjustments, necessary for the fair statement of those unaudited consolidated financial statements. Our historical results are not necessarily indicative of the results that may be expected in the future.
| Year Ended December 31, | Six Months Ended June 30, |
|||||||||||||||||||||||||||
| 2009 | 2010 | 2011 | 2012 | 2013 | 2013 | 2014 | ||||||||||||||||||||||
| (in thousands, except per share data) | ||||||||||||||||||||||||||||
| Consolidated Statements of Operations Data: |
||||||||||||||||||||||||||||
| Revenue: |
||||||||||||||||||||||||||||
| Subscription and support |
$ | 24,340 | $ | 30,746 | $ | 37,029 | $ | 44,336 | $ | 56,838 | $ | 26,120 | $ | 34,903 | ||||||||||||||
| Professional services and other |
8,534 | 15,593 | 17,400 | 13,458 | 13,322 | 5,736 | 6,163 | |||||||||||||||||||||
|
|
|
|
|
|
|
|
|
|
|
|
|
|
|
|||||||||||||||
| Total revenue |
32,874 | 46,339 | 54,429 | 57,794 | 70,160 | 31,856 | 41,066 | |||||||||||||||||||||
| Cost of revenue: |
||||||||||||||||||||||||||||
| Subscription and support(1) |
13,220 | 16,022 | 17,325 | 17,177 | 19,139 | 9,206 | 11,399 | |||||||||||||||||||||
| Professional services and other(1) |
5,581 | 8,006 | 9,537 | 7,594 | 7,693 | 3,845 | 4,392 | |||||||||||||||||||||
|
|
|
|
|
|
|
|
|
|
|
|
|
|
|
|||||||||||||||
| Total cost of revenue |
18,801 | 24,028 | 26,862 | 24,771 | 26,832 | 13,051 | 15,791 | |||||||||||||||||||||
|
|
|
|
|
|
|
|
|
|
|
|
|
|
|
|||||||||||||||
| Gross profit |
14,073 | 22,311 | 27,567 | 33,023 | 43,328 | 18,805 | 25,275 | |||||||||||||||||||||
| Operating expenses: |
||||||||||||||||||||||||||||
| Research and development(1) |
10,810 | 14,742 | 16,768 | 16,193 | 17,948 | 9,409 | 10,260 | |||||||||||||||||||||
| Sales and marketing(1) |
8,096 | 9,885 | 12,911 | 13,638 | 15,418 | 7,401 | 9,690 | |||||||||||||||||||||
| General and administrative(1) |
5,446 | 8,382 | 9,793 | 8,852 | 9,386 | 4,183 | 5,519 | |||||||||||||||||||||
|
|
|
|
|
|
|
|
|
|
|
|
|
|
|
|||||||||||||||
| Total operating expenses |
24,352 | 33,009 | 39,472 | 38,683 | 42,752 | 20,993 | 25,469 | |||||||||||||||||||||
|
|
|
|
|
|
|
|
|
|
|
|
|
|
|
|||||||||||||||
| Operating income (loss) from continuing operations |
(10,279 | ) | (10,698 | ) | (11,905 | ) | (5,660 | ) | 576 | (2,188 | ) | (194 | ) | |||||||||||||||
| Other income (expense), net |
(403 | ) | (342 | ) | (917 | ) | 230 | (318 | ) | 40 | 87 | |||||||||||||||||
|
|
|
|
|
|
|
|
|
|
|
|
|
|
|
|||||||||||||||
| Income (loss) from continuing operations before provision for (benefit from) income taxes |
(10,682 | ) | (11,040 | ) | (12,822 | ) | (5,430 | ) | 258 | (2,148 | ) | (107 | ) | |||||||||||||||
| Provision for (benefit from) income taxes |
(170 | ) | (4,848 | ) | (3,736 | ) | 1,091 | 1,439 | 484 | 842 | ||||||||||||||||||
|
|
|
|
|
|
|
|
|
|
|
|
|
|
|
|||||||||||||||
| Net loss from continuing operations |
(10,512 | ) | (6,192 | ) | (9,086 | ) | (6,521 | ) | (1,181 | ) | (2,632 | ) | (949 | ) | ||||||||||||||
| Income from discontinued operations |
896 | 8,260 | 6,999 | — | — | — | — | |||||||||||||||||||||
|
|
|
|
|
|
|
|
|
|
|
|
|
|
|
|||||||||||||||
| Net income (loss) |
$ | (9,616 | ) | $ | 2,068 | $ | (2,087 | ) | $ | (6,521 | ) | $ | (1,181 | ) | $ | (2,632 | ) | $ | (949 | ) | ||||||||
|
|
|
|
|
|
|
|
|
|
|
|
|
|
|
|||||||||||||||
-15-
Table of Contents
| Year Ended December 31, | Six Months Ended June 30, |
|||||||||||||||||||||||||||
| 2009 | 2010 | 2011 | 2012 | 2013 | 2013 | 2014 | ||||||||||||||||||||||
| (in thousands, except per share data) | ||||||||||||||||||||||||||||
| Basic and diluted net income (loss) per share attributable to common stockholders(2): |
||||||||||||||||||||||||||||
| Net loss from continuing operations |
$ | (0.19 | ) | $ | (0.11 | ) | $ | (0.15 | ) | $ | (0.10 | ) | $ | (0.02 | ) | $ | (0.04 | ) | $ | (0.01 | ) | |||||||
| Income from discontinued operations |
0.02 | 0.15 | 0.11 | — | — | — | — | |||||||||||||||||||||
|
|
|
|
|
|
|
|
|
|
|
|
|
|
|
|||||||||||||||
| Net income (loss) |
$ | (0.17 | ) | $ | 0.04 | $ | (0.04 | ) | $ | (0.10 | ) | $ | (0.02 | ) | $ | (0.04 | ) | $ | (0.01 | ) | ||||||||
|
|
|
|
|
|
|
|
|
|
|
|
|
|
|
|||||||||||||||
| Weighted average shares used to compute net income (loss) per share attributable to common stockholders—basic and diluted(2) |
54,866 | 56,571 | 58,876 | 66,489 | 72,631 | 72,173 | 75,175 | |||||||||||||||||||||
|
|
|
|
|
|
|
|
|
|
|
|
|
|
|
|||||||||||||||
| Pro forma net loss per share attributable to common stockholders—basic and diluted(2) |
$ | $ | ||||||||||||||||||||||||||
|
|
|
|
|
|||||||||||||||||||||||||
| Weighted average shares used to compute pro forma net loss per share attributable to common stockholders—basic and diluted(2) |
||||||||||||||||||||||||||||
|
|
|
|
|
|||||||||||||||||||||||||
| (1) | Costs and expenses include stock-based compensation expense as follows: |
| Year Ended December 31, | Six Months Ended June 30, |
|||||||||||||||||||||||||||
| 2009 | 2010 | 2011 | 2012 | 2013 | 2013 | 2014 | ||||||||||||||||||||||
| (in thousands) | ||||||||||||||||||||||||||||
| Cost of revenue—subscription and support |
$ | 144 | $ | 194 | $ | 163 | $ | 170 | $ | 201 | $ | 106 | $ | 99 | ||||||||||||||
| Cost of revenue—professional services and other |
87 | 146 | 112 | 119 | 107 | 55 | 64 | |||||||||||||||||||||
| Research and development |
239 | 290 | 266 | 236 | 243 | 128 | 128 | |||||||||||||||||||||
| Sales and marketing |
212 | 263 | 302 | 242 | 302 | 153 | 172 | |||||||||||||||||||||
| General and administrative |
443 | 443 | 524 | 588 | 658 | 278 | 456 | |||||||||||||||||||||
|
|
|
|
|
|
|
|
|
|
|
|
|
|
|
|||||||||||||||
| Total stock-based compensation |
$ | 1,125 | $ | 1,336 | $ | 1,367 | $ | 1,355 | $ | 1,511 | $ | 720 | $ | 919 | ||||||||||||||
|
|
|
|
|
|
|
|
|
|
|
|
|
|
|
|||||||||||||||
| (2) | See Note 9 to our audited consolidated financial statements appearing elsewhere in this prospectus for an explanation of the calculations of our net loss per share attributable to common stockholders for the years ended December 31, 2011, 2012 and 2013, and the six months ended June 30, 2013 and 2014. Pro forma basic and diluted net loss per share were computed to give effect to the automatic conversion of convertible preferred stock using the if converted method and the reclassification of preferred stock warrant liabilities to additional paid in capital as though the conversion had occurred as of the beginning of the period or the original date of issuance, if later. The pro forma share amounts give effect to the Company’s RSUs that have satisfied the service condition as of December 31, 2013 and June 30, 2014. Stock-based compensation expense associated with the RSUs is excluded from this pro forma calculation. In addition, the pro forma calculation assumes the sale by us of shares of our common stock in this offering, at the assumed initial public offering price of $ per share, which is the midpoint of the estimated offering price range set forth on the cover page of this prospectus, the proceeds from which will be used to repay the outstanding balance of $9.1 million, as of June 30, 2014, under our credit facility. Interest expense associated with the credit facility of $0.5 million and $0.2 million during the year ended December 31, 2013 and the six months ended June 30, 2014, respectively, is excluded from this pro forma calculation. |
| As of June 30, 2014 | ||||||||||
| Actual | Pro Forma(1) |
Pro Forma As Adjusted(2) | ||||||||
| (in thousands) | ||||||||||
| Consolidated Balance Sheet Data: |
||||||||||
| Cash and cash equivalents |
$ | 6,263 | $ | 6,263 | ||||||
| Working capital (deficit) |
(4,341 | ) | (3,433 | ) | ||||||
| Property and equipment, net |
9,058 | 9,058 | ||||||||
| Total assets |
41,304 | 41,304 | ||||||||
| Deferred revenue |
7,679 | 7,679 | ||||||||
| Total bank borrowings and capital lease obligations |
11,770 | 11,770 | ||||||||
| Convertible preferred stock warrant liabilities |
908 | — | ||||||||
| Convertible preferred stock |
102,224 | — | ||||||||
| Total stockholders’ equity (deficit) |
$ | (97,170 | ) | $ | 5,962 | |||||
-16-
Table of Contents
| (1) | The pro forma column reflects the automatic conversion of all outstanding shares of our convertible preferred stock into an aggregate of 144,452,172 shares of our common stock, which conversion will occur immediately prior to the completion of this offering, and the reclassification of preferred stock warrant liabilities to additional paid-in capital effective upon the closing of this offering. |
| (2) | The pro forma as adjusted column gives effect to the pro forma adjustments set forth in footnote 1 above and the sale by us of shares of our common stock in this offering, based upon the assumed initial public offering price of $ per share, which is the midpoint of the estimated offering price range set forth on the cover page of this prospectus, and after deducting estimated underwriting discounts and commissions and estimated offering expenses payable by us and the repayment of the outstanding balance of $9.1 million under our credit facility upon receipt of proceeds from this offering as described in “Use of Proceeds.” |
The pro forma as adjusted information presented in the consolidated balance sheet data is illustrative only and will change based on the actual initial public offering price and other terms of this offering determined at pricing. Each $1.00 increase or decrease in the assumed initial public offering price of $ per share, which is the midpoint of the estimated offering price range set forth on the cover page of this prospectus, would increase or decrease, as applicable, each of cash and cash equivalents, working capital, total assets and total stockholders’ equity on a pro forma as adjusted basis by approximately $ , assuming that the number of shares offered by us, as set forth on the cover page of this prospectus, remains the same and after deducting estimated underwriting discounts and commissions. An increase or decrease of shares in the number of shares offered by us would increase or decrease, as applicable, the amount of our pro forma as adjusted cash and cash equivalents, working capital, total assets and total stockholders’ equity by approximately $ , assuming that the initial public offering price of $ per share, which is the midpoint of the estimated offering price range, as set forth on the cover page of this prospectus, remains the same and after deducting estimated underwriting discounts and commissions payable by us.
Key Metrics
In addition to our results determined in accordance with U.S. generally accepted accounting principles, or GAAP, we believe the following non-GAAP and other operational measures are useful in evaluating our operating performance. We regularly review the key metrics set forth below as we evaluate our business.
| Year Ended December 31, | Six Months Ended June 30, |
|||||||||||||||||||
| 2011 | 2012 | 2013 | 2013 | 2014 | ||||||||||||||||
| (in thousands, except percentages and per user data) | ||||||||||||||||||||
| Other Financial Data: |
||||||||||||||||||||
| Adjusted EBITDA(1) |
$ | (8,003 | ) | $ | (1,915 | ) | $ | 4,772 | $ | (174 | ) | $ | 2,295 | |||||||
| Paid users (as of period end)(2) |
8,835 | 10,671 | 14,295 | 12,474 | 16,758 | |||||||||||||||
| Average revenue per paid user(3) |
$ | 5.64 | $ | 4.38 | $ | 4.52 | $ | 4.37 | $ | 4.53 | ||||||||||
| Subscription and support revenue net retention rate(4) |
115 | % | 114 | % | 123 | % | 119 | % | 123 | % | ||||||||||
| (1) | We define adjusted EBITDA as net loss before income from discontinued operations; provision for (benefit from) income taxes; other (income) expense, net; depreciation and amortization and stock-based compensation expense. |
| (2) | We define a paid user as a user of an application or a service provided by our customer using the Yodlee platform, whose status corresponds to a billable activity under the associated customer contract. |
-17-
Table of Contents
| (3) | We define average revenue per paid user as of any point in time as the trailing twelve-month subscription and support revenue divided by the average number of paid users over the same time period. |
| (4) | We calculate our annual subscription and support revenue net retention rate for a particular year by dividing current year subscription revenue by the prior year subscription revenue for those customers for which subscription revenue was recognized in the prior year. This calculation includes the impact on our revenue from customer non-renewals and attrition, deployments of additional services or discontinued use of services by our customers, price changes for our services and increases or decreases in the number of paid users. |
Non-GAAP Financial Measures
We believe adjusted EBITDA, a non-GAAP financial measure, provides investors and other users of our financial information consistency and comparability with our past financial performance and facilitates period-to-period comparisons of operations. We believe adjusted EBITDA is useful in evaluating our operating performance compared to that of other companies in our industry, as this metric generally eliminates the effects of certain items that may vary for different companies for reasons unrelated to overall operating performance. We use adjusted EBITDA in conjunction with traditional GAAP measures as part of our overall assessment of our performance, including the preparation of our annual operating budget and quarterly forecasts, to evaluate the effectiveness of our business strategies and to communicate with our board of directors concerning our financial performance.
Adjusted EBITDA should not be considered as a substitute for other measures of financial performance reported in accordance with GAAP. We understand that, although adjusted EBITDA is frequently used by investors and securities analysts in their evaluations of companies, adjusted EBITDA has limitations as an analytical tool, including: depreciation and amortization are non-cash charges, and the assets being depreciated or amortized will often have to be replaced in the future; adjusted EBITDA does not reflect any cash requirements for these replacements; adjusted EBITDA does not reflect changes in, or cash requirements for, our working capital needs or contractual commitments; adjusted EBITDA does not reflect cash requirements for income taxes and the cash impact of other income or expense; and other companies may calculate adjusted EBITDA differently than we do. We compensate for the inherent limitations associated with using adjusted EBITDA through disclosure of these limitations, presentation of our financial statements in accordance with GAAP and reconciliation of adjusted EBITDA to the most directly comparable GAAP measure, net loss.
The following table provides a reconciliation of net loss to adjusted EBITDA:
| Year Ended December 31, | Six Months Ended June 30, |
|||||||||||||||||||
| 2011 | 2012 | 2013 | 2013 | 2014 | ||||||||||||||||
| (in thousands) | ||||||||||||||||||||
| Net loss |
$ | (2,087 | ) | $ | (6,521 | ) | $ | (1,181 | ) | $ | (2,632 | ) | $ | (949 | ) | |||||
| Income from discontinued operations |
(6,999 | ) | — | — | — | — | ||||||||||||||
| Provision for (benefit from) income taxes |
(3,736 | ) | 1,091 | 1,439 | 484 | 842 | ||||||||||||||
| Other expense (income), net |
917 | (230 | ) | 318 | (40 | ) | (87 | ) | ||||||||||||
| Depreciation and amortization |
2,535 | 2,390 | 2,685 | 1,294 | 1,570 | |||||||||||||||
| Stock-based compensation |
1,367 | 1,355 | 1,511 | 720 | 919 | |||||||||||||||
|
|
|
|
|
|
|
|
|
|
|
|||||||||||
| Adjusted EBITDA |
$ | (8,003 | ) | $ | (1,915 | ) | $ | 4,772 | $ | (174 | ) | $ | 2,295 | |||||||
|
|
|
|
|
|
|
|
|
|
|
|||||||||||
-18-
Table of Contents
Investing in our common stock involves a high degree of risk. You should carefully consider the risks and uncertainties described below, together with all of the other information in this prospectus, including “Management’s Discussion and Analysis of Financial Condition and Results of Operations” and our consolidated financial statements and related notes, before making a decision to invest in our common stock. If any of the risks actually occur, our business, financial condition, operating results and prospects could be materially and adversely affected. In that event, the market price of our common stock could decline, and you could lose part or all of your investment.
Risks Related to our Business and Industry
We have a history of losses and we may not maintain profitability in the future.
Except in 2010, we have not been profitable on an annual basis since our formation. We experienced a net loss of $2.1 million, $6.5 million and $1.2 million for the years ended December 31, 2011, 2012 and 2013, respectively, and $2.6 million and $0.9 million for the six months ended June 30, 2013 and 2014, respectively. As of June 30, 2014, our accumulated deficit was $351.2 million. While our revenue has grown in recent periods and we were profitable on a quarterly basis in the quarters ended September 30, 2013 and December 31, 2013, we were not profitable in the six months ended June 30, 2014. Our revenue growth may not be sustainable and we may not achieve sufficient revenue to achieve and maintain profitability. We expect to make significant future expenditures related to the development and expansion of our business. In addition, as a public company, we will incur significant legal, accounting and other expenses that we did not incur as a private company. As a result of these expenditures, we will have to generate and sustain increased revenue to achieve and maintain future profitability. We may incur significant losses in the future for a number of reasons, including due to the other risks described in this prospectus, and we may encounter unforeseen expenses, difficulties, complications and delays and other unknown factors. We have encountered and will continue to encounter risks and difficulties frequently experienced by growing companies in rapidly changing industries. If we do not address these risks successfully or if our assumptions regarding these risks and difficulties are incorrect or change in reaction to changes in the market, our business could be harmed. Accordingly, we may not be able to maintain profitability and we may incur significant losses for the foreseeable future.
We derive our revenue from subscriptions to a single software platform, and any factor adversely affecting the Yodlee platform would harm our business and operating results.
We derive our revenue from subscriptions to a single software platform, and related support and professional services. As such, any factor adversely affecting subscriptions to the Yodlee platform, including those described elsewhere under “Risk Factors” or in other portions of this prospectus, would harm our business and operating results. In addition, while we intend to pursue new business initiatives, such as data analytics and market research services and revenue-sharing arrangements with third-party developers of FinApps, we cannot be sure that we will recognize significant revenue from those sources. The viability of these business opportunities depends on the continued success of the Yodlee platform, and our strategy to derive revenue from those activities would suffer if subscriptions to the Yodlee platform were adversely affected.
Revenue derived from sales to Bank of America, N.A., individually, and from Bank of America, N.A. and our two other largest customers, as a group, represented approximately 14.9% and 32.2%, respectively, of our total revenue during the year ended December 31, 2013, and approximately 14.3% and 25.6%, respectively, of our total revenue during the six months ended
-19-
Table of Contents
June 30, 2014, and we expect to continue to derive a significant portion of our revenue from a small number of customers.
The financial services industry in the United States is highly concentrated, with a small number of large financial institutions holding a majority of total assets held by all U.S. financial institutions. Because a portion of our business is targeted at this industry and our largest customers include 9 of the 15 largest banks in the United States (based on total assets as of September 30, 2013), a significant portion of our revenue is concentrated among a small number of these large financial institution customers. As a percentage of total revenue, revenue derived from Bank of America, N.A., a wholly-owned subsidiary of Bank of America Corporation, which beneficially owned in the aggregate 12.6% of our outstanding common stock as of June 30, 2014, individually, and from Bank of America, N.A., and our two other largest customers, as a group, was approximately 14.9% and 32.2%, respectively, in the year ended December 31, 2013 and 14.3% and 25.6%, respectively, during the six months ended June 30, 2014. We anticipate that revenue from a small group of customers will continue to account for a significant portion of our revenue in future periods. It would be difficult to replace any of our largest customers or the revenue derived from such customers. In addition, any publicity associated with the loss of any of our largest customers could harm our reputation, making it more difficult to attract and retain other large customers, and could weaken our negotiating position with respect to our remaining and prospective customers.
There can be no assurance that we will be able to continue our relationships with any of our largest customers on the same or more favorable terms in future periods or that our relationships will continue beyond the terms of our existing contracts with them. Our revenue and operating results could suffer if, among other things, any of our largest customers were to renegotiate, terminate, renew on less favorable terms or fail to renew their agreement with us.
Because some of our sales efforts are targeted at large financial institutions and large Internet services companies, we face prolonged sales cycles, substantial upfront sales costs and less predictability in completing some of our sales. If our sales cycle lengthens, or if our upfront sales investments do not result in sufficient revenue, our operating results may be harmed.
We target a portion of our sales efforts at large financial institutions and large Internet services companies, which presents challenges that are different from those we encounter with smaller customers. Because our large customers are often making an enterprise-wide decision to deploy our solutions, we face longer sales cycles, complex customer requirements, substantial upfront sales costs, significant contract negotiations and less predictability in completing sales with these customers. Our sales cycle can often last one year or more with our largest customers, who often undertake an extended evaluation process, but is variable and difficult to predict and can be longer or shorter. If we continue to expand globally, we anticipate that we may experience even longer sales cycles, more complex customer needs, higher upfront sales costs and less predictability in completing sales with our larger customers and customers located outside of the United States. If our sales cycle lengthens or our upfront sales investments do not generate sufficient revenue to justify our investments in our sales efforts, our operating results may be harmed.
Failure of our customers to deploy our solutions in a timely and successful manner could negatively affect our revenue and operating results.
The timing of revenue from our customers depends on a number of factors outside of our control and may vary from period to period. Our customers may request customization of our solutions for their systems or engage in a prolonged, internal decision making process regarding the deployment of our solutions. Among our larger customers, deployment of our solutions can be a complex and prolonged process and requires integration into the existing platform on our customers’ systems. Any delay during
-20-
Table of Contents
the deployment process related to technical difficulties experienced by our customers or us in integrating our solutions into our customers’ systems could further lengthen the deployment period and create additional costs or customer dissatisfaction. During the deployment period, we expend substantial time, effort, and financial resources in an effort to assist our customers with the deployment. Some of our customers may ultimately decide that it is not in the best interest of their business to deploy our solutions at all. We generally are not able to recognize the full potential value of our customer contracts until our customers actually deploy our solutions, though our contracts typically provide that minimum payments are due beginning on a specified date whether or not deployments are completed by that date. Cancellation of any deployment after it has begun could result in lost time, effort, and expenses invested in the cancelled deployment process, and would adversely affect our ability to recognize revenue that we anticipated at the time of the execution of the related customer contract. If our customers do not timely and successfully deploy our solutions, our future revenue and operating results could be negatively impacted.
Our future success depends upon our customers’ active and effective promotion of our solutions.
Our success depends on our customers, their willingness to effectively promote our solutions to their end users, and their end users’ adoption and use of our solutions. In general, our contracts with our customers allow them to exercise significant discretion over the promotion of our solutions, and they could give higher priority to other products or services they offer. Accordingly, losing the support of our customers would likely limit or reduce the use of our solutions and the related revenue. Our revenue may also be negatively affected by our customers’ operational decisions. For example, if a customer implements changes in its systems that disrupt the integration between its systems and ours, we could experience a decline in the use of our solutions. Even if our customers actively and effectively promote our solutions, there can be no assurance that their efforts will result in increased usage of our solutions by their end users or the growth of our revenue. Failure of our customers to effectively promote our solutions, and of their end users to increasingly adopt and use our solutions, could have a material adverse effect upon our future revenue and operating results.
Our reputation is critical to our business, and if our reputation is harmed our business and operating results could be adversely affected.
Our reputation, which depends on earning and maintaining the trust and confidence of our current and potential customers and end users, is critical to our business. Our reputation is vulnerable to many threats that can be difficult or impossible to control, and costly or impossible to remediate. Regulatory inquiries or investigations, data security breaches, lawsuits, employee misconduct, perceptions of conflicts of interest and rumors, among other developments, could substantially damage our reputation, even if they are baseless or satisfactorily addressed. In addition, any perception that the quality of our solutions may not be the same or better than that of other providers could also damage our reputation. Any damage to our reputation could harm our ability to attract and retain customers and key personnel and adversely affect our operating results. Attempts to repair our reputation, if damaged, may be costly and time consuming, and such efforts may not ultimately be successful.
Our hosting, collection, use and storage of customer information and data require the implementation of effective security controls, and a data security breach could disrupt our business, result in the disclosure of confidential information, expose us to liability and protracted and costly litigation, adversely affect our reputation and revenue and cause losses.
We and our customers through which our solutions are made available to end users, collect, use, transmit and store confidential end user-permissioned financial information such as bank account numbers, portfolio holdings, credit card data and outstanding debts and bills. The measures we take to
-21-
Table of Contents
provide security for collection, use, storage, processing and transmission of confidential end user information may not be effective to protect against data security breaches by third parties. We use commercially available security technologies, including hardware and software data encryption techniques and multi-layer network security measures, to protect transactions and information. Although we encrypt data fields that typically include sensitive, confidential information, other unencrypted data fields may include similar information that could be accessible in the event of a security breach. We use security and business controls to limit access and use of confidential end user information. However, a portion of the security protection begins with our customers because they are the initial point of user authentication of hosted solutions. Although we require our Internet services customers and third-party suppliers to implement controls similar to ours, the technologies and practices of our customers and third-party suppliers may not meet all of the requirements we include in our contracts and we may not have the ability to effectively monitor the implementation of security measures of our customers and third-party suppliers. In many cases, our customers build and host their own web applications and access our solutions through our APIs. In these cases, additional risks reside in the customer’s system with respect to security and preventive controls. As a result, inadequacies of our customers’ and third-party suppliers’ security technologies and practices may only be detected after a security breach has occurred. Errors in the collection, use, storage or transmission of confidential end user information may result in a breach of privacy or theft of assets.
The risk of unauthorized circumvention of our security measures has been heightened by advances in computer capabilities and the increasing sophistication of hackers. Criminals are using increasingly sophisticated techniques to engage in illegal activities involving solutions such as ours or end user information, such as counterfeiting, fraudulent payment and identity theft. Because the techniques used by hackers change frequently and generally are not recognized until launched against a target, we may be unable to anticipate these techniques or to implement adequate preventive measures. In addition to hackers, it is possible that a customer could gain unauthorized access to our database through the use of our solutions. Improper access to our systems or databases by hackers or customers intending to commit criminal activities could result in the theft, publication, deletion or modification of confidential end user information. An actual or perceived breach of our security may require notification under applicable data privacy regulations.
A data security breach of the systems on which sensitive user data and account information are stored could lead to claims or regulatory actions against us. If we are sued in connection with any data security breach, we could be involved in protracted and costly litigation. If unsuccessful in defending that litigation, we might be forced to pay damages and/or change our business practices or pricing structure, any of which could have a material adverse effect on our revenue and profitability. Our customer contracts typically include security standards that must be complied with by us and our customers. If a data security breach occurs and we have not been in compliance with the security standards included in our applicable contracts, we could be liable for breach of contract claims brought by our customers. We could also be required to indemnify our customers for third-party claims, fines, penalties and/or other assessments imposed on our customers as a result of any data security breach and our liability could exceed our insurance coverage or ability to pay.
Our security procedures and technologies are regularly audited by independent security auditors engaged by us, and many of our prospective and current customers conduct their own audits or review the results of such independent security audits as part of their evaluation of our solutions. We are also periodically audited by regulatory agencies to whom our operations or our customers are subject, including The Office of the Comptroller of the Currency, or the OCC, which is the Agency in Charge of multi-agency supervisory examinations of our operations. Adverse findings in these audits or examinations, even if not accompanied by any data security breach, could adversely affect our ability to maintain our existing customer relationships and establish new customer relationships.
-22-
Table of Contents
Data security breaches, acts of fraud involving our solutions, or adverse findings in security audits or examinations, could result in reputational damage to us, which could reduce the use and acceptance of our solutions, cause our customers to cease doing business with us and have a significant adverse impact on our revenue and future growth prospects. Further, any of these events could lead to additional regulation and oversight by federal and state agencies, which could impose new and costly compliance obligations and may lead to the loss of our ability to make our solutions available.
Privacy concerns could have an adverse impact on our revenue and harm our reputation and may require us to modify our operations.
As part of our business, we use, transmit and store confidential end user-permissioned data. We are subject to laws, rules and regulations relating to the collection, use, and security of end user data. For privacy or security reasons, privacy groups, governmental agencies and individuals may seek to restrict or prevent our use of this data. New laws in this area have been passed by several jurisdictions, and other jurisdictions are considering imposing additional restrictions. These new laws may be interpreted and applied inconsistently from jurisdiction to jurisdiction and our current data protection policies and practices may not be consistent with those interpretations and applications. In addition, the ability to execute transactions and the possession and use of personal information and data in conducting our business subjects us to legislative and regulatory burdens that may require notification to customers or employees of a security breach, restrict our use of personal information, hinder our ability to acquire new customers or market to existing customers, require us to modify our operations and have an adverse effect on our business, financial condition and operating results. We have incurred, and will continue to incur, significant expenses to comply with privacy and security standards and protocols imposed by law, regulation, industry standards or contractual obligations. As our business continues to expand to new industry segments that may be more highly regulated for privacy and data security, and to countries outside the United States that have more strict data protection laws, our compliance requirements and costs may increase.
If sources from which we obtain information limit our access to such information or charge us fees for accessing such information, our business could be materially and adversely harmed.
Our solutions require certain data that we obtain from thousands of sources, including banks, other financial institutions, retail businesses and other organizations, some of which are not our current customers. We receive over 75% of this data through structured data feeds that are provided under the terms of our contracts with most of our financial institution, or FI, customers. Although all of the information we currently gather is end user-permissioned data and, currently, we generally have free, unrestricted access to, or ability to use, such information, one or more of our current customers could decide to limit or block our access to the data feeds we currently have in place with these customers due to factors outside of our control such as more burdensome regulation of our or our customers’ industry, increased compliance requirements or changes in business strategy. If the sources from which we obtain information that is important to our solutions limit or restrict our ability to access or use such information, we may be required to attempt to obtain the information, if at all, through end user-permissioned data scraping or other means that could be more costly and time-consuming, and less effective or efficient. In the past, a limited number of third parties, primarily airline and international sites, have either blocked our access to their websites or requested that we cease employing data scraping of their websites to gather information, and we could receive similar, additional requests in the future. Any such limitation or restriction may also preclude us from providing our solutions on a timely basis, if at all. In addition, if in the future one or more third parties challenge our right to access information from these sources, we may be required to negotiate with these sources for access to their information or to discontinue certain services currently provided by our solutions. The legal environment surrounding data scraping and similar means of obtaining access to information on third-
-23-
Table of Contents
party websites is not completely clear and is evolving, and one or more third parties could assert claims against us seeking damages or to prevent us from accessing information in that manner. In the event sources from which we obtain this information begin to charge us fees for accessing such information, we may be forced to increase the fees that we charge our customers, which could make our solutions less attractive, or our gross margins and other financial results could suffer.
Failure by our customers to obtain proper permissions and waivers might result in claims against us or may limit or prevent our use of data, which could harm our business.
We require our customers to provide necessary notices and to obtain necessary permissions and waivers for use and disclosure of information through our solutions. Our contracts with our customers include assurances from them that they have done so and will do so, but we do not audit our customers to ensure that they have acted, and continue to act, consistent with such assurances. If, despite these requirements and contractual obligations, our customers do not obtain necessary permissions and waivers, then our use and disclosure of information that we receive from them or on their behalf might be limited or prohibited by federal, state or foreign privacy laws or other laws. Such a failure to obtain proper permissions and waivers could impair our functions, processes and databases that reflect, contain, or are based upon such data and might prevent use of such data. In addition, such a failure could interfere with, or prevent creation or use of, rules, analyses, or other data-driven activities that benefit us and our business. Moreover, we might be subject to claims or liability for use or disclosure of information by reason of lack of valid notices, agreements, permissions or waivers. These claims or liabilities could subject us to unexpected costs and adversely affect our operating results.
We operate in a highly regulated environment, and failure by us or financial institutions and other customers through which our solutions are made available to comply with applicable laws and regulations could have an adverse effect on our business, financial position and operating results.
We operate in a highly regulated environment at the federal, state and international levels, and failure by us or FIs and other customers through which our solutions are made available to comply with the laws and regulations to which we and they are subject could negatively impact our business. In particular, our solutions are subject to a strict set of legal and regulatory requirements intended to protect consumers and to help detect and prevent money laundering, terrorist financing and other illicit activities. Although we have internal controls in place to comply with applicable regulations, we cannot guarantee that our internal controls will always be effective in ensuring such compliance. Our FI customers and prospective customers are highly regulated and may be required to comply with stringent regulations in connection with subscribing to and implementing our solutions.
We are examined on a periodic basis by various regulatory agencies. For example, we are a supervised third-party technology service provider subject to multi-agency supervisory examinations in a wide variety of areas based on published guidance by the Federal Financial Institutions Examination Council. These examinations include examinations of our management, acquisition and development activities, support and delivery, IT, and disaster preparedness and business recovery planning. The OCC is the Agency in Charge of these examinations. If deficiencies are identified, customers may choose to terminate or reduce their relationships with us. As a result of obligations under our customer agreements, we are required to comply with certain provisions of the Gramm-Leach-Bliley Act, or GLBA, related to the privacy of consumer information and may be subject to other privacy and data security laws because of the solutions we provide. In addition, numerous regulations have been proposed and are still being written to implement the Dodd-Frank Wall Street Reform and Consumer Protection Act of 2010, or the Dodd-Frank Act, for enhanced due diligence of the internal systems and processes of companies like ours by their FI customers. If we are required to make changes to our
-24-
Table of Contents
internal processes and solutions as result of this heightened scrutiny, we could be required to invest substantial additional time and funds and divert time and resources from other corporate purposes to remedy any identified deficiency.
Money movement services are potentially subject to regulation under a variety of federal and state laws, including state statutes regulating “money transmitters” and federal laws, such as the Bank Secrecy Act and the regulations thereunder, which regulate “money transmitting businesses” and “money services businesses.” Many of these statutes are broadly worded and have not been subject to published judicial or administrative interpretation. While we believe that our money movement solutions comply with, or are exempt from, all applicable laws, as we conduct these services on behalf of regulated financial institutions, it is possible that one or more regulatory agencies could take the position that we are not in compliance or that we are required to register as a money transmitter in order to provide our money movement solutions. In addition, new laws or regulations, or interpretations of existing laws or regulations, could subject us to additional regulatory requirements. If we were prevented from operating our money movement solutions in one or more states, our ability to provide our money movement solutions would suffer as our customers generally require that our money movement solutions handle payments in all states. Moreover, if we were required to be licensed in one or more states, the licensing process could be time-consuming and expensive.
Many of these laws and regulations are evolving, unclear and inconsistent across various jurisdictions, and ensuring compliance with them is difficult and costly. Changes in laws and regulations or interpretations of existing laws and regulations may occur that could increase our compliance and other costs of doing business, require significant systems redevelopment, substantially change the way that banks and other FIs are regulated and able to offer their products to consumers, or render our solutions less profitable or obsolete, any of which could have an adverse effect on our operating results. Currently, the Consumer Financial Protection Bureau, or CFPB, has exclusive rulemaking authority under the GLBA, and many of our customers are subject to regulatory enforcement by the CFPB and/or the Federal Trade Commission, or FTC. It is difficult to predict future regulatory requirements that may be enacted by the CFPB, the manner in which such regulatory requirements will be enforced by the CFPB or the FTC, and the impact such requirements or enforcement actions may have on our or our customers’ business. Compliance with any new regulatory requirements may divert internal resources and be expensive and time-consuming. In order to comply with new regulations, we may be required to increase investment in compliance functions or new technologies. Failure to comply with the laws and regulations to which we are subject could result in fines, penalties or limitations on our ability to conduct our business, or federal or state actions, any of which could significantly harm our reputation with consumers, banks and regulators, and could materially and adversely affect our business, operating results and financial condition. See “Business—Government Regulation” for additional information regarding the regulations that impact our business.
If we are unable to expand our business with our existing customers, our business and ability to increase our revenue may suffer.
Our ability to increase our revenue depends in part on increasing revenue from our existing customers. We intend to seek to increase penetration among our existing customer base, both by increasing usage of product offerings in business units we currently serve and by expanding into new business units. However, the adoption of our solutions by specific business units of our existing customers does not necessarily indicate that we will be successful in expanding usage into other business units, which may have different needs, priorities and budgetary and other constraints. In addition, while we intend to introduce features and applications that will make our solutions increasingly attractive to end users, we cannot be certain that we will be successful in increasing usage of our solutions with existing customers. If we are unable to expand our business as we anticipate, our revenue could decrease and our business could be harmed.
-25-
Table of Contents
If we do not successfully market and sell our solutions to new customers, including Internet services companies, our revenue growth will be harmed.
Our ability to increase our revenue depends in part on our ability to attract new customers, including additional FI customers and new Internet services companies providing innovative financial solutions, or YI customers. While we believe that there are significant opportunities for sales to additional FIs, both in the United States and in international markets, we cannot be sure that we will be successful in achieving broader adoption of our solutions by FIs. Our future revenue growth is also dependent upon the continued purchase of our solutions by YI customers. Adoption and purchase of our solutions by these companies is still relatively new, and it is unclear if our solutions will be broadly adopted and purchased by these companies or the speed of any such adoption and purchases.
Increased revenue from YI customers may expose us to additional risks.
Our revenue from YI customers has increased in recent periods, and we expect that such customers will be increasingly important to our business in future periods. Some of these customers are smaller and may not be as financially stable as our FI customers and may not have the experience and resources relating to data security and operations that our FI customers generally have. Accordingly, although our contracts with these customers require them to, among other things, adhere to standards for data security and obtain necessary consents and waivers from end users to use their financial and other information, as we increase our business with YI customers we may be subject to an increased risk that one or more of such customers may fail to comply with these obligations and that such customers may not have the financial resources to satisfy any resulting indemnity obligations to us. If our YI customers experience financial difficulties, are limited by a lack of internal resources or otherwise fail to comply with their contractual obligations relating to data security, our revenue generated from these customers may suffer, our reputation could be harmed and we could be exposed to third-party claims.
We cannot be certain that we will be successful in increasing our revenue by introducing new revenue streams.
Important factors to our future growth include continued development and marketing of financial applications to make the Yodlee platform increasingly attractive to existing customers with the need for applications or combinations of applications tailored to their specific needs. In addition, we intend to seek to derive additional revenue by providing data analytics and market research services and are pursuing revenue-sharing opportunities with third-party developers of FinApps on the Yodlee platform. Each of these initiatives has individual challenges and risks. To market and sell data analytics and market research services successfully, we must continue to enhance our capabilities relating to the enrichment of massive data sets in order to provide tailored data services that appeal to the markets that we target, as well as develop additional capabilities in data analytics. We have only recently begun to derive revenue from the sale of data analytics and market research solutions, and in order to increase sales we will need to expand our sales and marketing capabilities. In addition, for FinApps to appeal to existing customers, or new customers, these applications must offer the functionality and user experience that is responsive to their needs and valued by end users. Moreover, we have not derived significant revenue to date from revenue-sharing arrangements with third-party developers of FinApps on the Yodlee platform, and we cannot be sure that we will enter into a substantial number of these arrangements or that any such arrangements will be successful. We cannot be certain that any of the activities described above will contribute to substantial additional revenue from the Yodlee platform or introduce substantial new revenue streams.
If our operations are interrupted as a result of service downtime or interruptions, our business and reputation could suffer.
The success of our business depends upon our ability to obtain and deliver time-sensitive, up-to-date data and information. Our operations and those of third parties on whom we rely for information
-26-
Table of Contents
and transaction processing services are vulnerable to interruption by technical breakdowns, computer hardware and software malfunctions, software viruses, infrastructure failures, fire, earthquake, power loss, telecommunications failure, terrorist attacks, wars, Internet failures and other events beyond our control. Any disruption in our solutions or operations, or those of third parties on whom we rely, could affect the ability of our solutions to perform effectively which in turn could result in a reduction in revenue. In addition, our contracts with our customers often include stringent requirements for us to maintain certain levels of performance and service availability. Failure by us to meet these contractual requirements could result in a claim for substantial damages against us, regardless of whether we are responsible for that failure. Our customers may also delay or withhold payment to us, elect to terminate or not to renew their contracts with us, or refuse to integrate our solutions into their online offerings, or we could lose future sales to new customers as a result of damage to our reputation due to such service downtime or interruptions. If we suffer a significant database or network facility outage, our business could experience disruption until we fully implement our back-up systems. The occurrence of any such disruptions in our solutions could materially and adversely affect our business.
If customers are unwilling to use our cloud-based solutions, our customer base may not grow or may decrease and our business could be harmed.
The cloud computing market is not as mature as the market for enterprise software, and it is uncertain whether cloud computing will achieve and sustain high levels of customer demand and market acceptance. Many enterprises have invested substantial personnel and financial resources to integrate legacy enterprise software into their businesses and are more familiar and comfortable with this type of infrastructure. Because our solutions involve the aggregation, storage and use of confidential information and related data, some customers, in particular customers located outside of the United States, may be reluctant or unwilling to migrate to our cloud-based solutions due to a lack of perceived cost and performance benefits associated with cloud-based solutions, and concerns regarding the ability of cloud computing companies to adequately address security and privacy concerns. If other cloud-based solutions experience security incidents, loss of customer data, disruptions in delivery or other problems, these concerns and perceptions regarding the market for cloud computing as a whole may be further negatively affected. If customers are unwilling to accept our cloud-based solutions as a result of these perceptions and concerns, we may be required to develop other alternative solutions for these customers, which would be time-consuming and costly and could negatively affect our gross margins. In addition, negative perceptions and concerns regarding cloud computing could cause the growth of our customer base to slow, which could result in decreased revenue and harm to our business.
Our revenue and operating results can fluctuate from period to period, which could cause our share price to fluctuate.
Our revenue and operating results have fluctuated in the past and may fluctuate from period to period in the future due to a variety of factors, many of which are beyond our control. If our operating results fall below the expectations of investors or any securities analysts who follow our common stock, the trading price of our common stock could decline substantially. Factors relating to our business that may contribute to these fluctuations include the following, as well as other factors described elsewhere in this prospectus:
| • | the timing and extent of our customers’ deployment and promotion of our solutions; |
| • | the timing of our customers’ renewals or any terminations of their contracts with us; |
| • | rate of expansion or contraction of our customer base; |
| • | changes in laws or regulatory policies that could impact our ability to offer our solutions to FIs or other customers; |
-27-
Table of Contents
| • | the timing and success of the introduction of new solutions by us or competitors; |
| • | unanticipated delays of rollouts of our solutions; |
| • | downward pressure on fees we charge for our solutions; |
| • | our ability to control costs, including third-party service provider costs and sales and marketing expenses in an increasingly competitive market; |
| • | the amount and timing of operating costs related to the maintenance and expansion of our business, operations and infrastructure, including globally; |
| • | changes in customers’ budgets; |
| • | changes to economic terms in contracts with customers, including renegotiations or unanticipated changes to the relationship; |
| • | fluctuations in currency exchange rates and in our effective tax rate; and |
| • | general economic and political conditions, both domestically and internationally, as well as economic conditions specifically affecting industries in which our customers operate. |
In addition, our revenue has usually been the strongest during the last two quarters of the year due to the terms of existing customer contracts with certain of our largest customers and associated revenue recognition, and timing of our customers’ deployment of our solutions and associated professional services revenue. Although we expect this trend to continue in the future, historical patterns should not be considered indicative of our future results.
As a result of these and other factors, we believe that quarter-to-quarter comparisons of our revenue and operating results may not be meaningful and should not be relied upon as indications of our future revenue or operating performance.
We rely significantly on revenue from subscriptions, which may decline or may fluctuate based on the timing of renewals, and, because we recognize revenue from subscriptions over the term of the relevant subscription period, downturns or upturns in sales are not immediately reflected in full in our operating results.
Our subscription and support revenue accounted for approximately 81% and 85% of our total revenue for the year ended December 31, 2013 and the six months ended June 30, 2014, respectively. Customers that purchase our subscriptions have no contractual obligation to renew their contracts after the initial contract period, which are typically three years, and we may not maintain our historical subscription renewal rates. Although customer contracts are generally non-cancellable during a specified period of time, customers typically have the right to terminate their contracts for a fee before the expiration of the entire initial contract period. New or renewal subscriptions may decline or fluctuate as a result of a number of factors, including our customers’ and end users’ level of satisfaction with our solutions and our customer support; the frequency and severity of subscription outages; the functionality and performance of our solutions; the timeliness and success of product enhancements and introductions by us and those of our competitors; the prices of our solutions; the prices of solutions offered by our competitors or reductions in our customers’ spending levels. If new or renewal subscriptions decline, our revenue or revenue growth may decline, and our business may suffer.
In addition, we recognize subscription revenue over the term of the relevant subscription period based on the terms of the applicable customer contract. As a result, most of the revenue we report each quarter is the recognition of billings from subscriptions entered into during previous quarters. Consequently, a decline in new or renewal subscriptions in any one quarter will not be fully reflected in revenue in that quarter, but will negatively affect our revenue in future quarters. Accordingly, the effect of significant downturns in new or renewed sales of our solutions would not be reflected in full in our results of operations until future periods.
-28-
Table of Contents
Because a portion of our revenue depends on the usage of our platform by end users, it may be difficult to evaluate our future prospects.
Our subscription and support contracts with our customers generally contain a minimum subscription fee, and usage-based fees which depend on the extent their customers or end users use our platform. This usage-based aspect to our pricing model makes it difficult to accurately forecast revenue because end users’ activities on our platform may vary from period to period based on a variety of factors, including personal financial circumstances, privacy and security concerns regarding online solutions such as ours, seasonality or other factors. As a result, historical revenue from a customer may not be a good indicator of our future revenue from that customer and changes in end user activity may limit our ability to forecast revenue.
Material defects or errors in the software we use to deliver our solutions or in the information we gather and disclose could harm our reputation, result in significant costs to us and impair our ability to sell our solutions.
The software applications underlying our solutions are inherently complex and may contain material defects or errors, particularly when first introduced or when new versions or enhancements are released. From time to time, we provide incremental releases of software updates and functional enhancements. Such new versions frequently contain undetected errors when first introduced or released. We have from time to time found defects in our solutions, and new errors in our existing solutions may be detected in the future. In addition, errors may result from the interface of our solutions with legacy systems and data, which we did not develop and the function of which is outside of our control.
Defects or errors in the information we gather from third parties or in storing end users’ data, in processing payment transactions, or that cause interruptions to the availability of our solutions could result in a reduction in sales or delay in market acceptance of our solutions, sales credits or refunds to our customers, loss of existing customers and difficulty in attracting new customers, diversion of development resources, harm to our reputation, and increased service and maintenance costs, and expose us to potential liability to our customers. We may not be able to identify or resolve these defects or errors in a timely manner. Correction of defects or errors could prove to be impossible or impracticable. The costs incurred in correcting any material defects or errors in our solutions or the information we provide, or in responding to resulting claims or liability, may be substantial. Resolving a defect or error and implementing remedial measures would likely divert the attention and resources of our management and key technical personnel from other business concerns, and could be extremely difficult if the underlying defect or error is located in a third party’s system or database.
Although we attempt to limit our contractual liability for consequential damages in delivering our solutions, these limitations on liability may be unenforceable in some cases, or may be insufficient to protect us from liability for damages. We maintain general liability insurance coverage, including coverage for errors or omissions; however, this coverage may not continue to be available on reasonable terms or may be insufficient to cover one or more large claims. An insurer might disclaim coverage as to any future claim. A successful assertion of one or more large claims against us that exceeds our available insurance coverage or changes in our insurance policies, including premium increases or the imposition of a large deductible or co-insurance requirement, could harm our operating results and financial condition.
If we fail to process transactions effectively or fail to adequately protect against disputed or potential fraudulent activities, our revenue and earnings may be harmed.
We process a significant volume and dollar value of transactions on a daily basis using our money movement solutions. Effective processing systems and controls are essential to ensure that transactions are handled appropriately. Despite our efforts, it is possible that we may make errors or
-29-
Table of Contents
that funds may be misappropriated due to fraud. If we are unable to effectively manage our systems and processes we may be unable to process money movement transactions in an accurate, reliable and timely manner, which may harm our business. In addition, if we do not detect suspected fraudulent or non-sufficient fund transactions within agreed-upon timelines, we may be required to reimburse our customers for the transactions and such reimbursements may exceed the amount of the reserves we have established to make such payments.
The online payments industry has been experiencing an increasing amount of fraudulent activities by third parties. Although we do not believe that any of this activity is uniquely targeted at our business, this type of fraudulent activity may adversely impact us. In addition to any direct damages and potential fines that may result from such fraud, which may be substantial, a loss of confidence in our controls may seriously harm our business and damage our reputation. We may implement risk control mechanisms that could make it more difficult for legitimate end users to use our solutions, which could result in lost revenue and negatively impact our operating results.
If we are unable to maintain our payment network with third-party service providers, or if our disbursement partners encounter business difficulties, our business could be harmed.
Our payment network consists of a single Originating Deposit Financial Institution, or ODFI, and a small number of bill payment processors. Our ODFI clears and processes the funds from the customer. In the instance of funds transfers, the ODFI also processes funds to the end user’s destination institution. For bill payment, funds are sent to the bill pay processors for disbursement to biller sites.
While we have entered into an agreement with our ODFI and each of our bill payment processors, these partners could choose to terminate or not renew their agreements with us. If we are unable to maintain our agreements with our current partners, or our current partners are unable to handle increased transaction volumes, our ability to disburse transactions and our revenue and business may be harmed. If we are unable to sign new payment processors and/or ODFIs under terms consistent with, or better than, those currently in place, our revenue and business may be harmed.
Payment processors and ODFI partners also engage in a variety of activities in addition to providing our services and may encounter business difficulties unrelated to our services. Such activities or difficulties could cause the affected partner to reduce the services provided, cease to do business with us, or cease doing business altogether. This could lead to our inability to move funds on a timely basis as required to settle transactions. In addition, because we offer next day automated clearing house transactions in certain cases, if a disbursement partner experiences insufficient liquidity or ceases to do business, we may not be able to recover funds that are held with that disbursement partner which could harm our financial condition and operating results.
We may also be forced to cease doing business with payment processors and/or ODFIs if rules governing electronic funds transfers change or are reinterpreted to make it difficult or impossible for us to operate our money movement solutions.
If we are unable to effectively compete, our business and operating results could be harmed.
While we do not believe any single company in the financial services space offers a comprehensive platform with diverse features such as ours, the following companies offer individual solutions that compete with one or more of our solutions:
| • | for data aggregation: Intuit, Inc. and Fiserv, Inc. (CashEdge); |
| • | for personal financial management: Intuit (direct to consumer service) and internal IT departments of FIs, as well as early-stage companies; |
-30-
Table of Contents
| • | for online bill pay: Fiserv and FIS Global Corporation; |
| • | for data products and services: global payment networks, credit bureaus and other institutions that have access to large pools of data; and |
| • | for account verification: MicroBilt Corporation and Early Warning Systems, LLC. |
Many of the companies that compete with one or more of our applications have greater name recognition, substantially greater financial, technical, marketing and other resources, the ability to devote greater resources to the promotion, sale and support of their solutions, more extensive customer bases and broader customer relationships, longer operating histories, and greater name recognition than we have.
We expect competition to increase as other companies continue to evolve their offerings and as new companies enter our market. New companies entering our market may choose to offer internally-developed solutions at little or no additional cost to their end users by bundling them with their existing applications and solutions. Increased competition is likely to result in pricing pressures, which could negatively impact our gross margins. If we are unable to effectively compete, our revenue could decline and our business, operating results and financial condition could be adversely affected.
Our business could be harmed if we do not keep up with rapid technological change, evolving industry standards or changing expectations and requirements of our customers.
We expect technological developments to continue at a rapid pace in our industry. Our success will depend, in part, on our ability to:
| • | continue to develop our technology expertise; |
| • | recruit and retain skilled technology professionals; |
| • | effectively manage the technology associated with our business; |
| • | enhance our current solutions; |
| • | develop new solutions that meet our customers’ needs; and |
| • | influence and respond to emerging industry standards and other technological changes. |
In addition, we must continue to meet changing expectations and requirements of our customers. We must accomplish all of these tasks in a timely and cost-effective manner, and our failure to do so could harm our business, including materially reducing our revenue and operating results.
As a result of our customers’ increased usage of our platform, we will need to continually improve our hosting infrastructure to meet our customers’ needs and avoid service interruptions or slower system performance.
We have experienced significant growth in the number of transactions and data that our hosting infrastructure supports. We seek to maintain sufficient excess capacity in our infrastructure to meet the needs of all of our existing and new customers. A component of our growth strategy involves the establishment of additional data centers in new locations. If our business continues to grow, we may also need to increase bandwidth, storage or other elements of our infrastructure.
The amount of infrastructure needed to support our customers is based on our estimates of anticipated usage. If we do not accurately predict our infrastructure capacity requirements, our customers could experience service outages or slower system performance that may subject us to financial penalties and result in customer losses, which could harm our reputation and adversely affect
-31-
Table of Contents
our revenue growth. In addition, increasing our infrastructure as a result of experiencing unforeseen increases in usage or in anticipation of increased usage from new or existing customers would cause us to have increased cost of revenue, which could adversely affect our gross margins until we sufficiently increase revenue to offset the increased costs.
We rely on relationships with third-party service providers to conduct our business, and our operating results and financial position could be materially and adversely affected if we fail to maintain these relationships or we maintain them under new terms that are less favorable to us.
We rely on data center and other service providers in order to deliver our solutions and operate our business. We also rely on software licenses from third parties and support from third parties for the operation of our business by maintaining our physical facilities, equipment, power systems and infrastructure. The failure of these third parties to provide acceptable and high quality services and technologies or to update their services and technologies may result in a disruption to our business operations and our customers, which may reduce our revenue, cause us to lose customers and damage our reputation. If we lose the services of one or more of our third-party service providers for any reason or if their services are disrupted, for example due to viruses or denial of service or other attacks on their systems, or due to human error, intentional bad acts, power loss, hardware failures, telecommunications failures, wars, terrorist attacks, earthquakes, or similar catastrophic events, we could experience a disruption in our ability to offer our solutions and adverse perception of our solutions’ reliability, or we could be required to retain the services of replacement third-party service providers. Alternative arrangements and services may not be available to us on commercially reasonable terms, if at all, or we may experience business interruptions upon a transition to an alternative partner, either of which could increase our operating costs and harm our business.
If we are unable to effectively manage certain risks and challenges related to our India operations, our business could be harmed.
Our India operations are a key factor to our success. We believe that our significant presence in India provides certain important advantages for our business, such as direct access to a large pool of skilled professionals and assistance in growing our business internationally. However, it also creates certain risks that we must effectively manage. As of June 30, 2014, approximately 80% of our total employees were based in India. Wage costs in India for skilled professionals are currently lower than in the United States for comparably skilled professionals. However, wages in India are increasing at a faster rate than in the United States, which could result in us incurring increased costs for technical professionals and reduced margins. There is intense competition in India for skilled technical professionals, and we expect such competition to increase. As a result, we may be unable to cost-effectively retain our current employee base in India or hire additional new talent. In addition, India has experienced significant inflation, low growth in gross domestic product and shortages of foreign exchange. India also has experienced civil unrest and terrorism and, in the past, has been involved in conflicts with neighboring countries. The occurrence of any of these circumstances could result in disruptions to our India operations, which, if continued for an extended period of time, could have a material adverse effect on our business. If we are unable to effectively manage any of the foregoing risks related to our India operations, our development efforts could be impaired, our growth could be slowed, and our operating results could be negatively impacted.
As a global organization, our business is susceptible to risks associated with our international operations and sales.
We currently maintain international operations in India, the United Kingdom and Canada, lease space in other jurisdictions outside of the United States for the purpose of gathering data, and have
-32-
Table of Contents
customers located around the globe. Managing a global organization and conducting sales outside of the United States is difficult and time-consuming and introduces risks that we may not face with our operations and sales in the United States. These risks include:
| • | the burdens of complying with a wide variety of foreign regulations, laws and legal standards, including privacy, data security, tax and employment, some of which may be more stringent than those of the United States; |
| • | regional data privacy laws that apply to the transmission of data across international borders; |
| • | lack of familiarity with, and unexpected changes in, foreign regulatory requirements; |
| • | customers’ unfamiliarity with and concerns regarding laws and regulations of the United States that may impact our business operations in their jurisdictions; |
| • | negative, local perception of industries and customers that we may pursue; |
| • | laws and business practices favoring local competitors; |
| • | localization of our solutions, including translation into foreign languages and adaptation for local practices and regulatory requirements; |
| • | different pricing environments and longer sales cycles; |
| • | longer accounts receivable payment cycles and difficulties in collecting accounts receivable; |
| • | difficulties in managing and staffing international operations; |
| • | reduced or varied protection for intellectual property rights in some countries; |
| • | compliance with laws and regulations for foreign operations, including the U.S. Foreign Corrupt Practices Act, the U.K. Bribery Act, import and export control laws, tariffs, trade barriers, economic sanctions and other regulatory or contractual limitations on our ability to sell our solutions in certain foreign markets, and the risks and costs of compliance; |
| • | fluctuations in currency exchange rates; |
| • | potentially adverse tax consequences, including the complexities of foreign value added tax systems, difficulty in interpreting international tax laws and restrictions on the repatriation of earnings; |
| • | increased financial accounting and reporting burdens and complexities; and |
| • | political, social and economic instability abroad, terrorist attacks and security concerns in general. |
Operating in international markets also requires significant management attention and financial resources. A component of our growth strategy involves the further expansion of our operations and the development of new customer relationships internationally. As we seek to expand internationally, we will need to develop relationships with additional partners and add internal capabilities to effectively manage the operational, financial, legal and regulatory requirements and risks associated with our international operations. The investment we make and additional resources we use to expand our operations, target new international customers, expand our presence globally within our existing customers and manage operational and sales growth in other countries may not produce desired levels of revenue or profitability, which could adversely affect our business and operating results.
Our future success depends on the continued services of our management team and our ability to recruit, train and retain qualified and skilled employees, including research and development, sales, marketing and support personnel.
Our ability to effectively develop and provide our solutions and maintain and develop relationships with current and potential customers depends largely on the continued services of our management
-33-
Table of Contents
team and our ability to attract, train, motivate and retain highly skilled professionals, particularly professionals with backgrounds in sales, marketing, technology, customer support and financial management services. We believe that success in our business will continue to be based upon the strength of our intellectual capital. For example, due to the complexity of our solutions and the intellectual capital invested in our technology, the loss of personnel that are integral to the development of our solutions and engineering efforts would harm our ability to maintain and grow our business. In addition, our customers depend on our professional services team to assist them with the deployment of our solutions within their infrastructure and, after deployment, to help resolve any issues relating to our solutions that may arise. A high level of support is an important factor in contract renewals and cross-selling of our platform. Consequently, we must hire and retain employees with the technical expertise, skill set and industry knowledge necessary to continue to develop our solutions and effectively manage our growing sales, support and marketing organizations to ensure the growth of our business and the satisfaction of our customers.
We plan to continue to expand our engineering team, our direct sales force and marketing teams, and our customer support teams both domestically and internationally. We believe there is significant competition for professionals in these areas with the skills and technical knowledge necessary to develop the solutions and perform the services we offer. Competition for these employees is particularly intense in the software and technology industries, including in India where a significant portion of our employee headcount is located, and we may not be able to retain our existing employees or be able to recruit and retain other highly qualified personnel in the future. In addition, new hires require significant training and, in most cases, take significant time before they achieve full productivity. Our recent hires and planned hires may not become as productive as we expect or may take longer to become productive than we anticipate. If we cannot hire, train and retain qualified personnel, our ability to continue to conduct our business could be impaired and our revenue could decline.
If our intellectual property and technology are not adequately protected to prevent use or appropriation by our competitors, our business and competitive position would suffer.
We rely on a combination of patent, copyright, service mark, trademark and trade secret laws, as well as confidentiality procedures and contractual restrictions, to establish and protect our proprietary rights, all of which provide only limited protection. As of June 30, 2014, we had 64 issued U.S. patents, 23 pending U.S. patent applications, 8 issued patents in foreign jurisdictions and 13 pending patent applications in foreign jurisdictions. Some of these patents relate to technology that is included in our data aggregation platform and expire beginning in 2018. Any owned patents or patents that may issue in the future from pending or future patent applications may not provide sufficiently broad protection, may be invalidated or circumscribed or may not prove to be enforceable in actions against alleged infringers. In addition, recent changes to the patent laws in the United States may bring into question the validity of certain categories of software patents. As a result, we may not be able to obtain adequate patent protection for our software or effectively enforce any patents that issue in the future that cover our software. Also, we cannot assure you that any future service mark or trademark registrations will be issued for pending or future applications or that any registered service marks or trademarks will be enforceable or provide adequate protection of our proprietary rights. Furthermore, effective patent, trademark, service mark, copyright and trade secret protection may not be available in every country in which our services are available. Unauthorized copying or other misappropriation of our proprietary technologies could enable third parties to benefit from our technologies without paying us for doing so, which could harm our business.
We endeavor to enter into agreements with our employees and contractors and agreements with parties with whom we do business to limit access to and disclosure of our proprietary information. The steps we have taken may be inadequate to prevent the misappropriation of our proprietary technology. There can be no assurance that others will not develop or patent similar or superior technologies, products or services.
-34-
Table of Contents
Policing the unauthorized use of proprietary technology is difficult and expensive and our monitoring and policing activities may not be sufficient to identify any misappropriation and protect our proprietary technology. In addition, third parties may knowingly or unknowingly infringe our patents, trademarks and other intellectual property rights, and litigation may be necessary to protect and enforce our intellectual property rights. If litigation is necessary to protect and enforce our intellectual property rights, any such litigation could be very costly, could divert management attention and resources and may not be successful, even when our rights have been infringed.
We also expect that the more successful we are, the more likely it becomes that competitors will try to develop products that are similar to ours, which may infringe on our proprietary rights. If we are unable to protect our proprietary rights or if third parties independently develop or gain access to our or similar technologies, our business, revenue, reputation and competitive position could be harmed.
Assertions by a third party that we infringe its intellectual property, whether successful or not, could subject us to costly and time-consuming litigation, expensive licenses or substantial indemnity obligations and may prevent us from selling our products and services.
The software and technology industries are characterized by the existence of a large number of patents, copyrights, trademarks and trade secrets and by frequent litigation based on allegations of infringement or other violations of intellectual property rights. Although we have not suffered a material loss from third-party claims to date, from time to time, we face allegations that we or our customers have infringed, misappropriated or violated intellectual property rights. Litigation may be necessary to determine the validity and scope of third-party intellectual property rights. Some of the claims may involve patent holding companies or non-practicing entities who have no relevant product revenue of their own, and against whom our own patents may provide little or no deterrence. Our technologies may not be able to withstand third-party claims or rights against their use. Additionally, although we have licensed from other parties proprietary technology covered by patents, we cannot be certain that any such patents will not be challenged, invalidated or circumvented.
Furthermore, many of our agreements require us to indemnify our customers for certain third-party intellectual property infringement claims, which could increase our costs as a result of defending such claims and may require that we pay damages if there were an adverse ruling related to any such claims. Such indemnity claims are often difficult to assess, particularly at an early stage and without significant further investigation, as the third-party intellectual property claims at issue often relate to features or functions offered by our customers that include a combination of our customers’ solutions and those of third parties, as well as those provided by our platform; we may not have complete information regarding the infringement claims being asserted by the third party; and there may exist substantial questions relating to the validity of the third-party intellectual property alleged to be infringed. In addition, even if third-party infringement claims are successful, we may have defenses that limit or eliminate our indemnification obligations. Although we have not been obligated to pay material amounts pursuant to such indemnification claims in the past, we could be obligated to do so in the future, and any such indemnity obligations could significantly exceed the revenues that we have derived under the related customer contract. These types of claims could harm our relationships with our customers, may deter future customers from subscribing to our services and could expose us to litigation for these claims. Even if we are not a party to any litigation between a customer and a third party, an adverse outcome in any such litigation could make it more difficult for us to defend our intellectual property in any subsequent litigation in which we are a named party.
Any intellectual property rights claim against us or our customers, with or without merit, could be time-consuming and expensive to litigate or settle, and could divert management attention and financial resources. An adverse determination also could cause us to have to pay damages, modify our solutions or the Yodlee platform, stop using technology found to be in violation of a third party’s rights
-35-
Table of Contents
or prevent us from offering our solutions to our customers. In addition, we may have to seek a license for the technology, which may not be available on reasonable terms, if at all, or procure or develop substitute solutions that do not infringe.
Our use of “open source” software could negatively affect our ability to sell our solutions and subject us to possible litigation.
Portions of the Yodlee platform and our solutions incorporate so-called “open source” software, and we may incorporate additional open source software in the future. Open source software is generally licensed by its authors or other third parties under open source licenses. If we fail to comply with these licenses, we may be subject to specified conditions, including requirements that we offer our solutions that incorporate the open source software for no cost, that we make available source code for modifications or derivative works we create based upon, incorporating or using the open source software and that we license such modifications or derivative works under the terms of the particular open source license. If an author or other third party that distributes open source software that we use were to allege that we had not complied with the conditions of one or more of these licenses, we could be required to incur significant legal expenses defending against such allegations and could be subject to significant damages, including being enjoined from the sale of our solutions that contained the open source software and could be required to comply with the foregoing conditions, which could disrupt the sale of the affected solution. In addition, there have been claims challenging the ownership of open source software against companies that incorporate open source software into their products. As a result, we could be subject to suits by parties claiming ownership of what we believe to be open source software. Litigation could be costly for us to defend, have a negative effect on our operating results and financial condition and require us to devote additional research and development resources to change our solutions.
Litigation or investigations could result in significant settlements, fines or penalties.
We have been the subject of general litigation in the past, and could be the subject of litigation, including class actions, and regulatory or judicial proceedings or investigations in the future. The outcome of litigation and regulatory or judicial proceedings or investigations is difficult to predict. Plaintiffs or regulatory agencies in these matters may seek recovery of very large or indeterminate amounts or seek to have aspects of our business suspended or modified. The monetary and other impact of these actions may remain unknown for substantial periods of time. The cost to defend, settle or otherwise resolve these matters may be significant.
If regulatory or judicial proceedings or investigations were to be initiated against us by private or governmental entities, our business, operating results and financial condition could be adversely affected. Adverse publicity that may be associated with regulatory or judicial proceedings or investigations could negatively impact our relationships with our customers and decrease acceptance and use of our solutions.
We have experienced rapid growth in recent periods. If we fail to manage our growth effectively, we may be unable to execute our business plan or maintain high levels of service and our financial results could be negatively impacted.
We have increased our number of full-time employees from 645 at December 31, 2011 to 837 at June 30, 2014 and have increased our annual revenue from $54.4 million in the year ended December 31, 2011 to $70.2 million in the year ended December 31, 2013. Our recent growth and expansion has placed, and our anticipated growth may continue to place, a significant strain on our managerial, administrative, operational, financial and other resources. We intend to continue to expand our overall business, customer base, headcount and operations as we prepare to be a public company.
-36-
Table of Contents
Expansion creates new and increased management and training responsibilities for our employees. In addition, continued growth increases the challenges involved in:
| • | recruiting, training and retaining sufficient skilled technical, marketing, sales and management personnel, in particular in our India location; |
| • | preserving our culture, values and entrepreneurial environment; |
| • | successfully expanding the range of solutions offered to our customers; |
| • | developing and improving our internal administrative infrastructure, particularly our financial, operational, compliance, recordkeeping, communications and other internal systems; |
| • | managing our international operations and the risks associated therewith; |
| • | supporting a potentially broad pool of third-party developers who may use our open platform; |
| • | maintaining high levels of satisfaction with our solutions among our customers; and |
| • | effectively managing expenses related to any future growth. |
If we fail to manage our growth effectively, we may be unable to execute our business plan or maintain high levels of service for our customers. In addition, if we are unable to manage our expenses related to growth effectively in the future, our gross margins or operating expenses may be negatively impacted in any particular quarter.
Acquisition activity involving our customers could adversely affect our business.
Acquisitions or similar transactions involving our customers, including financial institutions, could negatively affect our business in a number of ways. After such a transaction, the acquiror might terminate, not renew or seek to renegotiate the economic terms of its contract with us. Companies involved in these transactions may experience integration difficulties that could increase the risk of providing us inaccurate or untimely data or delay deployment of our solutions. Any of our existing customers may be acquired by an organization with no relationship with us, effectively terminating our relationship, or be acquired by an organization that already has online personal financial management and payment solutions integrated into its systems, or that offers competing services to ours, which might cause us to lose business and harm our revenue, operating results or financial condition.
Future acquisitions or investments could disrupt our business and harm our financial condition.
As part of our business strategy, we may pursue acquisitions or investments that we believe will help us to achieve our strategic objectives. The process of integrating an acquired business, product or technology can create unforeseen operating difficulties, expenditures and other challenges such as:
| • | increased regulatory and compliance requirements; |
| • | implementation or remediation of controls, procedures and policies at the acquired company; |
| • | diversion of management time and focus from operation of our then-existing business to acquisition integration challenges; |
| • | coordination of product, sales, marketing and program and systems management functions; |
| • | transition of the acquired company’s customers onto our systems; |
| • | retention of employees from the acquired company; |
| • | integrating employees from the acquired company into our organization; |
| • | integration of the acquired company’s accounting, information management, human resource and other administrative systems and operations generally with ours; |
-37-
Table of Contents
| • | liability for activities of the acquired company prior to the acquisition, including violations of law, commercial disputes, and tax and other known and unknown liabilities; and |
| • | litigation or other claims in connection with the acquired company, including claims brought by terminated employees, customers, former stockholders or other third parties. |
If we are unable to address these difficulties and challenges or other problems encountered in connection with any future acquisition or investment, we might not realize the anticipated benefits of that acquisition or investment, we might incur unanticipated liabilities or we might otherwise suffer harm to our business generally.
To the extent we pay the consideration for any future acquisitions or investments in cash, the payment would reduce the amount of cash available to us for other purposes. Future acquisitions or investments could also result in dilutive issuances of our equity securities or the incurrence of debt, contingent liabilities, amortization expenses, or impairment charges against goodwill on our balance sheet, any of which could harm our financial condition and negatively impact our stockholders.
We are a multinational organization faced with increasingly complex tax issues in several jurisdictions, and we could be obligated to pay additional taxes in various jurisdictions.
As a multinational organization, we may be subject to taxation in several jurisdictions around the world with increasingly complex tax laws, the application of which can be uncertain. The amount of taxes we pay in these jurisdictions could increase substantially as a result of changes in the applicable tax principles, including increased tax rates, new tax laws or revised interpretations of existing tax laws and precedents, which could have a material adverse effect on our liquidity and operating results. In addition, the authorities in these jurisdictions could review our tax returns and impose additional tax, interest and penalties, and the authorities could claim that various withholding requirements apply to us or our subsidiaries or assert that benefits of tax treaties are not available to us or our subsidiaries, any of which could have a material impact on us and the results of our operations. For example, the taxing authorities of India and other jurisdictions in which we operate may challenge our methodologies for allocating income and expense under our intercompany arrangements, including our transfer pricing, or determine that the manner in which we operate our business is not consistent with the manner in which we report our income to the jurisdictions. If such a disagreement were to occur, and our positions were not sustained, we could be required to pay additional taxes, interest and penalties, resulting in higher effective tax rates, reduced cash flows and higher expenses.
We may be subject to additional obligations to collect and remit sales tax and other taxes, and we may be subject to tax liability for past sales, which could adversely harm our business.
State, local and foreign jurisdictions have differing rules and regulations governing sales, use, value added and other taxes, and these rules and regulations are subject to varying interpretations that may change over time. In particular, the applicability of such taxes to our subscription cloud-based software platform in various jurisdictions is unclear. Further, these jurisdictions’ rules regarding tax nexus are complex and vary significantly. As a result, we could face the possibility of tax assessments and audits, and our liability for these taxes and associated penalties could exceed our original estimates. A successful assertion that we should be collecting additional sales, use, value added or other taxes in those jurisdictions where we have not historically done so and do not accrue for such taxes could result in substantial tax liabilities and related penalties for past sales, discourage customers from purchasing our services or otherwise harm our business and operating results.
We face exposure to foreign currency exchange rate fluctuations.
We have costs denominated in foreign currencies, primarily the Indian Rupee, and our revenue is primarily denominated in the U.S. dollar. This exposes us to the risk of fluctuations in foreign currency
-38-
Table of Contents
exchange rates. Accordingly, changes in exchange rates, and in particular a weakening of the U.S. dollar, would negatively affect our expenses and other operating results as expressed in U.S. dollars. We manage our exposure to fluctuations in the Indian Rupee by entering into forward contracts to cover a portion of our projected expenditures paid in the Indian Rupee. These contracts generally have a term of less than 12 months. The use of such forward contracts, or other hedging activities in which we may engage in the future, may not offset any or more than a portion of the adverse financial effects of unfavorable movements in foreign exchange rates over the limited time the hedges are in place.
If we fail to maintain proper and effective internal controls, our ability to produce accurate financial statements on a timely basis could be impaired, which could result in a loss of investor confidence in our financial reports and have an adverse effect on our stock price.
Our management is responsible for establishing and maintaining adequate internal controls over financial reporting to provide reasonable assurance regarding the reliability of our financial reporting and the preparation of financial statements for external purposes in accordance with U.S. generally accepted accounting principles, or GAAP. If we are unable to maintain adequate internal controls over financial reporting, we might be unable to report our financial information on a timely basis and might suffer adverse regulatory consequences or violate stock market listing standards. There could also be a negative reaction in the financial markets due to a loss of investor confidence in us and the reliability of our financial statements. We have in the past and may in the future discover areas of our internal financial and accounting controls and procedures that need improvement. Our internal controls over financial reporting will not prevent or detect all error and all fraud. A control system, no matter how well conceived and operated, can provide only reasonable, not absolute, assurance that the objectives of the control system will be met. Because of the inherent limitations in all control systems, no evaluation of controls can provide absolute assurance that all control issues and instances of fraud, if any, within our company will be detected. If we are unable to maintain proper and effective internal controls, we may not be able to produce accurate financial statements on a timely basis, which could adversely affect our ability to operate our business and could result in regulatory action, and could require us to restate, our financial statements. Any such restatement could result in a loss of public confidence in the reliability of our financial statements and sanctions imposed on us by the Securities and Exchange Commission, or the SEC.
Changes in financial accounting standards or practices may cause adverse, unexpected financial reporting fluctuations and harm our operating results.
GAAP is subject to interpretation by the Financial Accounting Standards Board, the SEC and various bodies formed to promulgate and interpret appropriate accounting principles. A change in accounting standards or practices could harm our operating results and may even affect our reporting of transactions completed before the change is effective. New accounting pronouncements and varying interpretations of accounting pronouncements have occurred and may occur in the future. Changes to existing rules or the questioning of current practices may harm our operating results or the way we conduct our business.
We might not be able to utilize a significant portion of our net operating loss or other tax credit carryforwards, which could adversely affect our profitability.
As of December 31, 2013, we had federal and state net operating loss carryforwards of approximately $134 million and $101 million, respectively. If not utilized, these federal and state net operating loss carryforwards will begin to expire in 2022 and 2014, respectively.
In addition, under Section 382 of the Internal Revenue Code of 1986, as amended, or the Code, our ability to utilize net operating loss carryforwards or other tax attributes in any taxable year may be
-39-
Table of Contents
limited if we experience an “ownership change”. A Section 382 “ownership change” generally occurs if one or more stockholders or groups of stockholders who own at least 5% of our stock increase their ownership by more than 50 percentage points over their lowest ownership percentage within a rolling three-year period. Similar rules might apply under state tax laws. Future issuances or trading of our stock could cause an “ownership change”. It is possible that any future ownership change, could have a material effect on the use of our net operating loss carryforwards or other tax attributes, which could adversely affect our profitability.
Natural disasters and other events beyond our control could harm our business.
Natural disasters or other catastrophic events may cause damage or disruption to our operations, international commerce and the global economy, and thus could have a strong negative effect on us. Our business operations are subject to interruption by natural disasters, fire, power shortages, pandemics and other events beyond our control. Although we maintain crisis management and disaster response plans, such events could make it difficult or impossible for us to deliver our solutions to our customers, and could decrease demand for our solutions. The majority of our research and development activities, corporate headquarters, information technology systems, and other critical business operations are located in California and India, both of which areas have experienced major earthquakes in the past. Significant recovery time could be required to resume operations and our financial condition and operating results could be harmed in the event of a major earthquake or catastrophic event.
Adverse global economic conditions could harm our business and financial condition.
The onset or continuation of adverse macroeconomic developments could negatively affect our business and financial condition. Adverse global economic events have caused, and could, in the future, cause disruptions and volatility in global financial markets and increased rates of default and bankruptcy, and could impact consumer and small business spending. Challenging economic times could cause potential new customers not to purchase or to delay purchasing our solutions, and could cause our existing customers to discontinue purchasing or delay upgrades of our existing solutions, thereby negatively impacting our revenue and future financial results. In addition, a downturn in the banking and finance sector may disproportionately affect us because a significant portion of our customers operate in that sector. We cannot predict the timing, strength or duration of any economic slowdown or recovery, whether global, regional or within specific markets. If the conditions of the general economy or markets in which we operate worsen, our business and our future operating results could be harmed.
Risks Related to this Offering and Ownership of Our Common Stock
One of the underwriters in this offering is a wholly-owned subsidiary of one of our shareholders that beneficially owns more than 10% of our outstanding common stock and has an interest in this offering beyond customary underwriting discounts and commissions.
Merrill Lynch, Pierce, Fenner & Smith Incorporated, an underwriter of this offering, is a wholly- owned subsidiary of Bank of America Corporation, or BAC, which beneficially owned in the aggregate 12.6% of our outstanding common stock as of June 30, 2014. Since BAC beneficially owns more than 10% of our outstanding common stock, a “conflict of interest” is deemed to exist under Rule 5121(f)(5)(B) of the Conduct Rules of the Financial Industry Regulatory Authority. Accordingly, this offering will be made in compliance with the requirements of Rule 5121, which requires that no sale be made to discretionary accounts by underwriters having a conflict of interest without the prior written approval of the account holder and that a qualified independent underwriter participate in the preparation of the registration statement and prospectus and perform the usual standards of due diligence with respect thereto. In accordance with this rule, Goldman, Sachs & Co. has assumed the
-40-
Table of Contents
responsibilities of acting as a qualified independent underwriter. In its role as qualified independent underwriter, Goldman, Sachs & Co. has participated in due diligence and the preparation of this prospectus and the registration statement of which this prospectus is a part. Although Goldman, Sachs & Co. has, in its capacity as qualified independent underwriter, participated in due diligence and the preparation of this prospectus and the registration statement of which this prospectus is a part, we cannot assure you that this will adequately address any potential conflicts of interest. We have agreed to indemnify Goldman, Sachs & Co. against certain liabilities incurred in connection with it acting as qualified independent underwriter in this offering, including liabilities under the Securities Act. In accordance with Rule 5121, Merrill Lynch, Pierce, Fenner & Smith Incorporated (and its affiliates) will not sell our common stock to a discretionary account without receiving prior written approval from the account holder. See “Underwriting (Conflict of Interest)—Conflict of Interest.”
We will be subject to additional regulatory compliance requirements as a result of becoming a public company, and our management has limited experience managing a public company.
We have never operated as a public company and will incur significant legal, accounting and other expenses that we did not incur as a private company. The individuals who constitute our management team have limited experience managing a publicly-traded company, and limited experience complying with the increasingly complex and changing laws pertaining to public companies. Our management team and other personnel will need to devote a substantial amount of time to new compliance initiatives, and we may not successfully or efficiently manage our transition into a public company. We expect rules and regulations such as the Sarbanes-Oxley Act of 2002, or the Sarbanes-Oxley Act, the Dodd-Frank Act, and the rules and regulations of our stock exchange to increase our legal and finance compliance costs and to make some activities more time-consuming and costly.
The Securities Exchange Act of 1934, as amended, requires, among other things, that we file annual, quarterly and current reports with respect to our business and operating results. The Sarbanes-Oxley Act requires, among other things, that we maintain effective disclosure controls and procedures and internal control over financial reporting. We are continuing the costly process of implementing and testing our systems to report our results as a public company, to continue to manage our growth and to implement internal controls. We will be required to implement and maintain various other control and business systems related to our equity, finance, treasury, information technology, other recordkeeping systems and other operations. As a result of this implementation and maintenance, management’s attention may be diverted from other business concerns, which could adversely affect our business. Furthermore, we rely on third-party software and system providers for ensuring our reporting obligations and effective internal controls, and to the extent these third parties fail to provide adequate service including as a result of any inability to scale to handle our growth and the imposition of these increased reporting and internal controls and procedures, we could incur material costs for upgrading or switching systems and our business could be materially affected.
In addition, changing laws, regulations and standards relating to corporate governance and public disclosure are creating uncertainty for public companies, increasing legal and financial compliance costs and making some activities more time consuming. These laws, regulations and standards are subject to varying interpretations, in many cases due to their lack of specificity, and, as a result, their application in practice may evolve over time as new guidance is provided by regulatory and governing bodies. This could result in continuing uncertainty regarding compliance matters and higher costs necessitated by ongoing revisions to disclosure and governance practices. We intend to invest resources to comply with evolving laws, regulations and standards, and this investment may result in increased general and administrative expenses and a diversion of management’s time and attention from revenue-generating activities to compliance activities. If our efforts to comply with new laws, regulations and standards differ from the activities intended by regulatory or governing bodies due to ambiguities related to their application and practice, regulatory authorities may initiate legal proceedings against us and our business may be adversely affected.
-41-
Table of Contents
We expect these laws, rules and regulations to also make it more difficult and more expensive for us to obtain director and officer liability insurance, and we may be required to incur substantial costs to maintain appropriate levels of coverage. These factors could also make it more difficult for us to attract and retain qualified members of our board of directors, particularly to serve on our audit committee, and qualified executive officers.
As a result of disclosure of information in this prospectus and in filings required of a public company, our business and financial condition will become more visible, which we believe may result in threatened or actual litigation, including by competitors and other third parties. If such claims are successful, our business and operating results could be adversely affected, and even if the claims do not result in litigation or are resolved in our favor, these claims, and the time and resources necessary to resolve them, could divert the time and resources of our management and adversely affect our business and operating results.
We are an emerging growth company, and we cannot be certain if the reduced disclosure requirements applicable to emerging growth companies will make our common stock less attractive to investors.
We are an emerging growth company, as defined in the JOBS Act, and may take advantage of certain exemptions from various reporting requirements that are applicable to other public companies that are not emerging growth companies, including, but not limited to, not being required to comply with auditor attestation requirements of Section 404 of the Sarbanes-Oxley Act, reduced financial disclosure obligations, reduced disclosure obligations regarding executive compensation in our periodic reports and proxy statements, and exemptions from the requirements of holding a nonbinding advisory vote on executive compensation and any golden parachute payments not previously approved. For as long as we continue to be an emerging growth company, we intend to take advantage of certain of these exemptions. We cannot predict if investors will find our common stock less attractive because we will rely on these exemptions. If some investors find our common stock less attractive as a result, there may be a less active trading market for our common stock and our stock price may be more volatile.
In addition, Section 107 of the JOBS Act also provides that an emerging growth company can take advantage of an extended transition period for complying with new or revised accounting standards. However, we chose to “opt out” of such extended transition period, and as a result, we will comply with new or revised accounting standards on the relevant dates that adoption of such standards is required for non-emerging growth companies. Our decision to opt out of the extended transition period for complying with new or revised accounting standards is irrevocable.
We will remain an emerging growth company until the earliest of (i) the date on which we qualify as a “large accelerated filer” with at least $700 million of our equity securities held by non-affiliates as of June 30 of that fiscal year, (ii) the end of the fiscal year in which we have total annual gross revenue of $1 billion or more during such fiscal year, (iii) the date on which we have issued more than $1 billion in non-convertible debt in a three-year period, or (iv) the last day of the fiscal year following the fifth anniversary of the date of this prospectus.
Our ability to raise capital in the future may be limited, and our failure to raise capital when needed could prevent us from executing our growth strategy.
In the absence of this offering, we believe that our existing cash and cash equivalents will be sufficient to fund our planned capital expenditures and other anticipated cash needs for at least the next 12 months. If our capital resources are insufficient to satisfy our liquidity requirements, we may seek to sell additional equity or debt securities or obtain debt financing. We have not made arrangements to obtain additional financing and there is no assurance that financing, if required, will be available in amounts or on terms acceptable to us, if at all.
-42-
Table of Contents
Our share price may be volatile and you may be unable to sell your shares at or above the offering price.
Prior to this offering, there has not been a public market for our common stock. An active trading market for our common stock might never develop or be sustained, which could depress the market price of our common stock and affect your ability to sell our shares. The initial public offering price for our shares was determined by negotiations between us and the representatives of the underwriters and may not be indicative of prices that will prevail in the trading market. The market price of shares of our common stock could be subject to wide fluctuations in response to many risk factors listed in this section, many of which are beyond our control, including:
| • | actual or anticipated fluctuations in our financial condition and operating results; |
| • | changes in the economic performance or market valuations of other companies engaged in providing portfolio management services, investment advice and retirement help; |
| • | loss of a significant amount of existing business; |
| • | actual or anticipated changes in our growth rate relative to our competitors; |
| • | actual or anticipated fluctuations in our competitors’ operating results or changes in their growth rates; |
| • | issuance of new or updated research or reports by securities analysts; |
| • | our announcement of actual results for a fiscal period that are higher or lower than projected results or our announcement of revenue or earnings guidance that is higher or lower than expected; |
| • | regulatory developments in our target markets affecting us, our customers or our competitors; |
| • | fluctuations in the valuation of companies perceived by investors to be comparable to us; |
| • | share price and volume fluctuations attributable to inconsistent trading volume levels of our shares; |
| • | sales or expected sales of additional common stock; |
| • | terrorist attacks or natural disasters or other such events impacting countries where we or our customers have operations; and |
| • | general economic and market conditions. |
Furthermore, the stock markets have experienced extreme price and volume fluctuations that have affected and continue to affect the market prices of equity securities of many companies. These fluctuations often have been unrelated or disproportionate to the operating performance of those companies. These broad market and industry fluctuations, as well as general economic, political and market conditions such as recessions, interest rate changes or international currency fluctuations, may cause the market price of shares of our common stock to decline. If the market price of shares of our common stock after this offering does not exceed the initial public offering price, you may not realize any return on your investment in us and may lose some or all of your investment. In the past, companies that have experienced volatility in the market price of their stock have been subject to securities class action litigation. We may be the target of this type of litigation in the future. Securities litigation against us could result in substantial costs and divert our management’s attention from other business concerns, which could seriously harm our business.
-43-
Table of Contents
If securities or industry analysts do not publish research or reports about our business, or if they change their recommendations regarding our stock adversely, our stock price and trading volume could decline.
The trading market for our common stock will be influenced by the research and reports that industry or securities analysts publish about us or our business. If one or more of the analysts who cover us downgrade our stock, our stock price would likely decline. If one or more of these analysts cease coverage of our company or fail to regularly publish reports on us, we could lose visibility in the financial markets, which in turn could cause our stock price or trading volume to decline.
Our insiders who are significant stockholders may control the election of our board and may have interests that conflict with those of other stockholders.
A majority of our directors are affiliated with management or our principal stockholders. In addition, our directors and executive officers, together with members of their immediate families, and holders of more than five percent of our outstanding shares of common stock (on an as-converted basis) beneficially owned, in the aggregate, approximately 87% of our outstanding capital stock as of June 30, 2014. As a result, acting together, this group has the ability to exercise significant control over most matters requiring our stockholders’ approval, including the election and removal of directors and significant corporate transactions. The interests of this group may differ from those of other stockholders and they may vote their shares in a way that is contrary to the way other stockholders vote their shares.
Substantial future sales of our common stock in the public market could cause our stock price to fall.
Additional sales of our common stock in the public market after this offering, or the perception that these sales could occur, could cause the market price of our common stock to decline. Upon completion of this offering, we will have shares of common stock outstanding. All shares sold in this offering will be freely tradeable immediately after this offering (except for shares purchased by affiliates) and the remaining 220,702,831 shares of common stock outstanding immediately after this offering may be sold after expiration of lock-up agreements 180 days after the date of this offering (subject in some cases to volume limitations). In addition, as of June 30, 2014, there were outstanding options, RSUs and warrants to purchase 59,300,261 shares of our common stock that, if exercised, will result in these additional shares becoming available for sale upon expiration of the lock-up agreements. A large portion of these shares and options are held by a small number of persons and investment funds. Sales by these stockholders or option holders of a substantial number of shares after this offering could significantly reduce the market price of our common stock. Moreover, after this offering, some holders of shares of common stock will have rights, subject to some conditions, to require us to file registration statements covering the shares they currently hold, or to include these shares in registration statements that we might file for ourselves or other stockholders.
We intend to file a registration statement under the Securities Act of 1933, as amended, covering shares of common stock reserved for issuance under our stock plans. This registration statement is expected to be filed soon after the date of this prospectus and will automatically become effective upon filing. Accordingly, shares registered under this registration statement will be available for sale in the open market, subject to vesting restrictions with us that may apply to certain shares or the lock-up agreements referred to above. If a large number of these shares are sold in the public market, the sales could reduce the trading price of our common stock. See “Shares Eligible for Future Sale” for a more detailed description of sales that may occur in the future.
-44-
Table of Contents
As a new investor, you will experience immediate and substantial dilution.
Purchasers in this offering will immediately experience substantial dilution in net tangible book value. Because our common stock has been sold in the past at prices substantially lower than the initial public offering price that you will pay, you will suffer immediate dilution of $ per share in net tangible book value, based on the initial offering price of $ per share of common stock. The exercise of outstanding options may result in further dilution. See “Dilution” for a more detailed description of the dilution that will be caused by this offering.
In addition, we may raise additional capital through public or private equity or debt offerings, subject to market conditions. To the extent that additional capital is raised through the sale of equity or convertible debt securities, the issuance could result in further dilution to our stockholders.
Management may apply our net proceeds from this offering to uses that do not increase our market value or improve our operating results.
We intend to use our net proceeds from this offering for general corporate purposes, including as yet undetermined amounts related to working capital and capital expenditures. Our management will have considerable discretion in applying our net proceeds, and you will not have the opportunity, as part of your investment decision, to assess whether we are using our net proceeds appropriately. Until the net proceeds we receive are used, they may be placed in investments that do not produce income or that lose value. We may use our net proceeds for purposes that do not result in any increase in our operating results, which could cause the price of our common stock to decline.
We do not currently intend to pay dividends on our common stock, and consequently, your ability to achieve a return on your investment will depend on appreciation in the price of our common stock.
We have never declared or paid any cash dividends on our common stock and do not currently intend to do so for the foreseeable future. We currently intend to invest our future earnings, if any, to fund our growth. In addition, the provisions of our credit facility prohibit us from paying cash dividends. Therefore, you are not likely to receive any dividends on your common stock for the foreseeable future, and the success of an investment in shares of our common stock will depend upon any future appreciation in their value. There is no guarantee that shares of our common stock will appreciate in value or even maintain the price at which our stockholders have purchased their shares.
Delaware law and our corporate charter and bylaws will contain anti-takeover provisions that could delay or discourage takeover attempts that stockholders may consider favorable.
Provisions in our certificate of incorporation and bylaws that we intend to adopt before the completion of this offering may have the effect of delaying or preventing a change of control or changes in our management. These provisions include the following:
| • | the right of the board of directors to elect a director to fill a vacancy created by the expansion of the board of directors; |
| • | the classification of our board of directors so that only a portion of our directors are elected each year, with each director serving a three-year term; |
| • | the requirement for advance notice for nominations for election to the board of directors or for proposing matters that can be acted upon at a stockholders’ meeting; |
| • | the ability of the board of directors to alter our bylaws without obtaining stockholder approval; |
| • | the ability of the board of directors to issue, without stockholder approval, up to shares of preferred stock with rights set by the board of directors, which rights could be senior to those of common stock; |
-45-
Table of Contents
| • | the required approval of holders of at least two-thirds of the outstanding shares of common stock to amend specified provisions of our bylaws and certificate of incorporation; and |
| • | the elimination of the right of stockholders to call a special meeting of stockholders and to take action by written consent. |
In addition, we are governed by the provisions of Section 203 of the Delaware General Corporation Law. These provisions may prohibit or restrict large stockholders, in particular, those owning 15% or more of our outstanding voting stock, from merging or combining with us. These provisions in our certificate of incorporation and bylaws and under Delaware law could discourage potential takeover attempts and could reduce the price that investors might be willing to pay for shares of our common stock in the future and result in our market price being lower than it would without these provisions.
-46-
Table of Contents
SPECIAL NOTE REGARDING FORWARD-LOOKING STATEMENTS
This prospectus contains forward-looking statements within the meaning of the federal securities laws, which statements involve substantial risks and uncertainties. Forward-looking statements generally relate to future events or our future financial or operating performance. In some cases, you can identify forward-looking statements because they contain words such as “may,” “will,” “should,” “expects,” “plans,” “anticipates,” “could,” “intends,” “target,” “projects,” “contemplates,” “believes,” “estimates,” “predicts,” “potential” or “continue” or the negative of these words or other similar terms or expressions that concern our expectations, strategy, plans or intentions. Forward-looking statements contained in this prospectus include, but are not limited to, statements about:
| • | our ability to expand our relationships with existing customers, grow the number of customers and derive revenue from new offerings such as our data analytics and market research services and premium FinApps; |
| • | our financial performance; |
| • | the advantages of our solutions as compared to those of others; |
| • | our ability to establish and maintain intellectual property rights; and |
| • | our ability to retain and hire necessary employees and appropriately staff our operations, in particular our India operations. |
We caution you that the foregoing list may not contain all of the forward-looking statements made in this prospectus.
You should not rely upon forward-looking statements as predictions of future events. We have based the forward-looking statements contained in this prospectus primarily on our current expectations and projections about future events and trends that we believe may affect our business, financial condition, results of operations and prospects. The outcome of the events described in these forward-looking statements is subject to risks, uncertainties and other factors described in the section titled “Risk Factors” and elsewhere in this prospectus. Moreover, we operate in a very competitive and rapidly changing environment. New risks and uncertainties emerge from time to time and it is not possible for us to predict all risks and uncertainties that could have an impact on the forward-looking statements contained in this prospectus. We cannot assure you that the results, events and circumstances reflected in the forward-looking statements will be achieved or occur, and actual results, events or circumstances could differ materially from those described in the forward-looking statements.
The forward-looking statements made in this prospectus relate only to events as of the date on which the statements are made. We undertake no obligation to update any forward-looking statements made in this prospectus to reflect events or circumstances after the date of this prospectus or to reflect new information or the occurrence of unanticipated events, except as required by law. We may not actually achieve the plans, intentions or expectations disclosed in our forward-looking statements and you should not place undue reliance on our forward-looking statements. Our forward-looking statements do not reflect the potential impact of any future acquisitions, mergers, dispositions, joint ventures or investments we may make.
-47-
Table of Contents
Unless otherwise indicated, information contained in this prospectus concerning our industry and the markets in which we operate, market opportunity and market size, is based on information from various sources, including reports and data from Bankscope by Bureau van Dijk, The Boston Consulting Group, CEB TowerGroup, Celent, Gartner, Inc. and International Data Corporation, on assumptions we have made based on such data and other similar sources and on our knowledge of the markets for our solutions. While we are not aware of any misstatements regarding any third-party information presented in this prospectus, estimates of third parties, particularly as they relate to projections, involve numerous assumptions, are subject to risks and uncertainties, and are subject to change based on various factors, including those described in the section titled “Risk Factors” and elsewhere in this prospectus. These and other factors could cause results to differ materially from those expressed in the estimates made by the third parties and by us.
Certain information in the text of the prospectus is contained in independent industry publications. The source of, and selected additional information contained in, these independent industry publications are provided below:
| (1) | The Boston Consulting Group, BCG, Distribution 2020, The Next Big Journey for Retail Banks, March 2013, by Andy Maguire, Jean-Werner de T’Serclaes, Stefano Bison and Nicole Monter. |
| (2) | IDC Digital Universe Study, sponsored by EMC, December 2012. |
| (3) | IDC iView, Extracting Value from Chaos, June 2011, by John Gantz and David Reinsel (IDC 1142). |
| (4) | IDC iView, The Digital Universe in 2020: Big Data, Bigger Digital Shadows, and Biggest Growth in the Far East, December 2012, by John Gantz and David Reinsel (IDC 1414 v_3). |
| (5) | Gartner, Forecast: Enterprise IT Spending by Vertical Industry Market, Worldwide, 2011-2017, 4Q13 Update, January 30, 2014, by Vittorio D’Orazio et al. |
The Gartner Report described herein (the “Gartner Report”) represents data, research opinion or viewpoints published, as part of a syndicated subscription service, by Gartner, Inc. (“Gartner”), and are not representations of fact. The Gartner Report speaks as of its original publication date (and not as of the date of this prospectus) and the opinions expressed in the Gartner Report are subject to change without notice.
-48-
Table of Contents
We estimate that the net proceeds to us from the sale of shares of our common stock in this offering will be approximately $ , based upon the assumed initial public offering price of $ per share, which is the midpoint of the estimated offering price range set forth on the cover page of this prospectus, and after deducting estimated underwriting discounts and commissions and estimated offering expenses payable by us. If the underwriters’ option to purchase additional shares of our common stock from us is exercised in full, we estimate that the net proceeds to us would be approximately $ , after deducting estimated underwriting discounts and commissions and estimated offering expenses payable by us.
Each $1.00 increase or decrease in the assumed initial public offering price of $ per share, which is the midpoint of the estimated offering price range set forth on the cover page of this prospectus, would increase or decrease, as applicable, the net proceeds to us from the sale of shares of our common stock in this offering by $ , assuming that the number of shares offered by us, as set forth on the cover page of this prospectus, remains the same and after deducting estimated underwriting discounts and commissions payable by us. Similarly, each increase or decrease of shares in the number of shares offered by us would increase or decrease, as applicable, the net proceeds to us from the sale of shares of our common stock in this offering by approximately $ per share, assuming the assumed initial public offering price remains the same, and after deducting underwriting discounts and commissions payable by us.
The principal purposes of this offering are to obtain additional capital and increase our capitalization and financial flexibility, create a public market for our stock, and increase our visibility in our marketplace. We currently intend to use the net proceeds we receive from this offering primarily for general corporate purposes, including working capital, research and development activities, sales and marketing activities, general and administrative matters and capital expenditures, to fund our growth plans, and to pay the entire outstanding balance under our credit facility, although we do not otherwise currently have any specific or preliminary plans with respect to the use of proceeds for such purposes. As of June 30, 2014, $9.1 million was outstanding under our credit facility with a weighted average interest rate of 4.78% per annum. For an additional discussion of our credit facility, see “Management’s Discussion and Analysis of Financial Condition and Results of Operations—Liquidity and Capital Resources—Bank Borrowings.” With respect to capital expenditures, we expect to continue to make investments in our data center and other infrastructure. We may also, in our discretion, use a portion of the net proceeds for the acquisition of, or investment in, businesses, products, services, or technologies that complement our business, although we have no current commitments or agreements to enter into any acquisitions or investments.
We will have broad discretion over the uses of the net proceeds of this offering. Pending the use of proceeds from this offering as described above, we plan to invest the net proceeds that we receive in this offering in short-term and long-term interest-bearing obligations, including government and investment-grade debt securities and money market funds.
-49-
Table of Contents
We have never declared or paid any cash dividends on our capital stock. We currently intend to retain any future earnings to fund business development and growth, and we do not expect to pay any dividends in the foreseeable future. Any future determination to declare cash dividends will be made at the discretion of our board of directors, subject to applicable laws, and will depend on a number of factors, including our financial condition, results of operations, capital requirements, contractual restrictions, general business conditions and other factors that our board of directors may deem relevant. Currently, the provisions of our credit facility prohibit us from paying dividends.
-50-
Table of Contents
The following table sets forth our cash and cash equivalents, as well as our capitalization, as of June 30, 2014:
| • | on an actual basis; |
| • | on a pro forma basis, giving effect to (i) the automatic conversion of all outstanding shares of our convertible preferred stock into an aggregate of 144,452,172 shares of our common stock, which conversion will occur immediately prior to the completion of this offering, as if such conversion had occurred on June 30, 2014; (ii) the filing and effectiveness of our amended and restated certificate of incorporation upon completion of this offering, that, among other things, will increase our authorized number of shares of common stock and will authorize a new class of preferred stock; (iii) the reclassification of preferred stock warrant liabilities to additional paid-in capital effective upon the closing of this offering; and (iv) the recording of $2.5 million of stock-based compensation expense as an increase in both additional paid-in capital and accumulated deficit associated with restricted stock units, which we expect to record upon the closing of this offering; and |
| • | on a pro forma as adjusted basis, giving effect to the pro forma adjustments set forth above and the sale by us of shares of our common stock in this offering, based upon the assumed initial public offering price of $ per share, which is the midpoint of the estimated offering price range set forth on the cover page of this prospectus, after deducting estimated underwriting discounts and commissions and estimated offering expenses payable by us and the repayment of the outstanding balance of $9.1 million as of June 30, 2014 under our credit facility upon receipt of proceeds from this offering as described in “Use of Proceeds”. |
You should read this table together with our consolidated financial statements and related notes, and the sections titled “Selected Consolidated Financial Data” and “Management’s Discussion and Analysis of Financial Condition and Results of Operations” that are included elsewhere in this prospectus.
| As of June 30, 2014 | ||||||||||||
| Actual | Pro Forma | Pro Forma As Adjusted(1) |
||||||||||
| (in thousands, except share and per share data) | ||||||||||||
| Cash and cash equivalents |
$ | 6,263 | $ | 6,263 | $ | |||||||
|
|
|
|
|
|
|
|||||||
| Total bank borrowings and capital lease obligations |
$ | 11,770 | $ | 11,770 | $ | |||||||
| Convertible preferred stock warrant liabilities |
908 | — | ||||||||||
| Convertible preferred stock, par value $0.001 per share: 146,657,824 shares authorized, 144,452,172 shares issued and outstanding, actual; no shares authorized, issued and outstanding, pro forma and pro forma as adjusted |
102,224 | — | ||||||||||
| Stockholders’ equity (deficit): |
||||||||||||
| Preferred stock, par value $0.001 per share: no shares authorized, issued and outstanding, actual; shares authorized, no shares issued and outstanding, pro forma and pro forma as adjusted |
— | — | ||||||||||
| Common stock, par value $0.001 per share: 300,000,000 shares authorized, 76,250,659 shares issued and outstanding, actual; shares authorized, 220,702,831 shares issued and outstanding, pro forma; and shares authorized, shares issued and outstanding, pro forma as adjusted |
76 | 220 | ||||||||||
| Additional paid-in capital |
255,153 | 360,600 | ||||||||||
| Accumulated other comprehensive loss |
(1,177 | ) | (1,177 | ) | ||||||||
| Accumulated deficit |
(351,222 | ) | (353,681 | ) | ||||||||
|
|
|
|
|
|
|
|||||||
| Total stockholders’ equity (deficit) |
(97,170 | ) | 5,962 | |||||||||
|
|
|
|
|
|
|
|||||||
| Total capitalization |
$ | 17,732 | $ | 17,732 | $ | |||||||
|
|
|
|
|
|
|
|||||||
-51-
Table of Contents
| (1) | Each $1.00 increase or decrease in the assumed initial public offering price of our common stock of $ per share, which is the midpoint of the estimated offering price range set forth on the cover page of this prospectus, would increase or decrease, as applicable, the amount of our pro forma as adjusted cash and cash equivalents, additional paid-in capital and total stockholders’ equity by approximately $ , assuming that the number of shares offered by us, as set forth on the cover page of this prospectus, remains the same and after deducting estimated underwriting discounts and commissions payable by us. An increase or decrease of shares in the number of shares offered by us would increase or decrease, as applicable, the amount of our pro forma as adjusted cash and cash equivalents, additional paid-in capital and total stockholders’ equity by approximately $ , assuming that the initial public offering price of $ per share, which is the midpoint of the estimated offering price range set forth on the cover page of this prospectus, remains the same and after deducting estimated underwriting discounts and commissions payable by us. |
If the underwriters’ option to purchase additional shares of our common stock from us were exercised in full, pro forma as adjusted cash and cash equivalents, additional paid-in capital, total stockholders’ equity and shares outstanding as of June 30, 2014 would be $ , $ , $ and shares, respectively.
The pro forma and pro forma as adjusted columns in the table above are based on 220,702,831 shares of our common stock (including convertible preferred stock on an as-converted basis) outstanding as of June 30, 2014, and exclude the following:
| • | 51,971,275 shares of our common stock issuable upon the exercise of options to purchase shares of our common stock outstanding as of June 30, 2014, with a weighted-average exercise price of $0.67 per share; |
| • | 6,194,372 shares of our common stock subject to RSUs, outstanding as of June 30, 2014; |
| • | 1,134,614 shares of our common stock, on an as-converted basis, issuable upon the exercise of warrants to purchase shares of our convertible preferred stock outstanding as of June 30, 2014, with an exercise price of $0.65 per share; and |
| • | shares of our common stock reserved for future issuance under our stock-based compensation plans, consisting of (i) 16,793,052 shares of common stock reserved for future awards under our 2009 Plan, as of June 30, 2014 (which will terminate as of the completion of this offering and no awards will be granted under our 2009 Plan thereafter) and (ii) shares of common stock reserved for issuance under our 2014 ESPP, which will become effective on the date of this prospectus. Any shares that, as of the effective date of the registration statement of which this prospectus is a part, have been reserved but not issued pursuant to awards granted under our 2009 Plan and are not subject to any awards granted under our 2009 Plan, plus any shares covering awards granted under our 2009 Plan that, on or after the effective date of the registration statement of which this prospectus is a part, expire or terminate without having been exercised in full or are forfeited to or repurchased by us, will become available for issuance under our 2014 Plan, with the maximum number of shares to be added to our 2014 Plan, from our 2009 Plan equal to shares. Our 2014 Plan and our 2014 ESPP also provide for automatic annual increases in the number of shares reserved under the plans, as more fully described in “Executive Compensation—Employee Benefit and Stock Plans.” |
-52-
Table of Contents
If you invest in our common stock in this offering, your ownership interest will be diluted to the extent of the difference between the initial public offering price per share of our common stock and the pro forma as adjusted net tangible book value per share of our common stock immediately after this offering. Net tangible book value dilution per share to new investors represents the difference between the amount per share paid by purchasers of shares of our common stock in this offering and the pro forma as adjusted net tangible book value per share of our common stock immediately after completion of this offering.
Pro forma net tangible book value per share is determined by dividing our total tangible assets less our total liabilities by the number of shares of our common stock outstanding. Our pro forma net tangible book value as of June 30, 2014 was $229,000, or $0.00 per share, based on the total number of shares of our common stock outstanding as of June 30, 2014, after giving effect to the automatic conversion of all outstanding shares of our convertible preferred stock as of June 30, 2014 into an aggregate of 144,452,172 shares of our common stock, which conversion will occur immediately prior to the completion of this offering, and assuming the reclassification of preferred stock warrant liabilities to additional paid-in capital effective upon the closing of this offering.
After giving effect to the sale by us of shares of our common stock in this offering at the assumed initial public offering price of $ per share, which is the midpoint of the estimated offering price range set forth on the cover page of this prospectus, and after deducting estimated underwriting discounts and commissions and estimated offering expenses payable by us, our pro forma as adjusted net tangible book value as of June 30, 2014 would have been $ million, or $ per share. This represents an immediate increase in pro forma net tangible book value of $ per share to our existing stockholders and an immediate dilution in pro forma net tangible book value of $ per share to investors purchasing shares of our common stock in this offering at the assumed initial public offering price. The following table illustrates this dilution:
| Assumed initial public offering price per share |
$ | |||||||
| Pro forma net tangible book value per share as of June 30, 2014 |
$ | 0.00 | ||||||
| Increase in pro forma net tangible book value per share attributable to new investors in this offering |
||||||||
|
|
|
|||||||
| Pro forma as adjusted net tangible book value per share immediately after this offering |
||||||||
|
|
|
|||||||
| Dilution in pro forma net tangible book value per share to new investors in this offering |
$ | |||||||
|
|
|
Each $1.00 increase or decrease in the assumed initial public offering price of $ per share, which is the midpoint of the estimated offering price range set forth on the cover page of this prospectus, would increase or decrease, as applicable, our pro forma as adjusted net tangible book value per share immediately after this offering by $ , and would increase or decrease, as applicable, dilution per share to new investors in this offering by $ , assuming that the number of shares offered by us, as set forth on the cover page of this prospectus, remains the same and after deducting estimated underwriting discounts and commissions payable by us. Similarly, each increase or decrease of shares in the number of shares offered by us would increase or decrease, as applicable, our pro forma as adjusted net tangible book value by approximately $ per share and increase or decrease, as applicable, the dilution to new investors by $ per share, assuming the assumed initial public offering price remains the same, and after deducting underwriting discounts and commissions payable by us.
-53-
Table of Contents
If the underwriters’ option to purchase additional shares of our common stock from us is exercised in full, the pro forma as adjusted net tangible book value per share of our common stock, as adjusted to give effect to this offering, would be $ per share, and the dilution in pro forma net tangible book value per share to new investors in this offering would be $ per share.
The following table presents, as of June 30, 2014, after giving effect to the automatic conversion of all outstanding shares of our convertible preferred stock into shares of our common stock immediately prior to the completion of this offering, the differences between the existing stockholders and the new investors purchasing shares of our common stock in this offering with respect to the number of shares purchased from us, the total consideration paid or to be paid to us, which includes net proceeds received from the issuance of shares of our common stock and convertible preferred stock, cash received from the exercise of stock options and the average price per share paid or to be paid to us at the assumed initial public offering price of $ per share, which is the midpoint of the estimated offering price range set forth on the cover page of this prospectus, before deducting estimated underwriting discounts and commissions and estimated offering expenses payable by us:
| Shares Purchased | Total Consideration | Average Price Per Share |
||||||||||||||||||
| Number | Percent | Amount | Percent | |||||||||||||||||
| Existing stockholders |
220,702,831 | % | $ | % | $ | |||||||||||||||
| New investors |
||||||||||||||||||||
|
|
|
|
|
|
|
|
|
|||||||||||||
| Totals |
100 | % | $ | 100 | % | |||||||||||||||
|
|
|
|
|
|
|
|
|
|||||||||||||
Each $1.00 increase or decrease in the assumed initial public offering price of $ per share, which is the midpoint of the estimated offering price range set forth on the cover page of this prospectus, would increase or decrease, as applicable, the total consideration paid by new investors and total consideration paid by all stockholders by approximately $ , assuming that the number of shares offered by us, as set forth on the cover page of this prospectus, remains the same and after deducting estimated underwriting discounts and commissions and estimated offering expenses payable by us.
Except as otherwise indicated, the above discussion and tables assume no exercise of the underwriters’ option to purchase additional shares of our common stock from us. If the underwriters’ option to purchase additional shares of our common stock were exercised in full, our existing stockholders would own % and our new investors would own % of the total number of shares of our common stock outstanding upon the completion of this offering.
The number of shares of our common stock that will be outstanding after this offering is based on shares of our common stock (including preferred stock on an as-converted basis) outstanding as of June 30, 2014, and excludes:
| • | 51,971,275 shares of our common stock issuable upon the exercise of options to purchase shares of our common stock outstanding as of June 30, 2014, with a weighted-average exercise price of $0.67 per share; |
| • | 6,194,372 shares of our common stock subject to RSUs, outstanding as of June 30, 2014; |
| • | 1,134,614 shares of our common stock, on an as-converted basis, issuable upon the exercise of warrants to purchase shares of our convertible preferred stock outstanding as of June 30, 2014, with an exercise price of $0.65 per share; and |
| • | shares of our common stock reserved for future issuance under our stock-based compensation plans, consisting of (i) 16,793,052 shares of common stock reserved for future awards under our 2009 Plan, as of June 30, 2014 (which will terminate as of the completion of |
-54-
Table of Contents
| this offering and no awards will be granted under our 2009 Plan thereafter) and (ii) shares of common stock reserved for issuance under our 2014 ESPP, which will become effective on the date of this prospectus. Any shares that, as of the effective date of the registration statement of which this prospectus is a part, have been reserved but not issued pursuant to awards granted under our 2009 Plan and are not subject to any awards granted under our 2009 Plan, plus any shares covering awards granted under our 2009 Plan that, on or after the effective date of the registration statement of which this prospectus is a part, expire or terminate without having been exercised in full or are forfeited to or repurchased by us, will become available for issuance under our 2014 Plan, with the maximum number of shares to be added to our 2014 Plan, from our 2009 Plan equal to shares. Our 2014 Plan and our 2014 ESPP also provide for automatic annual increases in the number of shares reserved under the plans, as more fully described in “Executive Compensation—Employee Benefit and Stock Plans.” |
To the extent that any outstanding options to purchase our common stock or the warrant to purchase convertible preferred stock are exercised, RSUs are settled or new awards are granted under our equity compensation plans, there will be further dilution to investors participating in this offering.
-55-
Table of Contents
SELECTED CONSOLIDATED FINANCIAL DATA
The following selected consolidated financial data should be read in conjunction with “Management’s Discussion and Analysis of Financial Condition and Results of Operations” and our audited consolidated financial statements and related notes included elsewhere in this prospectus.
Our consolidated statements of operations data for the years ended December 31, 2011, 2012, and 2013 and our consolidated balance sheet data as of December 31, 2012 and 2013 are derived from our audited consolidated financial statements included elsewhere in this prospectus. Our consolidated statements of operations data for the years ended December 31, 2009 and 2010, and our consolidated balance sheet data as of December 31, 2009, 2010 and 2011 are derived from our audited consolidated financial statements not included in this prospectus. We have derived the consolidated statements of operations data for the six months ended June 30, 2013 and 2014 and the consolidated balance sheet data as of June 30, 2014 from our unaudited interim consolidated financial statements included elsewhere in this prospectus. Our unaudited consolidated financial statements have been prepared on the same basis as our audited consolidated financial statements and, in the opinion of management, reflect all adjustments, which consist only of normal recurring adjustments, necessary for the fair statement of those unaudited consolidated financial statements. Our historical results are not necessarily indicative of the results that may be expected in the future.
| Year Ended December 31, | Six Months Ended June 30, |
|||||||||||||||||||||||||||
| 2009 | 2010 | 2011 | 2012 | 2013 | 2013 | 2014 | ||||||||||||||||||||||
| (in thousands, except per share data) | ||||||||||||||||||||||||||||
| Consolidated Statements of Operations Data: |
||||||||||||||||||||||||||||
| Revenue: |
||||||||||||||||||||||||||||
| Subscription and support |
$ | 24,340 | $ | 30,746 | $ | 37,029 | $ | 44,336 | $ | 56,838 | $ | 26,120 | $ | 34,903 | ||||||||||||||
| Professional services and other |
8,534 | 15,593 | 17,400 | 13,458 | 13,322 | 5,736 | 6,163 | |||||||||||||||||||||
|
|
|
|
|
|
|
|
|
|
|
|
|
|
|
|||||||||||||||
| Total revenue |
32,874 | 46,339 | 54,429 | 57,794 | 70,160 | 31,856 | 41,066 | |||||||||||||||||||||
| Cost of revenue: |
||||||||||||||||||||||||||||
| Subscription and support(1) |
13,220 | 16,022 | 17,325 | 17,177 | 19,139 | 9,206 | 11,399 | |||||||||||||||||||||
| Professional services and other(1) |
5,581 | 8,006 | 9,537 | 7,594 | 7,693 | 3,845 | 4,392 | |||||||||||||||||||||
|
|
|
|
|
|
|
|
|
|
|
|
|
|
|
|||||||||||||||
| Total cost of revenue |
18,801 | 24,028 | 26,862 | 24,771 | 26,832 | 13,051 | 15,791 | |||||||||||||||||||||
|
|
|
|
|
|
|
|
|
|
|
|
|
|
|
|||||||||||||||
| Gross profit |
14,073 | 22,311 | 27,567 | 33,023 | 43,328 | 18,805 | 25,275 | |||||||||||||||||||||
| Operating expenses: |
||||||||||||||||||||||||||||
| Research and development(1) |
10,810 | 14,742 | 16,768 | 16,193 | 17,948 | 9,409 | 10,260 | |||||||||||||||||||||
| Sales and marketing(1) |
8,096 | 9,885 | 12,911 | 13,638 | 15,418 | 7,401 | 9,690 | |||||||||||||||||||||
| General and administrative(1) |
5,446 | 8,382 | 9,793 | 8,852 | 9,386 | 4,183 | 5,519 | |||||||||||||||||||||
|
|
|
|
|
|
|
|
|
|
|
|
|
|
|
|||||||||||||||
| Total operating expenses |
24,352 | 33,009 | 39,472 | 38,683 | 42,752 | 20,993 | 25,469 | |||||||||||||||||||||
|
|
|
|
|
|
|
|
|
|
|
|
|
|
|
|||||||||||||||
| Operating income (loss) from continuing operations |
(10,279 | ) | (10,698 | ) | (11,905 | ) | (5,660 | ) | 576 | (2,188 | ) | (194 | ) | |||||||||||||||
| Other income (expense), net |
(403 | ) | (342 | ) | (917 | ) | 230 | (318 | ) | 40 | 87 | |||||||||||||||||
|
|
|
|
|
|
|
|
|
|
|
|
|
|
|
|||||||||||||||
| Income (loss) from continuing operations before provision for (benefit from) income taxes |
(10,682 | ) | (11,040 | ) | (12,822 | ) | (5,430 | ) | 258 | (2,148 | ) | (107 | ) | |||||||||||||||
| Provision for (benefit from) income taxes |
(170 | ) | (4,848 | ) | (3,736 | ) | 1,091 | 1,439 | 484 | 842 | ||||||||||||||||||
|
|
|
|
|
|
|
|
|
|
|
|
|
|
|
|||||||||||||||
| Net loss from continuing operations |
(10,512 | ) | (6,192 | ) | (9,086 | ) | (6,521 | ) | (1,181 | ) | (2,632 | ) | (949 | ) | ||||||||||||||
| Income from discontinued operations |
896 | 8,260 | 6,999 | — | — | — | — | |||||||||||||||||||||
|
|
|
|
|
|
|
|
|
|
|
|
|
|
|
|||||||||||||||
| Net income (loss) |
$ | (9,616 | ) | $ | 2,068 | $ | (2,087 | ) | $ | (6,521 | ) | $ | (1,181 | ) | $ | (2,632 | ) | $ | (949 | ) | ||||||||
|
|
|
|
|
|
|
|
|
|
|
|
|
|
|
|||||||||||||||
-56-
Table of Contents
| Year Ended December 31, | Six Months Ended June 30, |
|||||||||||||||||||||||||||
| 2009 | 2010 | 2011 | 2012 | 2013 | 2013 | 2014 | ||||||||||||||||||||||
| (in thousands, except per share data) | ||||||||||||||||||||||||||||
| Basic and diluted net income (loss) per share attributable to common stockholders(2): |
||||||||||||||||||||||||||||
| Net loss from continuing operations |
$ | (0.19 | ) | $ | (0.11 | ) | $ | (0.15 | ) | $ | (0.10 | ) | $ | (0.02 | ) | $ | (0.04 | ) | $ | (0.01 | ) | |||||||
| Income from discontinued operations |
0.02 | 0.15 | 0.11 | — | — | — | — | |||||||||||||||||||||
|
|
|
|
|
|
|
|
|
|
|
|
|
|
|
|||||||||||||||
| Net income (loss) |
$ | (0.17 | ) | $ | 0.04 | $ | (0.04 | ) | $ | (0.10 | ) | $ | (0.02 | ) | $ | (0.04 | ) | $ | (0.01 | ) | ||||||||
|
|
|
|
|
|
|
|
|
|
|
|
|
|
|
|||||||||||||||
| Weighted average shares used to compute net loss per share attributable to common stockholders—basic and diluted(2) |
54,866 | 56,571 | 58,876 | 66,489 | 72,631 | 72,173 | 75,175 | |||||||||||||||||||||
|
|
|
|
|
|
|
|
|
|
|
|
|
|
|
|||||||||||||||
| Pro forma net loss per share attributable to common stockholders—basic and diluted(2) |
$ | $ | ||||||||||||||||||||||||||
|
|
|
|
|
|||||||||||||||||||||||||
| Weighted average shares used to compute pro forma net income (loss) per share attributable to common stockholders—basic and diluted(2) |
||||||||||||||||||||||||||||
|
|
|
|
|
|||||||||||||||||||||||||
| (1) | Costs and expenses include stock-based compensation expense as follows: |
| Year Ended December 31, | Six Months Ended June 30, |
|||||||||||||||||||||||||||
| 2009 | 2010 | 2011 | 2012 | 2013 | 2013 | 2014 | ||||||||||||||||||||||
| (in thousands) | ||||||||||||||||||||||||||||
| Cost of revenue—subscription and support |
$ | 144 | $ | 194 | $ | 163 | $ | 170 | $ | 201 | $ | 106 | $ | 99 | ||||||||||||||
| Cost of revenue—professional services and other |
87 | 146 | 112 | 119 | 107 | 55 | 64 | |||||||||||||||||||||
| Research and development |
239 | 290 | 266 | 236 | 243 | 128 | 128 | |||||||||||||||||||||
| Sales and marketing |
212 | 263 | 302 | 242 | 302 | 153 | 172 | |||||||||||||||||||||
| General and administrative |
443 | 443 | 524 | 588 | 658 | 278 | 456 | |||||||||||||||||||||
|
|
|
|
|
|
|
|
|
|
|
|
|
|
|
|||||||||||||||
| Total stock-based compensation |
$ | 1,125 | $ | 1,336 | $ | 1,367 | $ | 1,355 | $ | 1,511 | $ | 720 | $ | 919 | ||||||||||||||
|
|
|
|
|
|
|
|
|
|
|
|
|
|
|
|||||||||||||||
| (2) | See Note 9 to our audited consolidated financial statements appearing elsewhere in this prospectus for an explanation of the calculations of our net loss per share attributable to common stockholders for the years ended December 31, 2011, 2012 and 2013, and the six months ended June 30, 2013 and 2014. Pro forma basic and diluted net loss per share were computed to give effect to the automatic conversion of convertible preferred stock using the if converted method and the reclassification of preferred stock warrant liabilities to additional paid in capital as though the conversion had occurred as of the beginning of the period or the original date of issuance, if later. The pro forma share amounts give effect to the Company’s RSUs that have satisfied the service condition as of December 31, 2013 and June 30, 2014. Stock-based compensation expense associated with the RSUs is excluded from this pro forma calculation. In addition, the pro forma calculation assumes the sale by us of shares of our common stock in this offering, at the assumed initial public offering price of $ per share, which is the midpoint of the estimated offering price range set forth on the cover page of this prospectus, the proceeds from which will be used to repay the outstanding balance of $9.1 million, as of June 30, 2014, under our credit facility. Interest expense associated with the credit facility of $0.5 million and $0.2 million during the year ended December 31, 2013 and the six months ended June 30, 2014, respectively, is excluded from this pro forma calculation. |
| As of December 31, | As of June 30, |
|||||||||||||||||||||||
| 2009 | 2010 | 2011 | 2012 | 2013 | 2014 | |||||||||||||||||||
| (in thousands) | ||||||||||||||||||||||||
| Consolidated Balance Sheet Data: |
||||||||||||||||||||||||
| Cash and cash equivalents |
$ | 9,545 | $ | 10,885 | $ | 8,763 | $ | 7,963 | $ | 8,134 | $ | 6,263 | ||||||||||||
| Working capital (deficit) |
(14,372 | ) | (11,789 | ) | (7,939 | ) | (1,710 | ) | 213 | (4,341 | ) | |||||||||||||
| Property and equipment, net |
4,149 | 3,753 | 3,580 | 4,335 | 6,297 | 9,058 | ||||||||||||||||||
| Total assets |
32,888 | 43,978 | 28,840 | 30,399 | 34,460 | 41,304 | ||||||||||||||||||
| Deferred revenue |
33,016 | 28,419 | 11,503 | 7,464 | 7,984 | 7,679 | ||||||||||||||||||
| Total bank borrowings and capital lease obligations |
8,308 | 5,303 | 9,195 | 7,955 | 7,763 | 11,770 | ||||||||||||||||||
| Convertible preferred stock warrant liabilities |
611 | 608 | 554 | 505 | 760 | 908 | ||||||||||||||||||
| Convertible preferred stock |
82,270 | 92,207 | 92,268 | 102,211 | 102,224 | 102,224 | ||||||||||||||||||
| Total stockholders’ deficit |
(101,506 | ) | (96,884 | ) | (97,878 | ) | (99,074 | ) | (98,079 | ) | (97,170 | ) | ||||||||||||
-57-
Table of Contents
MANAGEMENT’S DISCUSSION AND ANALYSIS OF FINANCIAL CONDITION AND
RESULTS OF OPERATIONS
You should read the following discussion and analysis of our financial condition and results of operations together with our consolidated financial statements and the related notes and other financial information included elsewhere in this prospectus. Some of the information contained in this discussion and analysis or set forth elsewhere in this prospectus, including information with respect to our plans and strategy for business, includes forward-looking statements that involve risks and uncertainties. You should review the “Risk Factors” section of this prospectus beginning on page 19 for a discussion of important factors that could cause actual results to differ materially from the results described in or implied by the forward-looking statements contained in the following discussion and analysis.
Overview
Yodlee is a leading technology and applications platform powering dynamic innovation for digital financial services in the cloud. We refer to our platform as the Yodlee Financial Cloud. Our customers include financial institutions, Internet service companies providing innovative financial solutions and third-party developers of financial applications. More than 750 organizations in over 10 countries use the Yodlee platform to power their consumer-facing digital offerings, and we receive subscription fees for 16.8 million of these consumers, whom we refer to as our paid users. Our paid users increased from 8.8 million as of December 31, 2011, to 10.7 million as of December 31, 2012, to 14.3 million as of December 31, 2013 and to 16.8 million as of June 30, 2014.
Our financial institution customers subscribe to the Yodlee platform to power offerings that improve consumer satisfaction and enhance engagement, while capturing cross-sell and up-sell opportunities. We estimate that our current network of financial institution customers alone reaches more than 100 million end users, representing a significant opportunity to grow our paid user base within existing customers. Our customers that are Internet service companies have an increasingly large and diverse base of users that also provides additional growth opportunities.
The Yodlee Financial Cloud delivers a wide variety of financial applications, or FinApps, targeted at the retail financial, wealth management, small business, card and other financial solutions sectors. These FinApps help consumers and small businesses simplify and manage their finances, review their financial accounts, track their spending, calculate their net worth, and perform a variety of other activities. Our platform also enables our customers to develop their own applications through our open application programming interfaces, or APIs, that deliver trusted and secure data, money movement solutions, and other feature functionality.
Our technology infrastructure is designed to provide a highly available and secure multi-tenant cloud-based platform across hundreds of customers and millions of end users. Our solutions use a single code base for all customers and are globally accessible across multiple digital channels. Our multi-tenancy model uses a common data model for all customers but isolates data with logical controls and separate encryption keys for each customer. Our architecture utilizes state-of-the-art technologies to achieve enhanced availability, scalability and security.
We provide subscription services on a business-to-business-to-consumer, or B2B2C, basis to financial services clients, whereby our customers offer Yodlee-based solutions to their customers, whom we refer to as end users. On a business-to-business, or B2B, basis we deliver the same platform to third-party developers.
We introduced our financial account aggregation product to the digital financial services industry in 1999. In 2006, we introduced online personal financial management tools. With the introduction of our
-58-
Table of Contents
open platform for digital financial services in 2010, we created an ecosystem that enables us, our customers and third-party developers to create new financial applications which can be made available across a broad base of end users. In 2013, we expanded our platform to offer these financial applications, to our customers, individually or in combinations. In addition, in 2012, we began to broadly market and sell end user-permissioned anonymized data analytics and market research services.
We derive revenue primarily from subscription and support fees and professional service fees. We sell subscriptions to the Yodlee platform to financial institutions, or FI, customers, and to Internet services companies providing innovative financial solutions, which we refer to as our Yodlee Interactive, or YI, customers. Subscription and support revenue includes both contractual minimum payments and usage-based fees and is driven primarily by the number of customers, including new customers as well as customers who renew their existing subscription and support contracts, and the number of paid users. Subscription and support revenue accounted for approximately 81% and 85% of our revenue during the year ended December 31, 2013, and the six months ended June 30, 2014, respectively. We also derive revenue from professional services primarily relating to the implementation and configuration of our solutions for our customers. Professional services and other revenue accounted for approximately 19% and 15% of our revenue during the year ended December 31, 2013, and the six months ended June 30, 2014, respectively. As more of our revenue is derived from our YI customers, we anticipate that professional services and other revenue will continue to decline over time as a percentage of our total revenue. For each of the years ended December 31, 2011, 2012 and 2013, and the six months ended June 30, 2014, the substantial majority of our subscription and support revenue was derived from subscriptions that provide for an initial three-year term, and a majority of subscription and support revenue was derived from committed minimums. As usage increases and customers are required to pay additional usage fees calculated on a per-paid-user basis, we expect that a more significant portion of our revenue over time may be derived from usage by paid users as compared to revenue derived from contractual minimum payments.
A substantial proportion of our revenue has been derived from a limited number of large FI customers. For example, revenue from our three largest customers for each of the years ended December 31, 2011, 2012 and 2013, and the six months ended June 30, 2014, aggregated approximately 35%, 31%, 32%, and 26% of total revenue, respectively, during those periods. Eight of our ten largest customers for the year ended December 31, 2013 have been our customers for more than six years. We anticipate that revenue from a small group of customers will continue to account for a significant proportion of our revenue in the near term. The continued growth of our business partially depends on our ability to maintain our customer relationships, renew subscriptions from our current customers and generate additional paid users and sources of revenue from existing customers. As we seek to engage additional FI and YI customers, we expect that our revenue will diversify over time. The continued growth of our business partially depends on our ability to secure new subscriptions and deployments of the Yodlee platform by new customers.
Sales to large organizations have typically been characterized by longer sales cycles, significant contract negotiations and less predictability in completing sales. Our revenue has usually been the strongest during the last two quarters of the calendar year due to the terms of existing customer contracts with certain of our largest customers and associated revenue recognition, and timing of our customers’ deployment of our solutions and associated professional services revenue.
The substantial majority of our revenue is derived from our customers in the United States. We believe the markets outside of the United States offer an opportunity for growth, and we intend to continue to pursue expansion in international markets. Revenues outside of the United States represented approximately 11%, 14%, 14%, and 13% of total revenues in the years ended December 31, 2011, 2012 and 2013, and the six months ended June 30, 2014, respectively.
-59-
Table of Contents
Factors Affecting our Future Performance
We believe that our future success will be dependent on many factors, including our ability to expand our relationships with existing customers, grow the number of customers and derive revenue from new offerings such as our data analytics and market research services and premium FinApps. While these areas present significant opportunity, they also present risks that we must manage to ensure successful results. See “Risk Factors.”
Growth in Number of Customers Deploying the Yodlee Platform
The continued growth of our business partially depends on our ability to secure new subscriptions and deployments of the Yodlee platform by new customers. We continue to target additional major FIs domestically and internationally to increase the number of paid users and our subscription and support revenue. We also intend to drive growth with Internet services companies by participating in additional vertical markets and expanding the breadth of applications and solutions running on the Yodlee platform. Revenue from these types of companies has accounted for a growing proportion of our total revenue in recent periods and we believe there is a significant opportunity to increase revenue from these companies in the future.
Renewals and Additional Revenue from Current Customers
The continued growth of our business partially depends on our ability to maintain our customer relationships, renew subscriptions from our current customers and generate additional paid users and sources of revenue from existing customers. Our ability to increase adoption among existing customers is particularly important in light of our land and expand business model, pursuant to which we target customers with initial product offerings and expand the use cases and relationship over time. For example, an FI customer may initially subscribe to Yodlee data aggregation and later expand its relationship with us by licensing additional product offerings and FinApps. As our existing customers increase their adoption and promotion of the functionality of our solutions and deploy FinApps and additional value-added offerings to their end users, we anticipate that our number of paid users will increase.
Mix and Timing of Subscriptions and Deployments
Sales to large organizations have typically been characterized by longer sales cycles, significant contract negotiations and less predictability in completing sales. For example, our sales cycle can generally last one year or more with our largest FI customers, but is variable and difficult to predict and can be much longer or shorter. Many of our YI customers have shorter sales cycles of one to three months. In addition, FI customers and some large YI customers deploy our solutions in six to nine months. In contrast, many other YI customers can implement our applications and solutions in approximately three months. All of these factors impact the timing of revenue recognition and have resulted in fluctuations in our subscription and support revenue and overall operating results.
Growth of Data Analytics and Market Research Services and Development and Deployment of FinApps
We have commenced deriving revenue by providing data analytics and market research services. We believe there are significant opportunities to increase our revenue and average revenue per paid user by providing these services to our existing customers and to new customers for such uses as market analytics, credit and risk analytics and other use cases. Our future growth and profitability will also be affected by our ability to generate higher average revenue per paid user through revenue-sharing arrangements with partners who develop premium FinApps.
-60-
Table of Contents
Operating Efficiencies and Investment
The cloud-based nature of the Yodlee platform provides us with economies of scale and operating leverage as the number of deployments and paid users grows. In addition, historically, we have enjoyed increasing operating efficiencies by leveraging our significant presence in India, which provides us with direct access to a large pool of talented engineers for research and development, customer support and operations. Our gross margins have expanded in recent periods and will continue to expand over the long term to the extent we are able to realize operating efficiencies.
To support our growth, we have made and expect to continue to make investments in our data center and other infrastructure in connection with enhancing and expanding our operations both domestically and internationally. For example, we expect to continue to invest in additional data center resources to keep pace with our growth. We believe that our investment in infrastructure will contribute to improvements in our operating results in the long-term; however, this investment will require capital expenditures and may impact our profitability in the near-term. In addition, we have continued to invest in research and development to continually improve and enhance the Yodlee platform and the breadth of applications and services running on the platform to meet our customers’ and potential customers’ needs and to develop new offerings to more effectively realize the value of the transaction-level data that we gather and refine. We also expect to continue to expand our sales and marketing efforts domestically and increase awareness of our solutions on a global basis and grow our international operations. We also expect to incur additional general and administrative expenses as a result of both our growth and the infrastructure required to be a public company. Investment in these areas will cause our operating expenses to continue to increase in absolute dollars in future periods.
Key Metrics
In addition to our results determined in accordance with U.S. generally accepted accounting principles, or GAAP, we believe the following non-GAAP and other operational measures are useful in evaluating our operating performance. We regularly review the key metrics set forth below as we evaluate our business.
| Year Ended December 31, | Six Months Ended June 30, |
|||||||||||||||||||
| 2011 | 2012 | 2013 | 2013 | 2014 | ||||||||||||||||
| (in thousands, except percentages and per user data) |
||||||||||||||||||||
| Adjusted EBITDA |
$ | (8,003 | ) | $ | (1,915 | ) | $ | 4,772 | $ | (174 | ) | $ | 2,295 | |||||||
| Paid users (as of period end) |
8,835 | 10,671 | 14,295 | 12,474 | 16,758 | |||||||||||||||
| Average revenue per paid user |
$ | 5.64 | $ | 4.38 | $ | 4.52 | $ | 4.37 | $ | 4.53 | ||||||||||
| Subscription and support revenue net retention rate |
115 | % | 114 | % | 123 | % | 119 | % | 123 | % | ||||||||||
Adjusted EBITDA
We define adjusted EBITDA as net loss before income from discontinued operations; provision for (benefit from) income taxes; other (income) expense, net; depreciation and amortization; and stock-based compensation expense. We believe adjusted EBITDA provides investors and other users of our financial information consistency and comparability with our past financial performance and facilitates period-to-period comparisons of operations. We believe adjusted EBITDA is useful in evaluating our operating performance compared to that of other companies in our industry, as this metric generally eliminates the effects of certain items that may vary for different companies for reasons unrelated to overall operating performance. We use adjusted EBITDA in conjunction with traditional GAAP
-61-
Table of Contents
measures as part of our overall assessment of our performance, including the preparation of our annual operating budget and quarterly forecasts, to evaluate the effectiveness of our business strategies and to communicate with our board of directors concerning our financial performance.
Adjusted EBITDA increased from $(8.0) million in the year ended December 31, 2011 to $(1.9) million in the year ended December 31, 2012 and to $4.8 million in the year December 31, 2013. Adjusted EBITDA increased from $(0.2) million in the six months ended June 30, 2013 to $2.3 million in the six months ended June 30, 2014. Adjusted EBITDA for the year ended December 31, 2011 was impacted significantly by income from discontinued operations. The increase in adjusted EBITDA from 2012 to 2013 and from the six months ended June 30, 2013 to the six months ended June 30, 2014, was primarily due to the decrease in our net losses in the periods.
Adjusted EBITDA should not be considered as a substitute for other measures of financial performance reported in accordance with GAAP. We understand that, although adjusted EBITDA is frequently used by investors and securities analysts in their evaluations of companies, adjusted EBITDA has limitations as an analytical tool, including: depreciation and amortization are non-cash charges, and the assets being depreciated or amortized will often have to be replaced in the future; adjusted EBITDA does not reflect any cash requirements for these replacements; adjusted EBITDA does not reflect changes in, or cash requirements for, our working capital needs or contractual commitments; adjusted EBITDA does not reflect cash requirements for income taxes and the cash impact of other income or expense; and other companies may calculate adjusted EBITDA differently than we do. We compensate for the inherent limitations associated with using adjusted EBITDA through disclosure of these limitations, presentation of our financial statements in accordance with GAAP and reconciliation of adjusted EBITDA to the most directly comparable GAAP measure, net loss. For a table reconciling net loss to adjusted EBITDA see “Prospectus Summary—Summary Consolidated Financial Data.”
Paid Users
A paid user is defined as a user of an application or service provided to our customer using the Yodlee platform whose status corresponds to a billable activity under the associated customer contract. We believe that our ability to increase the number of paid users is an indicator of our market penetration, the growth of our business, and our potential future business opportunities.
Paid users increased from 8.8 million as of December 31, 2011 to 10.7 million as of December 31, 2012, 14.3 million as of December 31, 2013 and to 16.8 million as of June 30, 2014, as a result of increases in our number of customers and penetration within certain customers.
Average Revenue Per Paid User
Average revenue per paid user is defined as of any point in time as the trailing twelve-month subscription and support revenue divided by the average number of paid users over the same time period. For a given contract, as the number of paid users increases, our usage fee per paid user generally decreases due to volume-tiered pricing. However, at the same time, our cost of subscription and support revenue has declined more rapidly on a per user basis, which has contributed to increases in our gross margins. Our ability to maintain average revenue per paid user during the last year is an indicator of our success in developing and monetizing expanding use cases for the Yodlee platform, including data analytics and market research services. In order to support average revenue per paid user, we intend to continue to develop additional applications and services, including data services and premium FinApps.
Average revenue per paid user decreased from $5.64 for the year ended December 31, 2011 to $4.38 for the year ended December 31, 2012, as the increase in the number of paid users resulted in a
-62-
Table of Contents
decrease in the usage fee per paid user under our customer contracts due to volume-tiered pricing, while our subscription and support gross margin increased by 8 percentage points from 53% to 61% as our cost of subscription and support revenue declined more rapidly on a per user basis due to economies of scale. Average revenue per paid user increased to $4.52 for the year ended December 31, 2013 due to revenue derived from minimums under new contracts and data analytics and market research services, which more than offset the effect of volume-tiered pricing, and our subscription and support gross margin further increased by an additional 5 percentage points to 66% for the year ended December 31, 2013 primarily due to additional economies of scale realized on higher revenue and higher average revenue per paid user.
Average revenue per paid user increased from $4.37 for the six months ended June 30, 2013 to $4.53 for the six months ended June 30, 2014 due to revenue derived from new contracts and data analytics and market research services, which more than offset the effect of volume-tiered pricing. Our subscription and support gross margin further increased by an additional 2 percentage points to 67% for the six months ended June 30, 2014 as compared to the six months ended June 30, 2013 primarily due to additional economies of scale realized on higher revenue and higher average revenue per paid user.
Subscription and Support Revenue Net Retention Rate
We believe that our ability to retain our customers through renewals of subscription agreements and expand the number of paid users of our applications and services is an indicator of the stability of our recurring revenue base and the long-term value of our customer relationships. We calculate our subscription and support revenue net retention rate for a particular period by dividing subscription revenue for the four most recent quarters by the subscription revenue for the corresponding quarters in the preceding year for those customers for which subscription revenue was recognized in the corresponding quarters of the preceding year. This calculation includes the impact on our revenue from customer non-renewals and attrition, deployments of additional services or discontinued use of services by our customers, price changes for our services and increases or decreases in the number of paid users.
Our subscription and support revenue net retention rate increased from 115% for the year ended December 31, 2011 to 114% for the year ended December 31, 2012 and 123% for the year ended December 31, 2013, primarily as a result of increased revenues from our existing customer base and, in particular, the increased maturity of our YI customer base. Our subscription and support revenue net retention rate increased from 119% for the six months ended June 30, 2013 to 123% for the six months ended June 30, 2014. We expect our subscription and support revenue net retention rate to fluctuate from period to period based on renewals by, and the extent of additional deployments within, our existing customers.
Components of Results of Operations
Revenue
We derive our revenue primarily from subscription and support fees and professional services fees. We sell subscriptions to the Yodlee platform to our FI and YI customers who make our solutions available to their end users. Professional services include implementation services, upgrade services, development of interfaces requested by customers, assistance with integration of our services with the customers’ other applications, dedicated support, and advisory services to customers who choose to develop their own interfaces and applications.
Subscription and support revenue accounted for approximately 81% and 85% of our revenue during the year ended December 31, 2013 and the six months ended June 30, 2014, respectively. Subscription and support revenue is driven primarily by the number of customers, the number of paid
-63-
Table of Contents
users and the renewal of existing subscription and support contracts. Subscription and support revenue is recognized ratably over the contracted term of each respective subscription agreement, commencing on the date the service is provisioned to the customer, provided all applicable revenue recognition criteria have been satisfied. As part of the subscription and support contracts, our customers generally commit to a minimum level of paid users from which a minimum level of non-refundable subscription and support revenue is derived. As paid users in excess of the guaranteed minimum level access the Yodlee platform, the customer is then required to pay additional usage fees calculated based upon a contracted per-paid-user fee. No refunds or credits are given if fewer paid users access the Yodlee platform than the contracted minimum level. Usage-based revenue is recognized as earned, provided all applicable revenue recognition criteria have been satisfied. For subscription and support agreements, we typically invoice our customers in monthly or annual fixed installments. Amounts that have been invoiced are initially recorded as deferred revenue and are recognized ratably over the subscription period. Because the invoicing terms of our customer agreements vary, the annualized value of the orders we enter into with our customers will not be completely reflected in deferred revenue at any single point in time. Accordingly, we do not believe that change in deferred revenue is an accurate indicator of future revenues for a given period of time. Customer contracts are generally non-cancellable for some specified period and, to the extent such contracts are cancelable before expiration of the term, they generally provide for payment of certain penalties and/or minimums. We expect our subscription and support revenue to increase as we add new customers, expand our paid user base and renew existing subscription and support contracts.
The proportion of our revenue derived from customer minimum paid user commitments, together with favorable subscription and support revenue net retention rates, have historically assisted us in predicting our near-term revenues. As usage increases and customers are required to pay additional usage fees calculated on a per-paid-user basis, a more significant proportion of our revenue over time may be derived from usage by paid users. This usage-based aspect of our subscription and support contracts adds some volatility to our revenue because end users’ activities may vary from period to period based on a variety of factors outside of our control, including personal financial and other circumstances affecting end user activity, seasonality and decisions by our customers that affect the extent to which they promote our solutions. Our experience with customers’ growth and our awareness of deployment and promotional plans helps us forecast these usage-based revenues.
Professional services and other revenue accounted for approximately 19% and 15% of our revenue during the year ended December 31, 2013 and the six months ended June 30, 2014, respectively. Professional services are sold either on a fixed-fee or on a time-and-materials basis. Revenue for time-and-material arrangements is recognized as the services are performed. During the years ended December 31, 2011 and 2012, revenue for fixed-fee arrangements was recognized under the completed performance method of accounting. During the year ended December 31, 2013, and the six months ended June 30, 2013 and 2014, revenue for fixed-fee arrangements was recognized under the proportional performance method of accounting as we have developed a history of accurately estimating activity. Historically, professional services and other revenue has included software license revenue that was derived from infrequent perpetual software license arrangements. We expect our professional services and other revenue to fluctuate based on the number of new customers added and version upgrade work performed in any given period, and the presence of other companies who are able to implement our services for customers.
Cost of Revenue
Our total cost of revenue consists of cost of subscription and support revenue and cost of professional services and other revenue, both of which consist primarily of personnel-related costs for the operations team or professional services team, respectively, including salaries, benefits and stock-based compensation.
-64-
Table of Contents
Cost of revenue–subscription and support also includes data center costs to host the Yodlee platform and related support and maintenance costs; depreciation of servers and networking equipment; security operations; payment processing cost; and allocated facilities and other supporting overhead costs. We expect our cost of subscription and support revenue to increase in absolute dollars, although it may fluctuate as a percentage of subscription and support revenue from period to period, as our subscription and support revenue increases.
Cost of revenue–professional services and other also includes cost of consultants engaged in providing professional services to our customers; and allocated facilities and other supporting overhead costs. When we defer professional services revenue, we defer the related direct labor costs that we consider recoverable and recognize them in cost of revenue in the same periods as the related professional service revenue is recognized. We expect our cost of professional services and other revenue to fluctuate in absolute dollars as our professional services and other revenue fluctuates.
Gross Profit
Gross profit is total revenue less total cost of revenue. Gross margin, or gross profit expressed as a percentage of total revenue, has been and will continue to be affected by a variety of factors, including the sales price of our product offerings, costs to deliver our platform, our ability to leverage our existing infrastructure as we continue to grow and the mix of revenue between subscription and support and professional services and other. Our subscription and support services generally have a higher gross margin than our professional services and other revenue. Gross margin for professional services and other is impacted by the size of customer deployments, with smaller projects typically having lower gross margins. We expect our gross margins to fluctuate over time depending on these and other factors.
Operating Expenses
Our operating expenses consist of research and development, sales and marketing, and general and administrative expense. Personnel costs are the most significant component of operating expenses and consist primarily of salaries, benefits, employee bonuses, stock-based compensation, and with regard to sales and marketing expense, sales commissions.
Research and Development. Research and development expense consists primarily of personnel costs for employees on our engineering and technical teams who are responsible for increasing the functionality and enhancing the ease of use of the Yodlee platform and the development of new products and services. Research and development expense also includes the cost of third-party service providers and allocated facilities and other supporting overhead costs. We expect research and development expense to increase in absolute dollars as we continue to invest in our future products and services, although our research and development expense may fluctuate as a percentage of total revenue.
Sales and Marketing. Sales and marketing expense consists primarily of sales commissions and other personnel costs for employees engaged in sales, sales support, business development and marketing functions. In addition, sales and marketing expense also includes travel-related expenses, marketing and public relations costs, and allocated facilities and other supporting overhead costs. We expect sales and marketing expense to increase in absolute dollars as we continue to hire additional personnel and invest in sales initiatives and marketing programs, although our sales and marketing expense may fluctuate as a percentage of total revenue.
General and Administrative. General and administrative expense consists primarily of personnel costs, professional services and allocated facilities and other supporting overhead costs. General and administrative personnel include our chief executive officer, finance and legal organizations.
-65-
Table of Contents
Professional services consist primarily of legal, auditing, accounting and other consulting costs. We expect general and administrative expense to increase in absolute dollars as we incur additional legal, accounting, investor relations, and other costs associated with being a public company, although our general and administrative expense may fluctuate as a percentage of total revenue.
Other Income (Expense), Net
Other income (expense), net consists primarily of the interest expense associated with our bank borrowings, foreign exchange gains or loss, gain or loss on foreign currency forward contracts, revaluation impact of convertible preferred stock warrant liabilities and other non-operating income or expense.
Provision for (Benefit From) Income Taxes
Provision for (benefit from) income taxes consists primarily of income taxes in our wholly-owned subsidiary in India and other foreign operations. The provision for (benefit from) income taxes related to our foreign operations is impacted by items such as increases and decreases in uncertain tax positions in our foreign locations, as well as foreign withholding taxes. These items, and their impact to our effective tax rate, may fluctuate from year to year. Valuation allowances are provided when necessary to reduce deferred tax assets to amount expected to be realized. Due to uncertainty as to the realization of benefits from our U.S. federal and state deferred tax assets, including net operating loss carry forwards, research and development and other tax credits, we have a full valuation allowance against such assets. We expect to maintain this full valuation allowance in the near term.
Income from Discontinued Operations, Net of Taxes
We launched software customization and managed services in 2006. As part of these services, which had separate operations and cash flows, we sold heavily customized enterprise software solutions as well as fully outsourced software management services. During the year ended December 31, 2011, we decided to discontinue our software customization and managed services.
As the software customization and managed services were abandoned and not sold or transferred to another entity, we ceased to have any continued involvement in this component. In addition, we were not required nor did we plan to provide any continuing support as it relates to the software customization and managed services component subsequent to 2011. No cash outflows or inflows occurred in 2012 or 2013, or in the six months ended June 30, 2013 and 2014, and none are expected in the future relating to this component.
-66-
Table of Contents
Consolidated Results of Operations
The following table summarizes our consolidated results of operations for the years ended December 31, 2011, 2012 and 2013, and the six months ended June 30, 2013 and 2014. Our historical results are not necessarily indicative of the results that may be expected in the future.
| Year Ended December 31, | Six Months Ended June 30, |
|||||||||||||||||||
| 2011 | 2012 | 2013 | 2013 | 2014 | ||||||||||||||||
| (in thousands) | ||||||||||||||||||||
| Consolidated Statements of Operations Data: |
||||||||||||||||||||
| Revenue: |
||||||||||||||||||||
| Subscription and support |
$37,029 | $44,336 | $56,838 | $26,120 | $34,903 | |||||||||||||||
| Professional services and other |
17,400 | 13,458 | 13,322 | 5,736 | 6,163 | |||||||||||||||
|
|
|
|
|
|
|
|
|
|
|
|||||||||||
| Total revenue |
54,429 | 57,794 | 70,160 | 31,856 | 41,066 | |||||||||||||||
| Cost of revenue: |
||||||||||||||||||||
| Subscription and support |
17,325 | 17,177 | 19,139 | 9,206 | 11,399 | |||||||||||||||
| Professional services and other |
9,537 | 7,594 | 7,693 | 3,845 | 4,392 | |||||||||||||||
|
|
|
|
|
|
|
|
|
|
|
|||||||||||
| Total cost of revenue |
26,862 | 24,771 | 26,832 | 13,051 | 15,791 | |||||||||||||||
|
|
|
|
|
|
|
|
|
|
|
|||||||||||
| Gross profit |
27,567 | 33,023 | 43,328 | 18,805 | 25,275 | |||||||||||||||
| Operating expenses: |
||||||||||||||||||||
| Research and development |
16,768 | 16,193 | 17,948 | 9,409 | 10,260 | |||||||||||||||
| Sales and marketing |
12,911 | 13,638 | 15,418 | 7,401 | 9,690 | |||||||||||||||
| General and administrative |
9,793 | 8,852 | 9,386 | 4,183 | 5,519 | |||||||||||||||
|
|
|
|
|
|
|
|
|
|
|
|||||||||||
| Total operating expenses |
39,472 | 38,683 | 42,752 | 20,993 | 25,469 | |||||||||||||||
|
|
|
|
|
|
|
|
|
|
|
|||||||||||
| Operating income (loss) from continuing operations |
(11,905 | ) | (5,660 | ) | 576 | (2,188 | ) | (194 | ) | |||||||||||
| Other income (expense), net |
(917 | ) | 230 | (318 | ) | 40 | 87 | |||||||||||||
|
|
|
|
|
|
|
|
|
|
|
|||||||||||
| Income (loss) from continuing operations before provision for (benefit from) income taxes |
(12,822 | ) | (5,430 | ) | 258 | (2,148 | ) | (107 | ) | |||||||||||
| Provision for (benefit from) income taxes |
(3,736 | ) | 1,091 | 1,439 | 484 | 842 | ||||||||||||||
|
|
|
|
|
|
|
|
|
|
|
|||||||||||
| Net loss from continuing operations |
(9,086 | ) | (6,521 | ) | (1,181 | ) | (2,632 | ) | (949 | ) | ||||||||||
| Income from discontinued operations, net of provision for income taxes |
6,999 | — | — | — | — | |||||||||||||||
|
|
|
|
|
|
|
|
|
|
|
|||||||||||
| Net loss |
$(2,087 | ) | $(6,521 | ) | $(1,181 | ) | $(2,632 | ) | $(949 | ) | ||||||||||
|
|
|
|
|
|
|
|
|
|
|
|||||||||||
-67-
Table of Contents
The following tables summarize our consolidated results of operations as a percentage of total revenue for the years ended December 31, 2011, 2012 and 2013, and the six months ended June 30, 2013 and 2014:
| Year Ended December 31, | Six Months Ended June 30, |
|||||||||||||||||||
| 2011 | 2012 | 2013 | 2013 | 2014 | ||||||||||||||||
| (as a percentage of total revenue) | ||||||||||||||||||||
| Revenue: |
||||||||||||||||||||
| Subscription and support |
68 | % | 77 | % | 81 | % | 82 | % | 85 | % | ||||||||||
| Professional services and other |
32 | 23 | 19 | 18 | 15 | |||||||||||||||
|
|
|
|
|
|
|
|
|
|
|
|||||||||||
| Total revenue |
100 | 100 | 100 | 100 | 100 | |||||||||||||||
| Cost of revenue: |
||||||||||||||||||||
| Subscription and support |
32 | 30 | 27 | 29 | 28 | |||||||||||||||
| Professional services and other |
17 | 13 | 11 | 12 | 10 | |||||||||||||||
|
|
|
|
|
|
|
|
|
|
|
|||||||||||
| Total cost of revenue |
49 | 43 | 38 | 41 | 38 | |||||||||||||||
|
|
|
|
|
|
|
|
|
|
|
|||||||||||
| Gross profit |
51 | 57 | 62 | 59 | 62 | |||||||||||||||
| Operating expenses: |
||||||||||||||||||||
| Research and development |
31 | 28 | 26 | 30 | 25 | |||||||||||||||
| Sales and marketing |
24 | 24 | 22 | 23 | 24 | |||||||||||||||
| General and administrative |
18 | 15 | 13 | 13 | 13 | |||||||||||||||
|
|
|
|
|
|
|
|
|
|
|
|||||||||||
| Total operating expenses |
73 | 67 | 61 | 66 | 62 | |||||||||||||||
|
|
|
|
|
|
|
|
|
|
|
|||||||||||
| Operating income (loss) from continuing operations |
(22 | ) | (10 | ) | 1 | (7 | ) | — | ||||||||||||
| Other income (expense), net |
(2 | ) | — | — | — | — | ||||||||||||||
|
|
|
|
|
|
|
|
|
|
|
|||||||||||
| Income (loss) from continuing operations before provision for (benefit from) income taxes |
(24 | ) | (9 | ) | — | (7 | ) | — | ||||||||||||
| Provision for (benefit from) income taxes |
(7 | ) | 2 | 2 | 1 | 2 | ||||||||||||||
|
|
|
|
|
|
|
|
|
|
|
|||||||||||
| Net loss from continuing operations |
(17 | ) | (11 | ) | (2 | ) | (8 | ) | (2 | ) | ||||||||||
| Income from discontinued operations, net of provision for income taxes |
13 | — | — | — | — | |||||||||||||||
|
|
|
|
|
|
|
|
|
|
|
|||||||||||
| Net loss |
(4 | %) | (11 | %) | (2 | %) | (8 | %) | (2 | %) | ||||||||||
|
|
|
|
|
|
|
|
|
|
|
|||||||||||
Comparison of the Six Months Ended June 30, 2013 and 2014
Revenue
| Six Months Ended June 30, |
||||||||||||
| 2013 | 2014 | % Change |
||||||||||
| (in thousands) | ||||||||||||
| Revenue: |
||||||||||||
| Subscription and support |
$ | 26,120 | $ | 34,903 | 34 | % | ||||||
| Professional services and other |
5,736 | 6,163 | 7 | % | ||||||||
|
|
|
|
|
|||||||||
| Total revenue |
$ | 31,856 | $ | 41,066 | 29 | % | ||||||
|
|
|
|
|
|||||||||
Total revenue increased $9.2 million, or 29%, from the six months ended June 30, 2013 to the six months ended June 30, 2014.
-68-
Table of Contents
The increase in subscription and support revenue of $8.8 million, or 34%, was due primarily to an increase in our paid users to 16.8 million as of June 30, 2014 from 12.5 million as of June 30, 2013 while average revenue per paid user remained relatively consistent. Subscription and support revenue for the six months ended June 30, 2014, increased due primarily to increased revenue from existing customers as calculated for purposes of the subscription and support revenue net retention rate.
Cost of Revenue, Gross Profit and Gross Margin
| Six Months Ended June 30, | ||||||||||||||||||||
| 2013 | 2014 | |||||||||||||||||||
| Amount | Gross Margin |
Amount | Gross Margin |
% Change |
||||||||||||||||
| (dollars in thousands) | ||||||||||||||||||||
| Cost of revenue: |
||||||||||||||||||||
| Subscription and support |
$ | 9,206 | $ | 11,399 | 24 | % | ||||||||||||||
| Professional services and other |
3,845 | 4,392 | 14 | % | ||||||||||||||||
|
|
|
|
|
|||||||||||||||||
| Total cost of revenue |
$ | 13,051 | $ | 15,791 | 21 | % | ||||||||||||||
|
|
|
|
|
|||||||||||||||||
| Gross profit: |
||||||||||||||||||||
| Subscription and support |
$ | 16,914 | 65 | % | $ | 23,504 | 67 | % | 2 | % | ||||||||||
| Professional services and other |
1,891 | 33 | % | 1,771 | 29 | % | (4 | %) | ||||||||||||
|
|
|
|
|
|||||||||||||||||
| Total gross profit |
$ | 18,805 | 59 | % | $ | 25,275 | 62 | % | 3 | % | ||||||||||
|
|
|
|
|
|||||||||||||||||
Total cost of revenue increased $2.7 million, or 21%, gross profit increased $6.5 million, and gross margin increased by 3 percentage points, from the six months ended June 30, 2013 to the six months ended June 30, 2014.
Cost of revenue from subscription and support increased $2.2 million, or 24%, from the six months ended June 30, 2013 to the six months ended June 30, 2014. This increase was primarily due to a $0.9 million increase in personnel costs related to increased headcount to support the business growth, a $0.3 million increase in depreciation expense related to additional servers and equipment, and a $0.4 million increase in data center and other hosting related costs to support the increase in subscription and support revenue. Gross profit from subscription and support increased $6.6 million, and gross margin increased by 2 percentage points primarily due to economies of scale achieved as a result of higher sales during the period.
Cost of revenue from professional services and other increased by $0.5 million, or 14%, from the six months ended June 30, 2013 to the six months ended June 30, 2014. This increase was due to an increase in employee-related expenses, due primarily to increased headcount needed to drive our overall revenue growth. Gross profit from professional services and other decreased $0.1 million and gross margin decreased by 4 percentage points.
Operating Expenses
Research and development
| Six Months Ended June 30, |
||||||||||||
| 2013 | 2014 | % Change |
||||||||||
| (dollars in thousands) | ||||||||||||
| Research and development |
$ | 9,409 | $ | 10,260 | 9 | % | ||||||
| Percentage of net revenue |
30 | % | 25 | % | ||||||||
-69-
Table of Contents
Research and development expense increased $0.9 million, or 9%, from the six months ended June 30, 2013 to the six months ended June 30, 2014. The increase was due to an increase in employee-related expenses due primarily to increased headcount needed to drive our overall revenue growth.
Sales and marketing
| Six Months Ended June 30, |
||||||||||||
| 2013 | 2014 | % Change |
||||||||||
| (dollars in thousands) | ||||||||||||
| Sales and marketing |
$ | 7,401 | $ | 9,690 | 31 | % | ||||||
| Percentage of net revenue |
23 | % | 24 | % | ||||||||
Sales and marketing expense increased $2.3 million, or 31%, from the six months ended June 30, 2013 to the six months ended June 30, 2014. The increase was primarily attributable to an increase of $1.3 million in employee-related expense, due primarily to increased headcount needed to drive our overall revenue growth, a $0.2 million increase in expense related to trade shows and conventions, and increased travel-related expenses of $0.2 million.
General and Administrative
| Six Months Ended June 30, |
||||||||||||
| 2013 | 2014 | % Change |
||||||||||
| (dollars in thousands) | ||||||||||||
| General and administrative |
$ | 4,183 | $ | 5,519 | 32 | % | ||||||
| Percentage of net revenue |
13 | % | 13 | % | ||||||||
General and administrative expenses increased $1.3 million, or 32%, from the six months ended June 30, 2013 to the six months ended June 30, 2014. This was primarily due to an increase of $0.6 million in employee-related expenses due primarily to increased headcount and an increase of $0.4 million in accounting and legal expenses.
Other Income (Expense), Net
| Six Months Ended June 30, | ||||||||
| 2013 | 2014 | |||||||
| (in thousands) | ||||||||
| Other income (expense), net |
$ | 40 | $ | 87 | ||||
Other income (expense), net, increased marginally by $47,000, from the six months ended June 30, 2013 to the six months ended June 30, 2014.
-70-
Table of Contents
Provision for (Benefit from) Income Taxes
Provision for income taxes primarily consists of income taxes in our wholly-owned subsidiary in India and other foreign operations.
| Six Months Ended June 30, | ||||||||
| 2013 | 2014 | |||||||
| (dollars in thousands) | ||||||||
| Provision for income taxes |
$ | 484 | $ | 842 | ||||
| Effective tax rate |
(23 | %) | 787 | % | ||||
The provision for income taxes increased by $0.4 million. The increase in the provision from the six months ended June 30, 2013 to the six months ended June 30, 2014 was primarily due to increased profits in our India subsidiary, foreign withholding taxes, and a tax benefit in the six months ended June 2013, which was associated with the release of an uncertain tax position, but which was not a component of the provision for income taxes for the six months ended June 30, 2014.
Comparison of the Years Ended December 31, 2011, 2012, and 2013
Revenue
| Year Ended December 31, | 2011 to 2012 % Change |
2012 to 2013 % Change |
||||||||||||||||||
| 2011 | 2012 | 2013 | ||||||||||||||||||
| (in thousands) | ||||||||||||||||||||
| Revenue: |
||||||||||||||||||||
| Subscription and support |
$ | 37,029 | $ | 44,336 | $ | 56,838 | 20 | % | 28 | % | ||||||||||
| Professional services and other |
17,400 | 13,458 | 13,322 | (23 | %) | (1 | %) | |||||||||||||
|
|
|
|
|
|
|
|||||||||||||||
| Total revenue |
$ | 54,429 | $ | 57,794 | $ | 70,160 | 6 | % | 21 | % | ||||||||||
|
|
|
|
|
|
|
|||||||||||||||
2013 compared to 2012. Total revenue increased $12.4 million, or 21%, from 2012 to 2013.
The increase in subscription and support revenue of $12.5 million, or 28%, was due primarily to an increase in our paid users to 14.3 million as of December 31, 2013 from 10.7 million as of December 31, 2012 while average revenue per paid user remained relatively consistent. Of the 28% increase in subscription and support revenue, 23 percentage points resulted from increased revenue from existing customers as calculated for purposes of the subscription and support revenue net retention rate. Professional services and other revenue decreased by $0.1 million, or 1%, as implementation efficiencies resulted in a decrease of professional services and other revenue despite an increase in new customers.
2012 compared to 2011. Total revenue increased $3.4 million, or 6%, from 2011 to 2012.
The increase in subscription and support revenue of $7.3 million, or 20%, was due primarily to an increase in our paid users to 10.7 million as of December 31, 2012 from 8.8 million as of December 31, 2011. Of the 20% increase in subscription and support revenue, 14 percentage points resulted from increased revenue from existing customers as calculated for purposes of the subscription and support revenue net retention rate. The decrease in professional services and other revenue of $3.9 million, or 23%, was due primarily to the recognition of perpetual software license revenue in 2011 while no corresponding license revenue was recognized in 2012. In addition, implementation efficiencies resulted in a decrease of professional services and other revenue despite an increase in new customers, as we migrated our business focus to a Software-as-a-Service-based, or SaaS-based, model.
-71-
Table of Contents
Cost of Revenue, Gross Profit and Gross Margin
| Year Ended December 31, | ||||||||||||||||||||||||||||||||
| 2011 | 2012 | 2013 | 2011 to 2012 % Change |
2012 to 2013 % Change |
||||||||||||||||||||||||||||
| Amount | Gross Margin |
Amount | Gross Margin |
Amount | Gross Margin |
|||||||||||||||||||||||||||
| (dollars in thousands) | ||||||||||||||||||||||||||||||||
| Cost of revenue: |
||||||||||||||||||||||||||||||||
| Subscription and support |
$ | 17,325 | $ | 17,177 | $ | 19,139 | (1 | %) | 11 | % | ||||||||||||||||||||||
| Professional services and other |
9,537 | 7,594 | 7,693 | (20 | %) | 1 | % | |||||||||||||||||||||||||
|
|
|
|
|
|
|
|||||||||||||||||||||||||||
| Total cost of revenue |
$ | 26,862 | $ | 24,771 | $ | 26,832 | (8 | %) | 8 | % | ||||||||||||||||||||||
|
|
|
|
|
|
|
|||||||||||||||||||||||||||
| Gross profit: |
||||||||||||||||||||||||||||||||
| Subscription and support |
$ | 19,704 | 53 | % | $ | 27,159 | 61 | % | $ | 37,699 | 66 | % | 8 | % | 5 | % | ||||||||||||||||
| Professional services and other |
7,863 | 45 | % | 5,864 | 44 | % | 5,629 | 42 | % | (1 | %) | (2 | %) | |||||||||||||||||||
|
|
|
|
|
|
|
|||||||||||||||||||||||||||
| Total gross profit |
$ | 27,567 | 51 | % | $ | 33,023 | 57 | % | $ | 43,328 | 62 | % | 6 | % | 5 | % | ||||||||||||||||
|
|
|
|
|
|
|
|||||||||||||||||||||||||||
2013 compared to 2012. Total cost of revenue increased $2.1 million, or 8%, and gross profit increased $10.3 million, and gross margin increased by 5 percentage points, from 2012 to 2013.
Cost of revenue from subscription and support increased $2.0 million, or 11%, from 2012 to 2013. The increase was primarily due to an increase of $1.3 million in personnel costs related to increased headcount to support the business growth, an increase of $0.3 million in depreciation expense related to additional servers and equipment and $0.4 million increase in data center and other hosting related costs to support the increase in subscription and support revenue. Gross profit from subscription and support increased $10.5 million, and gross margin increased by 5 percentage points primarily due to economies of scale achieved as a result of higher sales during the year.
Cost of revenue from professional services and other increased slightly by $0.1 million, or 1%, from 2012 to 2013. Gross profit from professional services and other decreased $0.2 million and gross margin decreased by 2 percentage points.
2012 compared to 2011. Total cost of revenue decreased $2.1 million, or 8%, gross profit increased $5.5 million and gross margin increased by 6 percentage points from 2011 to 2012.
Cost of revenue from subscription and support decreased marginally by $0.1 million, or 1%. Gross profit from subscription and support increased by $7.5 million and gross margin increased by 8 percentage points, primarily due to benefits from economies of scale as we improved the utilization of our existing infrastructure.
Cost of revenue from professional services and other decreased $1.9 million, or 20%, from 2011 to 2012. The decrease was primarily due to a decrease of $1.6 million in outside services, including contractors and consultants, as a result of reduced level of professional services rendered, a net decrease of $1.7 million in personnel costs related to a decreased headcount and allocated facilities costs, offset by an increase of $1.4 million in costs associated with previously deferred professional services costs given recognition of associated professional services revenue. Gross profit from professional services and other decreased $2.0 million, and gross margin decreased by 1 percentage point, as we migrated our business focus to a SaaS-based model.
-72-
Table of Contents
Operating Expenses
Research and development
| Year Ended December 31, | 2011 to 2012 % Change |
2012 to 2013 % Change |
||||||||||||||||||
| 2011 | 2012 | 2013 | ||||||||||||||||||
| (dollars in thousands) | ||||||||||||||||||||
| Research and development |
$ | 16,768 | $ | 16,193 | $ | 17,948 | (3 | %) | 11 | % | ||||||||||
| Percentage of net revenue |
31 | % | 28 | % | 26 | % | ||||||||||||||
2013 compared to 2012. Research and development expenses increased $1.8 million, or 11%. The increase was primarily due to a $0.8 million increase in personnel related expenses including salaries, benefits and employee bonuses, due primarily to increased head count, and an increase of $0.8 million in outside services for consultants and contractors used in the research and development department. This investment supported our efforts to build our future product offerings.
2012 compared to 2011. Research and development expenses marginally decreased by $0.6 million, or 3%.
Sales and marketing
| Year Ended December 31, | 2011 to 2012 % Change |
2012 to 2013 % Change |
||||||||||||||||||
| 2011 | 2012 | 2013 | ||||||||||||||||||
| (dollars in thousands) | ||||||||||||||||||||
| Sales and marketing |
$ | 12,911 | $ | 13,638 | $ | 15,418 | 6 | % | 13 | % | ||||||||||
| Percentage of net revenue |
24 | % | 24 | % | 22 | % | ||||||||||||||
2013 compared to 2012. Sales and marketing expenses increased $1.8 million, or 13%, from 2012 to 2013. The increase was primarily attributable to an increase of $1.2 million in employee-related expense, due primarily to increased head count needed to drive our overall revenue growth, a $0.4 million increase in expenses related to trade shows and conventions, and a $0.2 million increase in travel-related expense as we continue to expand our customer base and presence internationally.
2012 compared to 2011. Sales and marketing expenses increased $0.7 million, or 6%, from 2011 to 2012. The increase was primarily attributable to an increase of $0.6 million in employee-related expense, due primarily to increased head count needed to drive our overall revenue growth and a $0.1 million increase in travel-related expenses.
General and Administrative
| Year Ended December 31, | 2011 to 2012 % Change |
2012 to 2013 % Change |
||||||||||||||||||
| 2011 | 2012 | 2013 | ||||||||||||||||||
| (dollars in thousands) | ||||||||||||||||||||
| General and administrative |
$ | 9,793 | $ | 8,852 | $ | 9,386 | (10 | %) | 6 | % | ||||||||||
| Percentage of net revenue |
18 | % | 15 | % | 13 | % | ||||||||||||||
2013 compared to 2012. General and administrative expenses increased marginally, $0.5 million, or 6%, from 2012 to 2013. This was primarily due to an increase of $0.4 million in employee-related expenses, including salaries and bonus, due primarily to increased head count.
2012 compared to 2011. General and administrative expenses decreased $0.9 million, or 10%, from 2011 to 2012. This was primarily due to the cost of $1.3 million incurred in 2011 in one-time projects for accounting and audit services partially offset by an increase of $0.5 million in employee-related expenses as a result of increased headcount.
-73-
Table of Contents
Other Income (Expense), Net
| Year Ended December 31, | ||||||||||||
| 2011 | 2012 | 2013 | ||||||||||
| (in thousands) | ||||||||||||
| Other income (expense), net |
$ | (917 | ) | $ | 230 | $ | (318 | ) | ||||
2013 compared to 2012. Other income (expense), net, decreased $0.5 million, from 2012 to 2013. The decrease was primarily due to the receipt of proceeds from an insurance settlement in 2012 and the re-measurement of our convertible preferred stock warrants.
2012 compared to 2011. Other income (expense), net, increased $1.1 million, from 2011 to 2012. The increase was primarily due to a net increase of $0.6 million due to the strengthening of the U.S. dollar against the Indian Rupee and the proceeds from an insurance settlement of $0.5 million.
Provision for (Benefit from) Income Taxes
Provision for income taxes primarily consists of income taxes in our wholly-owned subsidiary in India and other foreign operations.
| Year Ended December 31, | ||||||||||||
| 2011 | 2012 | 2013 | ||||||||||
| (dollars in thousands) | ||||||||||||
| Provision for (benefit from) income taxes |
$ | (3,736 | ) | $ | 1,091 | $ | 1,439 | |||||
| Effective tax rate |
29 | % | 20 | % | 558 | % | ||||||
2013 compared to 2012. Provision for (benefit from) income taxes increased $0.3 million. The increase in the provision for 2013 compared to 2012 was primarily due to the inclusion of $0.2 million tax expense related to an uncertain tax position for permanent establishment in a foreign jurisdiction, changes in uncertain tax positions in our foreign and domestic operations, as well as foreign withholding taxes.
2012 compared to 2011. Provision for (benefit from) income taxes increased $4.8 million from 2011 to 2012. The increase to a tax provision in 2012 from a tax benefit in 2011 was primarily due to an allocation of $4.8 million tax expense for our discontinued operations in 2011 which did not recur in 2012, as well as changes in our uncertain tax positions.
-74-
Table of Contents
Quarterly Results of Operations Data
The following table sets forth our unaudited quarterly consolidated statements of operations data for each of the ten quarters ended June 30, 2014. We have prepared the quarterly data on a consistent basis with our audited consolidated financial statements included elsewhere in this prospectus. In the opinion of management, this financial information reflects all adjustments, consisting only of normal recurring adjustments, necessary for a fair presentation of this data. This information should be read in conjunction with our audited consolidated financial statements and related notes included elsewhere in this prospectus. The results of historical periods are not necessarily indicative of the results of operations that may be expected for a full year or any future period.
| For The Three Months Ended | ||||||||||||||||||||||||||||||||||||||||
| Mar. 31, 2012 |
Jun. 30, 2012 |
Sep. 30, 2012 |
Dec. 31, 2012 |
Mar. 31, 2013 |
Jun. 30, 2013 |
Sep. 30, 2013 |
Dec. 31, 2013 |
Mar. 31, 2014 |
June 30, 2014 |
|||||||||||||||||||||||||||||||
| (dollars in thousands) | ||||||||||||||||||||||||||||||||||||||||
| Consolidated Statements of Operations: |
||||||||||||||||||||||||||||||||||||||||
| Revenue: |
||||||||||||||||||||||||||||||||||||||||
| Subscription and support |
$ | 10,069 | $ | 10,700 | $ | 11,235 | $ | 12,332 | $ | 12,451 | $ | 13,669 | $ | 14,298 | $ | 16,420 | $ | 16,731 | $ | 18,172 | ||||||||||||||||||||
| Professional services and other |
2,248 | 2,500 | 3,303 | 5,407 | 3,019 | 2,717 | 3,968 | 3,618 | 3,032 | 3,131 | ||||||||||||||||||||||||||||||
|
|
|
|
|
|
|
|
|
|
|
|
|
|
|
|
|
|
|
|
|
|||||||||||||||||||||
| Total revenue |
12,317 | 13,200 | 14,538 | 17,739 | 15,470 | 16,386 | 18,266 | 20,038 | 19,763 | 21,303 | ||||||||||||||||||||||||||||||
| Cost of revenue: |
||||||||||||||||||||||||||||||||||||||||
| Subscription and support |
4,094 | 3,989 | 4,405 | 4,689 | 4,665 | 4,541 | 4,867 | 5,066 | 5,655 | 5,744 | ||||||||||||||||||||||||||||||
| Professional services and other |
1,962 | 1,793 | 1,679 | 2,160 | 1,952 | 1,892 | 1,839 | 2,010 | 2,186 | 2,206 | ||||||||||||||||||||||||||||||
|
|
|
|
|
|
|
|
|
|
|
|
|
|
|
|
|
|
|
|
|
|||||||||||||||||||||
| Total cost of revenue |
6,056 | 5,782 | 6,084 | 6,849 | 6,617 | 6,433 | 6,706 | 7,076 | 7,841 | 7,950 | ||||||||||||||||||||||||||||||
|
|
|
|
|
|
|
|
|
|
|
|
|
|
|
|
|
|
|
|
|
|||||||||||||||||||||
| Gross profit |
6,261 | 7,418 | 8,454 | 10,890 | 8,853 | 9,953 | 11,560 | 12,962 | 11,922 | 13,353 | ||||||||||||||||||||||||||||||
| Gross margin |
51% | 56% | 58% | 61% | 57% | 61% | 63% | 65% | 60% | 63% | ||||||||||||||||||||||||||||||
| Operating expenses: |
||||||||||||||||||||||||||||||||||||||||
| Research and development |
4,080 | 3,701 | 3,889 | 4,523 | 4,769 | 4,640 | 4,096 | 4,443 | 4,909 | 5,351 | ||||||||||||||||||||||||||||||
| Sales and marketing |
3,568 | 3,649 | 3,367 | 3,054 | 3,606 | 3,795 | 3,946 | 4,071 | 4,541 | 5,149 | ||||||||||||||||||||||||||||||
| General and administrative |
2,292 | 2,349 | 2,221 | 1,990 | 1,976 | 2,207 | 2,795 | 2,408 | 2,702 | 2,817 | ||||||||||||||||||||||||||||||
|
|
|
|
|
|
|
|
|
|
|
|
|
|
|
|
|
|
|
|
|
|||||||||||||||||||||
| Total operating expenses |
9,940 | 9,699 | 9,477 | 9,567 | 10,351 | 10,642 | 10,837 | 10,922 | 12,152 | 13,317 | ||||||||||||||||||||||||||||||
|
|
|
|
|
|
|
|
|
|
|
|
|
|
|
|
|
|
|
|
|
|||||||||||||||||||||
| Operating income (loss) |
(3,679 | ) | (2,281 | ) | (1,023 | ) | 1,323 | (1,498 | ) | (689 | ) | 723 | 2,040 | (230 | ) | 36 | ||||||||||||||||||||||||
| Other income (expense), net |
(87 | ) | (101 | ) | 6 | 412 | 81 | (41 | ) | (258 | ) | (100 | ) | 19 | 68 | |||||||||||||||||||||||||
|
|
|
|
|
|
|
|
|
|
|
|
|
|
|
|
|
|
|
|
|
|||||||||||||||||||||
| Income (loss) before provision for income taxes |
(3,766 | ) | (2,382 | ) | (1,017 | ) | 1,735 | (1,417 | ) | (730 | ) | 465 | 1,940 | (211 | ) | 104 | ||||||||||||||||||||||||
| Provision for income taxes |
135 | 458 | 201 | 297 | 177 | 308 | 261 | 693 | 377 | 465 | ||||||||||||||||||||||||||||||
|
|
|
|
|
|
|
|
|
|
|
|
|
|
|
|
|
|
|
|
|
|||||||||||||||||||||
| Net income (loss) |
$ | (3,901 | ) | $ | (2,840 | ) | $ | (1,218 | ) | $ | 1,438 | $ | (1,594 | ) | $ | (1,038 | ) | $ | 204 | $ | 1,247 | $ | (588 | ) | $ | (361 | ) | |||||||||||||
|
|
|
|
|
|
|
|
|
|
|
|
|
|
|
|
|
|
|
|
|
|||||||||||||||||||||
Quarterly Revenue Trends
Our quarterly subscription and support revenue has increased sequentially over the past ten quarters. The increases resulted primarily from growth in subscription and support revenue from new customers, upgrades and additional subscriptions from existing customers, and an increase in the number of paid users due to the launch and expansion of customers’ applications. Our quarterly professional services and other revenue has fluctuated from quarter to quarter depending on the nature and extent of customer deployments. In addition, our revenue has usually been the strongest during the last two quarters of the year due to the terms of existing customer contracts with certain of our largest customers and associated revenue recognition, and timing of our customers’ deployment of our solutions and associated professional services revenue.
Quarterly Cost and Expense Trends
Cost of revenue in absolute dollars varied from quarter-to-quarter in the quarters presented. However, cost of revenue generally increased over the periods presented primarily due to overall
-75-
Table of Contents
business growth and implementation and service related costs that we incur and recognize in the same periods as the related revenue.
Our operating expenses have increased in absolute dollars as we have continued to hire additional employees, introduce new marketing programs to increase brand awareness and incur additional costs in preparation of becoming a public company. Our research and development expenses for the quarters ended December 31, 2012, March 31, 2013 and June 30, 2013 were impacted by increased costs as we developed additional functionality for our FinApps.
Our quarterly results of operations may fluctuate significantly due to a variety of factors, many of which are outside of our control, making our results of operations variable and difficult to predict. As such, we believe sequential quarterly comparisons of our results of operations may not be meaningful and should not be relied upon as an indication of future performance.
Liquidity and Capital Resources
As of June 30, 2014, we had cash and cash equivalents of $6.3 million, all of which was held in the United States. We anticipate that the amount of our cash and cash equivalents held in India may increase in the future as funds are remitted to our Indian subsidiary for services performed under our intercompany agreements. Our cash and cash equivalents are comprised primarily of deposits with commercial banks in checking, interest-bearing and money market accounts. To date, we have satisfied our capital and liquidity needs through cash collections from our customers, private placements of convertible preferred stock and bank borrowings. We have incurred significant losses in the past as we continued to expand our business. Our cash flow from operating activities will continue to be affected principally by the extent to which our revenue exceeds or does not exceed any increase in spending on personnel to support the growth of our business. Our largest source of operating cash flow is cash collections from our customers.
We believe that our existing cash and cash equivalents, cash flow from operations and availability under our line of credit will be sufficient to meet our working capital needs and planned capital expenditures for at least the next 12 months. From time to time, we may explore additional financing sources which could include equity, equity-linked and debt financing arrangements. We cannot assure you that any additional financing will be available to us on acceptable terms or at all.
Bank Borrowings
In 2005, we entered into a loan and security agreement, as amended, with Silicon Valley Bank. The agreement, as amended, provides for borrowings up to $15.0 million in revolving loans as of June 30, 2014, subject to a borrowing base of trailing three months subscription and support revenue. As of June 30, 2014, $5.2 million was outstanding on the revolving loans and up to $9.8 million was available for drawdown, subject to the borrowing base limitation.
The agreement also provided an equipment financing facility for the purchase of equipment through March 31, 2011, with a repayment period of 36 months from the date of each advance. The equipment financing facility is non-revolving, and repaid equipment advances may not be re-borrowed. As of June 30, 2014, no amount was outstanding under the facility, and no amount remains available to be borrowed.
In July 2012, we entered into an amendment to our credit facility with the same lender to borrow $3.0 million in term loans with a repayment period of 36 months, including principal and interest. This loan bears interest at a fixed rate of 5.5% per annum. In August 2013, we entered into another amendment to our credit facility with the same lender to borrow an additional $3.0 million in term loans with a repayment period of 42 months including interest-only payments for the first six months and
-76-
Table of Contents
equal monthly payments, including principal and interest, for the next 36 months. This loan bears interest at a fixed rate of 5.0% per annum. As of June 30, 2014, $3.9 million was outstanding on the term loans.
As of June 30, 2014, $9.1 million was outstanding under the credit facility.
These borrowings are secured by all of our assets, other than our intellectual property, and we are required to comply with certain financial and reporting covenants, including maintaining (i) adjusted EBITDA, on a trailing six-month basis and (ii) subscription and support revenue, on a trailing three- month basis, of a certain amount as mutually agreed upon by the lender and us. As of June 30, 2014, we were in compliance with our financial and reporting covenants.
Cash Flows
The following table summarizes our cash flows for the periods presented:
| Year Ended December 31, | Six Months Ended June 30, |
|||||||||||||||||||
| 2011 | 2012 | 2013 | 2013 | 2014 | ||||||||||||||||
| (in thousands) | ||||||||||||||||||||
| Consolidated Statements of Cash Flows: |
||||||||||||||||||||
| Net cash (used in) provided by operating activities |
$ | (4,019 | ) | $ | (10,777 | ) | $ | 3,509 | $ | (2,014 | ) | $ | (989 | ) | ||||||
| Net cash used in investing activities |
(2,431 | ) | (2,578 | ) | (2,884 | ) | (1,705 | ) | (2,525 | ) | ||||||||||
| Net cash (used in) provided by financing activities |
4,328 | 12,555 | (454 | ) | 2,133 | 1,643 | ||||||||||||||
|
|
|
|
|
|
|
|
|
|
|
|||||||||||
| Net (decrease) increase in cash and cash equivalents |
$ | (2,122 | ) | $ | (800 | ) | $ | 171 | $ | (1,586 | ) | $ | (1,871 | ) | ||||||
|
|
|
|
|
|
|
|
|
|
|
|||||||||||
Operating Activities
Our primary source of cash from operating activities has been from cash collections from our customers. We expect cash inflows from operating activities to be affected by the level of sales and timing of collections. Our primary uses of cash from operating activities have been for personnel costs. Our cash flow from operations will continue to be affected principally by the extent to which we grow our revenue and increase our headcount in order to grow our business.
Cash used in operating activities in the six months ended June 30, 2014 of $1.0 million was driven by a net loss of $0.9 million as adjusted for the exclusion of non-cash expenses of $2.6 million and changes in our working capital of $2.7 million. Non-cash charges consist primarily of depreciation and amortization of our property and equipment and stock-based compensation for stock options. The changes in our working capital were due primarily to an increase in accounts receivable of $1.7 million and prepaid expenses of $1.7 million.
Cash used in operating activities in the six months ended June 30, 2013 of $2.0 million was driven by a net loss of $2.6 million as adjusted for the exclusion of non-cash expenses of $1.9 million and changes in our working capital of $1.3 million. Non-cash charges consist primarily of depreciation and amortization of our property and equipment and stock-based compensation for stock options. The changes in our working capital were due primarily to a decrease in deferred revenue of $1.1 million and a decrease in accrued liabilities and other long-term liabilities of $1.4 million.
Cash provided by operating activities in 2013 of $3.5 million was driven by a net loss of $1.2 million as adjusted for the exclusion of non-cash expenses of $4.3 million and changes in our
-77-
Table of Contents
working capital of $0.4 million. Non-cash charges consist primarily of depreciation and amortization of our property and equipment and stock-based compensation for stock options. The changes in our working capital were due primarily to an increase in accrued compensation of $2.9 million and an increase in deferred revenue of $0.5 million, partially offset by an increase in accounts receivable of $2.2 million and a decrease in accrued liabilities and other long term liabilities of $0.6 million. The increase in accrued compensation was due to the partial-payment of 2012 bonuses within the year ended December 31, 2012, whereas no such partial-payment of bonuses was made in the year ended December 31, 2013 for 2013 bonuses. The increase in accounts receivable resulted from the growth in our business.
Cash used in operating activities in 2012 of $10.8 million was driven by a net loss of $6.5 million as adjusted for the exclusion of non-cash expenses of $3.3 million and changes in our working capital of $7.6 million. Non-cash charges consist primarily of depreciation and amortization and stock-based compensation. The changes in our working capital were due primarily to a decrease in our deferred revenue of $4.0 million, a decrease in accrued compensation of $1.1 million, a decrease in accrued liabilities of $0.9 million and an increase in accounts receivable of $1.8 million. The decrease in deferred revenue was due to the recognition in 2012 of deferred professional services revenue upon completion of professional services engagements. The decrease in accrued compensation was due to the timing of bonus payments. The increase in accounts receivable resulted from the growth in our business.
Cash used in operating activities in 2011 of $4.0 million was driven by a net loss of $2.1 million as adjusted for the exclusion of non-cash expenses of $4.0 million and changes in our working capital of $5.9 million. Non-cash charges consist primarily of depreciation and amortization of our property and equipment and stock-based compensation for stock options. The changes in our working capital were primarily due to a decrease in deferred revenue of $16.9 million and a decrease in accounts payable of $1.1 million partially offset by a decrease in prepaid assets of $6.6 million and a decrease in accounts receivable of $5.9 million. The decrease in deferred revenue was due to the recognition in 2011 of deferred professional services revenue upon completion of a significant professional services engagement. As a result of the completion of this engagement, we recognized deferred costs and commissions relating to the engagement and received payments relating to the engagement that reduced accounts receivable. The decrease in accounts payable was due to the timing of vendor payments.
Investing Activities
Our investing activities consist primarily of capital expenditures to purchase property and equipment, particularly purchases of servers, networking equipment and software licenses. We expect to continue investing in capital expenditures to support continued growth of our business.
We used $2.4 million, $3.0 million, $3.0 million, $1.8 million and $2.5 million for purchases of property and equipment in 2011, 2012 and 2013, and the six months ended June 30, 2013 and 2014, respectively. In 2013, and six months ended June 30, 2013 and 2014, $1.7 million, $0.8 million and $1.8 million, respectively, of additional purchases were financed through capital leases. In addition, we received proceeds of $0.5 million in 2012 from an insurance settlement.
Financing Activities
Our financing activities have consisted primarily of bank borrowings, net proceeds from the issuance of our convertible preferred stock and net proceeds from the issuance of shares of our common stock upon the exercise of stock options.
In the six months ended June 30, 2014, cash provided by financing activities was $1.6 million, which consisted primarily of $2.7 million of net bank borrowings, and $0.9 million of net proceeds from
-78-
Table of Contents
the issuance of shares of our common stock upon exercises of stock options offset by $0.5 million of capital lease payments, $0.9 million of deferred offering costs, and $0.5 million repurchase of common stock.
In the six months ended June 30, 2013, cash provided by financing activities was $2.1 million, which consisted of $2.0 million of net bank borrowings and $0.3 million of net proceeds from the issuance of shares of our common stock upon the exercise of stock options offset by $0.1 million of capital lease payments.
In 2013, cash used in financing activities was $0.5 million, which consisted of $1.5 million of net repayments on our bank borrowings and $0.4 million of capital lease payments offset by $1.4 million of proceeds from the issuance of shares of our common stock upon the exercise of stock options.
In 2012, cash provided by financing activities was $12.6 million, which consisted primarily of $9.4 million of net proceeds from the issuance of shares of our convertible preferred stock, and $3.9 million of proceeds from the issuance of shares of our common stock upon the exercise of stock options, offset by $0.4 million of net repayments on our bank borrowings.
In 2011, cash provided by financing activities was $4.3 million, which consisted of $4.3 million of net bank borrowings, and $0.5 million of net proceeds from the issuance of shares of our common stock upon exercise of stock options offset by $0.5 million of capital lease payments.
Backlog
We sell subscriptions to our solutions through contracts that are generally one to three years in length, although terms can extend to as long as five years. Our subscription agreements with our customers generally contain scheduled minimum subscription fees, and usage-based fees which depend on the extent their customers or end users use our platform. We consider the unpaid contractual minimum payments under our subscription agreements to be our backlog. Due to the inherent volatility of backlog measured using contractual minimums, and the fact that contractual minimums are becoming increasingly less important to our business, we do not utilize backlog as a key management metric internally and we do not believe that it is a meaningful measurement of our future revenues. As of December 31, 2012 and 2013, the amount of our subscription agreement backlog was approximately $89.9 million and $78.9 million, respectively.
We expect that the amount of backlog relative to the total value of our subscription agreements will change from year to year for several reasons, including the timing of contract renewals, the proportion of total subscription and support revenue represented by contractual minimum payments and the average non-cancellable terms of our subscription agreements. The change in backlog that results from these events may not be an indicator of the likelihood of renewal or expected future revenues.
We also expect that as our customer base continues to mature and customer deployments scale usage, renewals over time will increasingly have fewer contractual minimum fees because such fees are intended to decrease the timing risk associated with initial deployment commitments.
In addition, because revenue for any period is a function of revenue recognized from deferred revenue under contracts in existence at the beginning of the period, as well as contracts that are renewed and new customer contracts that are entered into during the period, backlog at the beginning of any period is not necessarily indicative of future performance.
-79-
Table of Contents
Off-Balance Sheet Arrangements
During the years ended December 31, 2011, 2012 and 2013, and the six months ended June 30, 2013 and 2014, we did not have any relationships with unconsolidated organizations or financial partnerships, such as structured finance or special purpose entities, that would have been established for the purpose of facilitating off-balance sheet arrangements.
Contractual Obligations
A summary of our contractual commitments and obligations as of December 31, 2013 is as follows:
| Payments Due by Period | ||||||||||||||||||||
| Total | Less than 1 year |
1-3 years | 3-5 years | More than 5 years |
||||||||||||||||
| (in thousands) | ||||||||||||||||||||
| Financing Arrangements(1) |
$ | 6,385 | $ | 3,471 | $ | 2,646 | $ | 268 | $ | — | ||||||||||
| Contractual commitments(2) |
3,070 | 1,858 | 1,212 | — | — | |||||||||||||||
| Operating leases(3) |
3,905 | 1,909 | 1,767 | 229 | — | |||||||||||||||
| Capital leases(4) |
1,378 | 574 | 804 | — | — | |||||||||||||||
| Interest(5) |
550 | 349 | 199 | 2 | — | |||||||||||||||
|
|
|
|
|
|
|
|
|
|
|
|||||||||||
| Total |
$ | 15,288 | $ | 8,161 | $ | 6,628 | $ | 499 | $ | — | ||||||||||
|
|
|
|
|
|
|
|
|
|
|
|||||||||||
| (1) | Obligations under financing arrangements relate to a revolving line of credit, equipment financing facility and term loans. |
| (2) | The contractual commitments are associated with agreements that are enforceable and legally binding. Obligations under contracts that we can cancel without a significant penalty are not included in the table above. The contractual commitments relate primarily to third-party facilities that house our data centers. |
| (3) | The operating leases consist of contractual obligations from our office spaces under non-cancelable operating leases. |
| (4) | The capital lease obligations relate to the purchases of servers, networking equipment and software licenses. |
| (5) | Interest relates to our bank borrowings and capital lease obligations. Interest on our revolving line of credit is estimated based on the outstanding balance and interest rate as of December 31, 2013. |
The contractual obligations table above excludes tax liabilities of $2.5 million related to uncertain tax positions, as of December 31, 2013, because we are unable to make a reasonably reliable estimate of the timing of settlement, if any, of these future payments.
Critical Accounting Policies and Estimates
Our consolidated financial statements are prepared in accordance with accounting principles generally accepted in the United States. The preparation of these consolidated financial statements requires us to make estimates and assumptions that affect the reported amounts of assets, liabilities, revenue, costs and expenses, and related disclosures. On an ongoing basis, we evaluate our estimates and assumptions. Changes in these estimates and assumptions or conditions could significantly affect our financial condition and results of operations.
We believe that of our significant accounting policies, which are described in Note 2 to our consolidated financial statements, the following accounting policies involve a greater degree of judgment and complexity. Accordingly, these are the policies we believe are the most critical to aid in fully understanding and evaluating our consolidated financial condition and results of operations.
-80-
Table of Contents
Revenue Recognition
We primarily derive our revenue from subscription and support fees and professional services fees. We sell subscriptions to the Yodlee platform through contracts that are generally between one to three years in length, although terms can extend to as long as five years. Our arrangements do not contain general rights of return. Our subscription contracts do not provide customers with the right to take possession of the Yodlee platform and, as a result, are accounted for as service contracts. We record revenue net of any sales or excise taxes.
We commence revenue recognition for the Yodlee platform and professional services when all of the following criteria are met:
| • | there is persuasive evidence of an arrangement; |
| • | the service has been or is being provided to the customer; |
| • | collection of the fees is reasonably assured; and |
| • | the amount of fees to be paid by the customer is fixed or determinable. |
Subscription and Support Revenue
Subscription and support revenue are primarily derived from customers accessing the Yodlee platform and include subscription, support, and usage-based fees. Subscription and support revenue are recognized ratably over the contracted term of each respective subscription agreement, commencing on the date the service is provisioned to the customer, provided the four revenue recognition criteria have been satisfied. Usage-based revenue are recognized as earned, provided the four revenue recognition criteria have been satisfied.
Professional Services and Other Revenue
Professional services include implementation services, development of interfaces requested by customers, assistance with integration of our solutions with the customers’ applications, dedicated support, and advisory services to customers who choose to develop their own interfaces and applications. Professional services are typically performed within three to nine months of entering into an arrangement with the customer. Professional services are sold either on a fixed-fee or on a time-and-materials basis. Revenue for time-and-material arrangements is recognized as the services are performed. During the years ended December 31, 2011 and 2012, revenue for fixed-fee arrangements was recognized under the completed performance method of accounting. During the year ended December 31, 2013, and the six months ended June 30, 2013 and 2014, revenue for fixed-fee arrangements was recognized under the proportional performance method of accounting as we have developed a history of accurately estimating activity. The change from completed performance method of accounting to the proportional performance method of accounting was due to a change in underlying facts and circumstances, primarily due to increased management oversight and knowledge of plan project hours. Professional services are not considered essential to the functionality of the Yodlee platform.
Multiple Element Arrangements
We enter into multiple element arrangements in which a customer may purchase a subscription and professional services. For arrangements with multiple deliverables, we evaluate whether the individual deliverables qualify as separate units of accounting. In order to treat deliverables in a multiple deliverable arrangement as separate units of accounting, the deliverables must have standalone value upon delivery. If the deliverables have standalone value upon delivery, we account
-81-
Table of Contents
for each deliverable separately and revenue is recognized for the respective deliverables as they are delivered. If one or more of the deliverables does not have standalone value upon delivery, the deliverables that do not have standalone value are combined with the final deliverable within the arrangement and treated as a single unit of accounting.
Subscription and support contracts have standalone value as we sell the subscriptions and support separately. In determining whether professional services can be accounted for separately from subscription and support services, we consider the availability of the professional services from other vendors, the nature of our professional services and whether we sell our applications to new customers without professional services. Based on these considerations we assessed that our professional services have standalone value.
We determine the selling price for each element based on the selling price hierarchy of: (i) vendor-specific objective evidence, or VSOE, of fair value, (ii) third-party evidence, or TPE, and (iii) estimated selling price or, ESP. We are unable to establish VSOE for any of our services, as we have not historically priced our services with sufficient consistency. We are also unable to establish TPE, as we do not have sufficient information regarding pricing of third-party subscription and professional services similar to our offerings. As a result, we have developed estimates of selling prices based on margins our senior management has established as the targets in the selling and pricing strategies after considering the nature of the services, the economic and competitive environment, and the nature and magnitude of the costs incurred. The amount of arrangement fee allocated is limited by contingent revenue, if any.
Goodwill
Goodwill represents the excess of the purchase price over the fair value of assets acquired and liabilities assumed in a business combination. Goodwill is presumed to have an indefinite life and is not subject to amortization. We test goodwill for impairment at the company level, which is the sole reporting unit, on at least an annual basis and at any interim date whenever events or changes in circumstances indicate that the carrying value may not be recoverable.
When assessing goodwill for impairment, we have the option to first perform a qualitative assessment to determine whether a quantitative goodwill test is necessary. If it is determined, based on qualitative factors such as macroeconomic conditions, industry and market conditions, overall financial performance and any other company developments, that the fair value of the reporting unit more likely than not is less than the carrying amount, or if significant changes to macroeconomic factors have occurred that could materially impact fair value, a quantitative goodwill impairment test would be required. Additionally, there is an option to bypass the qualitative assessment and directly perform the quantitative test. The quantitative test for goodwill impairment is a two-step process. The first step is a comparison of the fair value of the reporting unit with its carrying amount, including goodwill. If this step indicates impairment, then the second step is performed to measure the loss as the excess of recorded goodwill over its implied fair value. Implied fair value is the excess of the fair value of the reporting unit over the fair value of all identified assets and liabilities.
We examined goodwill for impairment in the fourth quarter of each fiscal year ended December 31, 2011, 2012, and 2013. When assessing goodwill for impairment, we chose to bypass the qualitative assessment and directly perform the quantitative assessment. Because our stock is not publicly-traded, we estimated the fair value of our common stock, as discussed in “—Common Stock Valuations” below to derive the fair value of our reporting unit. We compared the fair value of our reporting unit with its carrying amount including goodwill. The first step of the quantitative assessment indicated that the fair value of our reporting unit was significantly higher than the carrying amount
-82-
Table of Contents
including goodwill, and hence we were not required to perform the second step. Based on our quantitative assessment, we concluded that goodwill was not impaired during the years ended December 31, 2011, 2012 and 2013.
Stock-Based Compensation
Compensation expense related to stock-based transactions is measured and recognized in the financial statements based on the fair value of the awards granted. We have granted (i) employee and non-employee director stock options and (ii) restricted stock units, or RSUs.
Stock Options
The fair value of each option award is estimated on the grant date using the Black-Scholes option-pricing model. Stock-based compensation expense is recognized, net of forfeitures, on a straight-line basis over the requisite service periods of the awards, which is generally four years. Our use of the Black-Scholes option-pricing model requires the input of highly subjective assumptions, including the fair value of the underlying common stock, the expected term of the option, the expected volatility of the price of our common stock, risk-free interest rates, and the expected dividend yield of our common stock. The assumptions used in our option-pricing model represent management’s best estimates. These estimates involve inherent uncertainties and the application of management’s judgment. If different assumptions or estimates were used, our stock-based compensation expense could be materially different in the future.
These assumptions and estimates are as follows:
Fair value of our common stock. Because our stock is not publicly-traded, we must estimate the fair value of our common stock, as discussed in “—Common Stock Valuations” below.
Expected Term. The expected term represents the period that our stock-based awards are expected to be outstanding before exercise or cancellation. Through June 30, 2014, our historical share option exercise experience did not provide a reasonable basis upon which to estimate an expected term because of a lack of sufficient data points, and we estimated the expected term using the simplified method determined as the average between the vesting date and the contractual term of the stock options.
Volatility. As we do not have a trading history for our common stock, the expected stock price volatility for our common stock was estimated by taking the average of the historical volatilities of a group of publicly-listed peer companies in our industry based on daily price observations over a period approximately equal to the expected term. When making the selections of the comparable publicly-traded peers to be used in the volatility calculation, we considered the size, operational and economic similarities to our principal business operations.
Risk-Free Interest Rate. We base the risk-free interest rate on the implied yield available on U.S. Treasury zero-coupon issues with a remaining time to maturity equivalent to that of the expected term of the options.
Dividend Yield. The expected dividend assumption is based on our current expectations about our anticipated dividend policy. Consequently, we used an expected dividend yield of zero.
-83-
Table of Contents
The following table summarizes the assumptions used in the Black-Scholes option-pricing model to determine the fair value of our stock options as follows:
| Year Ended December 31, | Six Months Ended June 30, |
|||||||||||||||||||
| 2011 | 2012 | 2013 | 2013 | 2014 | ||||||||||||||||
| Dividend rate |
— | — | — | — | — | |||||||||||||||
| Risk-free interest rate |
2.2 | % | 1.0 | % | 1.0 | % | 0.9 | % | 2.0 | % | ||||||||||
| Contractual term (in years) |
6.1 | 6.0 | 6.1 | 6.1 | 6.0 | |||||||||||||||
| Expected volatility |
45 | % | 50 | % | 49 | % | 50 | % | 40 | % | ||||||||||
In addition to the assumptions used in the Black-Scholes option-pricing model, we must also estimate a forfeiture rate to calculate the stock-based compensation expense for our awards. Our forfeiture rate is based on an analysis of our actual forfeitures. We will continue to evaluate the appropriateness of the forfeiture rate based on actual forfeiture experience, analysis of employee turnover and other factors. Quarterly changes in the estimated forfeiture rate can have a significant impact on our stock-based compensation expense as the cumulative effect of adjusting the rate is recognized in the period the forfeiture estimate is changed.
We will continue to use judgment in evaluating the assumptions related to our stock-based compensation on a prospective basis. As we continue to accumulate additional data related to our common stock, we may have refinements to our estimates, which could materially impact our future stock-based compensation expense.
RSUs
Our stock-based compensation expense for RSUs is estimated at the grant or modification date based on the fair value of our common stock. During 2013, we granted 2.2 million RSUs which vest upon the satisfaction of both a performance condition and a service condition. The performance condition includes, among other alternatives, an initial public offering, or IPO, no later than September 30, 2014. The service condition for the awards is satisfied if the RSU holder continues to be a service provider six months after an IPO, and the awards vest quarterly over 2 1⁄2 years from that date. RSUs for which the service condition or performance condition has not been satisfied are forfeited. During the six months ended June 30, 2014, we granted 4.0 million RSUs which vest upon the satisfaction of both a performance condition and a service condition. The performance condition includes, among other alternatives, the completion of an IPO no later than May 15, 2017. The service condition for the awards is satisfied if the RSU holder continues to be a service provider through the applicable annual vesting dates. As of June 30, 2014, we had not recognized any stock-based compensation expense for the RSUs, because the completion of our IPO had not occurred and was not probable of occurrence. Although the performance condition for the RSUs will be satisfied on a date subsequent to the IPO, because the satisfaction of the performance condition becomes probable upon the completion of our IPO, provided the services have been performed as of such date, we will record a significant cumulative stock-based compensation expense for these RSUs in the quarter in which the IPO occurs, using the accelerated attribution method, net of estimated forfeitures. The remaining unrecognized stock-based compensation expense related to the RSUs will be recorded over the remaining requisite service period using the accelerated attribution method, net of estimated forfeitures. If the qualifying liquidity event had occurred as of the beginning of the year ended December 31, 2013, we would have recorded $1.8 million of stock-based compensation expense related to these RSUs, net of estimated forfeitures, in that year.
If the qualifying liquidity event had occurred as of the beginning of the six months ended June 30, 2014, we would have recorded $2.5 million of stock-based compensation expense related to these
-84-
Table of Contents
RSUs, net of estimated forfeitures, in that quarter, and total unrecognized compensation expense, net of forfeitures, would be $4.6 million that would be recognized over a weighted-average period of approximately 1.9 years.
Common Stock Valuations
We are required to estimate the fair value of the common stock underlying our share-based awards and do so by performing the fair value calculations with the Black-Scholes option-pricing model. The fair values of the common stock underlying our share-based awards were determined by our board of directors, with input from management and contemporaneous third-party valuations. We believe that our board of directors has the relevant experience and expertise to determine the fair value of our common stock.
Given the absence of a public trading market of our common stock, and in accordance with the American Institute of Certified Public Accountants Practice Guide, Valuation of Privately-Held-Company Equity Securities Issued as Compensation, our board of directors exercised reasonable judgment and considered numerous objective and subjective factors to determine the best estimate of the fair value of our common stock including:
| • | contemporaneous valuations performed by independent third-party specialists; |
| • | the market performance of publicly traded companies that we believe to be comparable; |
| • | recent issuances of our convertible preferred stock as well as the prices, rights, preferences and privileges of our convertible preferred stock relative to those of our common stock; |
| • | recent private stock sale transactions; |
| • | the lack of marketability of our common stock; |
| • | hiring of key personnel and the experience of our management; |
| • | the history of the company and the introduction of new services; |
| • | our stage of development; |
| • | the likelihood of achieving a liquidity event, such as an initial public offering or a sale of our company given prevailing market conditions; |
| • | actual operating and financial performance; |
| • | the present value of future cash flows; |
| • | the U.S. and global capital market conditions; and |
| • | illiquidity as a private company. |
In valuing our common stock through July 2013, our board of directors determined the equity value of our business using the income and market approaches to valuation. Specifically, the guideline public company method was considered under the market approach. When applicable, third-party stock transactions were also considered.
The income approach estimates the fair value of a company based on the present value of the company’s future estimated cash flows and the residual value of the company beyond the forecast period. These future values are discounted to their present values to reflect the risks inherent in the Company achieving these estimated cash flows. Significant inputs of the income approach (in addition to our estimated future cash flows themselves) include the long-term growth rate assumed in the residual value, discount rate and normalized long-term operating margin.
-85-
Table of Contents
The market comparable approach estimates value based on a comparison of the subject company to comparable public companies in a similar line of business. From the comparable companies, a representative market value of invested capital multiple is determined which is applied to the subject company’s operating results to estimate the value of the subject company. In our valuations, the multiple of the comparable companies was determined using a ratio of the market value of invested capital less cash to historical or projected revenue and was applied to our corresponding metric to estimate the market value of invested capital under this approach.
The prior sales of company stock method estimates the value by considering any prior arm’s length sales of our equity. When considering prior sales of our equity, the valuation considers the size of the equity sale, the relationship of the parties involved in the transaction, the timing of the equity sale, and our financial condition at the time of the sale. That such sales provide value indications of varying reliability was considered in context in order to establish the relative weight assigned to the indication as compared to the other indications noted above. The fair value guidance provided by Accounting Standards Codification Topic 820 Fair Value Measurements and Disclosures discusses three levels of inputs on the definition of fair value and defined levels of value, each of which was considered when assessing the reliance on a sale of common stock.
For the April 2013 grant, a 25.0% weighting was assigned to the secondary market transaction that occurred on March 15, 2013, given that the investors were known to us and were provided financial information. While the investors appeared to have been knowledgeable investors, we took into account that pricing was based on a transaction that initially closed in July 2012. Given the passage of time and our progression over this timeframe, a 25.0% weighting was considered reasonable for this transaction. Although continued reliance was placed on this secondary market transaction through July 2013, a reduced weighting of 20.0% was used in July 2013 due to the passage of time relative to the initial transaction date. The November 2013 grant did not rely on any secondary market transactions as the transaction that occurred in March 2013 was considered outdated and no more recent secondary market transactions had taken place.
Once an equity value was determined, we utilized the option pricing method, or OPM, to allocate the equity value to each of our classes of preferred and common stock. The option method relies on financial option theory to allocate value among different classes of equity based upon a future option “claim” on value. Under the option allocation methodology, the fair value of the common stock is estimated as the net value of a series of call options, representing the present value of the expected future returns to the common shareholders. Essentially, the equity claims of the common shareholders are equivalent to a call option on the common stock’s participation in the value of the company above the respective preferred shareholders’ liquidation preferences. Thus, the common stock can be valued by estimating the value of its share in each of these call option rights.
For the valuations through July 2013, we used the OPM due primarily to our early stage of development, lack of availability and reliability of estimates regarding the nature and timing horizons for exit outcomes, number and materiality of assumptions required, and availability of information. As we obtained a greater degree of information regarding possible exit events, including various IPO and potential strategic sales scenarios, we transitioned the methodology to the Probability Weighted Expected Return Method, or PWERM, which was utilized in the October 2013 valuation.
In October 2013, since the board of directors believed that the discrete future outcomes could be predicted at a high confidence level with a probability distribution, the PWERM was utilized to determine the enterprise value of our business using various exit scenarios and values. The PWERM involves a forward-looking analysis of the possible future outcomes of the enterprise. This method is particularly useful when discrete future outcomes can be predicted with greater confidence level with a corresponding probability assessment. Discrete future outcomes considered under the PWERM included
-86-
Table of Contents
non-initial public offering market based outcomes as well as initial public offering scenarios. In the non-initial public offering scenarios, a large portion of the equity value is allocated to the preferred stock to reflect the preferred stock liquidation preferences. In the initial public offering scenarios, the equity value is allocated pro rata among the shares of common stock and each series of preferred stock, which causes the common stock to have a higher relative value per share than under the non-initial public offering scenario. The fair value of the enterprise determined using the initial public offering and non-initial public offering scenarios was weighted according to the board of directors’ estimate of the probability of each scenario. Future amounts were discounted to present value at a risk adjusted rate.
We granted stock options and RSUs since January 1, 2013 as follows:
| Grant Dates |
Shares Underlying RSUs |
Shares Underlying Options |
Exercise Price Per Share (options) |
Common Stock Fair Value Per Share at Grant Date |
||||||||||||
| April 2013(1)(2) |
2,150,000 | 9,945,500 | $ | 0.85 | $ | 0.85 | ||||||||||
| July 2013(1)(2) |
95,000 | — | $ | — | $ | 0.85 | ||||||||||
| November 2013 |
— | 644,750 | $ | 1.00 | $ | 1.00 | ||||||||||
| April 2014(3) |
1,581,468 | 6,005,139 | $ | 1.20 | $ | 1.20 | ||||||||||
| May 2014(4) |
2,361,000 | 2,425,000 | $ | 1.21 | $ | 1.21 | ||||||||||
| June 2014(5) |
42,000 | 462,000 | $ | 1.22 | $ | 1.22 | ||||||||||
| (1) | The RSUs vest upon the satisfaction of both a performance condition and a service condition. The performance condition includes, among other alternatives, an IPO no later than September 30, 2014. The service condition for the awards is satisfied if the RSU holder continues to be a service provider six months after an IPO, and the awards vest quarterly over 2 1⁄2 years from that date. RSUs for which the service condition or performance condition has not been satisfied are forfeited. |
| (2) | The performance condition was modified in March 2014. There was no modification of the service condition. We considered the fair value of our common stock as of the March 2014 modification date $1.20 to determine the fair value of the RSUs which is used in calculating stock based compensation expense related to RSUs. |
| (3) | For awards granted to officers and employees, 25% of the underlying shares of such RSUs vest on May 15 of each of 2015, 2016, 2017 and 2018. For awards granted to non-employee directors (with the exception of Mr. Felt), 100% of the underlying shares of such RSUs vest on the earlier of May 15, 2015 or the date of our next annual stockholder meeting. For awards granted to Mr. Felt, 33 1/3 of the underlying shares of such RSUs vest on May 15 of each of 2015, 2016 and 2017. However, in each case if such vesting date is earlier than the first to occur of either a change in control, as defined under our 2009 Equity Incentive Plan, or the date that is six months and one day following the completion of our initial public offering (the “Post IPO Date”), then the related vesting shall occur on either the change in control or the Post IPO Date, as applicable, and further provided that in all cases vesting shall be subject to continued service through the applicable vesting date. Notwithstanding the foregoing vesting schedule, in the event that neither a change in control nor an initial public offering occurs on or prior to May 15, 2017, the RSUs and service provider’s right to acquire any shares thereunder will terminate automatically upon such date. We considered the fair value of our common stock of $1.20 as of April 1, 2014 to determine the fair value of the RSUs which is used in calculating stock based compensation expense related to the RSUs. |
| (4) | 25% of the underlying shares of such RSUs vest on May 15 of each of 2015, 2016, 2017 and 2018. However, in each case if such vesting date is earlier than the first to occur of either a change in control, as defined under our 2009 Equity Incentive Plan, or the Post IPO Date, then the related vesting shall occur on either the change in control or the Post IPO Date, as applicable, and further provided that in all cases vesting shall be subject to continued service through the |
-87-
Table of Contents
| applicable vesting date. Notwithstanding the foregoing vesting schedule, in the event that neither a change in control nor an initial public offering occurs on or prior to May 15, 2017, the RSUs and service provider’s right to acquire any shares thereunder will terminate automatically upon such date. We considered the fair value of our common stock of $1.21 as of May 8, 2014 to determine the fair value of the RSUs which is used in calculating stock-based compensation expense related to the RSUs. |
| (5) | 25% of the underlying shares of such RSUs vest on May 15 of each of 2015, 2016, 2017 and 2018. However, in each case if such vesting date is earlier than the first to occur of either a change in control, as defined under our 2009 Equity Incentive Plan, or the Post IPO Date, then the related vesting shall occur on either the change in control or the Post IPO Date, as applicable, and further provided that in all cases vesting shall be subject to continued service through the applicable vesting date. Notwithstanding the foregoing vesting schedule, in the event that neither a change in control nor an initial public offering occurs on or prior to May 15, 2017, the RSUs and service provider’s right to acquire any shares thereunder will terminate automatically upon such date. We considered the fair value of our common stock of $1.22 as of June 30, 2014 to determine the fair value of the RSUs which is used in calculating stock-based compensation expense related to the RSUs. |
No single event caused the valuation of our common stock to increase or decrease from January 2013 through June 2014. Instead, a combination of the factors described below in each period led to the changes in the fair value of the underlying common stock.
Significant factors considered by our board of directors at these grant dates, in determining the fair value of our common stock and exercise price used to calculate the related stock based compensation expense, include:
April 2013
We granted options to purchase 9,945,500 shares of common stock during April 2013 with an exercise price of $0.85. The exercise price and fair value of the underlying common stock used to calculate the related stock-based compensation was determined by our board of directors with assistance from management and was consistent with a draft preliminary contemporaneous independent third-party valuation report available in April and subsequently finalized and issued without change on May 1, 2013.
The May 1, 2013 valuation was prepared on a minority, non-marketable interest basis and the enterprise value was determined using an income approach and market approach. We determined that we had equal confidence in both approaches and, therefore, weighted them equally to determine our enterprise value, before allocating to the preferred and common stock and applying any lack of marketability discounts. Under the income approach, a discount rate of 19% was determined to be reasonable and appropriate given our stage of development and inherent risks. An exit revenue multiple of 3.0x was selected to estimate the terminal value. Under the market approach, revenue market multiples for the two sets of guideline companies were applied to the Company’s fiscal year end 2013 and 2014 metrics and adjusted for cash and debt to estimate the value under the market approach.
We then allocated our enterprise value to the common stock utilizing two types of OPM models with the following assumptions: a time to a liquidity event of 1.0 year, a risk-free rate of 0.1% and a historical equity volatility of 50% based on the time to a liquidity event. The first OPM model considered the rights and preferences of the common and preferred classes, whereas the second OPM model considered a fully diluted capital structure, which represents an IPO exit.
Subsequent to the allocation to the preferred and common equity classes, an 18% marketability discount was applied to the resulting common stock value from the two OPM models. To estimate the
-88-
Table of Contents
fair value of our common stock, we applied a 75% weighting of the OPM results and a 25% weighting of the recent secondary common stock transaction that occurred on March 15, 2013. This resulted in the fair value of our common stock to be in the range of $0.73 - $0.79 per share. On March 15, 2013, an outside investor purchased certain shares of common stock from existing employees at $0.85 per share. There had been no other secondary transaction between July 2012 and March 2013. Based on this valuation and the price indication from the secondary transaction of $0.85 per share, our board of directors determined that the price from the secondary transaction of $0.85 per share was more appropriate to use as exercise price for the options granted in April 2013, which was deemed to be the fair value of our common stock on the grant date.
November 2013
We granted options to purchase 644,750 shares of common stock in November 2013 with an exercise price of $1.00. The performance condition of the outstanding 2.2 million RSUs originally issued in April 2013 was also modified in November 2013. The exercise price and fair value of the underlying common stock used to calculate the related stock-based compensation was determined by our board of directors with assistance from management and was consistent with a contemporaneous third-party valuation report dated October 29, 2013, which determined the fair value of our common stock to be $1.00 per share.
The October 29, 2013 valuation was prepared on a minority, non-marketable interest basis. This valuation was based on the PWERM instead of an OPM as previously applied given that exit scenarios and values were available. At the time of this valuation, the range of discrete events, specifically IPO and non-IPO scenarios, were fairly well established; therefore, PWERM was utilized to estimate the fair value of our common stock during this period. The equity values for each of these scenarios were developed by management and our board of directors by considering their best estimate for values under each scenario.
Under the initial public offering scenario, the future equity value of the company was developed by management by considering recent IPO pricing data in our industry. We selected implied revenue to enterprise value multiples for 2014 and 2015. After estimating the enterprise value, we adjusted for estimated cash and debt to arrive at an equity value on a marketable, minority interest basis.
Under the strategic and private equity sale scenarios, the future values of the company under these scenarios was developed by management based on its assessment of the potential value that might be realized in such transactions. We then assigned probabilities to an IPO, a strategic sale or a private equity sale based on management’s assessment of the relative likelihood of those scenarios.
The weighted average and probability affected enterprise value was then allocated to our convertible preferred stock and common stock under the PWERM, after applying a discount rate of 20% to the future values noted above. Subsequent to the allocation to the preferred and common equity classes, a 16% marketability discount was applied to the resulting common stock value. Based on this valuation and other factors, as described above, our board of directors used $1.00 per share as the exercise price for the options granted on November 14, 2013, which was deemed to be the fair value of our common stock on the grant date. The fair value of our common stock of $1.00 was also used to calculate the fair value of the RSUs modified in November 2013 and related stock based compensation. The change in the fair value was due to a reduction in time to a liquidity event.
April 2014
We granted options to purchase 6,005,139 shares of common stock in April 2014 with an exercise price of $1.20 and 1,581,468 RSUs. The exercise price and fair value of the underlying common stock
-89-
Table of Contents
used to calculate the related stock-based compensation was determined by our board of directors with assistance from management and was consistent with a contemporaneous third-party valuation report dated April 1, 2014, which determined the fair value of our common stock to be $1.20 per share.
The April 1, 2014 valuation was prepared on a minority, non-marketable interest basis. This valuation was based on the PWERM, consistent with the November 2013 valuation. The equity values for the range of discrete events, specifically IPO and non-IPO scenarios, were developed by management and our board of directors by considering their best estimate for values under each scenario.
Under the initial public offering scenario, the future equity value of the company was developed by management by considering recent IPO pricing data in our industry. We selected implied revenue to enterprise value multiples for 2014 and 2015. After estimating the enterprise value, we adjusted for estimated cash and debt to arrive at an equity value on a marketable, minority interest basis. Under the strategic and private equity sale scenarios, the future values of the company under these scenarios was developed by management based on its assessment of the potential value that might be realized in such transactions. We then assigned probabilities to an IPO, a strategic sale or a private equity sale based on management’s assessment of the relative likelihood of those scenarios.
The weighted average and probability affected enterprise value was then allocated to our convertible preferred stock and common stock under the PWERM, after applying a discount rate of 20% to the future values noted above. Subsequent to the allocation to the preferred and common equity classes, a 12% marketability discount was applied to the resulting common stock value. Based on this valuation and other factors, as described above, our board of directors used $1.20 per share as the exercise price for the options granted on April 1, 2014, which was deemed to be the fair value of our common stock on the grant date. The fair value of our common stock of $1.20 was also used to calculate the fair value of the RSUs granted in April 2014 and RSUs originally granted in April 2013 and modified in April 2014, along with the related stock based compensation.
May 2014
We granted options to purchase 2,425,000 shares of common stock in May 2014 with an exercise price of $1.21 and 2,361,000 RSUs. The exercise price and fair value of the underlying common stock used to calculate the related stock-based compensation was determined by our board of directors with assistance from management and was consistent with a contemporaneous third-party valuation report dated May 9, 2014, which determined the fair value of our common stock as of May 8, 2014 to be $1.21 per share.
The May 8, 2014 valuation was prepared on a minority, non-marketable interest basis. This valuation was based on the PWERM, consistent with the November 2013 and April 2014 valuations. The equity values for the range of discrete events, specifically IPO and non-IPO scenarios, were developed by management and our board of directors by considering their best estimate for values under each scenario.
Under the initial public offering scenario, the future equity value of the company was developed by management by considering recent IPO pricing data in our industry. We selected implied revenue to enterprise value multiples for 2014 and 2015. After estimating the enterprise value, we adjusted for estimated cash and debt to arrive at an equity value on a marketable, minority interest basis. Under the strategic and private equity sale scenarios, the future values of the company under these scenarios was developed by management based on its assessment of the potential value that might be realized in such transactions. We then assigned probabilities to an IPO, a strategic sale or a private equity sale based on management’s assessment of the relative likelihood of those scenarios.
The weighted average and probability affected enterprise value was then allocated to our convertible preferred stock and common stock under the PWERM, after applying a discount rate of
-90-
Table of Contents
20% to the future values noted above. Subsequent to the allocation to the preferred and common equity classes, a 12% marketability discount was applied to the resulting common stock value. Based on this valuation and other factors, as described above, our board of directors used $1.21 per share as the exercise price for the options granted on May 8, 2014, which was deemed to be the fair value of our common stock on the grant date. The fair value of our common stock of $1.21 was also used to calculate the fair value of the RSUs granted in May 2014.
June 2014
We granted options to purchase 462,000 shares of common stock in June 2014 with an exercise price of $1.22 and 42,000 RSUs. The exercise price and fair value of the underlying common stock used to calculate the related stock-based compensation was determined by our board of directors with assistance from management and was consistent with a contemporaneous third-party valuation report dated June 30, 2014, which determined the fair value of our common stock as of June 30, 2014 to be $1.22 per share.
The June 30, 2014 valuation was prepared on a minority, non-marketable interest basis. This valuation was based on the PWERM, consistent with the November 2013, April 2014 and May 2014 valuations. The equity values for the range of discrete events, specifically IPO and non-IPO scenarios, were developed by management and our board of directors by considering their best estimate for values under each scenario.
Under the initial public offering scenario, the future equity value of the company was developed by management by considering recent IPO pricing data in our industry. We selected implied revenue to enterprise value multiples for 2014 and 2015. After estimating the enterprise value, we adjusted for estimated cash and debt to arrive at an equity value on a marketable, minority interest basis. Under the strategic and private equity sale scenarios, the future values of the company under these scenarios was developed by management based on its assessment of the potential value that might be realized in such transactions. We then assigned probabilities to an IPO, a strategic sale or a private equity sale based on management’s assessment of the relative likelihood of those scenarios.
The weighted average and probability affected enterprise value was then allocated to our convertible preferred stock and common stock under the PWERM, after applying a discount rate of 20% to the future values noted above. Subsequent to the allocation to the preferred and common equity classes, a 12% marketability discount was applied to the resulting common stock value. Based on this valuation and other factors, as described above, our board of directors used $1.22 per share as the exercise price for the options granted on June 30, 2014, which was deemed to be the fair value of our common stock on the grant date. The fair value of our common stock of $1.22 was also used to calculate the fair value of the RSUs granted in June 2014.
Income Taxes
We account for income taxes using the asset and liability method, which requires the recognition of deferred tax assets and liabilities for the expected future tax consequences of events that have been recognized in our financial statements or tax returns. In addition, deferred tax assets are recorded for the future benefit of utilizing net operating losses and research and development credit carryforwards. Valuation allowances are provided when necessary to reduce deferred tax assets to the amount expected to be realized.
Significant judgment is required in determining any valuation allowance recorded against deferred tax assets. In assessing the need for a valuation allowance, we consider all available evidence, including past operating results, estimates of future taxable income, and the feasibility of tax planning strategies. In the event that we change our determination as to the amount of deferred tax assets that
-91-
Table of Contents
can be realized, we will adjust our valuation allowance with a corresponding impact to the provision for income taxes in the period in which such determination is made. Estimates of future taxable income are based on assumptions that are consistent with our plans. Assumptions represent management’s best estimates and involve inherent uncertainties and the application of management’s judgment. Should actual amounts differ from our estimates, the amount of our tax expense and liabilities could be materially impacted.
We apply the authoritative accounting guidance prescribing a threshold and measurement attribute for the financial recognition and measurement of a tax position taken or expected to be taken in a tax return. We recognize liabilities for uncertain tax positions based on a two-step process. The first step is to evaluate the tax position for recognition by determining if the weight of available evidence indicates that it is more likely than not that the position will be sustained on audit, including resolution of related appeals or litigation processes, if any. The second step requires us to estimate and measure the tax liability as the largest amount that is more likely than not to be realized upon ultimate settlement.
Significant judgment is also required in evaluating our uncertain tax positions and determining our provision for income taxes. Although we believe our liabilities for uncertain tax positions are reasonable, no assurance can be given that the final tax outcome of these matters will not be different from that which is reflected in our historical income tax provisions and accruals. We adjust these liabilities in light of changing facts and circumstances, such as the closing of a tax audit or the refinement of an estimate. To the extent that the final tax outcome of these matters is different than the amounts recorded, such differences may impact the provision for income taxes in the period in which such determination is made.
Quantitative and Qualitative Disclosures about Market Risk
Market risk is the risk of loss to future earnings, values or future cash flows that may result from changes in the price of a financial instrument. The value of a financial instrument might change as a result of changes in interest rates, exchange rates, commodity prices, equity prices and other market changes. We do not use derivative financial instruments for speculative, hedging or trading purposes, other than as described below. Our market risk exposure is primarily a result of fluctuations in foreign currency exchange rates as described below.
Interest Rate Risk
We are exposed to market risk related to changes in interest rates. Borrowings under the revolving line of credit with Silicon Valley Bank, bear interest at rates that are variable. Increases in the Prime Rate would increase the amount of interest payable under this line of credit. Borrowings outstanding under our previous credit arrangements were not subject to interest rate risk because they bore interest at fixed rates. We do not believe that an increase or decrease in interest rates of 100 basis points would have a material effect on our operating results or financial condition.
Inflation Risk
We do not believe that inflation has had a material effect on our business, financial condition, or results of operations. We continue to monitor the impact of inflation in order to minimize its effects through pricing strategies, productivity improvements and cost reductions. If our costs were to become subject to significant inflationary pressures, we may not be able to fully offset such higher costs through price increases. Our inability or failure to do so could harm our business, financial condition, and results of operations.
-92-
Table of Contents
Foreign Currency Exchange Risk
We have costs denominated in foreign currencies, primarily the Indian Rupee. This exposes us to the risk of fluctuations in foreign currency exchange rates. Accordingly, changes in exchange rates, and in particular a weakening of the U.S. dollar, would negatively affect our expenses and other operating results as expressed in U.S. dollars. We manage our exposure to fluctuations in the Indian Rupee by entering into forward contracts to cover a portion of our projected expenditures paid in local currency. These contracts generally have a term of less than 12 months.
The notional amount of our forward contracts was $8.7 million, $9.3 million and $10.4 million at December 31, 2012 and 2013 and June 30, 2014, respectively. A sensitivity analysis performed on our hedging portfolio as of June 30, 2014 indicated that a hypothetical 10% appreciation of the U.S. dollar from its value at December 31, 2012 and 2013 and June 30, 2014 would decrease the fair value of our foreign currency contracts by $0.8 million, $0.9 million and $1.0 million, respectively. A hypothetical 10% depreciation of the U.S. dollar from its value at December 31, 2012 and 2013 and June 30, 2014 would increase the fair value of our foreign currency contracts by $1.0 million, $1.0 million and $1.3 million, respectively.
Recently Issued Accounting Pronouncements
In March 2013, the Financial Accounting Standards Board, or FASB, issued an accounting standard update requiring an entity to release into net income the entire amount of a cumulative translation adjustment related to its investment in a foreign entity when as a parent it either sells a part or all of its investment in a foreign entity or no longer holds a controlling financial interest in a subsidiary or group of assets within a foreign entity. This accounting standard update will be effective prospectively for us beginning in the fiscal year 2015. We do not expect the adoption of this accounting standard update will have a material impact on the consolidated financial statements.
In July 2013, the FASB issued a new accounting standard update on the financial statement presentation of unrecognized tax benefits. The new guidance provides that a liability related to an unrecognized tax benefit would be presented as a reduction of a deferred tax asset for a net operating loss carry forward, a similar tax loss or a tax credit carry forward if such settlement is required or expected in the event the uncertain tax position is disallowed. The new guidance becomes effective for us on January 1, 2014 and it should be applied prospectively to unrecognized tax benefits that exist at the effective date with retrospective application permitted. We adopted the guidance in the six months ended June 30, 2014, and there was no material impact of this new guidance on the consolidated financial statements.
In May 2014, the FASB issued an accounting standard update on revenue from contracts with customers, which requires an entity to recognize the amount of revenue to which it expects to be entitled for the transfer of promised goods or services to customers. The new guidance will replace most existing revenue recognition guidance in U.S. GAAP when it becomes effective. The new standard is effective for us on January 1, 2017. Early application is not permitted. The standard permits the use of either the retrospective or cumulative effect transition method. We are evaluating the effect that this new guidance will have on our consolidated financial statements and related disclosures. We have not yet selected a transition method nor have we determined the effect of the standard on our ongoing financial reporting.
Section 107 of the JOBS Act provides that an “emerging growth company” can take advantage of an extended transition period for complying with new or revised accounting standards. However, we chose to “opt out” of such extended transition period, and as a result, we will comply with new or revised accounting standards on the relevant dates adoption of such standards is required for non-emerging growth companies. Our decision to opt out of the extended transition period for complying with new or revised accounting standards is irrevocable.
-93-
Table of Contents
Overview
Yodlee is a leading technology and applications platform powering dynamic innovation for digital financial services in the cloud. We refer to our platform as the Yodlee Financial Cloud. Our vision is to empower lives with innovative digital financial services. Our customers include financial institutions, Internet service companies providing innovative financial solutions and third-party developers of financial applications. More than 750 organizations in over 10 countries use the Yodlee platform to power their consumer-facing digital offerings, and we receive subscription fees for 16.8 million of these consumers, whom we refer to as our paid users.
Our financial institution customers encompass many of the leading financial institutions, including 9 of the 15 largest banks in the United States, which hold 85% of the total assets of the top 15 U.S. banks (based on total assets as of September 30, 2013). These institutions subscribe to the Yodlee platform to power offerings that improve consumer satisfaction and enhance engagement, while capturing cross-sell and up-sell opportunities. We estimate that our current network of financial institution customers alone reaches more than 100 million end users, representing a significant opportunity to grow our paid user base within existing customers. Our customers that are Internet service companies have an increasingly large and diverse base of users that also provides additional growth opportunities.
The Yodlee Financial Cloud delivers a wide variety of financial applications, or FinApps, targeted at the retail financial, wealth management, small business, card and other financial solutions sectors. These FinApps help consumers and small businesses simplify and manage their finances, review their financial accounts, track their spending, calculate their net worth, and perform a variety of other activities. Examples of FinApps include our Expense FinApp, which helps consumers track their spending, and a Payroll FinApp from a third party, which helps small businesses process their payroll. Our platform also enables our customers to develop their own applications through our open application programming interfaces, or APIs, that deliver trusted and secure data, money movement solutions, and other feature functionality.
Our technology infrastructure is designed to provide a highly available and secure multi-tenant cloud-based platform across hundreds of customers and millions of end users. Our solutions use a single code base for all customers and are globally accessible across multiple digital channels. Our multi-tenancy model uses a common data model for all customers but isolates data with logical controls and separate encryption keys for each customer. Our architecture utilizes state-of-the-art technologies to achieve enhanced availability, scalability and security.
We provide subscription services on a business-to-business-to-consumer, or B2B2C, basis to financial services clients, whereby our customers offer Yodlee-based solutions to their customers, whom we refer to as end users. On a business-to-business, or B2B, basis we deliver the same platform to third-party developers. We are a big data practitioner providing our customers with data analytics and market research services that enhance the value of our solutions and anonymized data derived from a massive and dynamic set of end user-permissioned transaction-level data that we gather and refine. We believe that our brand leadership, innovative technology and intellectual property, large customer base, and unique data gathering and enrichment provide us with competitive advantages that have enabled us to generate strong growth.
Financial institutions today operate in a highly fragmented, complex and regulated environment. At the same time, consumers and small businesses struggle to manage their increasingly complex finances, often across multiple online financial accounts at a variety of financial institutions, each with a different interface and login procedure. In addition, a new wave of Internet services companies are
-94-
Table of Contents
changing the way that consumers and small businesses manage their finances and transact online. As competition in the financial services industry has increased and financial institutions have concentrated resources on the sale of financial products, these institutions are seeking innovative technology solutions to improve their end users’ experience and enhance engagement, while capturing data-driven cross-sell and up-sell opportunities.
The financial services industry is undergoing a technological shift. Outdated enterprise hardware and software is being replaced by cloud-driven solutions that are easier and less expensive to implement, update and manage. Banks continue to spend heavily on IT in order to compete effectively in an increasingly competitive environment. Celent, an international financial research and consulting firm, estimates that in 2013 U.S. and Canadian banks alone spent a total of $11.3 billion on external software, which includes purchasing costs and licensing fees associated with third-party packaged software solutions. In addition, Celent estimates that European banks spent $13.4 billion on external software in 2013, bringing total spend on external software by U.S., Canadian and European banks to $24.7 billion. Celent projects that this combined spending will increase to $29.5 billion in 2015. We believe as financial institutions continue to spend on technology, a growing proportion of that spending will shift from outdated internally-developed or custom-built enterprise software to cloud-based solutions. In addition to the large opportunity that we have with traditional financial institutions, we believe that we also have a significant opportunity with Internet services companies providing innovative financial solutions.
We serve two main customer groups, financial institutions, or FI, customers and Internet services companies providing innovative financial solutions, which we refer to as our Yodlee Interactive, or YI, customers. Yodlee provides FI customers with access to FinApps, which can be subscribed to individually or in combinations, that include personal financial management, wealth management, card, payments and small-medium business, or SMB, solutions. We also provide our FI customers with trusted and secure access to our platform via APIs that enable them to receive end user-permissioned data that we aggregate, cleanse, and distribute, as well as our money movement solutions. Our YI customers are Internet services companies and third-party developers, who use our platform to develop new applications and enhance existing solutions. Our YI customers operate in a number of sub-vertical markets, including wealth management, personal financial management, small business accounting, small business lending and authentication. These customers use the Yodlee platform to build solutions that leverage our open APIs and access to a large end user base. In addition to aggregated transaction-level account data, we provide YI customers with secure access to account verification, money movement and risk assessment tools via our APIs. We play a critical role in bringing innovation from Internet services companies to financial institutions through the Yodlee Financial Cloud. For example, our YI customers use our solutions in such diverse applications as providing working capital to small businesses online; personalized financial management, planning and advisory services; ecommerce payment solutions; and online accounting systems for small businesses. We provide access to our solutions across multiple channels, including web, tablet and mobile.
We also offer data analytics and market research services that enhance the value of our solutions to our customers and provide anonymized data derived from a massive and dynamic set of end user-permissioned transaction-level data that we gather and refine. Our platform collects a wide variety of end user data from over 12,500 sources and puts it in a common repository. Beyond collecting the data, our platform performs a data refining process and augments the data with additional information from a variety of other sources. We enrich the data with a proprietary twelve-step process, adding such elements as categorization and merchant identification for bank or credit card account data and investment holding identification for investment account data. With this enhanced data, we enable our customers to offer better applications and more personalized solutions to end users.
-95-
Table of Contents
Our solutions benefit our customers and their end users in a wide variety of ways. For both our FI and YI customers, providing Yodlee-powered solutions improves their end user satisfaction and retention, accelerates speed to market, creates technology savings and enhances their data analytics and market research capabilities. For our customers’ end users, our solutions provide better access to their financial information and more control over their finances, leading to more informed and personalized decision making. For our customers who are members of the developer community, our solutions provide access to critical data and payments solutions, faster speed to market and enhanced distribution.
We believe a large addressable market and the need for innovative digital financial services give us the opportunity to grow considerably in the near term. Our growth strategy addresses two key drivers of our business: number of paid users and revenue per paid user. As we look to grow the number of paid users on our platform, we intend to focus on increasing penetration within our existing customer base, signing new customers and expanding internationally. We also intend to drive additional revenue per paid user by introducing new solutions like data analytics and market research services and by pursuing revenue-sharing opportunities from premium FinApps.
In 2013, our revenue increased by 21% to $70.2 million, driven largely by an increase in subscription revenue, which grew 28% from the year ended December 31, 2012, offset by a 1% decrease in professional services and other revenue. During the six months ended June 30, 2014, our revenue increased by 29% to $41.1 million, driven by an increase in subscription revenue, which grew 34% from the six months ended June 30, 2013. A substantial proportion of our revenues has been derived from contractually-recurring subscription and support revenues, and our solutions are integrated into our customers’ business processes driving strong customer retention. Our subscription and support revenue net retention rate, which we use as a measure of our ability to retain our customers through renewals of subscription agreements and to expand the number of our paid users, was 115%, 114% and 123% for the years ended December 31, 2011, 2012, and 2013, respectively, and 119% and 123% for the six months ended June 30, 2013 and 2014, respectively. See “—Management’s Discussion and Analysis of Financial Condition and Results of Operations—Key Metrics.” We generate revenues primarily from subscription and support fees and professional service fees. Subscription and support revenue has been a growing majority of our revenues and accounted for 81% and 85% of our revenue during the year ended December 31, 2013 and the six months ended June 30, 2014, respectively.
Our customer agreements typically provide for an initial three-year term, and many have a majority of subscription and support revenue derived from committed minimum fees pursuant to which our customers generally commit to a minimum level of paid users. As paid users grow across our platform in excess of the guaranteed minimum level, customers are required to pay additional usage fees. As usage increases and customers are required to pay additional usage fees, over time a more significant proportion of our revenue may be derived from usage by paid users. We also generate revenue from professional services, primarily relating to the implementation and configuration of our solutions for our customers. The contractual nature of a significant proportion of our revenue, together with favorable revenue retention rates, have historically assisted us in predicting our near-term revenues and reduced the variability of our projected revenue and cash flows.
Industry Background
Consumers and Small Businesses are Struggling to Effectively Manage Their Finances
The complex and fragmented nature of the financial industry makes managing finances a stressful and frustrating activity for consumers and small businesses. According to The Boston Consulting Group, in 2012 a majority of customer contacts with banks took place through online or mobile channels, and in 2020 roughly two-thirds of service and transaction activities are expected to be
-96-
Table of Contents
handled through those channels. According to a 2013 survey conducted by CEB TowerGroup, the average consumer over the age of 30 holds more than 12 distinct financial accounts and products across several institutions and CEB TowerGroup estimates that the average U.S. consumer has more than 8 billing relationships. Having multiple accounts requires the navigation of a variety of user interfaces and management of multiple sets of logins. Maintaining this number of disparate accounts can be complex, frustrating and time consuming as consumers struggle to gain an accurate and holistic view of their personal finances and to manage financial tasks like monitoring cash balances, budgeting and paying bills. Small businesses also struggle with effectively managing basic financial tasks, such as cash flow and expense management, invoicing and payroll. These event-driven processes are fragmented, giving rise to the need for a centralized platform that can consolidate consumers’ and small businesses’ finances and make these necessary everyday tasks seamless, integrated and able to be performed across multiple channels.
Widespread improvements in consumer-facing technologies in other sectors, such as media (Apple in music, Netflix/Hulu/Vudu in video), employee benefits (Benefitfocus), local service access (OpenTable, Yelp, Uber, Angie’s List), and navigation (Google, Inrix, NavTeq), are driving user expectations for simpler and easier experiences in managing their finances. A similar opportunity to innovate exists within the digital financial services industry, enabling consumers and small businesses to simplify and more easily manage their finances.
Financial Institutions Have Challenges and Opportunities to Engage and Retain Their Customers
Historically, the banker-customer relationship was rooted in human interaction and underpinned by the importance of customer satisfaction. As competition in the industry increased, FIs began to concentrate more resources on the sale of financial products. Customers have become more likely to fulfill their financial needs with multiple FIs, shopping around for the best mortgage deal, lowest credit card interest rate, or highest savings account rate. FIs are increasingly challenged in retaining their role as a trusted advisor. As a result, FIs are seeking innovative technology solutions to enhance customer engagement while capturing cross-sell and up-sell opportunities.
As FIs compete for more of their customers’ business, customer experience and satisfaction has become increasingly important. Today, customer satisfaction is driven by the ease and functionality of digital financial services, rather than the branch banking experience. Innovators in financial services have begun to build solutions designed for the digital world that provide a superior customer experience—the use of technology to drive both a highly automated and highly personalized experience—to deepen and strengthen the relationship and engagement with their customers. Enabling deeper and better engagement in financial services demands new technology solutions that offer speed to market, security, efficiency and sophisticated data capabilities.
Emerging Internet-Based Financial Services Companies are Paving the Path of Innovation
While FIs invest heavily in new initiatives to enhance their digital capabilities, a new wave of hundreds of Internet services companies is also changing the way consumers and small businesses execute transactions and manage their finances. Offerings like eWallets, virtual currencies and Amazon Payments, and companies like LifeLock, PayPal and Xero, are driving accelerated new user adoption with a range of solutions across multiple markets geared towards simplifying financial interactions, processes, transactions and management. These entities require scalable and secure technology platforms, data and payment capabilities to continue to accelerate their rate of adoption.
Cloud-Based Platforms are Simplifying Software Delivery
According to Gartner, Inc., in 2013, the banking industry was the highest in enterprise IT spending by vertical industry market, worldwide. Celent estimates that IT spending by banks in the
-97-
Table of Contents
United States and Canada will increase to $59.5 billion in 2014. Outdated enterprise software systems are expensive and time-consuming to deploy and to update, and traditionally have had high levels of maintenance. According to Celent, approximately three-quarters of the IT budget at U.S. and Canadian banks, or $43.7 billion in 2014, will be dedicated to maintaining legacy systems and operations. Furthermore, outdated enterprise software deployment makes new solutions difficult to implement, dampening the pace of innovation.
The rise of cloud-based platforms is the result of rapid and significant technological improvements. Because cloud computing enables the delivery of Software-as-a-Service, or SaaS, it is helping to reduce costs, increase speed to market, and enable greater levels of innovation relative to outdated enterprise software. Mission-critical applications can now be delivered reliably without the purchase of costly on-premise software or hardware. Cloud-based platforms permit the development of applications without affecting the common capabilities maintained at the platform layer. Therefore, cloud-based platforms can be leveraged by multiple participants in the ecosystem, including customers and third-party developers, to create better solutions. The shared utility of cloud-based platforms permits a deeper level of vertical and functional specialization and creates an environment that is conducive to rapid and disruptive innovation.
Open Platforms and Application-Level Developer Ecosystems are Driving Innovation Forward
Open platform companies are changing the way innovation occurs across the economy. Enterprise cloud vendors such as salesforce.com, ServiceNow, and Concur, and companies like Amazon.com and Google provide open platforms with highly configurable application layers that are easily extendable into new application functionality by the vendors themselves, their enterprise customers, and third-party developers. Developers use these platforms as a base for rapid and more efficient delivery of innovative digital solutions and services.
As exemplified in other industries, this open platform system can result in an improved experience for the end user, developer, institutional customer and platform provider alike. Products can come to market faster, with better functionality, and these improved solutions can benefit customers, leading to heightened levels of end user demand. For the institutions utilizing these open platforms, developer community-led innovation helps to keep pace with rapidly evolving consumer expectations.
New Technology Platforms are Leveraging Big Data
According to IDC, the volume of digital information created and replicated worldwide will grow approximately 41% annually from 1.8 trillion gigabytes in 2011 to 40 trillion gigabytes in 2020. Given the exponential growth in data, many organizations have not yet developed the infrastructure to leverage these strategic assets.
In the financial services industry, data is highly fragmented and complex and often siloed at not only individual institutions but also within the various business units at a specific institution. We believe there is an opportunity to leverage this data to transform and improve existing processes and procedures around financial management, customer engagement and credit and risk management. As new technologies emerge to organize, process and access this siloed data, new business models that aggregate and syndicate intelligence are turning vast amounts of otherwise unusable information into actionable data used for superior process management and business insight.
Large Addressable Market
In an increasingly mobile and digital world, consumer expectations of financial service providers continue to rise. Consumers are evaluating these providers based in part on the functionality and user
-98-
Table of Contents
experience of their digital services. In this environment, a financial service provider’s ability to create a differentiated user experience for its customers is increasingly important in sustaining a competitive advantage, which requires innovation to help address unsolved consumer problems and an ability to bring these innovations to market quickly. Cloud-based platforms facilitate rapid discovery and implementation of new solutions and enable financial service providers to integrate new solutions more efficiently.
Against this industry backdrop, we believe we have a significant market opportunity. Celent estimates that in 2013 U.S. and Canadian banks alone spent a total of $11.3 billion on external software, which includes purchasing costs and licensing fees associated with third-party packaged software solutions. In addition, Celent estimates that European banks spent $13.4 billion on external software in 2013, bringing total spend on external software by U.S., Canadian and European banks to $24.7 billion. Celent projects that this combined spending will increase to $29.5 billion in 2015.
We also have a significant market opportunity with our YI customer base. Our Internet services customers such as Kabbage, LearnVest, PayPal and Xero have an increasingly large and diverse number of users and the need for a variety of financial solutions to support their development and delivery of innovative financial services. We believe our solutions have the potential to address a wide variety of additional financial and data marketing needs of our YI customers.
We believe a portion of our future growth and addressable market will also come from expansion into large and rapidly growing markets, such as cross-selling within FIs, data analytics and market research services, and online credit information services.
As we continue to expand our presence in the markets outlined above, the number of potential end users who use our solutions increases dramatically. Our potential end user base includes any consumer of financial services on the Internet—and this end user could be a paid user of Yodlee many times over across multiple customers and products. This multiplier effect greatly increases our addressable end user base.
Our Solution
Yodlee is a leading technology and applications platform powering dynamic innovation for digital financial services in the cloud. We refer to our platform as the Yodlee Financial Cloud. We provide subscription services on a B2B2C basis to financial services clients, whereby our customers offer solutions based on our platform to their end users. On a B2B basis we deliver the same platform to third-party developers. We also provide transaction-level data for data analytics and market research services. We serve two main customer groups or channels, FI and YI customers.
Our FI customers encompass many of the leading FIs, including 9 of the 15 largest banks in the United States, which hold 85% of the total assets of the top 15 U.S. banks (based on total assets as of September 30, 2013). We estimate that our current network of FI customers alone reaches more than 100 million end users, representing a significant opportunity to grow our paid user base within existing customers.
-99-
Table of Contents
Our YI customers are Internet services companies providing innovative financial solutions, with an increasingly large and diverse base of users, and third-party developers. Third-party developers benefit from access to critical data and payments capabilities, our faster speed to market and enhanced distribution.
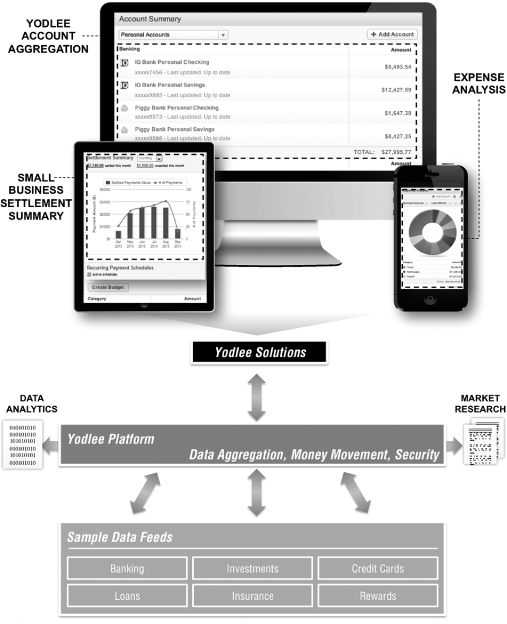
Our platform powers hundreds of FinApps created and made available by us, our customers and third-party developers. FinApps can be sold individually or in combinations and include personal financial management, wealth management, card, payments and SMB solutions. Examples of FinApps are an Expense FinApp that helps a consumer track their spending, or a Payroll FinApp from a third party that can help a small business with processing its payroll. Our open APIs enable us, our FI and YI customers and third-party developers to create new FinApps that can be made available across our broad end user base.
-100-
Table of Contents
We also provide our customers with trusted and secure access to our platform via APIs that enable them to receive end user-permissioned transaction-level data that we aggregate and cleanse. Access to this data enables our customers to create a much more complete view of their end users’ finances, allowing them to make better informed, targeted decisions. We also offer data for data analytics and market research services that enhance the value of our solutions to our customers and provide anonymized data derived from a massive and dynamic set of end user-permissioned transaction-level data that we gather and refine. We collect this data from over 12,500 sources and receive over 75% of it through structured data feeds that are provided under the terms of our contracts with most of our FI customers. These structured feeds, which consist of either batch files pushed to us or real-time access, provide this critical data efficiently and at scale. Where we do not have a data feed in place, we are able to gather consumer data leveraging our proprietary information-gathering techniques.
In addition to aggregated transaction-level account data, we provide our customers with secure access to account verification, money movement and risk assessment tools via our APIs. By using our account verification solutions, customers can verify an end user’s account information, ownership and balance in real time, reducing risk for our customers when interacting with an end user’s checking account. By using our money movement solutions, end users can debit and credit consumer and small business accounts in real time or in batches, route payments between accounts or to other people and pay bills.
We have developed best-in-class security procedures and technologies that are embedded into our platform and applications and meet industry standards as well as the stringent security requirements of our largest FI customers. Our security procedures and technologies are regularly audited by independent security auditors engaged by us, and many of our prospective and current customers conduct their own audits or review the results of such independent security audits as part of their evaluation of our solutions. We are also periodically audited by regulatory agencies to whom our operations or our customers are subject. Our platform is available across multiple channels, including web, tablet and mobile.
Key Benefits
Our solutions drive tangible results for our customers:
| • | Enabling Innovation—The Yodlee platform enables our FI and YI customers to satisfy their mission-critical need to innovate by providing an open platform for the rapid development and deployment of their own financial applications, as well as direct access to applications developed by us and by a broad third-party developer community. Our platform provides solutions, including secure access to aggregated financial data, account verification, money movement and risk assessment tools, that form the core technology allowing many of our YI customers to provide innovative financial solutions. |
| • | Customer Satisfaction / Retention—By deploying the Yodlee platform, our customers are able to provide features and functionality that significantly increase their end users’ engagement with their personal finances, which increases their satisfaction and reduces churn. |
| • | Speed to Market—Our open platform makes it easier for FIs, Internet services companies and third-party developers to create new applications on our platform that can be deployed across our customer base. Our broad network of developers enables solutions to be more rapidly distributed to our customers via our established channels. Our cloud-based platform can make new solutions easier and faster to deploy than outdated enterprise software solutions. When a customer decides to use, or add functionality from, the Yodlee platform, time to deployment can be less than three months. Implementation of internally-developed or custom-built outdated enterprise software solutions can often take multiple years. |
-101-
Table of Contents
| • | Technology Savings—Our solutions often provide our customers with extensive cost savings as compared to outdated internally-developed or custom-built enterprise software solutions, without the need to purchase additional hardware or software. In addition, these solutions can be inefficient to maintain and update. Because the Yodlee platform is cloud-based, updates can be made readily available in a cost-effective manner. For our YI customers, our solutions provide a capital-efficient means of developing their service offerings and reaching end users. |
| • | Enhanced Data Analytics and Market Research Capabilities—Our data aggregation platform provides an opportunity for our customers to leverage transaction-level data for data analytics and market research uses. Through the data we make available, our customers can create a much more complete view of their end users’ finances, allowing them to make better informed targeting decisions. For example, our customers may be able to engage with their end users on new investment and credit solutions. These targeting decisions create cross-sell and up-sell opportunities. In addition, our comprehensive sets of anonymized data enable various market research and trend analyses for multiple use cases. |
Our solutions also provide tangible benefits for end users:
| • | Better Access and Functionality—Our solutions enable customers to aggregate information into a single view of multiple accounts across several financial institutions. We provide end users with access to highly engaging personalized financial applications across multiple channels, such as web, mobile and tablet. |
| • | More Control—Our solutions provide end users with more control over their finances, by providing access to applications designed to make financial tasks like budgeting, saving for a goal and investing for the future easier. These applications are designed to intelligently present financial information in a way that gives end users more control in a seamless, integrated and accessible fashion. |
| • | Informed Personalized Decision Making—Our FinApps ecosystem built on top of the Yodlee platform provides end users with relevant content and applications when they need to take action or make decisions. |
Our solutions also offer benefits to our customers that are members of the developer community:
| • | Enhanced Distribution—We estimate that our current network of FI customers alone reaches more than 100 million end users. This provides developers with large-scale distribution opportunities for their solutions. |
| • | Speed to Market—Access to our unique data platform and our open, secure and trusted APIs enhances speed to market for our developers. |
| • | Access to Critical Data and Payments Capabilities—Our solutions provide developers with critical data and payments capabilities, which allows them to focus their innovation on their unique offerings. |
Competitive Strengths
Since our founding in 1999, we have built a premier and trusted brand in digital financial services. Our competitive strengths include:
Market Leadership with Customers and End Users
We have developed a leading market presence with more than 750 organizations, including 9 of the 15 largest banks in the United States, which hold 85% of the total assets of the top 15 U.S. banks (based on total assets as of September 30, 2013). These organizations include some of the largest and best known retail banks, brokerages, insurance companies, wealth management firms, private
-102-
Table of Contents
banking institutions and card companies. Our platform also enables the emergence or functionality of many innovative Internet services companies. These customer relationships and deployments have taken many years to accomplish, with complex sales cycles and integration efforts. We have 16.8 million paid users and estimate that our current network of FI customers alone reaches more than 100 million end users. We have significant opportunity to grow the number of paid users with existing customers, as well as leverage our market leadership with new customers across our platform. We believe that our ability to retain our customers through renewals of subscription agreements and expand the number of paid users of our applications and services is an indicator of the long-term value of our customer relationships.
Brand Leadership as a Secure and Trusted Partner
Over our 14-year history, we have developed and maintained a commitment to excellence in our product offerings and client engagements. Our brand is reinforced by our stable and growing customer base. A large part of the reputation we have established comes from our commitment to scalability, security, privacy and compliance throughout all of our solutions. We have developed robust security procedures and technologies that are embedded into our platform and applications and meet industry standards as well as the stringent security requirements of our largest FI customers. We employ a comprehensive program of risk-driven policies and procedures that are frequently audited by independent security auditors engaged by us to maximize effectiveness of our information security program.
Unique Big Data Gathering and Enrichment
We are a big data practitioner providing our customers with data analytics and market research services that enhance the value of our solutions and anonymized data derived from a massive and dynamic set of end user-permissioned transaction-level data that we gather and refine. Our big data activities include two key processes:
| • | Data Gathering—Our platform collects a wide variety of end user-permissioned transaction-level data from over 12,500 sources and puts it into a common repository. Currently, over 75% of this data is collected through structured feeds from our FI customers and other FIs. These structured feeds, which consist of either batch files pushed to us or real-time access, provide this critical data efficiently and at scale. This direct data connectivity to large FIs is a significant competitive advantage for us. Where we do not have direct connections, we capture data using our proprietary information-gathering techniques. Our flexible data model allows new and incremental data sources and data elements to be added quickly and efficiently. |
| • | Data Enrichment—Beyond collecting data, our platform performs a data refining process and augments the data with additional information from a variety of other sources. With this enhanced data, we enable our customers to offer better applications and more personalized solutions to their end users which provide end users insights that allow them to take better control of, and better manage, their finances. |
Innovative Technology and Intellectual Property
We have a history of innovation leadership. In 1999, we introduced the first financial account aggregation product to the digital financial services industry. We were the first platform to go to market with online personal financial management tools in 2006 and first to introduce an open platform for digital financial services in 2010. Recently, our innovation was recognized by the Best of Show award for our new collaborative finance mobile product, Tandem, won at the Finovate Conference in September 2013 and at the Finovate Asia Conference in November 2013. Additionally, as of June 30, 2014, we had been granted 64 U.S. patents and had 23 U.S. patent applications pending. We also had
-103-
Table of Contents
8 issued patents and 13 patent applications pending in foreign jurisdictions such as the European Patent Office, Canada, Australia and India. We believe our innovation leadership is a core strength that positions us for future growth.
Flexible, Scalable, Open Platform
Our solutions are built on a scalable open cloud-based technology platform that allows us to address the challenges facing FI and YI customers. Our platform was created to support the existing challenges of our customers and to evolve with them to address their future needs. We have a highly configurable platform that enables our customers to create differentiated solutions. We have open and secure APIs that leverage our data aggregation and money movement capabilities. As our business continues to grow, we expect our open APIs to continue to attract an active community of third-party developers, whose innovations will further extend our existing set of products and applications. With these tools delivered through our highly efficient Software-as-a-Service-based, or SaaS-based, model, we are able to provide our customers with valuable data and innovative services quickly and efficiently.
Access to our platform and data is predominantly through our hosted web pages and applications, and client-created applications utilizing our APIs and FinApps. This variety of access methods and usage has contributed to an increase in user logins on the Yodlee platform to over 5 million per day. We process over 27 million API calls per day, while maintaining an average API response time under 500 milliseconds.
Powerful Network Effects
The Yodlee Financial Cloud brings together FIs, Internet services companies, end users and third-party developers by providing a unified, flexible, platform that can deliver applications and new solutions at scale with powerful network effects:
| • | We estimate that our current network of FI customers alone reaches more than 100 million end users. As our platform usage grows and is exposed to more users and use cases, the system benefits from machine learning algorithms to better normalize, categorize and process high volumes of transaction-level data captured on our platform, allowing our network to become more effective, efficient and valuable to our customers. |
| • | As our platform has become more effective and efficient, we have attracted a broad network of third-party developers. As more developers build on our platform, the number of solutions we can offer to our FI and YI customers increases, expanding the number of end users on the platform, and further enhancing our network, accelerating the pace of innovation. |
| • | As our end user community grows, users are able to leverage our platform by establishing connections to other end users to form financially relevant social groups, contributing further network effects. |
Growth Strategy
Our growth strategy is currently divided into two primary areas of focus: user growth and revenue per paid user growth. Key elements of our growth strategy include:
User Growth
| • | Expand End User Usage with Existing Customers—We believe there are significant opportunities for growth within our existing customer base. As of June 30, 2014, our customer base has grown to more than 750 organizations using the Yodlee platform and we receive subscription fees for 16.8 million paid users. Our FI customers encompass many of the leading |
-104-
Table of Contents
| FIs, including 9 of the 15 largest banks in the United States, which hold 85% of the total assets of the top 15 U.S. banks (based on total assets as of September 30, 2013). We estimate that our current network of FI customers alone reaches more than 100 million end users, representing a significant opportunity to grow our paid user base within existing customers. We believe we can increase penetration among our existing customer base, both by increasing the adoption of our solutions in business units that we currently serve and by expanding into new business units. We intend to grow our business in the retail, financial, wealth management, small business, card and other financial solutions sectors in part by distributing FinApp solutions tailored to the needs of those sectors. We also believe distributing FinApp solutions tailored to specific sectors will enable FIs to deepen engagement across their user base and will contribute to growth. |
| • | Grow the Number of Customers—While our platform was used by more than 450 FIs, including many of the top FIs, and 300 Internet services companies globally as of June 30, 2014, many opportunities exist for us to target new customers. According to Bankscope by Bureau van Dijk, as of March 14, 2014, there were approximately 9,941 active banks in the U.S. and 22,409 globally. We continue to drive efforts to deploy solutions with leading global FIs while also driving penetration in smaller FIs through channel partners. We intend to employ a land and expand strategy to target these institutions with simple initial product offerings and continually grow use cases over time. In addition, we believe demand for our YI solutions will continue to grow outside our current areas of focus. Our product capabilities across our YI customers currently cover over 30 sub-verticals and these capabilities will continue to increase as our platform usage grows and is exposed to more use cases. In many of these use cases, there is considerable room for expansion of our offerings. Lastly, our emerging data analytics and market research efforts are developing new product and customer base opportunities as we expand. |
| • | Increase our Global Market Presence—We intend to deepen our presence in Canada, the United Kingdom, South Africa, India and Australia, and to establish a presence in select markets in Latin America, Europe and Asia. We will continue to focus on selling to the largest banking organizations and YI customers in each region using a scalable approach to enter new markets in a cost-effective manner. |
Revenue per Paid User Growth
In addition to generating revenue directly from our platform and FinApps with our FI and YI customers, we also intend to grow our revenue by providing additional data analytics and market research services and are pursuing revenue-sharing opportunities from premium FinApps developed by our developer partners.
| • | Data Analytics and Market Research—We believe there is significant value inherent in our data analytics and market research services which we can realize through several different channels: |
| • | Data-driven cross-sell and digital marketing opportunities—The scale and breadth of our platform allow us to gather transaction-level data from user accounts in outside institutions that provides a more holistic understanding of our customers’ end users than our customers are able to compile themselves. Our data analytics and market research services can be used by our customers to enhance the efficacy of their marketing strategies, enabling them to capture cross-sell and up-sell opportunities. There is also significant value in integrating our data services into FI customer relationship management systems. |
| • | Market research—We have developed data products by aggregating anonymized financial transactions that occur on our platform, which will then power research and reporting products for multiple research use cases. |
-105-
Table of Contents
| • | Credit and risk analytics—The end user-permissioned transaction-level data can also be used to improve real-time authentication and risk management and to enhance predictive analysis. |
| • | FinApps—We are pursuing opportunities to grow revenue from premium FinApps through revenue sharing with developer partners and our customers. We are engaging with a number of partners on our platform and are focusing our efforts on connecting these partners with our customers for distribution to their end users. |
Customers
As of June 30, 2014, more than 750 organizations in over 10 countries leveraged our cloud platform via secure APIs, services and/or solutions. As of June 30, 2014, our platform was in operation by more than 450 FIs, including 9 of the 15 largest U.S. banks, which hold 85% of the total assets of the top 15 U.S. banks (based on total assets as of September 30, 2013). Our platform was also used by approximately 300 Internet services companies. See Note 18 to the Consolidated Financial Statements for a summary of revenue by geographic area.
Customer Case Studies
The following case studies illustrate how customers in both our FI and YI channels have used our cloud-based platform via secure APIs, products and/or solutions to meet their business objectives.
FI Case Studies
Bank of America
In 2001, Bank of America, N.A., or Bank of America, selected Yodlee to provide Personal Financial Management services within Bank of America’s online experience and deployed the Yodlee Platform as “My Portfolio.”
Consumers were provided:
| • | A view of a customer’s full financial picture. |
| • | Financial data collection through consolidated and extensive history of transactions. |
Bank of America gained insight into its customers’ complete financial situation.
YI Case Studies
PayPal
Situation: PayPal is the leading ecommerce service that enables users to pay, send money, and accept payments without revealing personal financial details.
Solution and Benefits: In 2004, PayPal deployed Yodlee’s Instant Account Verification service which allowed customers to setup PayPal accounts instantaneously and helped solve problems associated with traditional challenge deposit verification. Using the Yodlee Instant Account Verification product, PayPal realized the benefit of reduced risk and fraud, and reduced abandonment that typically follows a challenge deposit. PayPal continues to rely on Yodlee’s Instant Account Verification service and is also using Yodlee’s Personal Finance APIs to build out point solutions for consumers to solve specific money management problems.
Benefits realized are:
| • | Facilitating identity verification for consumers wanting to shop via a PayPal experience. |
-106-
Table of Contents
| • | Improving the consumer experience for opening new PayPal accounts on line. |
| • | Improving the consumer new PayPal account enrollment experience by allowing consumers to verify their financial accounts more conveniently. |
Kabbage
Situation: Kabbage, Inc. provides working capital to small businesses online. As part of its lending and loan management process, Kabbage is required to authenticate and evaluate small businesses, their owners and relevant associated financial accounts in order to determine if they pose an acceptable lending risk. Because the Kabbage business is highly virtual, it requires automated and continuous access to the financial and associated data necessary to make small business lending and loan management decisions.
Solution and Benefits: Kabbage subscribes to the Yodlee Account Verification API. The Account Verification API enables Kabbage customers to quickly and easily link relevant financial accounts with Kabbage verification and analytics systems, so that loan candidates can be verified, evaluated and underwritten in a highly virtual environment, in real or near real time. The Account Verification API further enables Kabbage to automate and streamline loan origination processes, and the associated data available through the API helps inform Kabbage fraud and risk analytics, so that it can make better and more profitable lending decisions. Kabbage initially deployed Yodlee’s solutions in 2011.
LearnVest
Situation: LearnVest, Inc. provides financial management, planning and advisory services personalized to its customers’ specific financial goals and needs. LearnVest requires automated, continuous access to customers’ personal financial account data in order to provide them with LearnVest’s financial planning tools and timely advice and action plans, both directly and through LearnVest distribution partners.
Solution and Benefits: LearnVest subscribes to the Yodlee Interactive Data Aggregation API. The Data Aggregation API enables LearnVest customers to quickly and easily connect their bank, retirement and other important financial accounts into LearnVest’s systems, automating delivery of the financial and other data required to power LearnVest’s financial management, planning and advisory services and solutions. LearnVest initially deployed Yodlee’s API in 2011 to enable financial management solutions and then expanded its use of Yodlee to power advisory services in 2013. Continuous access to financial account data is necessary to enable a highly virtual, real-time financial planning and advisory business like LearnVest.
Personal Capital
Situation: Personal Capital Corporation provides financial management, planning and advisory services and solutions predicated on technology and objective financial advice. Personal Capital requires automated, continuous access to customers’ personal financial account data in order to provide them with Personal Capital’s winning tablet and mobile financial management applications, and to support Personal Capital’s network of professional financial advisors and the associated technology platforms they leverage to advise customers.
Solution and Benefits: Personal Capital subscribes to the Yodlee Interactive Data Aggregation API. The Data Aggregation API enables Personal Capital customers to quickly and easily connect their bank, retirement and other important financial accounts into Personal Capital customer and advisor- facing systems, automating delivery of the financial and other data required to power Personal Capital’s financial management, planning and advisory services and solutions. Continuous access to
-107-
Table of Contents
financial account data is critical to enable a highly virtual, mobile, real-time financial planning and advisory business like Personal Capital. In 2011, Personal Capital began to use Yodlee’s API to power its online and tablet-based applications and in 2012 expanded its use to offer IOS- and Android-based applications.
Xero
Situation: Xero is an online accounting system designed specifically for small businesses. The most consistently in demand platform feature among Xero’s small business, accountant and bookkeeper customers has been the automated delivery of bank and financial account information into the Xero solutions. In the midst of a rapid, global expansion, Xero requires the ongoing ability to quickly and easily connect its customers, their financial accounts and data into the Xero systems.
Solution and Benefits: Xero subscribes to the Yodlee Interactive Data Aggregation API. The Data Aggregation API enables Xero small business, accountant and bookkeeper customers to quickly and easily connect their bank and financial accounts into Xero systems, automating delivery of the financial data required to power Xero solutions and mitigating a key barrier to the adoption and expansion of Xero solutions worldwide. Xero began offering data aggregation solutions to its customers in Australia, in 2010, and expanded the offering to customers in the United Kingdom in 2010 and then more broadly to the United States in 2011. Initially deployed as a web solution, Xero now offers web and mobile platform modalities. With international capabilities, an established network of financial data connectivity and platform extensibility into nearly all major currency and financial data sets, the Yodlee Interactive Data Aggregation API is a solution that can support Xero as it grows and expands to new geographies.
-108-
Table of Contents
Products
Yodlee designs, builds, and delivers flexible solutions within the Yodlee Financial Cloud. These solutions broadly address the financial management needs of end users. Our customers deploy these products to enhance end user engagement across all digital channels.
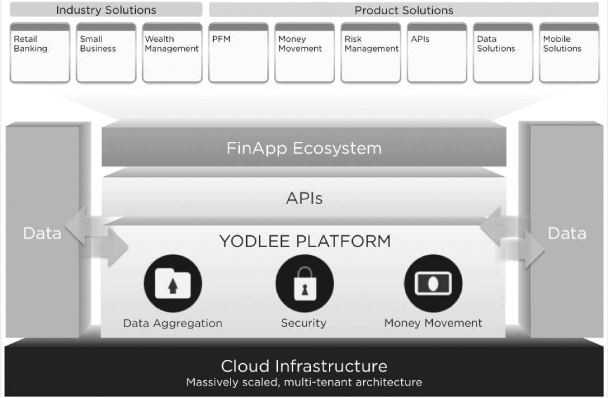
Our solutions include FinApps that are sold individually and in the combinations described below:
| • | Yodlee Industry Solutions |
| • | Yodlee Retail Banking—Designed for mass market consumers, including enabling them to evaluate where they spend their money, receive alerts for activities requiring their attention, budget and create savings goals. |
| • | Yodlee Wealth Management—Designed for affluent consumers, including providing a complete view of the consumer’s portfolio, focusing on net worth, holdings, and investments. |
| • | Yodlee Small Business—Designed for small business owners who have 10 or fewer employees, including enabling them to easily manage cash flows, track their business finances and transactions, and analyze expenses in one place. |
| • | Yodlee Product Solutions |
| • | Yodlee Personal Financial Management—Provides a personal financial management solution that delivers FinApps that include account aggregation, expense management, budgeting, savings goals, investment, and net worth. |
| • | Yodlee Money Movement |
| • | Yodlee BillPay—Delivers a consumer bill payment solution including FinApps allowing consumers to schedule payments to billers, view electronic bills, and make expedited or real-time bill payments. |
-109-
Table of Contents
| • | Yodlee FundsTransfer—Delivers consumer account-to-account money movement allowing one-time and scheduled transfers. |
| • | Yodlee Risk Management—Yodlee Instant Account Verification provides our customers with important information about user accounts, such as account holder name, balance, and account number, reducing risk for our customers when interacting with an end user’s checking account and allowing consumers to verify their financial accounts in real time. |
| • | Yodlee Mobile Solutions—FinApps designed specifically for mobile and tablet devices and provides access to the main functionality of the Yodlee platform. We have announced our latest mobile offering, Yodlee Tandem, which is designed to help consumers manage their money across financial relationships. Combining the elements of personal finance, account aggregation, social circles, and chat/messaging, Yodlee Tandem will allow users to safely work with others on shared finances in a user-permissioned manner. |
Yodlee APIs
Yodlee APIs allow Yodlee, FI and YI customers, including third-party developers, to build applications on the Yodlee platform. Our customers can use these APIs to develop proprietary applications. In addition, our customers and third-party developers can also leverage these APIs to create FinApps that are available across all digital channels including Web, tablet, and mobile. Access to Yodlee APIs is licensed to FI and YI customers based on the solutions they seek to supplement. All of the Yodlee APIs are available via traditional Simple Object Access protocols or the more modern Representational State Transfer or Java Script Object Notation formats.
Key APIs include:
| • | Yodlee PersonalFinance Management and Yodlee Risk Management APIs. These APIs provide customers with access to user-permissioned financial data. |
| • | Yodlee MoneyMovement APIs. These APIs provide customers with access to traditional payment mechanisms through the money movement capabilities of the Yodlee platform. |
Yodlee Data Solutions
We use the transaction-level data gathered and refined by the Yodlee platform to provide data analytics and market research services that enhance the value of our solutions to our customers, as well as leverage the breadth and depth of our anonymized data with new customers.
Technology, Security and Operations
Our technology infrastructure is designed to provide a highly available and secure multi-tenant cloud-based platform across hundreds of customers and millions of end users. Our solutions use a single code base for all customers and are globally accessible across multiple digital channels. Our multi-tenancy model uses a common data model for all customers but isolates data with logical controls and separate encryption keys for each customer.
Our SaaS platform is highly scalable. Our architecture utilizes state-of-the-art technologies, hardware and software to achieve enhanced availability, scalability and security. We have architected the system to scale horizontally allowing us to add more servers as volumes increase. The data base processing uses large servers and high performance storage arrays. This scalability is made possible by extensive use of parallel, distributed, and auto-scaling message based architectures. Our support tools, commercial and internally-developed, provide consistent and cost efficient processes across products and support functions.
-110-
Table of Contents
Our infrastructure and applications have been designed and built to optimize this SaaS environment. Our applications, APIs, and FinApps all access the same core application layer and backend processing. We enable highly customized deployments and still maintain the efficiencies of a SaaS model. This is accomplished through a configuration architecture in our application framework. This Yodlee-developed framework allows for extensive customer-specific configuration in the user experience and the functions exposed to end users, while still maintaining a true multi-tenant SaaS operational model.
Technology
The backbone of our technology includes our data aggregation and money movement capabilities in a highly secure environment.
Yodlee Data Aggregation
Our data aggregation platform collects a wide variety of end user-permissioned transaction-level data from over 12,500 sources and puts it in a common repository. Over the last 14 years we have developed robust proprietary technology and processes and established relationships that allow us to curate these data sources and expand our access to new data sources. Over 75% of this data is collected through structured feeds from our FI customers and other FIs. These structured feeds, which consist of either batch files pushed to us or real-time access, provide this critical data efficiently and at scale. Where we do not have direct connections, we capture data using our proprietary information-gathering techniques.
Beyond collecting data, our data aggregation platform performs a data refining process and augments the data with additional information from a variety of other sources. We enrich the data with a proprietary twelve-step process, adding such elements as categorization and merchant identification for bank or credit card account data and investment holding identification for investment account data. As our platform usage grows and is exposed to more users and use cases, the system benefits from machine learning algorithms to better normalize, categorize and process large amounts of data, allowing our network to become more effective, efficient and valuable to our customers. With this enhanced data, including consolidated data from within our FI customers and account data regarding accounts at other FIs, we enable our customers to offer more personalized solutions to their end users, which provide end users insights that allow them to take better control of, and better manage, their finances.
Yodlee Money Movement
Our money movement solutions facilitate payment flows. Our customers can debit and credit consumer and small business accounts in real time or in batches and route payments between accounts (funds transfer), to billers (bill pay), or to other individuals (peer to peer). Designed to be run as a service, our money movement solutions allow us to operate these functionalities in the cloud and quickly adapt to new payment systems.
Our payment engine, which is a principal component of our money movement solutions, is a task-based payment processing platform that controls all payment activity across cobrands, originators, processors, and billers. Our payment engine handles multiple tasks, including payment initiation, payment routing, payment processing, Office of Foreign Assets Control checking of payee and payor, and risk and fraud detection.
Security
Yodlee Security
As a provider of financial data and digital financial management services, our security and data integrity are critical components of our platform and applications. We have developed robust security procedures and technologies that are embedded into our platform and applications and meet industry
-111-
Table of Contents
standards as well as the stringent security requirements of our largest FI customers. We employ a comprehensive program of risk-driven policies and procedures to maximize effectiveness of our information security program, including frequent external audits. In 2013, we successfully passed numerous security and operational audits conducted by our customers and independent security auditors engaged by us. Many of our current and prospective customers reviewed the results of such audits as part of their evaluation of our solutions. We are audited by U.S. regulatory agencies to whom our operations or our customers’ operations are subject. We follow industry security standards in the design and implementation of our applications, systems and network. For example, we use extensive network segmentation to separate our production, staging, development, corporate, and other platforms from each other with access controls between each zone. Other key security processes include: keystroke logging of administrative actions; file integrity monitoring; systems and network vulnerability scanning; security monitoring with event correlation; and security incident response procedures.
Operations
We physically host the Yodlee platform in five third-party data centers in the United States, Canada and India that provide secure facilities, space, power, and Internet connectivity and service all customers, both domestic and international. We also plan to host the Yodlee platform in third-party data centers in additional international locations in the future. We own or lease the hardware and own or license the software used to host our solutions. Currently the primary production data center and disaster recovery center, in the United States and the largest data centers for Yodlee, has two different third-party providers. This reduces the risk and dependencies on any single hosting provider. Similarly, we have already established relationships and services with different international data centers providers.
Our contracts with data center providers only require standard services such as floor and secure cage space, standard power density for systems, and redundant internet connectivity. We do not require managed services or any customized hosting services. Our staff can remotely manage systems and platform in all data centers and when needed our employees perform work on-site. Our platform is also certified to run on virtual machines and thus start-up and implementation of new data center capacity in the same or different hosting providers can be completed in a relatively short timeframe.
We have Service Level Agreements, or SLAs, with customers that define our operational and performance commitments, and we deploy commercial and internally-developed tools to monitor and report on SLA commitments. We run a command center 24 hours a day, 7 days a week that is responsible for monitoring our operations.
We also have formal disaster recovery programs for our internal services and our customers’ applications. We regularly test our internal disaster recovery programs and engage in annual testing with customers. In addition, our infrastructure consists of highly redundant environments. This includes redundant equipment at every layer with various configurations such as active/active and active failover.
Research and Development
Our research and development efforts are generally focused on improving our existing and developing new data aggregation and money movement components, security infrastructure, APIs, new FinApps, data analytics and market research services and tools for third-party developers. As of June 30, 2014, we had 312 engineers located in our India and U.S. offices who are dedicated to improving our existing solutions, developing new solutions that meet our customers’ needs and maintaining quality control over our solutions. Our significant presence in India provides us with direct access to a large pool of talented engineers from which we have been able to successfully recruit, hire and retain qualified personnel who help to drive our business growth.
-112-
Table of Contents
Our research and development expenses were $16.8 million, $16.2 million, $18.0 million, $9.4 million and $10.3 million for the years ended December 31, 2011, 2012, and 2013, and the six months ended June 30, 2013 and 2014, respectively.
Sales and Marketing
Our sales and business development teams are responsible for acquiring and growing our relationships with customers, channel and development partners.
Sales
We have a direct sales and pre-sales team servicing the leading global FIs. The FI sales team is divided geographically into two regional groups: North America; and Europe, Middle East/Africa and Asia-Pacific. Each regional sales and pre-sales team is responsible for acquiring new FI customers. Within the North America region we further divide our direct sales and pre-sales representatives into teams that focus on specific accounts, on a named-account basis, depending on size, location, product specialization and/or brand. Our direct sales and pre-sales teams are supported by customer advocacy teams who specialize in customer account management and expansion. Together, sales, pre-sales and customer advocacy representatives are responsible for growing our customer relationships in terms of account penetration (cross-selling additional products and services into the same or additional groups within a FI) and expanding use of existing products and services (increasing usage). We also have a global channel partner sales team responsible for acquiring and supporting channel partners who target sales to FIs with fewer than $10 billion in deposits or assets under management. Additionally, we have resources that pursue our opportunities for sales of data analytics and market research services.
We have a direct sales and technical pre-sales team servicing Internet services companies and partners in each region in which we currently operate or intend to operate. This sales team is divided geographically into two regional groups: North America; and Europe, Middle East/Africa and Asia-Pacific. Each regional sales and technical pre-sales team is responsible for acquiring new customers and channel partners. From time to time, we assign specific accounts based upon sales or domain expertise. Our direct sales and technical pre-sales teams are supported by a customer success and developer relations team who specialize in customer API integration, and account management and expansion, including services to our channel partners. Together, sales, technical pre-sales, customer success and developer relations representatives are responsible for growing our direct customer and channel partner relationships in terms of account penetration and API usage.
Marketing
Our marketing efforts are focused on initiatives to drive global company, brand and solutions awareness and significant lead generation and sales acceleration across our whole business. These initiatives include educating the market about Yodlee, achieving recognition as the industry leader through awards, speaking engagements, thought leadership articles, data trends and metrics, and high profile interviews.
We are constantly refining our grassroots lead-generation approach to ensure we generate high quality sales leads that meet or exceed our pipeline goals. We employ a variety of integrated sales and marketing initiatives, including sponsorship and partnership of key industry conferences, customer and developer-focused events and programs, meet-ups and hack-a-thons, and other high-profile activities designed to demonstrate thought leadership and engage new audiences in actionable and measurable ways. We employ many tools, including web and social properties, integrated creative campaigns consisting of online advertising, digital and video content marketing, direct mail, blogs, hosted webinars, analyst relations and media relations. In addition, our marketing efforts develop consumer best practices tools, case studies, and education to drive deeper consumer activity and engagement with top customers.
-113-
Table of Contents
Our sales and marketing expenses were $12.9 million, $13.6 million, $15.4 million, $7.4 million and $9.7 million for the years ended December 31, 2011, 2012 and 2013, and the six months ended June 30, 2013 and 2014, respectively.
Services
Professional Services
We provide a variety of implementation services to our customers, focused on configuring the Yodlee platform to meet customer needs. Our platform is designed to be robust, yet easy to configure and personalize, to ensure an efficient implementation process. We engage with key customers on projects ranging from turnkey implementations to ongoing consulting engagements. As a part of every implementation, we provide training to our customers.
We have developed expertise and experience in integrating our solutions with our customers’ platforms throughout our history. Our professional services team, working closely with our support and operations teams, uses this expertise and experience in our efforts to ensure the end user has a positive experience with our solutions.
Support
Our customer support is provided via our software-based Yodlee CustomerCare console, phone or e-mail and is available to our FI and YI customers 24 hours a day, 7 days a week as a second level of support for issues our customers cannot resolve internally.
Yodlee customer support is provided both on an on-demand basis through our support command center, and on an ongoing basis through our Technical Account Managers. Our support command center is responsible for all urgent issues with our customers. Once an issue is identified, customer support triages the issue and assigns it to several internal teams depending upon the type of issue that is encountered. Our ongoing customer support is administered by our Technical Account Managers. Each manager is assigned to key accounts and is responsible for meeting with customers on a weekly basis to discuss the overall status of the account.
Intellectual Property
We rely on a combination of patent, trade secret, copyright and trademark laws, license agreements, confidentiality procedures and confidentiality and nondisclosure agreements to establish and protect our proprietary rights in our solutions. We generally enter into confidentiality and nondisclosure agreements with our employees, contractors, vendors and customers. We also seek to control access to and distribution of our software, documentation and other proprietary information.
As of June 30, 2014, we had been granted 64 U.S. patents and had 23 U.S. patent applications pending. Our patents expire between 2018 and 2032. We also had 8 issued patents and 13 patent applications pending in foreign jurisdictions such as the European Patent Office, Canada, Australia and India. As a pioneer in data aggregation, we have patents relating to our core aggregation engine. In addition, our patent portfolio includes patents relating to the supporting infrastructure of error reporting, error correction and auto configuration functionalities. We also have patents relating to applications of aggregation, including reporting, financial analysis, bill presentment and identity verification. We also seek patents on new and emerging technologies, such as FinApps.
We use various trademarks for our products and solutions and “Yodlee”, “Yodlee Moneycenter”, “Yodlee Personalpay”, “Paytoday”, “Payitall”, “Innovation Applied”, “Finapp” and our logo are our
-114-
Table of Contents
registered trademarks in the United States. We also have registered trademarks and pending trademark applications in foreign jurisdictions such as Australia, Canada, the EU, India, New Zealand, Hong Kong, Japan, Mexico and South Africa.
Despite our efforts to protect our intellectual property and proprietary rights, unauthorized parties may attempt to copy or obtain and use our technology to develop solutions that provide features and functionality that are similar to our solutions. Policing unauthorized use of our intellectual property and proprietary rights is difficult and expensive, and our monitoring and policing activities may not be sufficient to identify any misappropriation and protect our proprietary technology. If unauthorized use of our intellectual property and proprietary rights were to occur, it could harm our reputation and adversely affect our competitive position or operations. In addition, laws of other jurisdictions may not protect our intellectual property and proprietary rights from unauthorized use or disclosure in the same manner as the United States. If we are unable to protect our proprietary rights or if third parties independently develop or gain access to our or similar technologies, our business, revenue, reputation and competitive position could be harmed.
Competition
While we do not believe any single company in the digital financial services market offers a comprehensive platform with features such as ours, the following companies offer products that compete with one or more of our solutions:
| • | for data aggregation: Intuit, Inc. and Fiserv, Inc. (CashEdge); |
| • | for personal financial management: Intuit (direct to consumer service) and internal IT departments of FIs, as well as early-stage companies; |
| • | for online bill pay: Fiserv and FIS Global Corporation; |
| • | for data products and services: global payment networks, credit bureaus and other institutions that have access to large pools of data; and |
| • | for account verification: MicroBilt Corporation and Early Warning Systems, LLC. |
We believe the principal competitive factors in digital financial services include the following:
| • | reputation; |
| • | cloud-based delivery model; |
| • | data aggregation capability; |
| • | access to data through direct connectivity to FIs; |
| • | scale (size of customer base and level of user adoption); |
| • | security; |
| • | time to market; |
| • | breadth and depth of application functionality; |
| • | user experience; |
| • | access to third-party applications; |
| • | ease of use; |
| • | ease of integration; |
| • | flexibility and configurability; and |
| • | competitive pricing. |
-115-
Table of Contents
We believe that we compete favorably with respect to all of the factors listed above.
Government Regulation
The Board of Governors of the Federal Reserve System, the Federal Deposit Insurance Corporation, and the Office of the Comptroller of the Currency, or OCC, have statutory authority to supervise third-party technology service providers, or TSPs, that enter into contractual arrangements with regulated financial institutions.
These examiners conduct examinations of financial institutions and their TSPs based on guidance in the FFIEC Information Technology Examination Handbook and the “Administrative Guidelines”, or Guidelines, contained therein. These Guidelines, which are used in conjunction with the “Supervision of Technology Service Providers Booklet” describe the process regulatory agencies follow to implement the interagency programs for the supervision of all TSPs.
We are a supervised TSP under this regime and receive regular multi-agency supervisory examinations. The OCC is the Agency in Charge and produces the Report of Examination, or RoE. A summary of the RoE is made available to all U.S. chartered financial institution clients. These examinations are based on published guidance from the Federal Financial Institutions Examination Council, or FFIEC, which is a formal interagency body empowered to prescribe uniform principles, standards and report forms for the examination of FIs and to make recommendations to promote uniformity in the supervision of FIs. The examinations cover a wide variety of subjects, including our management, acquisition and development activities, support and delivery, IT and our disaster preparedness and business recovery planning.
Our U.S. FI customers and prospects are subject to extensive and complex regulations and oversight by federal and state regulatory authorities. These laws and regulations are constantly evolving and affect the conduct of these customers’ operations and, as a result, that aspect of our business. For example, in 2010 the Dodd-Frank Wall Street Reform and Consumer Protection Act, or the Dodd-Frank Act, was enacted. The Dodd-Frank Act introduced substantial reforms to the supervision and operation of the financial services industry.
The Dodd-Frank Act established a new federal interagency council called the Financial Stability Oversight Council, or FSOC, and a new federal bureau called the Consumer Financial Protection Bureau, or CFPB. The FSOC monitors and assesses systemic risk to the safety of the U.S. financial system and coordinates the actions of the various regulatory agencies on those issues. The CFPB is empowered to conduct rule-making and supervision related to, and enforcement of, federal consumer financial protection laws. The Dodd-Frank Act has generated, and may generate additional, numerous new regulations that will impact the financial services industry. It is difficult to predict the extent to which the Dodd-Frank Act, the FSOC, the CFPB or the resulting regulations will impact our business or the businesses of our current and prospective customers. The Dodd-Frank Act granted the CFPB authority to promulgate rules and interpret certain federal consumer financial protection laws, some of which apply to the solutions we offer. In certain circumstances, the CFPB also has examination and supervision powers with respect to service providers who provide a material service to a FI offering consumer financial products and services.
Outside of the United States, we are considered a “data processor” under the respective privacy regimes of the host country or region in which our customers offer our solutions. The data processor role does not subject us to any direct regulation, but the obligations are captured in our contracts with such customers to reflect the applicable requirements as a data processor. These requirements encompass security practices, privacy principles and cross-border data transfer. In support of this, we have made verbal, and in some cases contractual commitments, to maintain US-EU Safe Harbor Certification.
-116-
Table of Contents
Our solutions must support our customers’ requirements to comply with other applicable requirements such as the following:
| • | the Electronic Funds Transfer Act; |
| • | usury laws; |
| • | the Gramm-Leach-Bliley Act; |
| • | laws against unfair, deceptive, or abusive acts or practices; |
| • | the Privacy of Consumer Financial Information regulations; |
| • | the Guidance on Outsourcing Technology Services promulgated by the FFIEC; and |
| • | other federal, state, local and foreign laws and regulations related to data privacy and breach notification. |
The compliance of our solutions with these requirements depends on a variety of factors, including the functionality and design of our solutions, the classification of our customers, and the manner in which our customers and their account holders utilize our solutions. For example, we are subject to the privacy and confidentiality provisions of the Gramm-Leach-Bliley Act and its implementing regulations. In order to comply with our obligations under these laws, we are required to implement operating policies and procedures to protect the privacy and security of our customers’ and their account holders’ information and to undergo periodic audits and examinations.
Culture and Employees
Culture
Our culture and employees are fundamental to our success. Dedication to innovation is a core element of our culture. We achieve and sustain innovation by always striving to be the best in whatever we do, enabled by a focus on teamwork and an open and authentic environment. We seek to hire enthusiastic employees who will help us perpetuate our positive workplace environment. We also offer a work exchange program for many of our employees in technical roles. This program provides our employees the opportunity to work overseas with their peers and to collaborate face to face with one another on a variety of projects. We believe this program enhances opportunities for innovation, provides valuable work experience and strengthens our corporate culture. In addition, in 2013 we started a leadership program to align both our company’s leaders and the organization. We believe that the company culture we have established through these programs and initiatives contributes to strong employee retention in both our U.S. and India offices.
Employees
As of June 30, 2014, we had approximately 840 full time employees. Of that total approximately 170 were located at our corporate headquarters in Redwood City, California, and approximately 670 were located in Bangalore, India. None of our employees is represented by a labor union or covered by collective bargaining agreements. We consider our current relations with our employees to be good.
Facilities
We currently lease approximately 36,000 square feet of space for our corporate headquarters in Redwood City, California under a lease agreement that expires in March 2015. We also lease approximately 84,000 square feet of space for our Bangalore, India office under three lease agreements that expire between April and May 2017. Both of these offices are used for administrative,
-117-
Table of Contents
marketing, support and development operations. In connection with our sales efforts, we also lease office space in London, England. We believe that our current facilities are sufficient for our current needs. We intend to add new facilities or expand existing facilities as we add staff or expand our geographic markets, and we believe that suitable additional space will be available as needed to accommodate any such expansion of our organization.
Legal Proceedings
From time to time we are a party to various litigation matters and subject to claims that arise in the ordinary course of business. In addition, third parties may from time to time assert claims against us in the form of letters and other communications. There is no pending or threatened legal proceeding to which we are a party that, in our opinion, is likely to have a material adverse effect on our future financial results of operations; however, the results of litigation and claims are inherently unpredictable. Regardless of the outcome, litigation can have an adverse impact on us because of defense and settlement costs, diversion of management resources and other factors.
-118-
Table of Contents
Executive Officers and Directors
The following table provides information regarding our executive officers and directors as of June 30, 2014:
| Name |
Age | Position | ||||
| Executive Officers: |
||||||
| Anil Arora |
53 | President, Chief Executive Officer and Chairman of the Board of Directors | ||||
| Michael Armsby |
46 | Chief Financial Officer | ||||
| Joseph Polverari |
46 | Chief Strategy and Development Officer | ||||
| William Parsons |
55 | Chief Customer Officer | ||||
| Timothy O’Brien |
57 | Senior Vice President, Operations and Information Security | ||||
| Thomas Hempel |
53 | Senior Vice President, Engineering | ||||
| Eric Connors |
48 | Senior Vice President, Products | ||||
| Arun Anur |
49 | Senior Vice President, Global Services | ||||
| David Lee |
54 | Senior Vice President and Chief Marketing Officer | ||||
| Arjun Singh |
53 | Managing Director, Asia | ||||
| Non-Employee Directors: |
||||||
| Gayle Crowell(1)(2)(3) |
63 | Lead Independent Director | ||||
| Bruce C. Felt, Jr.(1) |
56 | Director | ||||
| Patrick T. Hackett(3) |
53 | Director | ||||
| William Harris, Jr.(1)(2) |
58 | Director | ||||
| Dennis B. Phelps(3) |
40 | Director | ||||
| (1) | Member of our Audit Committee. |
| (2) | Member of our Compensation Committee. |
| (3) | Member of our Nominating and Governance Committee. |
Executive Officers
Anil Arora has served as our president and chief executive officer and as a member of our board of directors since February 2000. Mr. Arora has served as the Chairman of our Board of Directors since March 2014. Prior to joining us, from June 1998 to February 2000, Mr. Arora served in various positions with Gateway, Inc., a computer hardware manufacturer which was acquired by Acer Inc. in October 2007, most recently as senior vice president, Gateway Internet and prior to that as chief marketing officer with global responsibility for Gateway. From April 1995 to May 1998, Mr. Arora served in various positions for The Pillsbury Company, a subsidiary of General Mills, Inc. and manufacturer and marketer of branded consumer foods, including as vice president, strategy and marketing for North America and vice president, general manager for Progresso. From June 1984 to April 1995, Mr. Arora served in various brand management and corporate strategy and operations roles for Kraft Foods Group, Inc., a manufacturer and marketer of leading branded consumer foods, including most recently as business director in the refrigerated products division. Mr. Arora holds an M.B.A. from the University of Michigan, Stephen M. Ross School of Business, and a B.S. in business administration from Rockford College.
We believe that Mr. Arora possesses specific attributes that qualify him to serve as a member of our board of directors, including his experience in the technology industry and the operational insight and expertise he has accumulated as our president and chief executive officer.
-119-
Table of Contents
Michael Armsby has served as our chief financial officer since April 2013. From April 2010 to March 2013, Mr. Armsby served as chief financial officer of View, Inc., a manufacturer of dynamic electrochromic glass. From January 2007 to April 2010, he served as vice president of finance of SunPower Corporation, a manufacturer of solar electric systems. From May 2006 to January 2007, Mr. Armsby served as chief financial officer of PowerLight Corporation, an integrator/installer of large photovoltaic solar electric projects which was acquired by SunPower Corporation in January 2007. From March 2003 to April 2006, he served as vice president of finance of Synopsys, Inc., an electronic design automation software company. From October 2001 to March 2003, Mr. Armsby served as vice president finance of DHL Express, a division of Deutsche Post AG and global package delivery company. From October 1997 to October 2001, Mr. Armsby worked for the management consulting firm Bain & Company. Mr. Armsby holds an M.B.A. from Harvard Business School, a B.S. in economics from The Wharton School, University of Pennsylvania and a B.A. in political science from the University of Pennsylvania.
Joseph Polverari has served in various senior positions with us since October 2000, most recently as our chief strategy and development officer and general manager of Yodlee Interactive. From January 2000 to October 2000, Mr. Polverari held various positions with Pandesic LLC, a joint venture between Intel Corporation and SAP AG, which focused on a low-cost turnkey approach to conducting commerce on the Internet, most recently as vice president and chief operating officer. From January 1999 to January 2000, Mr. Polverari served as senior vice president and associate general counsel for InsWeb Corporation, an online insurance marketplace the assets of which were subsequently acquired by Bankrate, Inc. in December 2011. From June 1996 to January 1999, Mr. Polverari served as director and senior business counsel at Seagate Software, Inc. (which is currently known as Crystal Decisions, Inc.), an international software corporation which was acquired by Business Objects, S.A. in December 2003. Mr. Polverari is a graduate of the Stanford Graduate School of Business Executive Program, and holds a certificate from the Graduate Institute of International and Comparative Law in Geneva, Switzerland. Mr. Polverari holds a J.D. and a B.S. in economics from Santa Clara University.
William Parsons has served as our chief customer officer and senior vice president of field operations since November 2007. From August 1998 to December 2004, Mr. Parsons served in various positions with PeopleSoft, Inc., a developer of human resource management software which was acquired by Oracle Corporation in December 2004, most recently as vice president of customer relationship management sales. Mr. Parsons holds a B.S. in business and marketing from San Diego State University.
Timothy O’Brien has served in various senior positions with us since January 2001, most recently as our senior vice president, operations and information security. From April 1999 to January 2001, Mr. O’Brien served as vice president of VerticalOne Corporation, a subsidiary of S1 Corporation and consolidator, organizer and presenter of personal account information via the Internet. Mr. O’Brien holds a B.S. in business administration from Stonehill College.
Thomas Hempel has served as our senior vice president engineering since October 2009. From April 2009 to October 2009, Mr. Hempel consulted with Art in Action, an educational nonprofit organization, on the development of an online art curriculum. From December 2005 to April 2009, he served as senior director engineering for NetApp, Inc., a storage and data management solutions company. From September 1999 to December 2005, Mr. Hempel served as vice president engineering for Epiphany, Inc., a developer of customer relationship management software which was acquired by SSA Global Technologies, Inc. in September 2005. Mr. Hempel holds a B.A. in philosophy from Stanford University.
Eric Connors has served in various capacities since joining us in July 2007, most recently as senior vice president of products since October 2011. From May 2005 to July 2007, Mr. Connors
-120-
Table of Contents
served in various capacities at Oracle Corporation, a software and data management developer, most recently as director of international strategy of JD Edwards, a division of Oracle. From December 2000 to May 2005, Mr. Connors served as director of application development at PeopleSoft, Inc. which was acquired by Oracle Corporation in May 2005. Mr. Connors holds an M.B.A. in marketing from The Wharton School, University of Pennsylvania and a B.S. in management from Pennsylvania State University.
Arun Anur has served as our senior vice president of global services, comprised of all implementations and support of our solutions since April 2009. From March 1997 to March 2009, Mr. Anur served in various capacities at Oracle Corporation, a software and data management developer, most recently as vice president, consulting. Mr. Anur holds a M.S. in industrial engineering from Kansas State University and a B.E. in industrial and production engineering from BMS College of Engineering, Bangalore, India.
David Lee has served as our chief marketing officer and senior vice president of marketing since April 2014. From January 2009 to March 2014, he served as vice president of marketing communications for SonicWALL, Inc., a provider of IT network security and secure remote access solutions which was acquired by Dell, Inc. in May 2012 and prior to that, served as a consultant to SonicWALL from August 2005 through December 2008, the Hewlett-Packard Company from December 2005 through August 2006, and Palm, Inc. from January 2008 to November 2008. From January 2005 to July 2005, he served as vice president of marketing for PalmSource which was acquired by Access Co., LTD in September 2005. He also served as founder of the Mnemonic brand marketing practice from 2002 to 2004 and was vice president of marketing for BigFix, Inc. from 2001 to 2002 and vice president of marketing for Obongo, Inc. from 2000 to 2001 which was acquired by AOL in 2001. Mr. Lee holds an MBA in marketing from the University of Michigan and a B.A. in political economies of industrial societies from the University of California at Berkeley.
Arjun Singh has served as our managing director, Asia since June 2012. From January 2012 to June 2012, Mr. Singh was an independent consultant for various companies located in Delhi, India. From December 2009 to December 2011, Mr. Singh served as managing director of human resources and benefit for Hewitt Associates, a provider of human capital and management consulting services which was acquired by Aon Corporation in October 2010. From September 2006 to November 2009, he served as chief executive officer of the banking and financial services division of WNS (Holdings) Ltd., a global business process management company. From January 2004 to September 2006, Mr. Singh served as regional director, Europe, for ABN Amro Bank N.V., a Dutch commercial investment bank. From March 1999 to December 2003, Mr. Singh served as quality and customer fulfillment leader for GE Capital, the financial services unit of General Electric Company. From April 1991 to February 1999, Mr. Singh served as corporate banking manager for ANZ Grindlays Bank, a commercial bank which was acquired by Standard Chartered PLC in July 2000. Mr. Singh holds a B.Tech in chemical engineering from the Indian Institute of Technology in Bombay, India and a PGDM (the equivalent of an M.B.A.) in systems and finance from the Indian Institute of Management, Calcutta, India.
Our executive officers are appointed by our board of directors and serve until their successors have been duly elected and qualified or until his or her earlier resignation or removal. There are no family relationships among any of our directors or executive officers.
Non-Employee Directors
Gayle Crowell has served as our lead independent director since March 2014 and as a member of our board of directors since July 2002. Since June 2001, Ms. Crowell has served as an operational business consultant for Warburg Pincus LLC, a private equity firm. From January 2000 to June 2001, Ms. Crowell served as president of Epiphany, Inc., a developer of customer relationship management
-121-
Table of Contents
software which was acquired by SSA Global Technologies, Inc. in September 2005. From January 1998 to January 2000, Ms. Crowell served as chief executive officer and chairman of RightPoint Corporation, a real-time personalization software company which was acquired by Epiphany, Inc. in January 2000. Ms. Crowell currently serves on the board of directors of Coyote Logistics LLC, a transportation and logistics service provider, as well as Dude Solutions Inc., a provider of facilities maintenance software. Ms. Crowell holds a B.S. in education from the University of Nevada at Reno.
We believe that Ms. Crowell possesses specific attributes that qualify her to serve as a member of our board of directors, including her experience as a senior executive and director of a public company and her experience in the technology and venture capital industries.
Bruce C. Felt, Jr. has served as a member of our board of directors since March 2014. Since July 2012, Mr. Felt has served in various senior positions with Auction.com, LLC, an online real estate sales platform, most recently as chief financial officer. From October 2006 to July 2012, Mr. Felt served as the chief financial officer of SuccessFactors, Inc., a cloud-based software company which was acquired by SAP AG in February 2012. From February 2005 through August 2006, Mr. Felt served as chief financial officer of LANDesk Software, Inc., a security and systems management software company. Subsequent to LANDesk’s acquisition by Avocent Corp. in August 2006, Mr. Felt was retained by Avocent through February 2007 on a transitional basis to manage certain matters. From April 1999 to February 2005, Mr. Felt served as chief financial officer of Integral Development Corporation, a cloud computing software company. Mr. Felt currently sits on the board of directors of Hightail Inc. and has been a member of various non-profit boards. Mr. Felt holds a B.S. in accounting from the University of South Carolina and an M.B.A. from Stanford University Graduate School of Business.
We believe that Mr. Felt possesses specific attributes that qualify him to serve as a member of our board of directors, including his financial and accounting background, as well as his experience serving as a senior executive for publicly traded technology companies.
Patrick T. Hackett has served as a member of our board of directors since February 2008. Mr. Hackett is a member and managing director of Warburg Pincus LLC and a partner of Warburg Pincus & Co., a private equity firm, since June 1990 where he serves as co-head of the Technology, Media and Telecommunications group. Mr. Hackett currently is a director of Bridgepoint Education, Inc., a provider of post–secondary education services, and Nuance Communications, Inc., a provider of voice and language software. In addition, he serves as a trustee on the board of Trinitas Health and Regional Medical Center. Mr. Hackett currently serves on the board of directors of New Breed Logistics, Inc., a third-party logistics provider, as well as RegionalCare Hospital Partners, a company that owns and operates a chain of hospitals. Mr. Hackett graduated from the University of Pennsylvania with a B.A. in chemistry, and holds a B.S. in economics from The Wharton School, University of Pennsylvania.
We believe that Mr. Hackett possesses specific attributes that qualify him to serve as a member of our board of directors, including his experience in the venture capital industry and his years of business and leadership experience.
William Harris, Jr. has served as a member of our board of directors since February 2003. Since January 2009, Mr. Harris has served as co-founder and chief executive officer of Personal Capital Corporation, a wealth management firm which provides personal financial software and services. From October 1999 to March 2000, Mr. Harris served as chief executive officer of PayPal, Inc., an online payments business which was acquired by eBay Inc. in October 2002. From January 1994 to September 1999, Mr. Harris served in various senior positions with Intuit Inc., a developer of financial and tax preparation software, most recently as chief executive officer. Mr. Harris holds an M.B.A. from Harvard Business School and a B.A. in American studies from Middlebury College.
-122-
Table of Contents
We believe that Mr. Harris possesses specific attributes that qualify him to serve as a member of our board of directors, including his experience serving as a senior executive for publicly traded technology companies.
Dennis B. Phelps has served as a member of our board of directors since February 2005. Mr. Phelps is a managing director and general partner of Institutional Venture Partners, a venture capital investment firm, where he has been employed since October 2001. Mr. Phelps also currently serves on the boards of DoubleVerify, Inc. a provider of Internet advertising software, Voxer, Inc., a provider of mobile voice messaging services, and ZEFR, Inc., a provider of Internet video content management software. From November 1999 to April 2001, Mr. Phelps served as a director of acquisitions for the Internet Capital Group, a publicly-traded investment and operating company focused on venture investment in software and Internet companies. From July 1997 to November 1999, Mr. Phelps served as an associate at Battery Ventures, a venture capital investment firm. Mr. Phelps holds a B.A. in government from Dartmouth College.
We believe that Mr. Phelps possesses specific attributes that qualify him to serve as a member of our board of directors, including his extensive experience in the venture capital industry.
Board Composition
Our board of directors is currently composed of six members. Our bylaws permit our board of directors to establish by resolution the authorized number of directors, and eight are currently authorized. We anticipate adding independent directors to our board of directors.
As of the closing of this offering, our amended and restated certificate of incorporation and amended and restated bylaws will provide for a classified board of directors consisting of three classes of directors, each serving staggered three-year terms. The terms of the directors will expire upon the election and qualification of successor directors at the annual meeting of stockholders to be held during the years 2015 for the Class I directors, 2016 for the Class II directors, and 2017 for the Class III directors.
| • | Our Class I directors will be Patrick Hackett and Dennis Phelps. |
| • | Our Class II directors will be Bruce Felt and William Harris. |
| • | Our Class III directors will be Anil Arora and Gayle Crowell. |
Upon expiration of the term of a class of directors, directors for that class will be elected for three-year terms at the annual meeting of stockholders in the year in which that term expires. Each director’s term continues until the election and qualification of his or her successor, or his or her earlier death, resignation or removal. Any increase or decrease in the number of directors will be distributed among the three classes so that, as nearly as possible, each class will consist of one-third of the directors. This classification of our board of directors may have the effect of delaying or preventing changes in control of our company.
Our board of directors is responsible for, among other things, overseeing the conduct of our business, reviewing and, where appropriate, approving our long-term strategic, financial and organizational goals and plans, and reviewing the performance of our chief executive officer and other members of senior management. Following the end of each year, our board of directors will conduct an annual self-evaluation, which includes a review of any areas in which the board of directors or management believes the board of directors can make a better contribution to our corporate governance, as well as a review of our committee structure and an assessment of the board of directors’ compliance with corporate governance principles. In fulfilling the board of directors’ responsibilities, directors have full access to our management and independent advisors.
-123-
Table of Contents
Director Independence
Upon the completion of this offering, our common stock will be listed on the NASDAQ Stock Market. Under the rules of the NASDAQ Stock Market, independent directors must comprise a majority of a listed company’s board of directors within a specified period of the completion of this offering. In addition, the rules of the NASDAQ Stock Market require that, subject to specified exceptions, each member of a listed company’s audit, compensation, and nominating and corporate governance committees must be independent. Audit committee members must also satisfy the independence criteria set forth in Rule 10A-3 under the Securities Exchange Act of 1934, as amended, or the Exchange Act. Under the rules of the NASDAQ Stock Market, a director will only qualify as an “independent director” if, in the opinion of that company’s board of directors, that person does not have a relationship that would interfere with the exercise of independent judgment in carrying out the responsibilities of a director.
In order to be considered to be independent for purposes of Rule 10A-3 of the Exchange Act, a member of an audit committee of a listed company may not, other than in his or her capacity as a member of the audit committee, the board of directors, or any other board committee: (1) accept, directly or indirectly, any consulting, advisory, or other compensatory fee from the listed company or any of its subsidiaries; or (2) be an affiliated person of the listed company or any of its subsidiaries.
In March 2014, our board of directors undertook a review of its composition, the composition of its committees, and the independence of each director. Based upon information requested from and provided by each director concerning his or her background, employment and affiliations, including family relationships, our board of directors has determined that Ms. Crowell and Messrs. Felt, Hackett, Harris and Phelps, representing a majority of our directors, are “independent directors” as defined under the rules of the NASDAQ Stock Market. Our board of directors also determined that Ms. Crowell and Messrs. Harris and Felt, who comprise our audit committee, Ms. Crowell and Mr. Harris, who comprise our compensation committee and Ms. Crowell and Messrs. Hackett and Phelps who comprise our nominating and corporate governance committee, satisfy the independence standards for those committees established by applicable Securities and Exchange Commission, or SEC, rules and the rules of the NASDAQ Stock Market. In making this determination, our board of directors considered the relationships that each non-employee director has with our company and all other facts and circumstances our board of directors deemed relevant in determining their independence, including the beneficial ownership of our capital stock by each non-employee director.
Board Committees
Our board of directors has an audit committee, a compensation committee, and a nominating and corporate governance committee, each of which has the composition and the responsibilities described below.
Audit Committee. Our audit committee oversees our corporate accounting and financial reporting process and assists our board of directors in monitoring our financial systems and our legal and regulatory compliance. Our audit committee will also:
| • | oversee the work of our independent auditors; |
| • | approve the hiring, discharging, and compensation of our independent auditors; |
| • | approve engagements of the independent auditors to render any audit or permissible non-audit services; |
| • | review the qualifications, independence, and performance of our independent auditors; |
| • | review our financial statements and review our critical accounting policies and estimates; |
-124-
Table of Contents
| • | review the adequacy and effectiveness of our internal controls; and |
| • | review and discuss with management and our independent auditors the results of our annual audit, our quarterly financial statements, and our publicly filed reports. |
The members of our audit committee are Ms. Crowell and Messrs. Harris and Felt. Mr. Felt is our audit committee chairperson. Our board of directors has determined that each of the members of our audit committee is independent and financially literate under the current rules and regulations of the SEC and that Mr. Felt qualifies as an “audit committee financial expert” as defined in Item 407(d)(5) of Regulation S-K promulgated under the Securities Act of 1933, as amended, or the Securities Act. We believe that our audit committee charter and the functioning of our audit committee comply with the applicable requirements of rules and regulations of the SEC and .
Compensation Committee. Our compensation committee oversees our corporate compensation programs. The compensation committee will also:
| • | review and recommend policies relating to compensation and benefits of our officers and employees; |
| • | review and approve corporate goals and objectives relevant to compensation of our chief executive officer and other senior officers; |
| • | evaluate the performance of our officers in light of established goals and objectives; |
| • | recommend compensation of our officers based on its evaluations; and |
| • | administer our equity compensation plans. |
The members of our compensation committee are Ms. Crowell and Mr. Harris. Ms. Crowell is the chairperson of our compensation committee. Our board of directors has determined that each member of our compensation committee is independent under the current rules and regulations of the SEC and the NASDAQ Stock Market. We believe that our compensation committee charter and the functioning of our compensation committee comply with the applicable requirements of the rules and regulations of the SEC and the .
Nominating and Corporate Governance Committee. Our nominating and corporate governance committee oversees and assists our board of directors in reviewing and recommending nominees for election as directors. The nominating and governance committee will also:
| • | evaluate and make recommendations regarding the organization and governance of the board of directors and its committees; |
| • | assess the performance of members of the board of directors and make recommendations regarding committee and chair assignments; |
| • | recommend desired qualifications for board of directors membership and conduct searches for potential members of the board of directors; and |
| • | review and make recommendations with regard to our corporate governance guidelines. |
The members of our nominating and corporate governance committee are Ms. Crowell and Messrs. Hackett and Phelps. Ms. Crowell is the chairperson of our nominating and corporate governance committee. Our board of directors has determined that each member of our nominating and governance committee is independent under the current rules and regulations of the SEC and the NASDAQ Stock Market. We believe that the nominating and corporate governance committee charter and the functioning of our nominating and corporate governance committee comply with the applicable requirements of rules and regulations of the SEC and the NASDAQ Stock Market.
-125-
Table of Contents
Risk Committee. Our risk committee oversees our general risk management goals and philosophies pursuant to our risk management program. The risk committee will also:
| • | review and make recommendations to the board of directors with respect to our regulatory compliance with state and federal laws; |
| • | review and make recommendations to the board of directors upon receiving the results of our annual security audits to improve our risk management program; |
| • | review and approve all of our operating risks, including product/service risks, business continuity plans and disaster recovery plans; |
| • | review and provide guidance to us on any new business risk that we may face; and |
| • | review and make recommendations to the board of directors regarding other plans that are proposed for adoption or adopted by us for any risk management matters. |
The members of our risk committee are Ms. Crowell and Mr. Harris. Our board of directors has determined that each member of our risk committee is independent under the current rules and regulations of the SEC and the NASDAQ Stock Market. We believe that the risk committee charter and the functioning of our risk committee comply with the applicable requirements of rules and regulations of the SEC and the NASDAQ Stock Market.
Our board of directors may from time to time establish other committees.
Director Compensation
Compensation paid or accrued for services rendered to us by Mr. Arora in his role as an executive officer is included in “Executive Compensation”.
During 2013, our directors did not receive any cash compensation for their services as directors or as board committee members. However, in 2013, we granted stock options under our 2009 Equity Incentive Plan to Messrs. John C. (Bud) Colligan and Harris and Mses. Crowell and Elizabeth A. Nelson in the amount set forth in the table below for service as directors at an exercise price of $0.85 per share. The following table provides information regarding compensation of our directors for service as directors, for the year ended December 31, 2013.
| Name |
Option Awards(2) |
All Other Compensation |
Total | |||||||||
| John C. (Bud) Colligan(1) |
$ | 30,308 | — | $ | 30,308 | |||||||
| Gayle Crowell |
$ | 30,308 | $ | 96,000 | (3) | $ | 126,308 | |||||
| Bruce C. Felt(4) |
— | — | — | |||||||||
| Patrick T. Hackett |
— | — | — | |||||||||
| William Harris |
$ | 30,308 | — | $ | 30,308 | |||||||
| Elizabeth A. Nelson(5) |
$ | 30,308 | — | $ | 30,308 | |||||||
| Dennis Phelps |
— | — | — | |||||||||
| (1) | Mr. Colligan resigned from our board of directors in June 2014. |
| (2) | The amounts in the “Option Awards” column reflect the aggregate grant date fair value of stock options granted during the fiscal year computed in accordance with FASB ASC Topic 718. The assumptions that we used to calculate these amounts are discussed in Note 12 to our financial statements included at the end of this prospectus. As required by SEC rules, the amounts shown exclude the impact of estimated forfeitures related to service-based vesting conditions. |
| (3) | Ms. Crowell serves as a consultant to Yodlee under a services agreement. Under such agreement, Ms. Crowell advises us on matters related to the general management of Yodlee, including |
-126-
Table of Contents
| providing advice and counsel to our chief executive officer. Ms. Crowell receives a consulting fee of $8,000 per month for such services, which are unrelated to her services as one of our directors. |
| (4) | Mr. Felt joined our board of directors in March 2014. |
| (5) | Ms. Nelson resigned from our board of directors in March 2014. |
The following table lists all outstanding equity awards held by non-employee directors as of December 31, 2013:
| Date of Grant |
Number of Shares Underlying Options Exercisable |
Number of Shares Underlying Options Unexercisable(2) |
Option Exercise Price Per Share ($)(3) |
Option Expiration Date |
||||||||||||||
| John C. (Bud) Colligan(1) |
05/12/11(4)(5) 05/16/12(4)(6) 04/09/13(4)(7) |
|
32,291 29,687 12,500 |
|
|
17,709 45,313 62,500 |
|
$
|
0.58 0.69 0.85 |
|
|
05/12/21 05/16/22 04/09/23 |
| |||||
| Gayle Crowell |
05/18/04(8) 02/17/05(8) 03/16/06(8) 04/29/09(8) 02/02/10(4)(9) 03/23/11(4)(10) 05/16/12(4)(6) 04/09/13(4)(7) |
|
100,000 100,000 100,000 100,000 95,833 34,375 29,687 12,500 |
|
|
— — — — 4,167 15,625 45,313 62,500 |
|
$
|
0.33 0.33 0.33 0.33 0.44 0.63 0.69 0.85 |
|
|
05/18/14 02/17/15 03/16/16 04/29/19 02/02/20 03/23/21 05/16/22 04/09/23 |
| |||||
| Bruce C. Felt(12) |
— | — | — | — | — | |||||||||||||
| Patrick T. Hackett |
— | — | — | — | — | |||||||||||||
| William Harris |
01/13/04(8)(11) 05/18/04(8)(11) 02/17/05(8) 03/16/06(8) 04/29/09(8) 02/02/10(4)(9) 03/23/11(4)(10) 05/16/12(4)(6) 04/09/13(4)(7) |
|
300,000 100,000 100,000 100,000 100,000 95,833 34,375 29,687 12,500 |
|
|
— — — — — 4,167 15,625 45,313 62,500 |
|
$
|
0.33 0.33 0.33 0.33 0.33 0.44 0.63 0.69 0.85 |
|
|
01/13/14 05/18/14 02/17/15 03/16/16 04/29/19 02/02/20 03/23/21 05/16/22 04/09/23 |
| |||||
| Elizabeth A. Nelson(13) |
03/23/11(4)(10) 05/16/12(4)(6) 04/09/13(4)(7) |
|
206,250 29,687 12,500 |
|
|
93,750 45,313 62,500 |
|
$
|
0.63 0.69 0.85 |
|
|
03/23/21 05/16/22 04/09/23 |
| |||||
| Dennis B. Phelps |
03/16/06(8) | 100,000 | — | $ | 0.33 | 03/16/16 | ||||||||||||
| (1) | Mr. Colligan resigned from our board of directors in June 2014. |
| (2) | In the event that we enter into an agreement and complete a transaction resulting in a change of control, 100% of the shares subject to the option which were not vested at the time of the completion of the transaction will accelerate vesting. |
| (3) | This column represents the fair value of a share of our common stock on the date of grant as determined by the board of directors. |
| (4) | This award was granted under the 2009 Equity Incentive Plan. |
| (5) | One forty-eighth (1/48th) of the shares of our common stock subject to the option award vests in 48 equal monthly installments (with the first installment having vested on June 12, 2011), subject to continued service with us through each applicable vesting date. |
| (6) | One forty-eighth (1/48th) of the shares of our common stock subject to the option award vests in 48 equal monthly installments (with the first installment having vested on June 16, 2012), subject to continued service with us through each applicable vesting date. |
-127-
Table of Contents
| (7) | One forty-eighth (1/48th) of the shares of our common stock subject to the option award vests in 48 equal monthly installments (with the first installment having vested on May 1, 2013), subject to continued service with us through each applicable vesting date. |
| (8) | This award was granted under our 1999 Stock Plan. |
| (9) | One forty-eighth (1/48th) of the shares of our common stock subject to the option award vests in 48 equal monthly installments (with the first installment having vested on March 2, 2010), subject to continued service with us through each applicable vesting date. |
| (10) | One forty-eighth (1/48th) of the shares of our common stock subject to the option award vests in 48 equal monthly installments (with the first installment having vested on April 23, 2011), subject to continued service with us through each applicable vesting date. |
| (11) | This option was exercised in full in January 2014. |
| (12) | Mr. Felt joined our board of directors in March 2014. |
| (13) | Ms. Nelson resigned from our board of directors in March 2014. |
In April 2014, our board of directors approved option grants to purchase 88,150 shares of our common stock to each of Messrs. Colligan and Harris and Ms. Crowell. These options have an exercise price of $1.20 per share, the fair market value of our common stock as determined by our board of directors on the grant date, and vests as to 100% of the underlying shares on the earlier of May 15, 2015 or the date of our next annual stockholder meeting, subject to continued service through such date. In April 2014, our board of directors also approved the grant of 24,096 RSUs to each of Messrs. Colligan and Harris and Ms. Crowell. Such RSUs vest as to 100% of the underlying shares on May 15, 2015, subject to continued service through such date. However, if such vesting date is earlier than the date that is six months and one day following the completion of our initial public offering (the “Post IPO Date”), then the related vesting shall occur on the Post IPO Date, and further provided that in all cases vesting shall be subject to continued service through the applicable vesting date. In April 2014, our board of directors approved option grants to purchase 215,980 shares of our common stock to Mr. Felt. These options have an exercise price of $1.20 per share, the fair market value of our common stock as determined by our board of directors on the grant date, and vest as to 33 1/3% of the underlying shares on May 15 of each of 2015, 2016 and 2017, in each case subject to continued service. In April 2014, our board of directors also approved the grant of 59,036 RSUs to Mr. Felt. 33 1/3% of the underlying shares are scheduled to vest on May 15 of each of 2015, 2016 and 2017, provided, however, in each case that if such vesting date is earlier than the Post IPO Date, then the related vesting shall occur on the Post IPO Date, and further provided that in all cases vesting shall be subject to continued service through the applicable vesting date.
In connection with this offering, our compensation committee engaged Compensia, Inc., or Compensia, an independent compensation consulting firm to evaluate our compensation policies for independent directors. Following their review of the data provided by Compensia, our compensation committee recommended, and our board of directors approved, the following cash compensation program for non-employee directors:
| • | $6,875 retainer per quarter for each non-employee director; |
| • | $3,750 retainer per quarter for our lead director; |
| • | $1,875 retainer per quarter for each member of the audit committee and $3,750 retainer per quarter for the chairperson of the audit committee; |
| • | $1,875 retainer per quarter for each member of the compensation committee and $3,750 retainer per quarter for the chairperson of the compensation committee; and |
| • | $625 retainer per quarter for each member of the nominating and governance committee and $1,250 retainer per quarter for the chairperson of the nominating and governance committee. |
-128-
Table of Contents
These cash payments commenced effective April 1, 2014.
In addition to the cash compensation structure described above, our compensation committee recommended and our board of directors approved the equity compensation structure for our independent directors that will be implemented as part of our 2014 Equity Incentive Plan. Each non-employee director who first joins us (other than a director who becomes a non-employee director as a result of terminating employment with us) automatically will be granted a one-time, initial stock option award with a value of $147,000 and a one-time, initial restricted stock unit award with a value of $98,000. Further, each non-employee director automatically will be granted an annual stock option award with a value of $60,000 and an annual restricted stock unit award with a value of $40,000 (provided that the director joined us at least six months prior to the awards’ grant date) on each of our annual stockholder meetings. However, a non-employee director who is not continuing as a director following an annual stockholder meeting will not receive an annual award at such meeting. Unless otherwise determined by our board of directors or our compensation committee, the number of shares underlying each such stock option award will be determined based on its grant date value calculated in accordance with the Black-Scholes option valuation methodology, and the number of shares underlying such restricted stock units will be determined based on the fair market value of the shares of our common stock subject thereto. Each initial equity award is scheduled to vest in three equal, annual installments on the anniversary of the award’s grant date, subject to continued service through each relevant vesting date. Each annual award is scheduled to vest as to 100% of the underlying shares on the earlier of the one-year anniversary of the award’s grant date or the date of our next annual stockholder meeting, subject to continued service through such date. Upon a change in control, all equity awards granted to the director pursuant to our outside director compensation policy will fully vest and become immediately exercisable.
All stock options will be granted with an exercise price equal to the fair market value of our common stock on the date of the grant. For further information regarding the equity compensation of our non-employee directors, see “Executive Compensation—Employee Benefit and Stock Plans—2014 Equity Incentive Plan.”
Code of Business Conduct and Ethics
Our board of directors has adopted a Code of Business Conduct and Ethics that applies to all of our employees, officers, and directors, including our chief executive officer, chief financial officer and other principal executive and senior financial officers.
Compensation Committee Interlocks and Insider Participation
The members of our compensation committee are Ms. Crowell and Mr. Harris. Ms. Crowell is the chairperson of our compensation committee. None of the members of our compensation committee is an officer or employee of our company. None of our executive officers currently serves, or in the past year has served, as a member of the board of directors or compensation committee of any entity that has one or more executive officers serving on our board of directors or compensation committee.
-129-
Table of Contents
2013 Summary Compensation Table
The following table presents information concerning the total compensation of our named executive officers, or NEOs, which consist of our principal executive officer and the next two most highly compensated executive officers, for services rendered to us in all capacities during the year ended December 31, 2013:
Summary Compensation Table
| Name and Principal Position |
Year | Salary | Stock Awards(1) |
Option Awards(1) |
Non-Equity Incentive Plan Compensation ($)(3) |
Total | ||||||||||||||||||
| Anil Arora President and Chief Executive Officer |
2013 | $ | 290,813 | $ | 500,000 | $ | 363,690 | $ | 292,425 | $ | 1,446,928 | |||||||||||||
| Michael Armsby(2) Chief Financial Officer |
2013 | $ | 170,455 | $ | — | $ | 1,621,600 | $ | 86,461 | $ | 1,878,516 | |||||||||||||
| William Parsons Chief Customer Officer |
2013 | $ | 210,651 | $ | 175,000 | $ | 111,128 | $ | 196,535 | $ | 693,314 | |||||||||||||
| (1) | The amounts in these columns represent the aggregate grant date fair value of restricted stock unit awards and stock option awards as computed in accordance with Financial Accounting Standard Board Accounting Standards Codification Topic 718. The assumptions used in calculating the grant date fair value of the awards reported in this column are set forth in the notes to our audited consolidated financial statements included elsewhere in this prospectus. |
| (2) | Michael Armsby joined us in April 2013. |
| (3) | The amounts in these columns represent annual incentives earned for 2013 under our 2013 bonus program, as described in additional detail below. |
Non-equity Incentive Plan Compensation
For 2013, Messrs. Arora, Armsby, and Parsons participated in our 2013 bonus program, which is an annual cash incentive plan under which bonuses may become payable upon achievement of specified performance objectives. The performance goals for 2013 were based on priorities set in our annual operating plan and consisted of specified levels of our operating results and a user-related metric. Our board of directors approved these goals in April 2013. Our board of directors also during early 2013 finalized the payout structure under the 2013 bonus program, whereby achievement at target levels would yield a payout at 100% of the participating NEO’s target cash incentive opportunity. Maximum achievement would result in a payout of 163% of target. Achievement below specified levels of performance would result in no bonus becoming payable under the 2013 bonus program. For 2013, Mr. Arora’s target cash incentive opportunity was 100% of his base salary, Mr. Armsby’s target cash incentive opportunity was 50% of his base salary, subject to proration to reflect the portion of the year that he was employed with us during 2013, and Mr. Parsons’ target cash incentive opportunity was 100% of his base salary.
-130-
Table of Contents
2013 Outstanding Equity Awards at Year-End
The following table presents information concerning all outstanding equity awards held by each of our named executive officers as of December 31, 2013:
| Named Executive Officer |
Grant Date | Option Awards— Number of Securities Underlying Unexercised Options (#) Exercisable |
Option Awards— Number of Securities Underlying Unexercised Options (#) Unexercisable(1) |
Option Awards— Option Exercise Price ($)(2) |
Option Awards— Option Expiration Date |
Stock Awards— Number of Shares or Units of Stock That Have Not Vested (#) |
Stock Awards— Market Value of Shares or Units of Stock That Have Not Vested(3) |
|||||||||||||||||||||
| Anil Arora |
|
05/18/04 02/17/05 10/01/05 09/19/06 03/06/08 03/06/08 07/02/09 07/29/09 02/02/10 03/23/11 05/16/12 04/09/13 04/09/13 |
(4)(15) (4) (4) (4) (4) (5) (4) (4) (6)(7) (6)(8) (6)(9) (6)(10) (6)(11) |
|
500,000 500,000 2,500,000 1,000,000 420,500 1,300,000 522,600 99,900 878,121 171,875 237,500 150,000 |
|
|
— — — — — — — — 38,179 |
|
$ |
0.33 0.33 0.33 0.33 0.33 0.33 0.33 0.33 0.44 0.63 0.69 0.85 |
|
|
05/18/14 02/17/15 10/01/15 09/19/16 03/06/18 03/06/18 07/02/19 07/29/19 02/02/20 03/23/21 05/16/22 04/09/23 |
|
500,000 | $ | 540,000 | ||||||||||
| Michael Armsby |
04/30/13 | (6)(12) | — | 4,000,000 | $ | 0.85 | 04/30/23 | |||||||||||||||||||||
| William Parsons |
|
12/19/07 07/02/09 02/02/10 03/23/11 05/16/12 04/09/13 04/09/13 |
(4)(13) (4)(14) (6)(7) (6)(8) (6)(9) (6)(10) (6)(11) |
|
1,114,927 209,573 483,019 68,750 106,874 45,833 |
|
|
— — 21,001 |
|
$ |
0.33 0.33 0.44 0.63 0.69 0.85 |
|
|
12/19/17 07/02/19 02/02/20 03/23/21 05/16/22 04/09/23 |
|
175,000 | $ | 189,000 | ||||||||||
| (1) | Each award provides that, in the event of a change of control, as defined in our 2009 Equity Incentive Plan, 25% of the award which was not vested at the time of the change of control will vest, and, if we terminate the NEO’s employment without cause or the NEO resigns for good reason (each as defined in the award agreement) at any time within 12 months following the date of the change of control, 100% of the remaining unvested portion of the award will vest. |
| (2) | This column represents the fair value of a share of our common stock on the date of grant, as determined by our board of directors. |
| (3) | The amount reflects the fair market value of our common stock at $1.08 per share as of December 31, 2013, multiplied by the amount shown in the column for the number of shares or units of stock that have not vested. |
| (4) | This award was granted under our 1999 Stock Plan. |
| (5) | This award was granted under our 2001 Stock Plan. |
| (6) | This award was granted under our 2009 Equity Incentive Plan. |
| (7) | One forty-eighth (1/48th) of the shares of our common stock subject to the option award vests in 48 equal monthly installments (with the first installment having vested on March 2, 2010), subject to continued service with us through each applicable vesting date. |
| (8) | One forty-eighth (1/48th) of the shares of our common stock subject to the option award vests in 48 equal monthly installments (with the first installment having vested on April 23, 2011), subject to continued service with us through each applicable vesting date. |
-131-
Table of Contents
| (9) | One forty-eighth (1/48th) of the shares of our common stock subject to the option award vests in 48 equal monthly installments (with the first installment having vested on June 16, 2012), subject to continued service with us through each applicable vesting date. |
| (10) | One forty-eighth (1/48th) of the shares of our common stock subject to the option award vests in 48 equal monthly installments (with the first installment having vested on May 1, 2013), subject to continued service with us through each applicable vesting date. |
| (11) | In the event that we complete our initial public offering before September 30, 2014, 50% of the restricted stock unit will become vested six months after the closing of the initial public offering, subject to continued service with us through that date, and the remaining restricted stock unit will vest in eight equal quarterly installments thereafter, subject to continued service with us though each applicable vesting date. |
| (12) | One-fourth (1/4th) of the shares of our common stock subject to the option award vests on April 25, 2014, and one forty-eighth (1/48th) of the shares of our common stock subject to the option award vests each month thereafter, subject to continued service with us through each applicable vesting date. |
| (13) | One forty-eighth (1/48th) of the shares of our common stock subject to the option award vests in 48 equal monthly installments (with the first installment having vested on October 29, 2008), subject to continued service with us through each applicable vesting date. |
| (14) | One forty-eighth (1/48th) of the shares of our common stock subject to the option award vests in 48 equal monthly installments (with the first installment having vested on July 1, 2009), subject to continued service with us through each applicable vesting date. |
| (15) | This award was exercised in full on May 16, 2014. |
In April 2014, our board of directors approved option grants to purchase 1,432,000 shares of our common stock for Mr. Arora, 314,400 shares for Mr. Armsby and 499,202 shares for Mr. Parsons at an exercise price of $1.20 per share, the fair market value of our common stock as determined by our board of directors on the grant date. 1/48th of the shares subject to the option vest each month following the grant date, subject to continued service. In April 2014, our board of directors also approved the grant of 391,000 RSUs for Mr. Arora, 85,936 RSUs for Mr. Armsby and 136,448 RSUs for Mr. Parsons. 25% of the RSUs will vest on May 15 of each of 2015, 2016, 2017 and 2018, provided, however, in each case that if such vesting date is earlier than the date that is six months and one day following the completion of our initial public offering (the “Post IPO Date”), then the related vesting shall occur on the Post IPO Date, and further provided that in all cases vesting shall be subject to continued service through the applicable vesting date.
Executive Employment Arrangements
Offer Letters
Anil Arora. Under Mr. Arora’s offer letter dated January 27, 2000, we hired Mr. Arora as our president and chief executive officer. The letter provides for Mr. Arora’s initial base salary, cash incentive opportunity and equity award grant, as well as certain severance benefits (which have been superseded by subsequent arrangements as described further below under “—Change of Control Severance Agreements”). Mr. Arora’s current annual base salary is $350,000 and his current target annual cash incentive opportunity is equal to 100% of his base salary.
Michael Armsby. Under Mr. Armsby’s offer letter dated April 8, 2013, we hired Mr. Armsby as our chief financial officer. The letter provides for an annual base salary of $250,000 and a target annual cash incentive opportunity equal to 50% of base salary. The letter also provided for an option to purchase 4,000,000 shares of our common stock, which was granted to him on April 30, 2013. 25% of the shares subject to the option will vest on the one year anniversary of Mr. Armsby’s employment start date, and 1/48th of the shares subject to the option will vest each month thereafter subject in each case
-132-
Table of Contents
to Mr. Armsby’s continued service with us through each applicable vesting date. In the event of our change in control, 25% of the shares subject to the award will accelerate vesting. Mr. Armsby’s current annual base salary is $285,000.
William Parsons. Under Mr. Parsons’s offer letter dated September 28, 2007, we hired Mr. Parsons as our senior vice president of field operations. Mr. Parson’s currently serves as our chief customer officer. The letter provided for Mr. Parson’s initial base salary and cash incentive opportunity. Mr. Parson’s current annual base salary is $250,000 and his current annual target cash incentive opportunity is 100% of his base salary.
Change of Control Severance Agreements
We have entered into Change of Control Severance Agreements, with each of our NEOs, or COC Severance Agreements. Messrs. Arora’s and Parsons’ COC Severance Agreements were amended and restated as of November 19, 2008, and Mr. Armsby’s COC Severance Agreement became effective as of April 25, 2013.
Each COC Severance Agreement provides that if we terminate the executive’s employment with us for any reason other than Cause (as defined in the COC Severance Agreement), or the executive resigns for Good Reason (as defined in the COC Severance Agreement), and in either case the termination occurs within 12 months after a Change of Control (as defined in the COC Severance Agreement), the executive will receive the following severance benefits: (i) a lump sum cash payment equal to 12 months of the executive’s base salary in effect as of the date of such termination or, if greater, as in effect immediately prior to the Change of Control, and (ii) continuing payments to reimburse the executive for COBRA continuation coverage for a period of up to 12 months.
The Agreements also provide that in the event that severance and other benefits that constitute “parachute payments” within the meaning of Section 280G of the Code and would be subject to the excise tax imposed by Section 4999 of the Code, then the NEO’s benefits will be either delivered in full or cut back to the extent that would result in no portion of the benefits being subject to such excise tax, whichever would result in the greater after-tax benefit to the NEO.
As defined in the COC Severance Agreements, “Cause” generally means the executive’s (i) commission of any act of personal dishonesty in connection with executive’s responsibilities as our employee which is intended to result in executive’s substantial personal enrichment, (ii) conviction of a felony which our board of directors reasonably believes has had or will have a material detrimental effect on our reputation or business, (iii) commission of any willful act which constitutes misconduct and is injurious to us, or (iv) continued willful violation by the executive of his or her obligations to us after we have issued a written demand for performance.
As defined in the COC Severance Agreements, “Change of Control” generally means the occurrence of any of the following events: (i) a change in our ownership that occurs on the date that any one person or persons acting as a group, or Person, acquires ownership of our stock that, together with the stock already held by such Person, constitutes more than 50% of the total voting power of our stock; or (ii) a change in our effective control that occurs on the date that a majority of members of our board of directors is replaced during any 12-month period by directors whose appointment or election is not endorsed by a majority of the members of our board of directors prior to the date of such appointment or election; or (iii) a change in the ownership of a substantial portion of our assets that occurs on the date that any Person acquires (or has acquired during a 12-month period) assets from us with a total gross fair market value equal to or more than 50% of the total gross fair market value of all of our assets immediately prior to such acquisition(s).
-133-
Table of Contents
As defined in the COC Severance Agreements, “Good Reason” generally means the executive’s voluntary termination of employment with us following the expiration of our cure period following one or more of the following occurring without the executive’s prior consent: (i) a material reduction in the executive’s gross base salary (reductions of 10% or greater will be considered material and any reductions of less than 10% will be based on facts and circumstances); (ii) a material reduction in the executive’s position, duties, or responsibilities; (iii) a material change in the geographic location at which the NEO performs services (i.e., the relocation of the executive’s principal place of work to a location that is more than 50 miles from the executive’s current principal work site for us) or (iv) our failure to obtain an assumption of such executive’s COC Severance Agreement by any successor to us. The executive may not resign for Good Reason without first providing us with notice within 90 days of the initial existence of the condition that such executive believes constitutes Good Reason identifying the grounds for Good Reason and a reasonable cure period of at least 30 days following the date of such notice, during which period such grounds must not have been cured.
Acceleration of Vesting
We have entered into stock option agreements with our NEOs which provide for an acceleration of vesting upon a change of control (as defined in our 2009 Equity Incentive Plan). Upon such event, 25% of any unvested portion of a stock option award held by an NEO which was not vested at the time of the change of control will vest. If we terminate the NEO’s employment without cause or the NEO resigns for good reason (each as defined in the award agreement) at any time within 12 months following the date of the change of control, 100% of the remaining unvested portion of the award will vest.
We have also granted restricted stock units to our NEOs with accelerated vesting provisions. In the event that we complete our initial public offering before September 30, 2014, 50% of the restricted stock unit will become vested six months after the closing of the initial public offering, subject to the NEO’s continued service with us through that date, and the remaining restricted stock unit will vest in eight equal quarterly installments thereafter, subject to the NEO’s continued service with us through each applicable vesting date. In the event that before September 30, 2014 we enter into a definitive agreement the consummation of which will result in a change in control (as defined in our 2009 Equity Incentive Plan), any unvested restricted stock units will vest immediately prior to such change in control (subject to the award holder’s continued employment through the closing of the change in control).
Employee Benefit and Stock Plans
2014 Equity Incentive Plan
Our board of directors adopted our 2014 Equity Incentive Plan, or our 2014 Plan, in , 2014, and we expect our stockholders will approve it prior to the completion of this offering. Subject to stockholder approval, our 2014 Plan will be effective on the business day immediately prior to the completion of this offering and is not expected to be used until this offering is completed. Our 2014 Plan provides for the grant of incentive stock options, within the meaning of Section 422 of the Internal Revenue Code, to our employees and any of our parent and subsidiaries’ employees, and for the grant of nonstatutory stock options, restricted stock, restricted stock units, stock appreciation rights, performance units and performance shares to our employees, directors and consultants, and our parent and subsidiaries’ employees and consultants.
Authorized Shares. Currently, no awards are issued and outstanding under the 2014 Plan. The total number of shares reserved for issuance under our 2014 Plan is equal to (a) those shares reserved but unissued under our 2009 Plan (as defined below) as of the effective date of the registration statement of which this prospectus forms part and (b) any shares subject to awards granted under our 2009 Plan that, as of the effective date
-134-
Table of Contents
described above, expire or otherwise terminate without having been exercised in full and shares issued pursuant to awards granted under our 2009 Plan that are forfeited to or repurchased by us, provided that the maximum number of shares that may be added to our 2014 Plan pursuant to (a) and (b) is shares. The shares may be authorized, but unissued, or reacquired shares of common stock. The number of shares available for issuance under our 2014 Plan also will include an annual increase on the first day of each fiscal year beginning with the 2015 fiscal year, equal to the least of:
| • | shares; |
| • | 5% of the outstanding shares of common stock as of the last day of our immediately preceding fiscal year; or |
| • | such other amount as our board of directors may determine on or before the last day of our immediately preceding fiscal year. |
Shares issued pursuant to awards under our 2014 Plan that we repurchase or that are forfeited, expire or become unexercisable without having been exercised in full or are surrendered under an exchange program, as well as shares used to pay the exercise price of an award or to satisfy the tax withholding obligations related to an award, will become available for future grant under our 2014 Plan. In addition, to the extent that an award is paid out in cash rather than shares, such cash payment will not reduce the number of shares available for issuance under our 2014 Plan.
Plan Administration. Our compensation committee will administer our 2014 Plan. In the case of options intended to qualify as “performance-based compensation” within the meaning of Section 162(m) of the Internal Revenue Code, the committee will consist of two or more “outside directors” within the meaning of Section 162(m).
Subject to the provisions of our 2014 Plan, the administrator has the power to determine the terms of the awards, including the recipients, the exercise price, the number of shares subject to each such award, the exercisability of the awards, and the form of consideration, if any, payable upon exercise. The administrator also has the authority to amend awards, and may implement an exchange program under which (i) outstanding awards are surrendered or cancelled in exchange for awards of the same type (which may have higher or lower exercise prices and different terms), awards of a different type, and/or cash, (ii) award holders have an opportunity to transfer outstanding awards to a financial institution or other person or entity selected by the administrator, and/or (iii) the exercise price of an outstanding award is increased or reduced. The administrator further may prescribe rules and construe and interpret our 2014 Plan and awards granted under our 2014 Plan. The administrator’s decisions are final and binding on all award recipients and any other holders of awards.
Stock Options. Stock options may be granted under our 2014 Plan. The per share exercise price of options granted under our 2014 Plan must be equal to at least the fair market value of a share of our common stock on the date of grant. The term of an incentive stock option may not exceed 10 years, except that with respect to any participant who owns more than 10% of the voting power of all classes of our outstanding stock, the term must not exceed five years and the exercise price must equal at least 110% of the fair market value on the grant date. Subject to the provisions of our 2014 Plan, the administrator determines the terms of all options, including the acceptable form of consideration for exercising an option.
After the termination of service of an employee, director, or consultant, he or she may exercise his or her option for the period of time stated in his or her award agreement. In the absence of a specified time in an award agreement, an option will remain exercisable for three months following an individual’s termination (or 12 months, if the termination of service is due to death or disability). However, in no event may an option be exercised later than the expiration of its term.
-135-
Table of Contents
Stock Appreciation Rights. Stock appreciation rights may be granted under our 2014 Plan. Stock appreciation rights allow the recipient to receive the appreciation in the fair market value of our common stock between the exercise date and the date of grant. Subject to the provisions of our 2014 Plan, the administrator determines the terms of stock appreciation rights, including when such rights become exercisable and whether to pay any increased appreciation in cash, with shares of our common stock, or a combination of both. The per share exercise price for the shares to be issued pursuant to the exercise of a stock appreciation right will be no less than 100% of the fair market value per share on the date of grant. The term of a stock appreciation right may not exceed 10 years. In the absence of a specified time in an award agreement, a stock appreciation right will remain exercisable for three months following an individual’s termination (or 12 months, if the termination of service is due to death or disability). The administrator will determine the period of time after a participant’s termination of service during which the participant may exercise his or her option. However, in no event may a stock appreciation right be exercised later than the expiration of its term.
Restricted Stock. Restricted stock may be granted under our 2014 Plan. Restricted stock awards are grants of shares of our common stock that vest in accordance with terms and conditions established by the administrator. The administrator will determine the number of shares of restricted stock granted and may impose whatever conditions to vesting it determines to be appropriate. The administrator, in its sole discretion, may accelerate the time at which any restrictions will lapse or be removed. Recipients of restricted stock generally will have voting and dividend rights with respect to such shares upon grant without regard to vesting, unless the administrator provides otherwise. Shares of restricted stock that do not vest are subject to our right of repurchase or forfeiture.
Restricted Stock Units. Restricted stock units may be granted under our 2014 Plan. Restricted stock units are bookkeeping entries representing an amount equal to the fair market value of one share of our common stock. The administrator determines the terms and conditions of restricted stock units, including the number of units granted, the vesting criteria (which may include accomplishing specified performance criteria or continued service to us), and the form and timing of payment. The administrator, in its sole discretion, may accelerate the time at which any restrictions will lapse or be removed. The administrator determines in its sole discretion whether an award will be settled in stock, cash, or a combination of both.
Performance Units and Performance Shares. Performance units and performance shares may be granted under our 2014 Plan. Performance units and performance shares are awards that will result in a payment to a participant only if performance goals established by the administrator are achieved or the awards otherwise vest. Performance units have an initial dollar value established by the administrator on or before the date of grant. Performance shares will have an initial value equal to the fair market value of a share on the date of grant. The administrator may set performance objectives based on company-wide, divisional, business unit or individual performance goals or any other basis in its discretion, which, depending on the extent to which they are met, will determine the number and/or the value of performance units and performance shares to be paid out to participants. After the grant of a performance unit or performance share, the administrator, in its sole discretion, may reduce or waive any performance objectives or other vesting provisions for such performance units or performance shares. The administrator, in its sole discretion, may pay earned performance units or performance shares in the form of cash, in shares, or in some combination thereof.
Non-Employee Directors. Our 2014 Plan provides that all non-employee directors will be eligible to receive all types of awards (except for incentive stock options) under our 2014 Plan. Please see the description of our non-employee director compensation above under “Management—Director Compensation.” However, in any fiscal year, a non-employee director may be granted equity awards with an aggregate grant date fair value of no more than $ , increased to $ in connection with his or her initial service. Awards granted to a non-employee director while he or she was an employee or consultant (other than a non-employee director) will not count toward these limits.
-136-
Table of Contents
Non-Transferability of Awards. Unless the administrator provides otherwise, our 2014 Plan generally does not allow for the transfer of awards other than by will or the laws of descent or distribution, and only the recipient of an award may exercise an award during his or her lifetime.
Certain Adjustments. In the event of certain changes in our capitalization, in order to prevent diminution or enlargement of the benefits or potential benefits to be made available under the 2014 Plan, the administrator will adjust the number and class of shares that may be delivered under our 2014 Plan and/or the number, class, and price of shares covered by each outstanding award, and the numerical share limits set forth in our 2014 Plan. In the event of our proposed liquidation or dissolution, the administrator will notify participants as soon as practicable prior to the transaction, and all awards will terminate immediately prior to the completion of the proposed transaction.
Change in Control. Our 2014 Plan provides that in the event of a change in control, as defined in our 2014 Plan, each outstanding award will be treated as the administrator determines, including that the successor corporation or its parent or subsidiary will assume or substitute an equivalent award for each outstanding award. The administrator is not required to treat all awards similarly in the transaction. If there is no assumption or substitution of outstanding awards, the awards will fully vest, all restrictions will lapse, all performance goals or other vesting criteria will be deemed achieved at 100% of target levels, and the options and stock appreciation rights will become fully exercisable for a period prior to the transaction after the administrator notifies the participants. The awards will terminate upon the expiration of the specified period of time. With respect to awards granted to non-employee directors, in the event of a change in control, the participant will fully vest in options and stock appreciation rights, all restrictions on his or her restricted stock and restricted stock units will lapse, and all performance goals or other vesting requirements for his or her performance shares and units will be deemed achieved at 100% of target levels, and all other terms and conditions met.
Plan Amendment and Termination. The administrator has the authority to amend, suspend or terminate our 2014 Plan provided such action does not materially impair the existing rights of any participant unless mutually agreed in writing between the participant and the administrator. Our 2014 Plan will terminate automatically in 2024, unless we terminate it sooner.
2014 Employee Stock Purchase Plan
Our board of directors adopted our 2014 Employee Stock Purchase Plan, or our ESPP, in , 2014, and we expect that our stockholders will approve it prior to the completion of this offering. Subject to stockholder approval, our ESPP will become effective on the business day immediately prior to the completion of this offering. We believe that allowing our employees to participate in our ESPP provides them with a further incentive towards ensuring our success and accomplishing our corporate goals. Our ESPP is intended to qualify under Section 423 of the Code. Our ESPP also authorizes option grants that do not qualify as an “employee stock purchase plan” under Section 423 of the Code pursuant to rules, procedures or sub-plans adopted by the administrator of our ESPP, which will be designed to achieve tax, security laws or other objectives for us and participants in our ESPP.
Authorized Shares. A total of shares of our common stock will be made available for sale under our ESPP. In addition, our ESPP provides for annual increases in the number of shares available for issuance under our ESPP on the first day of each year beginning with our fiscal year 2015, equal to the least of:
| • | 1% of the outstanding shares of our common stock on the first day of such year; |
| • | shares; or |
| • | such amount as determined by the administrator of our ESPP. |
-137-
Table of Contents
Plan Administration. Our compensation committee will administer our ESPP, and have full and exclusive authority to interpret the terms of our ESPP, determine eligibility to participate, and designate our subsidiaries or affiliates as participating in our ESPP, subject to the conditions of the plan as described below.
Eligibility. Generally, all of our employees, including our executive officers, are eligible to participate in our ESPP if they are employed by us, or any participating subsidiary, for at least 20 hours per week and more than five months in any calendar year. However, an employee may not be granted rights to purchase stock under our ESPP if such employee:
| • | immediately after the grant would own stock possessing 5% or more of the total combined voting power or value of all classes of our capital stock or capital stock of any parent or subsidiaries of ours; or |
| • | hold rights to purchase stock under all of our employee stock purchase plans that accrue at a rate that exceeds $25,000 worth of stock for each calendar year in which his or her option is outstanding at any time. |
Offering Periods. Each offering period will begin on such date as determined by the administrator, and end on an exercise date, as determined by the administrator, in each case in its discretion and on a uniform and nondiscriminatory basis. Offering periods will expire on the earliest of the completion of the purchase of shares on the last exercise date occurring within 27 months of the enrollment date or such shorter period determined by the administrator.
Our ESPP permits participants to purchase shares of common stock through payroll deductions of up to 15% of their eligible compensation, which includes base salary, or other limit established by the administrator for all options to be granted on any enrollment date in an offering. Unless and until otherwise determined by the administrator, a participant may purchase a maximum of 5,000 shares on any exercise date.
Exercise of Purchase Right. Amounts deducted and accumulated by the participant are used to purchase shares of our common stock at the end of each offering period. The purchase price of the shares will be determined by the administrator for all options to be granted in an offering on an enrollment date, but will not be less than 85% of the lower of the fair market value of our common stock on the first trading day of each offering period or on the exercise date. If the fair market value of our common stock on the exercise date is less than the fair market value on the first trading day of the offering period, participants automatically will be withdrawn from the current offering period following their purchase of shares on the purchase date and will be automatically re-enrolled in a new offering period. Participants may end their participation at any time during an offering period and will be paid their accrued contributions that have not yet been used to purchase shares of common stock. Participation ends automatically upon termination of employment with us.
Non-Transferability. A participant may not transfer rights granted under our ESPP, other than by the laws of descent and distribution, or if the administrator permits designation of a beneficiary.
Certain Adjustments. In the event of certain changes in our capitalization, to prevent dilution or enlargement of the benefits or potential benefits available under our ESPP, the administrator will adjust the number and class of shares that may be delivered under our ESPP, the purchase price per share and the number of shares covered by each option and the numerical share limits set forth in our ESPP. In the event of our proposed liquidation or dissolution, the offering period then in progress will be shortened, and a new exercise date will be set to occur before the completion of our liquidation or dissolution, unless the administrator determines otherwise. The administrator will notify each participant that the exercise date has been changed and the participant’s option will be exercised automatically on the new exercise date unless prior to such date the participant has withdrawn from the offering period.
-138-
Table of Contents
Merger or Change in Control. In the event of our merger or change in control, as defined under our ESPP, a successor corporation may assume or substitute each outstanding purchase right. If the successor corporation refuses to assume or substitute for the outstanding purchase right, the offering period then in progress will be shortened, and a new exercise date will be set to occur before the completion of our merger or change in control. The administrator will notify each participant that the exercise date has been changed and the participant’s option will be exercised automatically on the new exercise date unless prior to such date the participant has withdrawn from the offering period.
Plan Amendment and Termination. Our ESPP will terminate automatically in 2034, unless we terminate it sooner. The administrator has the authority to amend, suspend, or terminate our ESPP at any time.
2009 Equity Incentive Plan
Our board of directors adopted and our stockholders approved our 2009 Equity Incentive Plan, or 2009 Plan, in September 2009. Our 2009 Plan most recently was amended in April 2013. Our 2009 Plan permits the grant of incentive stock options, within the meaning of Code Section 422, to our employees and any of our parent and subsidiary corporations’ employees, and for the grant of nonstatutory stock options, stock appreciation rights, restricted stock, and restricted stock units to our employees, directors and consultants and our parent and subsidiary corporations’ employees and consultants. As of the effective date of the registration statement of which this prospectus is a part, our 2009 Plan will be terminated and we will not grant any additional awards under the 2009 Plan. However, our 2009 Plan will continue to govern the terms and conditions of the outstanding awards previously granted thereunder.
Authorized Shares. As of June 30, 2014, the maximum aggregate number of shares issuable under our 2009 Plan is 61,735,638 shares of our common stock. As of June 30, 2014, options to purchase 34,946,706 shares of our common stock at a weighted average exercise price of $0.84 were outstanding under our 2009 Plan, restricted stock units underlying 6,194,372 shares of our common stock were outstanding under our 2009 Plan and 16,793,053 shares of our common stock remained available for future grant under our 2009 Plan. Shares may be authorized, but unissued, or reacquired Company common stock. Shares issued pursuant to awards under our 2009 Plan that expire or become unexercisable without having been exercised in full, are repurchased by or forfeited to us, and shares used to pay the exercise price of an award or to satisfy the tax withholding obligations related to an award, will become available for future grant under our 2009 Plan. Further, awards surrendered in an award exchange program will become available for grant under our 2009 Plan while our 2009 Plan remains in effect. In addition, to the extent that an award is paid out in cash rather than shares, such cash payment will not reduce the number of shares available for issuance under our 2009 Plan while it remains in effect.
Plan Administration. Our 2009 Plan is administered by our board of directors or one or more committees consisting of members of our board of directors or other individuals appointed by our board of directors (referred to as the administrator).
Subject to the provisions of our 2009 Plan, the administrator has the power to determine the terms of awards, including the recipients, the exercise price of the options, the number of shares subject to each award, the fair market value of a share of our common stock, the vesting schedule applicable to the awards, together with any vesting acceleration, the form of consideration, if any, payable upon exercise of the award, and the terms of the award agreement for use under our 2009 Plan, among other powers. The administrator also has the authority to prescribe, amend, and rescind rules and regulations relating to our 2009 Plan, to modify or amend each award, and to allow a participant to defer the receipt of the payment of cash or the delivery of shares that otherwise would be due to such participant under an award. The administrator also may implement and determine the
-139-
Table of Contents
terms of an exchange program under which (i) outstanding options are surrendered or cancelled in exchange for awards of the same type, awards of a different type, and/or cash, (ii) participants would have the opportunity to transfer any outstanding awards to a financial institution or other person or entity selected by the administrator, and/or (iii) the exercise price of an outstanding award is reduced or increased. The administrator may make all other determinations deemed necessary or advisable for administering our 2009 Plan. The administrator’s decisions, determinations and interpretations will be final and binding on all participants.
Stock Options. Stock options may be granted under our 2009 Plan. The exercise price per share of options must equal at least the fair market value of a share of our common stock on the grant date. The term of an option may not exceed ten years; provided, however, that an incentive stock option held by a participant who owns more than 10% of the total combined voting power of all classes of our stock or of the stock of our parent or subsidiary corporations on the date of grant, may not have a term in excess of five years and must have an exercise price of at least 110% of the fair market value of our common stock on the date of grant. The administrator will determine the methods of payment of the exercise price of an option as well as the period of time after a participant’s termination of service during which the participant may exercise his or her option, which generally must be at least 30 days (or at least six months in the event of the participant’s termination as a result of death or disability). However, in no event may an option be exercised later than the expiration of its term. The specific terms will be set forth in an award agreement.
Stock Appreciation Rights. Stock appreciation rights may be granted under our 2009 Plan. Stock appreciation rights allow the recipient to receive the appreciation in the fair market value of our common stock between the exercise date and the date of grant. Subject to the provisions of our 2009 Plan, the administrator determines the terms of stock appreciation rights, including when such rights become exercisable and whether to pay any increased appreciation in cash or with shares of our common stock, or a combination thereof, except that the per share exercise price for the shares to be issued pursuant to the exercise of a stock appreciation right will be no less than 100% of the fair market value per share on the date of grant. The term of a stock appreciation right may not exceed ten years and the period of time after a participant’s termination of service during which the participant may exercise his or her option, which generally must be at least 30 days (or at least six months in the event of the participant’s termination as a result of death or disability). However, in no event may a stock appreciation right be exercised later than the expiration of its term. The specific terms will be set forth in an award agreement.
Restricted Stock. Restricted stock may be granted under our 2009 Plan. Restricted stock awards are grants of shares of our common stock that are subject to various restrictions, including restrictions on transferability and forfeiture provisions. Shares of restricted stock will vest and the restrictions on such shares will lapse, in accordance with terms and conditions established by the administrator. Recipients of restricted stock awards generally will have voting and dividend rights with respect to such shares unless the administrator determines otherwise. Shares of restricted stock that do not vest for any reason may be repurchased by us. The specific terms will be set forth in an award agreement.
Restricted Stock Units. Restricted stock units may be granted under our 2009 Plan. Restricted stock units are bookkeeping entries representing an amount equal to the fair market value of one share of our common stock. The administrator determines the terms and conditions of restricted stock units, including the number of units granted, the vesting criteria (which may include accomplishing specified performance criteria or continued service to us), and the form and timing of payment. The administrator, in its sole discretion, may accelerate the time at which any restrictions will lapse or be removed. Restricted stock units may be settled in cash, shares or a combination of both. The specific terms will be set forth in an award agreement.
-140-
Table of Contents
Transferability of Awards. Unless the administrator provides otherwise, our 2009 Plan generally does not allow for the transfer of awards except by will or the laws of descent and distribution, and only the recipient of an award may exercise such an award during his or her lifetime.
Certain Adjustments. In the event of certain changes in our capitalization, to prevent diminution or enlargement of the benefits or potential benefits available under our 2009 Plan, the administrator will adjust the number and class of shares that may be issued under our 2009 Plan (while our 2009 Plan remains in effect) and/or the number, class and price of shares covered by each outstanding award. In the event of our proposed liquidation or dissolution, the administrator will notify participants as soon as practicable prior to the effective date of the proposed transaction and each award will terminate immediately prior to the consummation of such action unless otherwise determined by the administrator.
Merger or Change in Control. Our 2009 Plan provides that in the event of a merger or change of control, each outstanding award will be treated as the administrator determines, including, without limitation, that each award be assumed or an equivalent award substituted by the acquiring or succeeding corporation (or its affiliate). The administrator is not required to treat all awards similarly in the transaction. If there is no assumption of outstanding awards, the awards will fully vest, all restrictions on the awards will lapse, all performance goals or other vesting criteria applicable to such awards will be deemed achieved at 100% of target levels and with respect to stock options and stock appreciation rights, the awards will become exercisable for a period of time determined by the administrator in its sole discretion after the administrator notifies the participants. Stock options and stock appreciation rights not assumed or substituted for will terminate upon the expiration of such period for no consideration.
Plan Amendment and Termination. Our board of directors has the authority to amend, alter, suspend, or terminate our 2009 Plan provided such action does not impair the existing rights of any participant (unless mutually agreed in writing between the participant and the administrator. Upon the completion of this offering, our 2009 Plan will be terminated and no further awards will be granted thereunder. All outstanding awards will continue to be governed by their existing terms.
2001 Stock Plan
Our board of directors adopted and our stockholders approved our 2001 Stock Plan, or 2001 Plan, in June 2001. Our 2001 Plan most recently was amended in March 2008 and expired by its terms in June 2011. Our 2001 Plan permitted the grant of incentive stock options, within the meaning of Code Section 422, to our employees and any of our parent and subsidiary corporations’ employees, and for the grant of nonstatutory stock options, to our employees, directors, and consultants and our parent and subsidiary corporations’ employees and consultants. No awards have been granted under our 2001 Plan since it expired and no awards will be granted under our 2001 Plan in the future. However, our 2001 Plan will continue to govern the terms and conditions of the outstanding awards previously granted thereunder.
Authorized Shares. Our 2001 Plan expired and accordingly, no shares are available for issuance under our 2001 Plan. As of June 30, 2014, options to purchase 1,300,000 shares of our common stock at a weighted average exercise price of $0.33 were outstanding under our 2001 Plan. Shares may be authorized, but unissued, or reacquired Company common stock.
Plan Administration. Our 2001 Plan is administered by our board of directors or one or more committees consisting of directors appointed by our board of directors (referred to as the administrator).
Subject to the provisions of our 2001 Plan, the administrator has the power to determine the terms of awards, including the recipients, the exercise price of the options, the number of shares subject to each award, the fair market value of a share of our common stock, the vesting schedule
-141-
Table of Contents
applicable to the awards, together with any vesting acceleration, the form of consideration, if any, payable upon exercise of the award, and the terms of the award agreement for use under our 2001 Plan, among other powers. The administrator also has the authority to prescribe rules and to construe and interpret our 2001 Plan and awards granted under our 2001 Plan. The administrator may at any time offer to buy out an option in exchange for a payment in cash or shares based on terms and conditions that the administrator determines and communicates to the participant. The administrator’s decisions, determinations and interpretations will be final and binding on all participants.
Stock Options. Stock options were permitted to be granted under our 2001 Plan. The exercise price per share of incentive stock options must equal at least 100% of the fair market value per share of our common stock on the date of grant and the term of an option granted under our 2001 Plan may not exceed ten years. However, an incentive stock option granted to a participant who owns more than 10% of the total combined voting power of all classes of our stock or the stock of any of our parent or subsidiary corporations on the date of grant, may not have a term in excess of five years and must have an exercise price of at least 110% of the fair market value of our common stock on the grant date. The specific terms of each award are set forth in an award agreement.
Transferability of Awards. Our 2001 Plan generally does not allow for the transfer of awards except by will or the laws of descent and distribution, and only the recipient of an award may exercise such an award during his or her lifetime.
Certain Adjustments. In the event of any increase or decrease in the number or type of issued shares of resulting from certain changes in our capitalization, the administrator will make proportional adjustments to the number, price, and type of shares covered by each outstanding award. In the event of our proposed liquidation or dissolution, the administrator will notify participants as soon as practicable prior to the effective date of the proposed transaction and each award will terminate immediately prior to the consummation of such action unless otherwise determined by the administrator.
Merger or Change in Control. Our 2001 Plan provides that in the event of a merger or change of control, as defined under our 2001 Plan, each outstanding award will be assumed or substituted by the successor corporation. If there is no assumption or substitution of outstanding options, participants will fully vest in all of their outstanding options and our board of directors will notify participants at least 15 days prior to such proposed transaction that their options are fully exercisable and will terminate prior to the completion of the proposed transaction.
Plan Amendment. Our board of directors may amend our 2001 Plan at any time, provided such action does not impair the existing rights of any participant unless mutually agreed in writing between the participant and the administrator.
1999 Stock Plan
Our board of directors adopted and our stockholders approved our 1999 Stock Plan, or 1999 Plan, in September 1999. Our 1999 Plan most recently was terminated by our board of directors in September 2009 in connection with the adoption of our 2009 Plan. Our 1999 Plan permitted the grant of incentive stock options, within the meaning of Code Section 422, to our employees and any of our parent and subsidiary corporations’ employees, and for the grant of nonstatutory stock options, and stock purchase rights to our employees, directors and consultants and our parent and subsidiary corporations’ employees and consultants. No awards have been granted under our 1999 Plan since its termination and no awards will be granted under our 1999 Plan in the future. However, our 1999 Plan will continue to govern the terms and conditions of the outstanding options previously granted thereunder.
-142-
Table of Contents
Authorized Shares. Our 1999 Plan terminated in September 2009 and accordingly, no shares are available for issuance under our 1999 Plan. As of June 30, 2014, options to purchase 15,724,569 shares of our common stock at a weighted average exercise price of $0.33 were outstanding under our 1999 Plan.
Plan Administration. Our 1999 Plan is administered by our board of directors or one or more additional committees consisting of directors appointed by our board of directors (referred to as the administrator). Shares may be authorized, but unissued, or reacquired Company common stock.
Subject to the provisions of our 1999 Plan, the administrator has the power to determine the terms of awards, including the recipients, the exercise price, the number of shares subject to each award, the fair market value of a share of our common stock, the vesting schedule applicable to the awards, together with any vesting acceleration, the form of consideration, if any, payable upon exercise of the award, and the terms of the award agreement for use under our 1999 Plan, among other powers. The administrator also has the authority, subject to the terms of our 1999 Plan, to institute an exchange program under which the exercise price of an outstanding options are exchanged for options with a lower exercise price, to reduce the per share exercise price of any option to the then-current fair market value per share of our common stock if the fair market value has declined since the option’s grant, and to prescribe rules and to construe and interpret our 1999 Plan and awards granted under our 1999 Plan. The administrator’s decisions, determinations and interpretations are final and binding on all participants.
Stock Options. Stock options were permitted to be granted under our 1999 Plan. The exercise price per share of options must equal at least 100% of the fair market value per share of common stock on the date of grant and the term of an option granted under our 1999 Plan may not exceed ten years. However, an incentive stock option held by a participant who owns more than 10% of the total combined voting power of all classes of our stock or the stock of any of our parent or subsidiary corporations on the date of grant, may not have a term in excess of five years and must have an exercise price of at least 110% of the fair market value of our common stock on the grant date. The specific terms of each award are set forth in an award agreement.
Stock Purchase Rights. Stock purchase rights to acquire restricted stock were permitted to be granted pursuant to restricted stock purchase agreements adopted under our 1999 Plan. Stock purchase rights are grants of rights to purchase our shares that are subject to various restrictions, including restrictions on transferability and forfeiture provisions. After the administrator determines that it will offer stock purchase rights, it will advise the purchaser of the terms, conditions and restrictions related to the offer, including the number of shares that the purchaser is entitled to purchase, the price to be paid (if any) and the time within which the purchaser must accept such offer. A purchaser accepts the offer by execution of a restricted stock purchase agreement in the form determined by the administrator. Once the stock purchase right is exercised, the purchaser generally will have rights equivalent to a stockholder.
Transferability of Awards. Unless the administrator provides otherwise, our 1999 Plan generally does not allow for the transfer of awards except by will or by the laws of descent and distribution, and only the recipient of an award may exercise such an award during his or her lifetime.
Certain Adjustments. In the event of any increase or decrease in the number of issued shares of our common stock resulting from certain changes in our capitalization, to prevent diminution or enlargement of the benefits or potential benefits available under our 1999 Plan, proportional adjustments will be made to the number and price of shares covered by each outstanding award. In the event of our proposed liquidation or dissolution, the administrator will notify participants as soon as practicable prior to the effective date of the proposed transaction and each award will terminate immediately prior to the consummation of such action.
-143-
Table of Contents
Merger or Asset Sale. Our 1999 Plan provides that in the event of a merger with or into another corporation or the sale of all or substantially all of our assets, each outstanding award will be assumed or substituted by the successor corporation. If there is no assumption or substitution of outstanding awards, participants will fully vest in all of their outstanding awards and the administrator will notify participants that awards will be exercisable for 15 days from the date of the notice. The award will then terminate upon the expiration of the 15-day period.
Plan Amendment. Our board of directors may amend our 1999 Plan at any time, provided such action does not impair the existing rights of any participant unless mutually agreed in writing between the participant and the administrator.
Executive Incentive Compensation Plan
In March 2014, our board of directors adopted an Executive Incentive Compensation Plan, referred to as our Bonus Plan. Our Bonus Plan will allow our compensation committee to provide cash incentive awards to selected employees, including our NEOs, based upon performance goals established by our compensation committee.
Under the Bonus Plan, our compensation committee will determine the performance goals applicable to awards, which goals may include, without limitation: attainment of research and development milestones, sales bookings, business divestitures and acquisitions, cash flow, cash position, earnings (which may include any calculation of earnings, including but not limited to earnings before interest and taxes, earnings before taxes, earnings before interested, taxes, depreciation and amortization and net earnings), earnings per share, net income, net profit, net sales, operating cash flow, operating expenses, operating income, operating margin, overhead or other expense reduction, product defect measures, product release timelines, productivity, profit, return on assets, return on capital, return on equity, return on investment, return on sales, revenue, revenue growth, sales results, sales growth, stock price, time to market, total stockholder return, working capital, and individual objectives such as peer reviews or other subjective or objective criteria. Performance goals that include the Company’s financial results may be determined in accordance with U.S. generally accepted accounting principles, or GAAP, or such financial results may consist of non-GAAP financial measures and any actual results may be adjusted by our compensation committee for one-time items or unbudgeted or unexpected items when determining whether the performance goals have been met. The goals may be on the basis of any factors our compensation committee determines relevant, and may be adjusted on an individual, divisional, business unit or company-wide basis. Any criteria used may be measured on such basis as our compensation committee determines. The performance goals may differ from participant to participant and from award to award.
Our compensation committee may, in its sole discretion and at any time, increase, reduce or eliminate a participant’s actual award, and/or increase, reduce or eliminate the amount allocated to the bonus pool for a particular performance period. The actual award may be below, at or above a participant’s target award, in our compensation committee’s discretion. Our compensation committee may determine the amount of any reduction on the basis of such factors as it deems relevant, and it is not be required to establish any allocation or weighting with respect to the factors it considers.
Actual awards are paid in cash (or its equivalent) in a single lump sum only after they are earned and approved by our compensation committee. Unless otherwise determined by our compensation committee, to earn an actual award, a participant must be employed by the Company (or an affiliate of the Company) through the date the bonus is paid. Payment of bonuses occurs as soon as administratively practicable after they are earned, but no later than the dates set forth in the Bonus Plan.
-144-
Table of Contents
Our board of directors has the authority to amend, alter, suspend or terminate the Bonus Plan provided such action does not alter or impair the existing rights of any participant with respect to any earned bonus.
401(k) Plan
We maintain a 401(k) retirement plan for all employees who satisfy certain eligibility requirements, including the level of regularly scheduled hours of service. The 401(k) plan is intended to be a tax-qualified defined contribution plan under Section 401(k) of the Internal Revenue Code. The 401(k) plan includes a salary deferral arrangement pursuant to which participants may elect to reduce their current compensation up to the statutorily prescribed limit, which was equal to $17,500 in 2013 and remains the same for 2014 (catch up contributions for employees age 50 or over allow for up to an additional $5,500 in contributions each year), and have the amount of their compensation reduction contributed to the 401(k) plan.
Limitation on Liability and Indemnification Matters
Our amended and restated certificate of incorporation and amended and restated bylaws, each to be effective upon the completion of this offering, will provide that we will indemnify our directors and officers, and may indemnify our employees and other agents, to the fullest extent permitted by the Delaware General Corporation Law, which prohibits our amended and restated certificate of incorporation from limiting the liability of our directors for the following:
| • | any breach of the director’s duty of loyalty to us or to our stockholders; |
| • | acts or omissions not in good faith or that involve intentional misconduct or a knowing violation of law; |
| • | unlawful payment of dividends or unlawful stock repurchases or redemptions; and |
| • | any transaction from which the director derived an improper personal benefit. |
If Delaware law is amended to authorize corporate action further eliminating or limiting the personal liability of a director, then the liability of our directors will be eliminated or limited to the fullest extent permitted by Delaware law, as so amended. Our amended and restated certificate of incorporation does not eliminate a director’s duty of care and in appropriate circumstances, equitable remedies, such as injunctive or other forms of non-monetary relief, remain available under Delaware law. This provision also does not affect a director’s responsibilities under any other laws, such as the federal securities laws or other state or federal laws. Under our amended and restated bylaws, we will also be empowered to purchase insurance on behalf of any person whom we are required or permitted to indemnify.
In addition to the indemnification required in our amended and restated certificate of incorporation and amended and restated bylaws, we plan to enter into indemnification agreements with each of our current directors, officers, and certain employees before the completion of this offering. These agreements will provide indemnification for certain expenses and liabilities incurred in connection with any action, suit, proceeding, or alternative dispute resolution mechanism, or hearing, inquiry, or investigation that may lead to the foregoing, to which they are a party, or are threatened to be made a party, by reason of the fact that they are or were a director, officer, employee, agent, or fiduciary of our company, or any of our subsidiaries, by reason of any action or inaction by them while serving as an officer, director, employee, agent, or fiduciary, or by reason of the fact that they were serving at our request as a director, officer, employee, agent, or fiduciary of another entity. In the case of an action or proceeding by, or in the right of, our company or any of our subsidiaries, no indemnification will be provided for any claim where a court determines that the indemnified party is prohibited from receiving
-145-
Table of Contents
indemnification. We believe that these bylaw provisions and indemnification agreements are necessary to attract and retain qualified persons as directors and officers. We also maintain directors’ and officers’ liability insurance.
The limitation of liability and indemnification provisions in our amended and restated certificate of incorporation and amended and restated bylaws may discourage stockholders from bringing a lawsuit against directors for breach of their fiduciary duties. They may also reduce the likelihood of derivative litigation against directors and officers, even though an action, if successful, might benefit us and our stockholders. A stockholder’s investment may be harmed to the extent we pay the costs of settlement and damage awards against directors and officers pursuant to these indemnification provisions. Insofar as we may provide indemnification for liabilities arising under the Securities Act to our directors, officers, and controlling persons pursuant to the foregoing provisions, or otherwise, we have been advised that, in the opinion of the SEC, such indemnification is against public policy as expressed in the Securities Act, and is, therefore, unenforceable. There is no pending litigation or proceeding naming any of our directors or officers as to which indemnification is being sought, nor are we aware of any pending or threatened litigation that may result in claims for indemnification by any director or officer.
-146-
Table of Contents
CERTAIN RELATIONSHIPS AND RELATED PARTY TRANSACTIONS
In addition to the director and executive compensation arrangements discussed above in “Management,” and “Executive Compensation” and the registration rights described below in “Description of Capital Stock—Registration Rights,” below we describe transactions since January 1, 2011, to which we have been or will be a party, in which the amount involved exceeded or will exceed $120,000, and in which any of our directors, executive officers or holders of more than 5% of any class of our voting stock, or any member of the immediate family of, or person sharing the household with, any of these individuals, had or will have a direct or indirect material interest.
Sale of Series DD Preferred Stock
Between May and June 2012, we sold an aggregate of 8,000,000 shares of our Series DD convertible preferred stock at a per share purchase price of $1.25 pursuant to a stock purchase agreement. Purchasers of our Series DD preferred stock included funds affiliated with Warburg Pincus, which funds hold more than 5% of our outstanding capital stock and whose representatives, Gayle Crowell and Patrick Hackett, are members of our board of directors; funds affiliated with Institutional Venture Partners, which funds hold more than 5% of our outstanding capital stock and whose representative, Dennis Phelps, is a member of our board of directors; funds affiliated with Accel Partners, which funds hold more than 5% of our outstanding capital stock and whose representative, John C. (Bud) Colligan, was a member of our board of directors at the time of the transaction; and S1 Corporation, which holds more than 5% of our outstanding capital stock. In addition, William Harris, a member of our board of directors, also purchased shares of our Series DD preferred stock in this transaction. The following table summarizes the investment amounts of our officers, directors and principal stockholders:
| Name of Stockholder |
Number of Series DD Convertible Preferred Shares |
Total Purchase Price |
||||||
| Funds affiliated with Warburg Pincus |
4,216,253 | $ | 5,270,316 | |||||
| Funds affiliated with Institutional Venture Partners |
1,433,001 | 1,791,251 | ||||||
| Funds affiliated with Accel Partners |
1,048,766 | 1,310,957 | ||||||
| S1 Corporation |
837,104 | 1,046,380 | ||||||
| William Harris |
40,000 | 50,000 | ||||||
Bank of America Agreement
In June 2007, we entered into a General Services Agreement with Bank of America, N.A., a wholly-owned subsidiary of Bank of America Corporation, which beneficially owns in the aggregate more than 5% of our common stock (on an as-converted basis). Pursuant to the agreement, we provide to Bank of America, N.A. for use by its customers online personal financial management applications, including, but not limited to, account and transaction management, budgeting and bill reminders. For the years ended December 31, 2011, 2012, 2013 and the six months ended June 30, 2013 and 2014, revenue from Bank of America, N.A. was $11.2 million, $10.6 million, $10.4 million, $5.3 million and $5.9 million, respectively. As of June 30, 2014, we had an outstanding account receivable from Bank of America, N.A. of $2.7 million. Bank of America may terminate the agreement with 45 days’ prior written notice to us. This agreement will terminate pursuant to its terms on December 31, 2017, unless otherwise extended.
Personal Capital Agreement
In January 2007, we entered into a Services Agreement with IronKey, Inc., or IronKey, which agreement was subsequently amended to add SafePage Corporation, or SafePage, as a party and
-147-
Table of Contents
then later assigned by IronKey and SafePage to Personal Capital Corporation, or Personal Capital. William Harris, a member of our Board of Directors, is the chairman and chief executive officer of Personal Capital. Pursuant to the agreement, we provide to Personal Capital the Yodlee platform software development kit and services under our PersonalFinance application, including account aggregation and management, financial planning, transaction detail and monitoring and other data and services generally available in the application. For the years ended December 31, 2011, 2012 and 2013, and the six months ended June 30, 2013 and 2014, revenue from Personal Capital was $0.2 million, $0.4 million, $0.4 million, $0.1 million and $0.4 million, respectively. As of June 30, 2014, we had an outstanding account receivable from Personal Capital of $0.1 million. Either party may terminate the agreement under certain circumstances, including if the other party breaches a material term of the agreement and fails to cure the breach within 90 days. This agreement will terminate pursuant to its terms on August 31, 2015, unless otherwise extended.
S1 Corporation Agreement
In April 2008, we entered into a Services Agreement with S1 Corporation, or S1, which holds more than 5% of our common stock (on an as-converted basis). Pursuant to the agreement, we provide to S1 for use by its customers our online personal financial management solution and our CustomerCare solution. For the years ended December 31, 2011, 2012 and 2013 and the six months ended June 30, 2013 and 2014, revenue from S1 was $62,000, $91,000, $142,000, $65,000 and $85,000, respectively. As of June 30, 2014, we had an outstanding account receivable from S1 of $22,000. Either party may terminate the agreement under certain circumstances, including if the other party breaches a material term of the agreement and fails to cure the breach within 90 days. This agreement will terminate pursuant to its terms on March 31, 2015, unless otherwise extended.
Repurchase of Common Stock
On May 16, 2014, we entered into separate Stock Transfer Agreements with four of our employees holding options to purchase shares of our common stock, including Anil Arora, our President and Chief Executive Officer, and Joseph Polverari, our Chief Strategy and Development Officer, which stock options were expiring by their terms on May 18, 2014. Pursuant to the terms of the Stock Transfer Agreements, we purchased from such holders a portion of the number of shares issued upon exercise of the stock options with a value equal to the exercise price of such stock options, plus the taxes related to the exercise of such stock options. We paid $1.21 per share for the purchased shares, which was the fair market value of our common stock on the date of such purchases. The total amount we paid for the purchased shares was approximately $396,064, of which Mr. Arora received approximately $309,580 and Mr. Polverari received approximately $67,509.
Investors’ Rights Agreement
We are party to an amended and restated investors’ rights agreement with certain holders of our convertible preferred stock, including our principal stockholders with whom Ms. Gayle Crowell and Messrs. Patrick T. Hackett and Dennis B. Phelps are affiliated. The investors’ rights agreement includes demand registration rights, piggyback registration rights and short-form registration rights. These stockholders are entitled to certain rights with respect to the registration of their shares following the completion of this offering. For a description of these registration rights, see “Description of Capital Stock—Registration Rights.” Pursuant to the terms of the investors’ rights agreement, Banc of America Strategic Investments Corporation, or BASIC, has a right of first offer in connection with certain of our financing transactions and a right of first refusal in connection with certain transactions involving the acquisition of Yodlee. This right of first offer and right of first refusal will terminate upon the closing of this offering.
-148-
Table of Contents
Voting Agreement
We are party to an amended and restated voting agreement under which certain holders of our convertible capital stock, including our principal stockholders with whom Ms. Crowell and Messrs. Hackett and Phelps are affiliated, have agreed to vote in a certain manner on certain matters, including with respect to the election of directors, changes in the size of the board of directors, the filling of vacancies on the board of directors and the removal of directors. Upon the closing of this offering, the voting agreement will terminate and none of our stockholders will have any special rights regarding the election or designation of members of our board of directors.
Co-Sale Agreement
We are party to an amended and restated co-sale agreement with our founders and certain holders of our convertible preferred stock, including our principal stockholders with whom Ms. Crowell and Messrs. Hackett and Phelps are affiliated, pursuant to which the holders of our convertible preferred stock have a right of first refusal and co-sale in respect of certain sales of securities by our founders. Upon the closing of this offering, the co-sale agreement will terminate.
Offer Letters
We have entered into offer letters and other agreements containing compensation, termination and change of control provisions, among others, with certain of our executive officers as described under “Executive Compensation—Executive Employment Arrangements—Offer Letters.”
Indemnification of Officers and Directors
We have also entered into indemnification agreements with each of our directors and executive officers. The indemnification agreements and our certificate of incorporation and bylaws require us to indemnify our directors, executive officers to the fullest extent permitted by Delaware law. See “Executive Compensation—Limitation on Liability and Indemnification Matters.”
Policies and Procedures for Related Party Transactions
Our amended and restated audit committee charter will be effective when we complete this offering. The charter states that our audit committee is responsible for reviewing and approving in advance any related party transaction. All of our directors, officers and employees are required to report to the audit committee prior to entering into any transaction, arrangement or relationship, or any series of similar transactions, arrangements or relationships, in which we are to be a participant, the amount involved exceeds $120,000 and a related person had or will have a direct or indirect material interest, including purchases of goods or services by or from the related person or entities in which the related person has a material interest, indebtedness, guarantees or indebtedness and employment by us of a related person. Prior to the completion of this offering, our full board of directors reviewed and approved related party transactions.
We believe that we have executed all the transactions described above on terms no less favorable to us than we could have obtained from unaffiliated third parties. It is our intention to ensure that all future transactions between us and our officers, directors and principal stockholders and their affiliates, are approved by the audit committee of our board of directors, and are on terms no less favorable to us than those that we could obtain from unaffiliated third parties.
-149-
Table of Contents
The following table sets forth information regarding beneficial ownership of our common stock as of June 30, 2014, and as adjusted to reflect the shares of common stock to be issued and sold in the offering assuming no exercise of the underwriters’ option to purchase additional shares from us in the offering, by:
| • | each person or group of affiliated persons known by us to be the beneficial owner of more than 5% of our common stock; |
| • | each of our named executive officers; |
| • | each of our directors; and |
| • | all executive officers and directors as a group. |
We have determined beneficial ownership in accordance with SEC rules, which includes voting or investment power with respect to shares of our common stock. Under these rules, the number of shares of common stock beneficially owned by a person, entity or group, and the corresponding voting percentage ownership of that person, entity or group, includes shares issuable upon the exercise of options held by the respective person, entity or group which may be exercised or converted within 60 days after June 30, 2014. We did not deem these shares to be outstanding, however, for the purpose of computing the percentage ownership of any other person, entity or group.
Applicable percentage ownership is based on 220,702,831 shares of our common stock outstanding at June 30, 2014, assuming the automatic conversion of all outstanding shares of our convertible preferred stock on a one-for-one basis into 144,452,172 shares of our common stock. For purposes of the table below, we have assumed that shares of common stock will be outstanding upon completion of this offering.
-150-
Table of Contents
Unless otherwise indicated in the footnotes below, and subject to applicable community property laws, each stockholder named in the following table possesses sole voting and investment power over the shares listed. The information does not necessarily indicate beneficial ownership for any other purpose. Unless otherwise noted below, the address of each person listed on the table is c/o Yodlee, Inc., 3600 Bridge Parkway, Suite 200, Redwood City, California 94065.
| Shares Beneficially Owned Prior to the Offering |
Shares Beneficially Owned After the Offering | |||||||||||||
| Name and Address of Beneficial Owner |
Shares | Percentage | Shares | Percentage | ||||||||||
| 5% Stockholders: |
||||||||||||||
| Funds affiliated with Warburg Pincus(1) |
81,606,986 | 36.98 | 81,606,986 | |||||||||||
| Entities affiliated with Bank of America Corporation(2) |
27,885,394 | 12.63 | 27,885,394 | |||||||||||
| Funds affiliated with Institutional Venture Partners(3) |
27,736,198 | 12.57 | 27,736,198 | |||||||||||
| S1 Corporation(4) |
27,724,331 | 12.56 | 27,724,331 | |||||||||||
| Funds affiliated with Accel Partners(5) |
20,299,228 | 9.20 | 20,299,228 | |||||||||||
| Named Executive Officers and Directors: |
||||||||||||||
| Anil Arora(6) |
10,914,440 | 4.77 | 10,914,440 | |||||||||||
| Michael Armsby(7) |
1,359,534 | * | 1,359,534 | |||||||||||
| William Parsons(8) |
2,199,078 | * | 2,199,078 | |||||||||||
| Gayle Crowell(9) |
892,708 | * | 892,708 | |||||||||||
| Patrick T. Hackett(1) |
81,606,986 | 36.98 | 81,606,986 | |||||||||||
| William Harris(10) |
1,232,708 | * | 1,232,708 | |||||||||||
| Dennis B. Phelps(3)(11) |
27,836,198 | 12.61 | 27,836,198 | |||||||||||
| Bruce C. Felt |
— | * | — | |||||||||||
| All Executive Officers and Directors as a Group (15 people)(12) |
132,758,739 | 55.22 | 132,758,739 | |||||||||||
| (*) | Represents beneficial ownership of less than 1%. |
| (1) | Includes 77,390,733 shares held by WP VIII Finance, L.P., 4,085,970 shares held by Warburg Pincus Private Equity VIII, L.P. (WP VIII), 118,477 shares held by Warburg Pincus Netherlands Private Equity VIII C.V. I (WP VIII Netherlands) and 11,806 shares held by WP-WPVIII Investors, L.P. as successor in interest to Warburg Pincus Germany Private Equity VIII, KG. (WP VIII Investors, and together with WP VIII and WP VIII Netherlands, the WP VIII Funds). WP-WPVIII Investors LLC, (WP VIII Investors GP), is the general partner of WP VIII Investors. Warburg Pincus Partners LLC (WP Partners), is the sole member of WP VIII Investors GP, and the general partner of WP VIII and WP VIII Netherlands. Warburg Pincus & Co., (WP), is the managing member of WP Partners. Warburg Pincus LLC, (WP LLC), is the manager of the WP VIII Funds. Charles R. Kaye and Joseph P. Landy are the managing general partners of WP, and the managing members and co-chief executive officers of WP LLC and may be deemed to share voting and investment control for the Warburg Pincus entities. Patrick T. Hackett, a partner of WP and a member and managing director of WP LLC, is a member of our board of directors. Ms. Crowell, a member of our board of directors, is a consultant to the WP Entities, and has no voting or investment control with respect to these shares. The principal address of Warburg Pincus & Co. is 450 Lexington Ave., New York, New York 10017. |
| (2) | Includes 27,692,308 shares held by Banc of America Strategic Investments Corporation (BASIC) and 193,086 shares held by Banc of America Strategic Ventures, Inc. (BASV). Each of BASIC and BASV are wholly owned subsidiaries of Bank of America Corporation, a bank holding company registered under the Bank Holding Company Act of 1956, as amended. Each of BASIC and BASV may be deemed to share beneficial ownership of the shares with Bank of America Corporation. The principal address of the Bank of America Corporation is Bank of America Corporate Center, 100 N. Tryon Street, Charlotte, North Carolina 28255. |
-151-
Table of Contents
| (3) | Includes 12,571,925 shares held by Institutional Venture Partners XI, L.P., 10,772,910 shares held by Institutional Venture Partners X, L.P., 2,378,690 shares held by Institutional Venture Partners X GmbH & Co. Beteiligungs KG and 2,012,673 shares held by Institutional Venture Partners XI GmbH & Co. Beteiligungs KG (collectively, the IVP Funds). Institutional Venture Management X, LLC (IVMX), is the general partner of Institutional Venture Partners X, L.P. and the Managing Limited Partner of Institutional Venture Partners X GmbH & Co. Beteiligungs KG. The Managing Directors of IVM X are Todd Chaffee, Reid Dennis, Norman Fogelsong, Stephen Harrick, and Dennis Phelps. Institutional Venture Management XI, LLC (IVMXI), is the general partner of Institutional Venture Partners XI, L.P. and the Managing Limited Partner of Institutional Venture Partners XI GmbH & Co. Beteiligungs KG. The Managing Directors of IVM XI are Todd Chaffee, Reid Dennis, Norman Fogelsong, Stephen Harrick, J. Sanford Miller, and Dennis Phelps. Messrs. Chaffee, Dennis, Fogelsong, Harrick, Miller and Phelps share voting and investment control with respect to the shares held by the IVP Funds. Mr. Phelps is a member of our board of directors. The principal address for the IVP Funds is 3000 Sand Hill Road, Building 2, Suite 250, Menlo Park, California 94025. |
| (4) | ACI Worldwide Corp., successor in interest to S1 Corporation, is a wholly-owned subsidiary of ACI Worldwide, Inc. (ACI). ACI is a provider of electronic payments for financial institutions and electronic payment software, and ACI may be deemed to be the beneficial owner of the shares. Messrs. Scott Behrens and Craig Maki are members of ACI’s investment committee which exercises voting and investment control over the shares. The principal address of ACI Worldwide, Inc. is 3520 Kraft Road, Suite 300, Naples, Florida 34105. |
| (5) | Includes 14,777,840 shares held by Accel VII L.P. (A7), 3,694,459 shares held by Accel Internet Fund III L.P. (AIF3) and 1,826,929 shares held by Accel Investors ‘99 L.P. (AI99). Accel VII Associates, L.L.C. is the general partner of A7, and Accel Internet Fund III Associates L.L.C is the general partner of AIF3. Arthur C. Patterson, James R. Swartz and James Breyer are the managing members of Accel VII Associates, L.L.C. and Accel Internet Fund III Associates L.L.C and may be deemed to share voting and investment control over the shares held by A7 and AIF3. Messrs. Patterson, Swartz and Breyer are the general partners of AI99 and may be deemed to share voting and investment control over the shares held by AI99. The principal address of Accel Partners is 428 University Ave., Palo Alto, California 94301. |
| (6) | Includes 14,500 shares held in trusts for the benefit of Mr. Arora’s children for which trusts Mr. Arora serves as trustee. Mr. Arora may be deemed to exercise voting and investment control over shares held in each of the trusts. Mr. Arora disclaims beneficial ownership of such shares. Also includes 8,229,675 shares issuable upon exercise of options exercisable within 60 days after June 30, 2014. |
| (7) | Includes 1,359,534 shares issuable upon exercise of options exercisable within 60 days of June 30, 2014. |
| (8) | Includes 2,199,078 shares issuable upon exercise of options exercisable within 60 days after June 30, 2014. |
| (9) | Includes 592,708 shares issuable upon exercise of options exercisable within 60 days after June 30, 2014. |
| (10) | Includes 592,708 shares issuable upon exercise of options exercisable within 60 days after June 30, 2014. |
| (11) | Includes 100,000 shares issuable upon exercise of options exercisable within 60 days after June 30, 2014. |
| (12) | Includes 19,696,583 shares issuable upon exercise of options exercisable within 60 days after June 30, 2014. |
-152-
Table of Contents
The following description summarizes the material terms of our capital stock. Because it is only a summary, it does not contain all the information that may be important to you. For a complete description of our capital stock, you should refer to our amended and restated certificate of incorporation and our amended and restated bylaws, which are included as exhibits to the registration statement of which this prospectus forms a part, and to the provisions of applicable Delaware law.
Immediately following the closing of this offering, our authorized capital stock will consist of shares of common stock, $0.001 par value, and shares of preferred stock, $0.001 par value, all of which preferred stock will be undesignated. The following information reflects the filing of our amended and restated certificate of incorporation and the conversion of all outstanding shares of our convertible preferred stock into shares of our common stock immediately prior to the closing of the offering.
As of June 30, 2014, we had:
| • | 220,702,831 shares of common stock issued and outstanding held by 336 stockholders; |
| • | 1,134,614 shares of common stock; on an as-converted basis, issuable upon the exercise of warrants to purchase shares of our convertible preferred stock, with an exercise price of $0.65 per share; |
| • | 51,971,275 shares of common stock issuable upon the exercise of outstanding stock options, with a weighted average exercise price of $0.67 per share; |
As of June 30, 2014 (and subsequent to June 30, 2014, where noted), we had:
| • | 6,194,372 shares of common stock issuable upon vesting of restricted stock units under our 2009 Plan outstanding as of June 30, 2014. |
Upon the closing of this offering and based on shares of our common stock outstanding as of June 30, 2014, shares of our common stock will be outstanding assuming (i) the conversion of all outstanding shares of our convertible preferred stock into 144,452,172 shares of our common stock immediately prior to the closing of this offering, (ii) no additional exercises of options or warrants outstanding as of June 30, 2014 and (iii) no exercise of the underwriters’ option to purchase additional shares from us in the offering.
Common Stock
The holders of common stock are entitled to one vote per share on all matters submitted to a vote of our stockholders and do not have cumulative voting rights for the election of directors. Accordingly, holders of a majority of the shares of common stock entitled to vote in any election of directors may elect all of the directors standing for election. Our amended and restated certificate of incorporation establishes a classified board of directors, to be divided into three classes with staggered three-year terms. Only one class of directors will be elected at each annual meeting of our stockholders, with the other classes continuing for the remainder of their respective three-year terms. Subject to preferences that may be applicable to any preferred stock outstanding at the time, the holders of outstanding shares of common stock are entitled to receive ratably any dividends declared by our board of directors out of assets legally available. See “Dividend Policy.” Upon our liquidation, dissolution or winding up, holders of our common stock are entitled to share ratably in all assets remaining after payment of liabilities and the liquidation preferences, if any, on any then-outstanding shares of preferred stock. Holders of common stock have no preemptive or conversion rights or other subscription rights. There are no redemption or sinking fund provisions applicable to the common stock. All outstanding shares of common stock are, and all shares of common stock to be outstanding upon completion of this offering will be, fully paid and nonassessable.
-153-
Table of Contents
Preferred Stock
After the closing of this offering, no shares of our convertible preferred stock will be outstanding. Pursuant to our amended and restated certificate of incorporation, our board of directors will have the authority, without further action by our stockholders, to issue from time to time up to shares of preferred stock in one or more series. Our board of directors may designate the rights, preferences, privileges and restrictions of the preferred stock, including dividend rights, conversion rights, voting rights, terms of redemption, liquidation preference, sinking fund terms and the number of shares constituting any series or the designation of any series, any or all of which may be more favorable than the rights of holders of our common stock. The issuance of preferred stock could also adversely affect the voting power of holders of our common stock and the likelihood that such holders will receive dividend payments and payments upon liquidation, which could decrease the market price of our common stock. The issuance of preferred stock or even the ability to issue preferred stock could also have the effect of delaying, deterring or preventing a change in control of our company or other corporate actions. We currently have no plans to issue any shares of preferred stock.
Warrants
As of June 30, 2014, we had warrants outstanding to purchase 1,134,614 shares of our common stock, assuming the conversion of our convertible preferred stock into shares of our common stock, at exercise prices of $0.65 per share. The warrants contain provisions for the adjustment of the exercise price and the number of shares issuable upon exercise in the event of stock dividends, stock splits, reorganizations, reclassifications, consolidations and certain other events. If not exercised, these warrants will expire on various dates between December 2014 and March 2020.
Registration Rights
Following the completion of this offering, the holders of an aggregate of 195,795,758 shares of our common stock, or their permitted transferees, are entitled to rights with respect to the registration of these shares under the Securities Act. These rights are provided under the terms of our amended and restated investors’ rights agreement between us and the holders of these shares, and include demand registration rights, piggyback registration rights, and short-form registration rights. All fees, costs and expenses of underwritten registrations will be borne by us and all selling expenses, including underwriting discounts and selling commissions, will be borne by the holders of the shares being registered.
The registration rights terminate after the date that is five years following the completion of this offering or, with respect to the registration rights of an individual holder, at such time following the completion of this offering when such holder can sell all of such holder’s shares in any three-month period without compliance with the registration requirements of the Securities Act pursuant to Rule 144 thereunder.
Demand Registration Rights
The holders of an aggregate of 195,795,758 shares of our common stock, or their permitted transferees, are entitled to demand registration rights. Under the terms of the amended and restated investors’ rights agreement, we will be required, upon the written request of holders of not less than 25% of these shares and if the anticipated aggregate proceeds of the offering proposed to be so registered (net of underwriting discounts and commissions) would exceed $15 million, to use our best efforts to register all or a portion of these shares for public resale. We are required to effect only three demand registrations in response to such demand registration requests. We are not required to effect a demand registration prior to six months after the effective date of this offering. In addition, we may
-154-
Table of Contents
postpone the filing of a registration statement for up to 90 days once in a 12-month period if, in the good faith judgment of our board of directors, such registration would be seriously detrimental to us or our shareholders. We are also not required to effect the filing of a registration statement during the period beginning 60 days prior to our good faith estimate of the date of the filing of, and ending on a date six months following the effective date of, a registration initiated by us.
Piggyback Registration Rights
The holders of an aggregate of 195,795,758 shares of our common stock, or their permitted transferees, are entitled to certain “piggyback” registration rights. If we propose to register any of our securities under the Securities Act, either for our own account or for the account of other security holders, the holders of these shares will be entitled to include their shares in such registration. Accordingly, if we propose to file a registration statement under the Securities Act (other than with respect to a demand registration, a registration related to any employee benefit plan or a corporate reorganization or other transaction covered by Rule 145 under the Securities Act), the holders of these shares are entitled to notice of the registration and have the right, subject to certain limitations, to include their shares in the registration. The underwriters of any underwritten offering have the right to limit the number of shares registered by these holders for marketing reasons, subject to certain limitations.
Short-Form Registration Rights
The holders of an aggregate of 195,795,758 shares of our common stock, or their permitted transferees, are also entitled to short-form registration rights. These holders may request in writing that we effect a registration on Form S-3 under the Securities Act, when registration of our shares under Form S-3 becomes possible, and when the proposed aggregate offering price of the shares to be registered by the holders requesting registration would exceed $1,000,000 (net of underwriting discounts and commissions), subject to certain exceptions. Depending on certain conditions, however, we may postpone the filing of such registration statement for up to 90 days once in a 12-month period if, in the good faith judgment of our board of directors, such registration would be seriously detrimental to us or our shareholders. We are only obligated to effect two registrations in response to such short-form registration requests within any 12-month period.
Anti-Takeover Effects of Delaware Law and Our Certificate of Incorporation and Bylaws
Our amended and restated certificate of incorporation and our amended and restated bylaws contain certain provisions that could have the effect of delaying, deferring or discouraging another party from acquiring control of us. These provisions and certain provisions of Delaware law, which are summarized below, are expected to discourage coercive takeover practices and inadequate takeover bids. These provisions are also designed, in part, to encourage persons seeking to acquire control of us to negotiate first with our board of directors. We believe that the benefits of increased protection of our potential ability to negotiate more favorable terms with an unfriendly or unsolicited acquirer outweigh the disadvantages of discouraging a proposal to acquire us.
Undesignated Preferred Stock
As discussed above, our board of directors has the ability to issue preferred stock with voting or other rights or preferences that could impede the success of any attempt to effect a change in control of our company. These and other provisions may have the effect of deterring hostile takeovers or delaying changes in control or management of our company.
-155-
Table of Contents
Limits on Ability of Stockholders to Act by Written Consent or Call a Special Meeting
Our amended and restated certificate of incorporation provides that our stockholders may not act by written consent, which may lengthen the amount of time required to take stockholder actions. As a result, a holder controlling a majority of our capital stock would not be able to amend our bylaws or remove directors without holding a meeting of our stockholders called in accordance with our bylaws.
In addition, our amended and restated bylaws provide that special meetings of the stockholders may be called only by the chairperson of the board, the chief executive officer or our board of directors. Stockholders may not call a special meeting, which may delay the ability of our stockholders ability to force consideration of a proposal or for holders controlling a majority of our capital stock to take any action, including the removal of directors.
Requirements for Advance Notification of Stockholder Nominations and Proposals
Our amended and restated bylaws establish advance notice procedures with respect to stockholder proposals and the nomination of candidates for election as directors, other than nominations made by or at the direction of our board of directors or a committee of our board of directors. These provisions may have the effect of precluding the conduct of certain business at a meeting if the proper procedures are not followed. These provisions may also discourage or deter a potential acquirer from conducting a solicitation of proxies to elect the acquirer’s own slate of directors or otherwise attempting to obtain control of our company.
Board Classification
Our board of directors is divided into three classes one class of which is elected each year by our stockholders. The directors in each class will serve for a three-year term. For more information on the classified board, see “Management—Board Composition.” A third party may be discouraged from making a tender offer or otherwise attempting to obtain control of us as it is it more difficult and time-consuming for stockholders to replace a majority of the directors on a classified board.
No Cumulative Voting
Our amended and restated certificate of incorporation and amended and restated bylaws do not permit cumulative voting in the election of directors. Cumulative voting allows a stockholder to vote a portion or all of its shares for one or more candidates for seats on the board of directors. Without cumulative voting, a minority stockholder may not be able to gain as many seats on our board of directors as the stockholder would be able to gain if cumulative voting were permitted. The absence of cumulative voting makes it more difficult for a minority stockholder to gain a seat on our board of directors to influence our board’s decision regarding a takeover.
Amendment of Charter Provisions
The amendment of the above provisions of our amended and restated certificate of incorporation requires approval by holders of at least two-thirds of our outstanding capital stock entitled to vote generally in the election of directors.
Delaware Anti-Takeover Statute
We are subject to the provisions of Section 203 of the Delaware General Corporation Law regulating corporate takeovers. In general, Section 203 prohibits a Delaware corporation from
-156-
Table of Contents
engaging, under certain circumstances, in a business combination with an interested stockholder for a period of three years following the date such person became an interested stockholder unless:
| • | prior to the date of the transaction, the corporation’s board of directors approved either the business combination or the transaction which resulted in the stockholder becoming an interested stockholder; |
| • | upon completion of the transaction that resulted in the stockholder becoming an interested stockholder, the interested stockholder owned at least 85% of the voting stock of the corporation outstanding at the time the transaction commenced, excluding for purposes of determining the voting stock outstanding (but not the outstanding voting stock owned by the interested stockholder) those shares owned (i) by persons who are directors and also officers and (ii) employee stock plans in which employee participants do not have the right to determine confidentially whether shares held subject to the plan will be tendered in a tender or exchange offer; or |
| • | at or subsequent to the date of the transaction, the business combination is approved by the corporation’s board of directors and authorized at an annual or special meeting of stockholders, and not by written consent, by the affirmative vote of at least two-thirds of the outstanding voting stock which is not owned by the interested stockholder. |
Generally, a business combination includes a merger, asset or stock sale, or other transaction or series of transactions resulting in a financial benefit to the interested stockholder. An interested stockholder is an entity or person who, together with its affiliates and associates, owns, or is an affiliate or associate of the corporation and within three years prior to the determination of interested stockholder status did own, 15% or more of the corporation’s outstanding voting stock. We expect the existence of this provision to have an anti-takeover effect with respect to transactions our board of directors does not approve in advance. We also anticipate that Section 203 may discourage attempts that might result in a premium over the market price for the shares of common stock held by stockholders.
The provisions of Delaware law and the provisions of our amended and restated certificate of incorporation and amended and restated bylaws, as amended upon the closing of this offering, could have the effect of discouraging others from attempting hostile takeovers and, as a consequence, they might also inhibit temporary fluctuations in the market price of our common stock that often result from actual or rumored hostile takeover attempts. These provisions might also have the effect of preventing changes in our management. It is possible that these provisions could make it more difficult to accomplish transactions that stockholders might otherwise deem to be in their best interests.
Transfer Agent and Registrar
Upon the completion of this offering, the transfer agent and registrar for our common stock will be Computershare Trust Company, N.A. The transfer agent’s address is 250 Royall St., Canton, Massachusetts 02021 and its telephone number is (877) 373-6374.
Listing
We have applied to list our common stock for quotation on The NASDAQ Global Market under the trading symbol “YDLE”.
-157-
Table of Contents
SHARES ELIGIBLE FOR FUTURE SALE
Prior to this offering, there has been no public market for our common stock, and we cannot predict what effect, if any, market sales of shares of common stock or the availability of shares of common stock for sale will have on the market price of our common stock prevailing from time to time. Future sales of substantial amounts of shares of our common stock, including shares issued upon the exercise of outstanding options or warrants, in the public market after this offering, or the possibility of these sales occurring, could adversely affect the prevailing market price of our common stock from time to time or impair our ability to raise equity capital in the future.
Upon the completion of this offering, we will have an aggregate of shares of common stock outstanding, assuming the automatic conversion of all outstanding shares of our convertible preferred stock into shares of our common stock immediately prior to the completion of this offering and assuming no exercises of outstanding options or warrants that were outstanding as of June 30, 2014. Of the outstanding shares, all the shares sold in this offering by us, plus any shares sold upon exercise of the underwriters’ option to purchase additional shares from us in the offering, will be freely tradable in the public market without restriction or further registration under the Securities Act, unless these shares are held by “affiliates,” as that term is defined in Rule 144 under the Securities Act.
The remaining shares of common stock will be deemed “restricted securities” as defined in Rule 144 under the Securities Act. These restricted securities may be sold in the public market only if registered or if they qualify for an exemption from registration under Rule 144 or Rule 701 under the Securities Act, which rules are summarized below.
Subject to the lock-up agreements described below and the provisions of Rule 144 and 701 under the Securities Act, these restricted securities will be available for sale in the public market as follows:
| Date |
Number of Shares | |
| On the date of this prospectus |
||
| Between 90 and 180 days (subject to extension) after the date of this prospectus |
||
| At various times beginning more than 180 days after the date of this prospectus |
In addition, of the 51,971,275 shares of our common stock that were subject to stock options outstanding as of June 30, 2014, options to purchase 32,013,757 shares of common stock were vested as of June 30, 2014 and will be eligible for sale 180 days following the effective date of this offering, subject to extension as described in “Underwriting (Conflict of Interest).”
Lock Up Agreements
All of our directors, officers and certain other stockholders holding an aggregate of shares have entered into lock up agreements that generally provide that these holders will not offer, pledge, sell, agree to sell, directly or indirectly, or otherwise dispose of any shares of our common stock or any securities convertible into or exchangeable for shares of our common stock without the prior written consent of Goldman, Sachs & Co. for a period of 180 days from the date of this prospectus.
We have agreed that for a period of 180 days after the date of this prospectus we will not, without the prior written consent of Goldman, Sachs & Co.:
| • | offer, sell, contract to sell, pledge, grant any option to purchase, make any short sale or otherwise transfer or dispose of, directly or indirectly, or file with the Securities and Exchange Commission a registration statement under the Act relating to, any of our securities that are |
-158-
Table of Contents
| substantially similar to shares of our common stock, including but not limited to, any options or warrants to purchase shares of our common stock or any securities that are convertible into, exchangeable for, or that represent the right to receive, shares of our common stock or any such substantially similar securities, or publicly disclose the intention to make any offer, sale, pledge, disposition or filing; or |
| • | enter into any swap or other agreement that transfers, in whole or in part, any of the economic consequences of ownership of shares of our common stock or any such other securities; |
whether any such transaction described above is to be settled by delivery of shares of our common stock or such other securities, in cash or otherwise. This agreement is subject to certain exceptions, as set forth in “Underwriting (Conflict of Interest).”
Rule 144
In general, under Rule 144 as currently in effect, once we have been subject to public company reporting requirements for at least 90 days, a person who is not deemed to have been one of our affiliates for purposes of the Securities Act at any time during 90 days preceding a sale and who has beneficially owned the shares proposed to be sold for at least six months, including the holding period of any prior owner other than our affiliates, is entitled to sell such shares without complying with the manner of sale, volume limitation or notice provisions of Rule 144, subject to compliance with the public information requirements of Rule 144. If such a person has beneficially owned the shares proposed to be sold for at least one year, including the holding period of any prior owner other than our affiliates, then such person is entitled to sell such shares without complying with any of the requirements of Rule 144.
In general, under Rule 144, as currently in effect, our affiliates or persons selling shares on behalf of our affiliates are entitled to sell upon expiration of the lock up agreements described above, within any three-month period beginning 90 days after the date of this prospectus, a number of shares that does not exceed the greater of:
| • | 1% of the number of shares of our common stock then outstanding, which will equal approximately shares immediately after this offering; or |
| • | the average weekly trading volume of our common stock during the four calendar weeks preceding the filing of a notice on Form 144 with respect to such sale. |
Sales under Rule 144 by our affiliates or persons selling shares on behalf of our affiliates are also subject to certain manner of sale provisions and notice requirements and to the availability of current public information about us.
Rule 701
Rule 701 generally allows a stockholder who purchased shares of our common stock pursuant to a written compensatory plan or contract and who is not deemed to have been an affiliate of our company during the immediately preceding 90 days to sell these shares in reliance upon Rule 144, but without being required to comply with the public information, holding period, volume limitation, or notice provisions of Rule 144. Rule 701 also permits affiliates of our company to sell their Rule 701 shares under Rule 144 without complying with the holding period requirements of Rule 144. All holders of Rule 701 shares, however, are required to wait until 90 days after the date of this prospectus before selling such shares pursuant to Rule 701.
As of June 30, 2014, 16,695,676 shares of our outstanding common stock had been issued in reliance on Rule 701 as a result of exercises of stock options and stock awards.
-159-
Table of Contents
Stock Options
We intend to file a registration statement on Form S-8 under the Securities Act covering all of the shares of our common stock subject to options outstanding or reserved for issuance under our stock plans and shares of our common stock issued upon the exercise of options by employees. We expect to file this registration statement as soon as practicable after this offering. In addition, we intend to file a registration statement on Form S-8 or such other form as may be required under the Securities Act for the resale of shares of our common stock issued upon the exercise of options that were not granted under Rule 701. We expect to file this registration statement as soon as permitted under the Securities Act. However, the shares registered on Form S-8 will be subject to volume limitations, manner of sale, notice and public information requirements of Rule 144 and will not be eligible for resale until expiration of the lock up agreements to which they are subject.
Registration Rights
When this offering is complete, the holders of an aggregate of 195,795,758 shares of our common stock, or their transferees, will be entitled to rights with respect to the registration of their shares under the Securities Act. Registration of these shares under the Securities Act would result in these shares becoming freely tradable without restriction under the Securities Act immediately upon the effectiveness of such registration. For a further description of these rights, see “Description of Capital Stock—Registration Rights.”
-160-
Table of Contents
MATERIAL UNITED STATES FEDERAL INCOME TAX CONSEQUENCES
TO NON-U.S. HOLDERS OF OUR COMMON STOCK
The following is a summary of the material U.S. federal income tax and certain estate tax consequences of the ownership and disposition of our common stock to non-U.S. holders, but does not purport to be a complete analysis of all the potential tax considerations relating thereto. This summary is based upon the provisions of the Internal Revenue Code of 1986, as amended, or the Code, Treasury regulations promulgated thereunder, administrative rulings and judicial decisions, all as of the date hereof. These authorities may be changed, possibly retroactively, so as to result in U.S. federal income tax consequences different from those set forth below. We have not sought any ruling from the Internal Revenue Service, or the IRS, with respect to the statements made and the conclusions reached in the following summary, and there can be no assurance that the IRS will agree with such statements and conclusions.
This summary also does not address the tax considerations arising under the laws of any foreign, state or local jurisdiction or other U.S. federal gift and estate tax laws, except to the limited extent set forth below. In addition, this discussion does not address tax considerations applicable to an investor’s particular circumstances or to investors that may be subject to special tax rules, including, without limitation:
| • | banks, insurance companies or other financial institutions; |
| • | persons subject to the alternative minimum tax or net investment income tax; |
| • | tax-exempt organizations or governmental organizations; |
| • | controlled foreign corporations, passive foreign investment companies, and corporations that accumulate earnings to avoid U.S. federal income tax; |
| • | dealers in securities or currencies; |
| • | traders in securities that elect to use a mark-to-market method of accounting for their securities holdings; |
| • | persons that own, or are deemed to own, more than five percent of our capital stock (except to the extent specifically set forth below); |
| • | certain former citizens or long-term residents of the United States; |
| • | persons who hold our common stock as a position in a hedging transaction, “straddle,” “conversion transaction” or other risk reduction transaction; |
| • | persons who hold or receive our common stock pursuant to the exercise of any employee stock option or otherwise as compensation; |
| • | persons who do not hold our stock as a capital asset within the meaning of Section 1221 of the Code; and |
| • | persons deemed to sell our common stock under the constructive sale provisions of the Code. |
In addition, if a partnership or entity classified as a partnership for U.S. federal income tax purposes holds our common stock, the tax treatment of a partner generally will depend on the status of the partner and upon the activities of the partnership. Accordingly, partnerships that hold our common stock, and partners in such partnerships, should consult their tax advisors.
YOU ARE URGED TO CONSULT YOUR TAX ADVISOR WITH RESPECT TO THE APPLICATION OF THE UNITED STATES FEDERAL INCOME TAX LAWS TO YOUR PARTICULAR SITUATION, AS WELL AS ANY TAX CONSEQUENCES OF THE PURCHASE, OWNERSHIP AND DISPOSITION OF OUR COMMON STOCK ARISING UNDER THE UNITED STATES FEDERAL ESTATE OR GIFT TAX RULES OR UNDER THE LAWS OF ANY STATE, LOCAL, FOREIGN OR OTHER TAXING JURISDICTION OR UNDER ANY APPLICABLE TAX TREATY.
-161-
Table of Contents
Non-U.S. Holder Defined
For purposes of this discussion, you are a non-U.S. holder (other than a partnership) if you are a holder that, for U.S. federal income tax purposes, is not a U.S. person. For purposes of this discussion, you are a U.S. person if you are:
| • | an individual citizen or resident of the United States (for U.S. tax purposes); |
| • | a corporation or other entity taxable as a corporation created or organized in the United States or under the laws of the United States or any political subdivision thereof or treated as such for U.S. federal income tax purposes; |
| • | an estate whose income is subject to U.S. federal income tax regardless of its source; or |
| • | a trust (x) whose administration is subject to the primary supervision of a U.S. court and which has one or more U.S. persons who have the authority to control all substantial decisions of the trust or (y) which has made an election to be treated as a U.S. person. |
Distributions
We have not made any distributions on our common stock, and we do not plan to make any distributions for the foreseeable future. However, if we do make distributions on our common stock, those payments will constitute dividends for U.S. tax purposes to the extent paid from our current or accumulated earnings and profits, as determined under U.S. federal income tax principles. To the extent those distributions exceed both our current and our accumulated earnings and profits, they will constitute a return of capital and will first reduce your basis in our common stock, but not below zero, and then will be treated as gain from the sale of stock.
Subject to the discussion below on effectively connected income, any dividend paid to you generally will be subject to U.S. withholding tax either at a rate of 30% of the gross amount of the dividend or such lower rate as may be specified by an applicable income tax treaty. In order to receive a reduced treaty rate, you must provide us with an IRS Form W-8BEN or other appropriate version of IRS Form W-8 certifying qualification for the reduced rate. A non-U.S. holder of shares of our common stock eligible for a reduced rate of U.S. withholding tax pursuant to an income tax treaty may obtain a refund of any excess amounts withheld by timely filing an appropriate claim for refund with the IRS. If the non-U.S. holder holds the stock through a financial institution or other agent acting on the non-U.S. holder’s behalf, the non-U.S. holder will be required to provide appropriate documentation to the agent, which then will be required to provide certification to us or our paying agent, either directly or through other intermediaries.
Dividends received by you that are effectively connected with your conduct of a U.S. trade or business, and, if required by a tax treaty, are attributable to a permanent establishment that you maintain in the United States, are generally exempt from such withholding tax. In order to obtain this exemption, you must provide us with an IRS Form W-8ECI or other appropriate IRS Form W-8 properly certifying such exemption. Such effectively connected dividends, although not subject to withholding tax, are taxed at the same graduated rates applicable to U.S. persons, net of certain deductions and credits. In addition, if you are a corporate non-U.S. holder, dividends you receive that are effectively connected with your conduct of a U.S. trade or business may also be subject to a branch profits tax at a rate of 30% or such lower rate as may be specified by an applicable income tax treaty. You should consult your tax advisor regarding any applicable tax treaties that may provide for different rules.
-162-
Table of Contents
Gain on Disposition of Common Stock
Subject to discussions below regarding backup withholding and foreign accounts, you generally will not be required to pay U.S. federal income tax on any gain realized upon the sale or other disposition of our common stock unless:
| • | the gain is effectively connected with your conduct of a U.S. trade or business, and the gain is attributable to a permanent establishment that you maintain in the United States, if that is required by an applicable income tax treaty as a condition for subjecting you to United States taxation on a net income basis; |
| • | you are an individual who holds our common stock as a capital asset (generally, an asset held for investment purposes) and who is present in the United States for a period or periods aggregating 183 days or more during the calendar year in which the sale or disposition occurs and certain other conditions are met; or |
| • | our common stock constitutes a U.S. real property interest by reason of our status as a “United States real property holding corporation”, or USRPHC, for U.S. federal income tax purposes at any time within the shorter of the five-year period preceding your disposition of, or your holding period for, our common stock. |
We believe that we are not currently and will not become a USRPHC. However, because the determination of whether we are a USRPHC depends on the fair market value of our U.S. real property relative to the fair market value of our other business assets, there can be no assurance that we will not become a USRPHC in the future. Even if we become a USRPHC, however, as long as our common stock is regularly traded on an established securities market, such common stock will be treated as U.S. real property interests only if you actually or constructively hold more than five percent of such regularly traded common stock at any time during the shorter of the five-year period preceding your disposition of, or your holding period for, our common stock.
If you are a non-U.S. holder described in the first bullet above, you will be required to pay tax on the net gain derived from the sale under regular graduated U.S. federal income tax rates, and corporate non-U.S. holders described in the first bullet above may be subject to the branch profits tax at a 30% rate or such lower rate as may be specified by an applicable income tax treaty. If you are an individual non-U.S. holder described in the second bullet above, you will be required to pay a flat 30% tax (or such lower rate specified by an applicable income tax treaty) on the gain derived from the sale, which tax may be offset by U.S. source capital losses (even though you are not considered a resident of the United States), provided you have timely filed U.S. federal income tax returns with respect to such losses. You should consult any applicable income tax or other treaties that may provide for different rules.
Federal Estate Tax
Common stock beneficially owned by an individual who is not a citizen or resident of the United States (as defined for U.S. federal estate tax purposes) at the time of death will generally be includable in such decedent’s gross estate for U.S. federal estate tax purposes, unless an applicable estate tax treaty provides otherwise.
Backup Withholding and Information Reporting
Generally, we must report annually to the IRS the amount of dividends paid to you, your name and address, and the amount of tax withheld, if any. A similar report is sent to you. Pursuant to applicable income tax treaties or other agreements, the IRS may make these reports available to tax authorities in your country of residence.
-163-
Table of Contents
Payments of dividends or of proceeds on the disposition of stock made to you may be subject to information reporting and backup withholding at a rate of 28% unless you establish an exemption, for example by properly certifying your non-U.S. status on a Form W-8BEN or another appropriate version of IRS Form W-8. Notwithstanding the foregoing, backup withholding and information reporting may apply if either we or our paying agent has actual knowledge, or reason to know, that you are a U.S. person.
Backup withholding is not an additional tax; rather, the U.S. federal income tax liability of persons subject to backup withholding will be reduced by the amount of tax withheld. If withholding results in an overpayment of taxes, a refund or credit may be obtained, provided that the required information is furnished to the IRS in a timely manner.
Foreign Account Tax Compliance Act (FATCA)
FATCA imposes a U.S. federal withholding tax of 30% on dividends on and the gross proceeds from a disposition of our common stock to a “foreign financial institution” (as specifically defined under the FATCA rules) unless such institution enters into an agreement with the U.S. government to, among other things, withhold on certain payments and to collect and provide to the U.S. tax authorities substantial information regarding U.S. account holders of such institution (which includes certain equity and debt holders of such institution, as well as certain account holders that are foreign entities with U.S. owners) or otherwise establishes an exemption. A U.S. federal withholding tax of 30% generally applies to dividends on and the gross proceeds from a disposition of our stock to a “non-financial foreign entity” (as specifically defined under the FATCA rules) unless such entity provides the withholding agent with either a certification that it does not have any substantial direct or indirect U.S. owners or provides information regarding direct and indirect U.S. owners of the entity or otherwise establishes an exception. The withholding provisions described above are expected to apply to payments of dividends on our stock made on or after July 1, 2014 and to payments of gross proceeds from a sale or other disposition of such common stock on or after January 1, 2017. An intergovernmental agreement between the United States and an applicable foreign country may modify the requirements described in this paragraph. Under certain circumstances, a non-U.S. holder might be eligible for refunds or credits of such taxes. You should consult your tax advisors regarding these withholding provisions.
The preceding discussion of U.S. federal tax considerations is for general information only. It is not tax advice. Each prospective investor should consult its own tax advisor regarding the particular U.S. federal, state and local and non-U.S. tax consequences of purchasing, holding and disposing of our common stock, including the consequences of any proposed change in applicable laws.
-164-
Table of Contents
UNDERWRITING (CONFLICT OF INTEREST)
We and the underwriters named below have entered into an underwriting agreement with respect to the shares being offered. Subject to certain conditions, each underwriter has severally agreed to purchase the number of shares indicated in the following table. Goldman, Sachs & Co., Credit Suisse Securities (USA) LLC, and Merrill Lynch, Pierce, Fenner & Smith Incorporated are the representatives of the underwriters.
| Underwriters |
Number of Shares | |
| Goldman, Sachs & Co. |
||
| Credit Suisse Securities (USA) LLC |
||
| Merrill Lynch, Pierce, Fenner & Smith Incorporated |
||
| UBS Securities LLC |
||
| Pacific Crest Securities LLC |
||
|
| ||
| Total |
||
|
|
The underwriters are committed to take and pay for all of the shares being offered, if any are taken, other than the shares covered by the option described below unless and until this option is exercised.
The underwriters have an option to buy up to an additional shares from us to cover sales by the underwriters of a greater number of shares than the total number set forth in the table above. They may exercise that option for 30 days. If any shares are purchased pursuant to this option, the underwriters will severally purchase shares in approximately the same proportion as set forth in the table above.
The following table shows the per share and total underwriting discounts and commissions to be paid to the underwriters by us. Such amounts are shown assuming both no exercise and full exercise of the underwriters’ option to purchase additional shares.
| No Exercise | Full Exercise | |||||||
| Per Share |
$ | $ | ||||||
| Total |
$ | $ | ||||||
Shares sold by the underwriters to the public will initially be offered at the initial public offering price set forth on the cover of this prospectus. Any shares sold by the underwriters to securities dealers may be sold at a discount of up to $ per share from the initial public offering price. After the initial offering of the shares, the representatives may change the offering price and the other selling terms. The offering of the shares by the underwriters is subject to receipt and acceptance and subject to the underwriters’ right to reject any order in whole or in part.
At our request, the underwriters have reserved up to 5% of the common stock being offered by this prospectus for sale at the initial public offering price to certain individuals associated with us and members of their families. None of our directors, executive officers or employees will participate in the directed share program. The sales will be made by UBS Financial Services Inc., a selected dealer affiliated with UBS Securities LLC, an underwriter of this offering, through a directed share program. We do not know if these individuals will choose to purchase all or any portion of these reserved shares, but any purchases they do make will reduce the number of shares that are available to the general public. Any reserved shares that are not so purchased will be offered by the underwriters to the general public on the same terms as the other shares of common stock. Participants in the directed share
-165-
Table of Contents
program who purchase more than $1,000,000 of shares shall be subject to a 25-day lock-up with respect to any shares sold to them pursuant to that program. This lock-up will have restrictions that are similar to the restrictions in the lock-up agreements described below.
We and our officers, directors, and holders of substantially all of our common stock have agreed with the underwriters, subject to certain exceptions, not to dispose of or hedge any of their common stock or securities convertible into or exchangeable for shares of common stock during the period from the date of this prospectus continuing through the date that is 180 days after the date of this prospectus, except with the prior written consent of Goldman, Sachs & Co. This agreement does not apply to any existing employee benefit plans. See “Shares Eligible for Future Sale—Lock Up Agreements” for a discussion of certain transfer restrictions.
In addition, the restrictions described in the paragraph above do not apply to the issuance, in an amount not exceeding 10% of our common stock outstanding following the completion of this offering, of shares of our common stock, or any security convertible into or exercisable for shares of our common stock, issued in connection with the acquisition by us of the securities, business, property or other assets of, or the entry into a joint venture, commercial relationship or other strategic transaction with, a third party, provided that the recipient of shares issued in any such transaction will be required to agree to enter into a lock-up agreement on substantially the same terms as the lock-up agreements described above for the remainder of the lock-up period.
Prior to the offering, there has been no public market for the shares. The initial public offering price has been negotiated among us and the representatives. Among the factors to be considered in determining the initial public offering price of the shares, in addition to prevailing market conditions, will be our historical performance, estimates of the business potential and our earnings prospects, an assessment of our management and the consideration of the above factors in relation to market valuation of companies in related businesses.
An application has been made to list the common stock on The NASDAQ Global Market under the symbol “YDLE”.
In connection with the offering, the underwriters may purchase and sell shares of common stock in the open market. These transactions may include short sales, stabilizing transactions and purchases to cover positions created by short sales. Short sales involve the sale by the underwriters of a greater number of shares than they are required to purchase in the offering, and a short position represents the amount of such sales that have not been covered by subsequent purchases. A “covered short position” is a short position that is not greater than the amount of additional shares for which the underwriters’ option described above may be exercised. The underwriters may cover any covered short position by either exercising their option to purchase additional shares or purchasing shares in the open market. In determining the source of shares to cover the covered short position, the underwriters will consider, among other things, the price of shares available for purchase in the open market as compared to the price at which they may purchase additional shares pursuant to the option described above. “Naked” short sales are any short sales that create a short position greater than the amount of additional shares for which the option described above may be exercised. The underwriters must cover any such naked short position by purchasing shares in the open market. A naked short position is more likely to be created if the underwriters are concerned that there may be downward pressure on the price of the common stock in the open market after pricing that could adversely affect investors who purchase in the offering. Stabilizing transactions consist of various bids for or purchases of common stock made by the underwriters in the open market prior to the completion of the offering.
-166-
Table of Contents
The underwriters may also impose a penalty bid. This occurs when a particular underwriter repays to the underwriters a portion of the underwriting discount received by it because the representatives have repurchased shares sold by or for the account of such underwriter in stabilizing or short covering transactions.
Purchases to cover a short position and stabilizing transactions, as well as other purchases by the underwriters for their own accounts, may have the effect of preventing or retarding a decline in the market price of our common stock, and together with the imposition of the penalty bid, may stabilize, maintain or otherwise affect the market price of our common stock. As a result, the price of our common stock may be higher than the price that otherwise might exist in the open market. The underwriters are not required to engage in these activities and may end any of these activities at any time. These transactions may be effected on The NASDAQ Global Market, in the over-the-counter market or otherwise.
Notice to Non-U.S. Investors
In relation to each Member State of the European Economic Area which has implemented the Prospectus Directive (each, a Relevant Member State), each underwriter has represented and agreed that with effect from and including the date on which the Prospectus Directive is implemented in that Relevant Member State (the Relevant Implementation Date) it has not made and will not make an offer of shares to the public in that Relevant Member State prior to the publication of a prospectus in relation to the shares which has been approved by the competent authority in that Relevant Member State or, where appropriate, approved in another Relevant Member State and notified to the competent authority in that Relevant Member State, all in accordance with the Prospectus Directive, except that it may, with effect from and including the Relevant Implementation Date, make an offer of shares to the public in that Relevant Member State at any time:
| (a) | to legal entities which are authorized or regulated to operate in the financial markets or, if not so authorized or regulated, whose corporate purpose is solely to invest in securities; |
| (b) | to any legal entity which has two or more of (1) an average of at least 250 employees during the last financial year; (2) a total balance sheet of more than €43,000,000 and (3) an annual net turnover of more than €50,000,000, as shown in its last annual or consolidated accounts; |
| (c) | to fewer than 100 natural or legal persons (other than qualified investors as defined in the Prospectus Directive) subject to obtaining the prior consent of the representatives for any such offer; or |
| (d) | in any other circumstances which do not require the publication by the Issuer of a prospectus pursuant to Article 3 of the Prospectus Directive. |
For the purposes of this provision, the expression an “offer of shares to the public” in relation to any shares in any Relevant Member State means the communication in any form and by any means of sufficient information on the terms of the offer and the shares to be offered so as to enable an investor to decide to purchase or subscribe the shares, as the same may be varied in that Relevant Member State by any measure implementing the Prospectus Directive in that Relevant Member State and the expression Prospectus Directive means Directive 2003/71/EC and includes any relevant implementing measure in each Relevant Member State.
Each underwriter has represented and agreed that:
| (a) | it has only communicated or caused to be communicated and will only communicate or cause to be communicated an invitation or inducement to engage in investment activity |
-167-
Table of Contents
| (within the meaning of Section 21 of the FSMA) received by it in connection with the issue or sale of the shares in circumstances in which Section 21(1) of the FSMA does not apply to the Issuer; and |
| (b) | it has complied and will comply with all applicable provisions of the FSMA with respect to anything done by it in relation to the shares in, from or otherwise involving the United Kingdom. |
The shares may not be offered or sold by means of any document other than (i) in circumstances which do not constitute an offer to the public within the meaning of the Companies Ordinance (Cap.32, Laws of Hong Kong), (ii) to “professional investors” within the meaning of the Securities and Futures Ordinance (Cap.571, Laws of Hong Kong) and any rules made thereunder, or (iii) in other circumstances which do not result in the document being a “prospectus” within the meaning of the Companies Ordinance (Cap.32, Laws of Hong Kong), and no advertisement, invitation or document relating to the shares may be issued or may be in the possession of any person for the purpose of issue (in each case whether in Hong Kong or elsewhere), which is directed at, or the contents of which are likely to be accessed or read by, the public in Hong Kong (except if permitted to do so under the laws of Hong Kong) other than with respect to shares which are or are intended to be disposed of only to persons outside Hong Kong or only to “professional investors” within the meaning of the Securities and Futures Ordinance (Cap. 571, Laws of Hong Kong) and any rules made thereunder.
This prospectus has not been registered as a prospectus with the Monetary Authority of Singapore. Accordingly, this prospectus and any other document or material in connection with the offer or sale, or invitation for subscription or purchase, of the shares may not be circulated or distributed, nor may the shares be offered or sold, or be made the subject of an invitation for subscription or purchase, whether directly or indirectly, to persons in Singapore other than (i) to an institutional investor under Section 274 of the Securities and Futures Act, Chapter 289 of Singapore, or SFA, (ii) to a relevant person, or any person pursuant to Section 275(1A), and in accordance with the conditions, specified in Section 275 of the SFA or (iii) otherwise pursuant to, and in accordance with the conditions of, any other applicable provision of the SFA.
Where the shares are subscribed or purchased under Section 275 by a relevant person which is: (a) a corporation (which is not an accredited investor) the sole business of which is to hold investments and the entire share capital of which is owned by one or more individuals, each of whom is an accredited investor; or (b) a trust (where the trustee is not an accredited investor) whose sole purpose is to hold investments and each beneficiary is an accredited investor, shares, debentures and units of shares and debentures of that corporation or the beneficiaries’ rights and interest in that trust shall not be transferable for six months after that corporation or that trust has acquired the shares under Section 275 except: (1) to an institutional investor under Section 274 of the SFA or to a relevant person, or any person pursuant to Section 275(1A), and in accordance with the conditions, specified in Section 275 of the SFA; (2) where no consideration is given for the transfer; or (3) by operation of law.
The securities have not been and will not be registered under the Financial Instruments and Exchange Law of Japan (the Financial Instruments and Exchange Law) and each underwriter has agreed that it will not offer or sell any securities, directly or indirectly, in Japan or to, or for the benefit of, any resident of Japan (which term as used herein means any person resident in Japan, including any corporation or other entity organized under the laws of Japan), or to others for re-offering or resale, directly or indirectly, in Japan or to a resident of Japan, except pursuant to an exemption from the registration requirements of, and otherwise in compliance with, the Financial Instruments and Exchange Law and any other applicable laws, regulations and ministerial guidelines of Japan.
The shares may not be publicly offered in Switzerland and will not be listed on the SIX Swiss Exchange, or SIX, or on any other stock exchange or regulated trading facility in Switzerland. This
-168-
Table of Contents
prospectus has been prepared without regard to the disclosure standards for issuance prospectuses under art. 652a or art. 1156 of the Swiss Code of Obligations or the disclosure standards for listing prospectuses under art. 27 ff. of the SIX Listing Rules or the listing rules of any other stock exchange or regulated trading facility in Switzerland. Neither this prospectus nor any other offering or marketing material relating to the shares or the offering may be publicly distributed or otherwise made publicly available in Switzerland.
Neither this prospectus nor any other offering or marketing material relating to the offering, the company or the shares have been or will be filed with or approved by any Swiss regulatory authority. In particular, this prospectus will not be filed with, and the offer of shares will not be supervised by, the Swiss Financial Market Supervisory Authority FINMA, or FINMA, and the offer of shares has not been and will not be authorized under the Swiss Federal Act on Collective Investment Schemes, or CISA. The investor protection afforded to acquirers of interests in collective investment schemes under the CISA does not extend to acquirers of shares.
This prospectus relates to an Exempt Offer in accordance with the Offered Securities Rules of the Dubai Financial Services Authority, or DFSA. This prospectus is intended for distribution only to persons of a type specified in the Offered Securities Rules of the DFSA. It must not be delivered to, or relied on by, any other person. The DFSA has no responsibility for reviewing or verifying any documents in connection with Exempt Offers. The DFSA has not approved this prospectus nor taken steps to verify the information set forth herein and has no responsibility for the prospectus. The shares to which this prospectus relates may be illiquid and/or subject to restrictions on their resale. Prospective purchasers of the shares offered should conduct their own due diligence on the shares. If you do not understand the contents of this prospectus you should consult an authorized financial advisor.
No placement document, prospectus, product disclosure statement or other disclosure document has been lodged with the Australian Securities and Investments Commission, or ASIC, in relation to the offering. This prospectus does not constitute a prospectus, product disclosure statement or other disclosure document under the Corporations Act 2001, or the Corporations Act, and does not purport to include the information required for a prospectus, product disclosure statement or other disclosure document under the Corporations Act.
Any offer in Australia of the shares may only be made to persons, or the Exempt Investors, who are “sophisticated investors” (within the meaning of section 708(8) of the Corporations Act), “professional investors” (within the meaning of section 708(11) of the Corporations Act) or otherwise pursuant to one or more exemptions contained in section 708 of the Corporations Act so that it is lawful to offer the shares without disclosure to investors under Chapter 6D of the Corporations Act.
The shares applied for by Exempt Investors in Australia must not be offered for sale in Australia in the period of 12 months after the date of allotment under the offering, except in circumstances where disclosure to investors under Chapter 6D of the Corporations Act would not be required pursuant to an exemption under section 708 of the Corporations Act or otherwise or where the offer is pursuant to a disclosure document which complies with Chapter 6D of the Corporations Act. Any person acquiring shares must observe such Australian on-sale restrictions.
This prospectus contains general information only and does not take account of the investment objectives, financial situation or particular needs of any particular person. It does not contain any securities recommendations or financial product advice. Before making an investment decision, investors need to consider whether the information in this prospectus is appropriate to their needs, objectives and circumstances, and, if necessary, seek expert advice on those matters.
-169-
Table of Contents
The underwriters do not expect sales to discretionary accounts to exceed five percent of the total number of shares offered.
We estimate that our share of the total expenses of the offering, excluding underwriting discounts and commissions, will be approximately $ . We have also agreed to reimburse the underwriters for certain FINRA-related expenses not to exceed $30,000 incurred by them in connection with the offering as set forth in the underwriting agreement.
We have agreed to indemnify the several underwriters against certain liabilities, including liabilities under the Securities Act.
The underwriters and their respective affiliates are full service financial institutions engaged in various activities, which may include sales and trading, commercial and investment banking, advisory, investment management, investment research, principal investment, hedging, market making, brokerage and other financial and non-financial activities and services. Certain of the underwriters and their respective affiliates have provided, and may in the future provide, a variety of these services to the issuer and to persons and entities with relationships with the issuer, for which they received or will receive customary fees and expenses.
In the ordinary course of their various business activities, the underwriters and their respective affiliates, officers, directors and employees may purchase, sell or hold a broad array of investments and actively trade securities, derivatives, loans, commodities, currencies, credit default swaps and other financial instruments for their own account and for the accounts of their customers, and such investment and trading activities may involve or relate to assets, securities and/or instruments of the issuer (directly, as collateral securing other obligations or otherwise) and/or persons and entities with relationships with the issuer. The underwriters and their respective affiliates may also communicate independent investment recommendations, market color or trading ideas and/or publish or express independent research views in respect of such assets, securities or instruments and may at any time hold, or recommend to clients that they should acquire, long and/or short positions in such assets, securities and instruments.
Conflict of Interest
Merrill Lynch, Pierce, Fenner & Smith Incorporated, an underwriter of this offering, is a wholly-owned subsidiary of Bank of America Corporation, or BAC, which beneficially owned in the aggregate 12.6% of our outstanding common stock as of June 30, 2014. Since BAC beneficially owns more than 10% of our outstanding common stock, a “conflict of interest” is deemed to exist under Rule 5121(f)(5)(B) of the Conduct Rules of the Financial Industry Regulatory Authority. Accordingly, this offering will be made in compliance with the requirements of Rule 5121, which requires that no sale be made to discretionary accounts by underwriters having a conflict of interest without the prior written approval of the account holder and that a qualified independent underwriter participate in the preparation of the registration statement and prospectus and perform the usual standards of due diligence with respect thereto. In accordance with this rule, Goldman, Sachs & Co. has assumed the responsibilities of acting as a qualified independent underwriter. In its role as qualified independent underwriter, Goldman, Sachs & Co. has participated in due diligence and the preparation of this prospectus and the registration statement of which this prospectus is a part. Goldman, Sachs & Co. will receive a fee of $5,000 for serving as a qualified independent underwriter in connection with this offering. We have agreed to indemnify Goldman, Sachs & Co. against certain liabilities incurred in connection with it acting as a qualified independent underwriter in this offering, including liabilities under the Securities Act. In accordance with Rule 5121, Merrill Lynch, Pierce, Fenner & Smith Incorporated (and its affiliates) will not sell our common stock to a discretionary account without receiving prior written approval from the account holder.
-170-
Table of Contents
The validity of the shares of common stock offered hereby will be passed upon for us by Wilson Sonsini Goodrich & Rosati, Professional Corporation, Palo Alto, California, and for the underwriters by Sullivan & Cromwell LLP, Palo Alto, California. Members of Wilson Sonsini Goodrich & Rosati, Professional Corporation and investment funds associated with that firm hold 83,837 shares of our common stock.
Ernst & Young LLP, independent registered public accounting firm, has audited our consolidated financial statements at December 31, 2012 and 2013, and for each of the three years in the period ended December 31, 2013, as set forth in their report thereon appearing elsewhere herein. We have included our financial statements in the prospectus and elsewhere in the registration statement in reliance on Ernst & Young LLP’s report, given on their authority as experts in accounting and auditing.
WHERE YOU CAN FIND MORE INFORMATION
We have filed with the SEC a registration statement on Form S-1 under the Securities Act with respect to the shares of common stock offered by this prospectus. This prospectus, which constitutes a part of the registration statement, does not contain all of the information set forth in the registration statement, some of which is contained in exhibits to the registration statement as permitted by the rules and regulations of the SEC. For further information with respect to us and our common stock, we refer you to the registration statement, including the exhibits filed as a part of the registration statement. Statements contained in this prospectus concerning the contents of any contract or any other document are not necessarily complete. If a contract or document has been filed as an exhibit to the registration statement, please see the copy of the contract or document that has been filed. A copy of the registration statement and the exhibits filed therewith may be inspected without charge at the public reference room maintained by the SEC, located at 100 F Street, N.E., Room 1580, Washington, D.C. 20549, and copies of all or any part of the registration statement may be obtained from that office at prescribed rates. You may obtain information on the operation of the SEC’s public reference room by calling the SEC at 1-800-SEC-0330. The SEC also maintains an Internet website that contains reports, proxy statements and other information about issuers that file electronically with the SEC. The address of that website is www.sec.gov.
As a result of this offering, we will become subject to the information and reporting requirements of the Exchange Act and, in accordance with this law, will file periodic reports, proxy statements and other information with the SEC. These periodic reports, proxy statements and other information will be available for inspection and copying at the SEC’s public reference room and accessible through the SEC’s Internet website referenced above. We also maintain an Internet website at www.yodlee.com. Upon completion of this offering, you may access these materials free of charge as soon as reasonably practicable after they are electronically filed with, or furnished to, the SEC. Information contained on our website is not a part of this prospectus and the inclusion of our website address in this prospectus is an inactive textual reference only.
-171-
Table of Contents
Yodlee, Inc.
INDEX TO CONSOLIDATED FINANCIAL STATEMENTS
| Page | ||||
| F-2 | ||||
| F-3 | ||||
| F-4 | ||||
| F-5 | ||||
| Consolidated Statements of Convertible Preferred Stock and Stockholders’ Equity (Deficit) |
F-6 | |||
| F-7 | ||||
| F-8 | ||||
F-1
Table of Contents
Report of Independent Registered Public Accounting Firm
The Board of Directors and Stockholders
Yodlee, Inc.
We have audited the accompanying consolidated balance sheets of Yodlee, Inc. as of December 31, 2012 and 2013, and the related consolidated statements of operations, comprehensive loss, convertible preferred stock and stockholders’ equity (deficit), and cash flows for each of the three years in the period ended December 31, 2013. These financial statements are the responsibility of the Company’s management. Our responsibility is to express an opinion on these financial statements based on our audits.
We conducted our audits in accordance with standards of the Public Company Accounting Oversight Board (United States). Those standards require that we plan and perform the audit to obtain reasonable assurance about whether the financial statements are free of material misstatement. We were not engaged to perform an audit of the Company’s internal control over financial reporting. Our audits included consideration of internal control over financial reporting as a basis for designing audit procedures that are appropriate in the circumstances, but not for the purpose of expressing an opinion on the effectiveness of the Company’s internal control over financial reporting. Accordingly, we express no such opinion. An audit also includes examining, on a test basis, evidence supporting the amounts and disclosures in the financial statements, assessing the accounting principles used and significant estimates made by management, and evaluating the overall financial statement presentation. We believe that our audits provide a reasonable basis for our opinion.
In our opinion, the financial statements referred to above present fairly, in all material respects, the consolidated financial position of Yodlee, Inc. at December 31, 2012 and 2013, and the consolidated results of its operations and its cash flows for each of the three years in the period ended December 31, 2013, in conformity with U.S. generally accepted accounting principles.
/s/ Ernst & Young LLP
Redwood City, California
March 21, 2014
F-2
Table of Contents
Consolidated Balance Sheets
(in thousands, except per share amounts)
| December 31, | June 30, 2014 |
Pro Forma June 30, 2014 |
||||||||||||||
| 2012 | 2013 | |||||||||||||||
| (unaudited) | ||||||||||||||||
| Assets |
||||||||||||||||
| Current assets: |
||||||||||||||||
| Cash and cash equivalents |
$ | 7,963 | $ | 8,134 | $ | 6,263 | $ | 6,263 | ||||||||
| Accounts receivable, net of allowance for doubtful accounts of $9 and $20 as of December 31, 2012 and 2013, and $106 as of June 30, 2014 (unaudited) |
7,376 | 9,873 | 10,774 | 10,774 | ||||||||||||
| Accounts receivable—related parties |
2,595 | 2,301 | 3,095 | 3,095 | ||||||||||||
| Prepaid expenses and other current assets |
3,030 | 3,529 | 4,747 | 4,747 | ||||||||||||
|
|
|
|
|
|
|
|
|
|||||||||
| Total current assets |
20,964 | 23,837 | 24,879 | 24,879 | ||||||||||||
| Property and equipment, net |
4,335 | 6,297 | 9,058 | 9,058 | ||||||||||||
| Restricted cash |
146 | 146 | 146 | 146 | ||||||||||||
| Goodwill |
3,068 | 3,068 | 3,068 | 3,068 | ||||||||||||
| Other assets |
1,886 | 1,112 | 4,153 | 4,153 | ||||||||||||
|
|
|
|
|
|
|
|
|
|||||||||
| Total assets |
$ | 30,399 | $ | 34,460 | $ | 41,304 | $ | 41,304 | ||||||||
|
|
|
|
|
|
|
|
|
|||||||||
| Liabilities, convertible preferred stock and stockholders’ equity (deficit) |
||||||||||||||||
| Current liabilities: |
||||||||||||||||
| Accounts payable |
$ | 2,100 | $ | 1,880 | $ | 3,862 | $ | 3,862 | ||||||||
| Accrued liabilities |
2,980 | 2,707 | 3,114 | 3,114 | ||||||||||||
| Accrued compensation |
3,774 | 6,577 | 5,985 | 5,985 | ||||||||||||
| Convertible preferred stock warrant liabilities |
505 | 760 | 908 | — | ||||||||||||
| Deferred revenue, current portion |
7,146 | 7,655 | 7,480 | 7,480 | ||||||||||||
| Bank borrowings, current portion |
6,111 | 3,471 | 7,210 | 7,210 | ||||||||||||
| Capital lease obligations, current portion |
58 | 574 | 661 | 661 | ||||||||||||
|
|
|
|
|
|
|
|
|
|||||||||
| Total current liabilities |
22,674 | 23,624 | 29,220 | 28,312 | ||||||||||||
| Deferred revenue, net of current portion |
318 | 329 | 199 | 199 | ||||||||||||
| Bank borrowings, net of current portion |
1,786 | 2,914 | 1,895 | 1,895 | ||||||||||||
| Capital lease obligations, net of current portion |
— | 804 | 2,004 | 2,004 | ||||||||||||
| Other long-term liabilities |
2,484 | 2,644 | 2,932 | 2,932 | ||||||||||||
|
|
|
|
|
|
|
|
|
|||||||||
| Total liabilities |
27,262 | 30,315 | 36,250 | 35,342 | ||||||||||||
| Commitments and contingencies (Note 7) |
||||||||||||||||
| Convertible preferred stock, $0.001 par value—146,657 shares authorized as of December 31, 2012 and 2013, and June 30, 2014 (unaudited); 144,437 and 144,452 shares issued and outstanding as of December 31, 2012 and 2013 (aggregate liquidation preference of $103,494 as of December 31, 2013);144,452 shares issued and outstanding as of June 30, 2014 (unaudited) (aggregate liquidation preference of $103,494 as of June 30, 2014, unaudited); no shares issued and outstanding pro forma (unaudited) |
102,211 | 102,224 | 102,224 | — | ||||||||||||
| Stockholders’ equity (deficit): |
||||||||||||||||
| Common stock, $0.001 par value—278,000 shares authorized as of December 31, 2012 and 2013, and 300,000 as of June 30, 2014 (unaudited); 71,669 and 74,441 shares issued and outstanding as of December 31, 2012 and 2013; 76,251 shares issued and outstanding as of June 30, 2014 (unaudited); 220,703 shares issued and outstanding pro forma (unaudited) |
72 | 75 | 76 | 220 | ||||||||||||
| Additional paid-in capital |
250,909 | 253,849 | 255,153 | 360,600 | ||||||||||||
| Accumulated other comprehensive loss |
(963 | ) | (1,730 | ) | (1,177 | ) | (1,177 | ) | ||||||||
| Accumulated deficit |
(349,092 | ) | (350,273 | ) | (351,222 | ) | (353,681 | ) | ||||||||
|
|
|
|
|
|
|
|
|
|||||||||
| Total stockholders’ equity (deficit) |
(99,074 | ) | (98,079 | ) | (97,170 | ) | 5,962 | |||||||||
|
|
|
|
|
|
|
|
|
|||||||||
| Total liabilities, convertible preferred stock and stockholders’ equity (deficit) |
$ | 30,399 | $ | 34,460 | $ | 41,304 | $ | 41,304 | ||||||||
|
|
|
|
|
|
|
|
|
|||||||||
See accompanying notes.
F-3
Table of Contents
Consolidated Statements of Operations
(in thousands, except per share amounts)
| Year Ended December 31, | Six Months Ended June 30, |
|||||||||||||||||||
| 2011 | 2012 | 2013 | 2013 | 2014 | ||||||||||||||||
| (unaudited) | ||||||||||||||||||||
| Revenue(1): |
||||||||||||||||||||
| Subscription and support |
$ | 37,029 | $ | 44,336 | $ | 56,838 | $ | 26,120 | $ | 34,903 | ||||||||||
| Professional services and other |
17,400 | 13,458 | 13,322 | 5,736 | 6,163 | |||||||||||||||
|
|
|
|
|
|
|
|
|
|
|
|||||||||||
| Total revenue |
54,429 | 57,794 | 70,160 | 31,856 | 41,066 | |||||||||||||||
| Cost of revenue(2): |
||||||||||||||||||||
| Subscription and support |
17,325 | 17,177 | 19,139 | 9,206 | 11,399 | |||||||||||||||
| Professional services and other |
9,537 | 7,594 | 7,693 | 3,845 | 4,392 | |||||||||||||||
|
|
|
|
|
|
|
|
|
|
|
|||||||||||
| Total cost of revenue |
26,862 | 24,771 | 26,832 | 13,051 | 15,791 | |||||||||||||||
|
|
|
|
|
|
|
|
|
|
|
|||||||||||
| Gross profit |
27,567 | 33,023 | 43,328 | 18,805 | 25,275 | |||||||||||||||
| Operating expenses(2): |
||||||||||||||||||||
| Research and development |
16,768 | 16,193 | 17,948 | 9,409 | 10,260 | |||||||||||||||
| Sales and marketing |
12,911 | 13,638 | 15,418 | 7,401 | 9,690 | |||||||||||||||
| General and administrative |
9,793 | 8,852 | 9,386 | 4,183 | 5,519 | |||||||||||||||
|
|
|
|
|
|
|
|
|
|
|
|||||||||||
| Total operating expenses |
39,472 | 38,683 | 42,752 | 20,993 | 25,469 | |||||||||||||||
|
|
|
|
|
|
|
|
|
|
|
|||||||||||
| Operating income (loss) from continuing operations |
(11,905 | ) | (5,660 | ) | 576 | (2,188 | ) | (194 | ) | |||||||||||
| Other income (expense), net |
(917 | ) | 230 | (318 | ) | 40 | 87 | |||||||||||||
|
|
|
|
|
|
|
|
|
|
|
|||||||||||
| Income (loss) from continuing operations before provision for (benefit from) income taxes |
(12,822 | ) | (5,430 | ) | 258 | (2,148 | ) | (107 | ) | |||||||||||
| Provision for (benefit from) income taxes |
(3,736 | ) | 1,091 | 1,439 | 484 | 842 | ||||||||||||||
|
|
|
|
|
|
|
|
|
|
|
|||||||||||
| Net loss from continuing operations |
(9,086 | ) | (6,521 | ) | (1,181 | ) | (2,632 | ) | (949 | ) | ||||||||||
| Income from discontinued operations, net of provision for income taxes of $4,781, $0 and $0 in 2011, 2012, and 2013, and $0 in the six months ended June 30, 2013 and 2014 (unaudited)(3) |
6,999 | — | — | — | — | |||||||||||||||
|
|
|
|
|
|
|
|
|
|
|
|||||||||||
| Net loss |
$ | (2,087 | ) | $ | (6,521 | ) | $ | (1,181 | ) | $ | (2,632 | ) | $ | (949 | ) | |||||
|
|
|
|
|
|
|
|
|
|
|
|||||||||||
| Basic and diluted income (loss) per share attributable to common stockholders: |
||||||||||||||||||||
| Net loss from continuing operations |
$ | (0.15 | ) | $ | (0.10 | ) | $ | (0.02 | ) | $ | (0.04 | ) | $ | (0.01 | ) | |||||
| Income from discontinued operations |
0.11 | — | — | — | — | |||||||||||||||
|
|
|
|
|
|
|
|
|
|
|
|||||||||||
| Net loss |
$ | (0.04 | ) | $ | (0.10 | ) | $ | (0.02 | ) | $ | (0.04 | ) | $ | (0.01 | ) | |||||
|
|
|
|
|
|
|
|
|
|
|
|||||||||||
| Weighted average shares used to compute net loss per share attributable to common stockholders—basic and diluted |
58,876 | 66,489 | 72,631 | 72,173 | 75,175 | |||||||||||||||
|
|
|
|
|
|
|
|
|
|
|
|||||||||||
| Pro forma net loss per share attributable to common stockholders—basic and diluted (unaudited) |
$ | $ | ||||||||||||||||||
|
|
|
|
|
|||||||||||||||||
| Weighted average shares used to compute pro forma net loss per share attributable to common stockholders—basic and diluted (unaudited) |
||||||||||||||||||||
|
|
|
|
|
|||||||||||||||||
| (1) | The Company recorded revenue totaling $11.5 million, $11.1 million, $11.2 million, $5.6 million and $6.4 million from related parties during the years ended December 31, 2011, 2012, and 2013, and the six months ended June 30, 2013 and 2014, respectively. Refer to Note 15 to these consolidated financial statements for further information. |
| (2) | Amounts include stock-based compensation expense as follows (in thousands): |
| Year Ended December 31, | Six Months Ended June 30, |
|||||||||||||||||||
| 2011 | 2012 | 2013 | 2013 | 2014 | ||||||||||||||||
| (unaudited) | ||||||||||||||||||||
| Cost of revenue—subscription and support |
$ | 163 | $ | 170 | $ | 201 | $ | 106 | $ | 99 | ||||||||||
| Cost of revenue—professional services and other |
112 | 119 | 107 | 55 | 64 | |||||||||||||||
| Research and development |
266 | 236 | 243 | 128 | 128 | |||||||||||||||
| Sales and marketing |
302 | 242 | 302 | 153 | 172 | |||||||||||||||
| General and administrative |
524 | 588 | 658 | 278 | 456 | |||||||||||||||
|
|
|
|
|
|
|
|
|
|
|
|||||||||||
| Total stock-based compensation expense |
$ | 1,367 | $ | 1,355 | $ | 1,511 | $ | 720 | $ | 919 | ||||||||||
|
|
|
|
|
|
|
|
|
|
|
|||||||||||
| (3) | Income from discontinued operations contains revenue of $17.9 million from a related party. Refer to Note 17 to these consolidated financial statements for further information. |
See accompanying notes.
F-4
Table of Contents
Consolidated Statements of Comprehensive Loss
(in thousands)
| Year Ended December 31, | Six Months Ended June 30, |
|||||||||||||||||||
| 2011 | 2012 | 2013 | 2013 | 2014 | ||||||||||||||||
| (unaudited) | ||||||||||||||||||||
| Net loss |
$ | (2,087 | ) | $ | (6,521 | ) | $ | (1,181 | ) | $ | (2,632 | ) | $ | (949 | ) | |||||
| Other comprehensive income (loss), net of taxes: |
||||||||||||||||||||
| Foreign currency translation gain (loss) |
(697 | ) | (169 | ) | (599 | ) | (418 | ) | 150 | |||||||||||
| Change in unrealized gain (loss) on foreign currency contracts designated as cash flow hedges |
(325 | ) | 224 | (168 | ) | (336 | ) | 403 | ||||||||||||
|
|
|
|
|
|
|
|
|
|
|
|||||||||||
| Total other comprehensive income (loss) |
(1,022 | ) | 55 | (767 | ) | (754 | ) | 553 | ||||||||||||
|
|
|
|
|
|
|
|
|
|
|
|||||||||||
| Comprehensive loss |
$ | (3,109 | ) | $ | (6,466 | ) | $ | (1,948 | ) | $ | (3,386 | ) | $ | (396 | ) | |||||
|
|
|
|
|
|
|
|
|
|
|
|||||||||||
See accompanying notes.
F-5
Table of Contents
Consolidated Statements of Convertible Preferred Stock and Stockholders’ Equity (Deficit)
(in thousands)
| Convertible Preferred Stock |
Common Stock | Additional Paid-In Capital |
Accumulated Other Comprehensive Income (Loss) |
Accumulated Deficit |
Total Stockholders’ Deficit |
|||||||||||||||||||||||||||||
| Shares | Amount | Shares | Amount | |||||||||||||||||||||||||||||||
| Balance as of January 1, 2011 |
136,312 | $ | 92,207 | 66,440 | $ | 66 | $ | 243,530 | $ | 4 | $ | (340,484 | ) | $ | (96,884 | ) | ||||||||||||||||||
| Net loss |
— | — | — | — | — | — | (2,087 | ) | (2,087 | ) | ||||||||||||||||||||||||
| Stock-based compensation expense |
— | — | — | — | 1,367 | — | — | 1,367 | ||||||||||||||||||||||||||
| Issuance of common stock upon exercise of stock options |
— | — | 1,492 | 2 | 746 | — | — | 748 | ||||||||||||||||||||||||||
| Issuance of preferred stock upon exercise of stock warrants |
75 | 61 | — | — | — | — | — | — | ||||||||||||||||||||||||||
| Foreign currency translation loss |
— | — | — | — | — | (697 | ) | — | (697 | ) | ||||||||||||||||||||||||
| Change in unrealized gain (loss) on foreign currency contracts designated as accounting hedges |
— | — | — | — | — | (325 | ) | — | (325 | ) | ||||||||||||||||||||||||
|
|
|
|
|
|
|
|
|
|
|
|
|
|
|
|
|
|||||||||||||||||||
| Balance as of December 31, 2011 |
136,387 | 92,268 | 67,932 | 68 | 245,643 | (1,018 | ) | (342,571 | ) | (97,878 | ) | |||||||||||||||||||||||
| Net loss |
— | — | — | — | — | — | (6,521 | ) | (6,521 | ) | ||||||||||||||||||||||||
| Issuance of Series DD convertible preferred stock, net of issuance cost of $92 |
7,615 | 9,426 | — | — | — | — | — | — | ||||||||||||||||||||||||||
| Conversion of Venture Debt Facility into convertible preferred stock, net of issuance cost of $5 |
385 | 476 | — | — | — | — | — | — | ||||||||||||||||||||||||||
| Stock-based compensation expense |
— | — | — | — | 1,355 | — | — | 1,355 | ||||||||||||||||||||||||||
| Repurchase of unvested common stock |
— | — | (8,000 | ) | (8 | ) | — | — | — | (8 | ) | |||||||||||||||||||||||
| Issuance of common stock upon exercise of stock options |
— | — | 11,737 | 12 | 3,911 | — | — | 3,923 | ||||||||||||||||||||||||||
| Issuance of preferred stock upon exercise of stock warrants |
50 | 41 | — | — | — | — | — | — | ||||||||||||||||||||||||||
| Foreign currency translation loss |
— | — | — | — | — | (169 | ) | — | (169 | ) | ||||||||||||||||||||||||
| Change in unrealized gain (loss) on foreign currency contracts designated as accounting hedges |
— | — | — | — | — | 224 | — | 224 | ||||||||||||||||||||||||||
|
|
|
|
|
|
|
|
|
|
|
|
|
|
|
|
|
|||||||||||||||||||
| Balance as of December 31, 2012 |
144,437 | 102,211 | 71,669 | 72 | 250,909 | (963 | ) | (349,092 | ) | (99,074 | ) | |||||||||||||||||||||||
| Net loss |
— | — | — | — | — | — | (1,181 | ) | (1,181 | ) | ||||||||||||||||||||||||
| Stock-based compensation expense |
— | — | — | — | 1,511 | — | — | 1,511 | ||||||||||||||||||||||||||
| Issuance of common stock upon exercise of stock options |
— | — | 2,772 | 3 | 1,429 | — | — | 1,432 | ||||||||||||||||||||||||||
| Issuance of preferred stock upon exercise of stock warrants |
15 | 13 | — | — | — | — | — | — | ||||||||||||||||||||||||||
| Foreign currency translation loss |
— | — | — | — | — | (599 | ) | — | (599 | ) | ||||||||||||||||||||||||
| Change in unrealized gain (loss) on foreign currency contracts designated as accounting hedges |
— | — | — | — | — | (168 | ) | — | (168 | ) | ||||||||||||||||||||||||
|
|
|
|
|
|
|
|
|
|
|
|
|
|
|
|
|
|||||||||||||||||||
| Balance as of December 31, 2013 |
144,452 | 102,224 | 74,441 | 75 | 253,849 | (1,730 | ) | (350,273 | ) | (98,079 | ) | |||||||||||||||||||||||
| Net loss (unaudited) |
— | — | — | — | — | — | (949 | ) | (949 | ) | ||||||||||||||||||||||||
| Stock-based compensation expense (unaudited) |
— | — | — | — | 919 | — | — | 919 | ||||||||||||||||||||||||||
| Repurchase of common stock (unaudited) |
— | — | (481 | ) | (1 | ) | (472 | ) | — | — | (473 | ) | ||||||||||||||||||||||
| Issuance of common stock upon exercise of stock options (unaudited) |
— | — | 2,291 | 2 | 857 | — | — | 859 | ||||||||||||||||||||||||||
| Foreign currency translation gain (unaudited) |
— | — | — | — | — | 150 | — | 150 | ||||||||||||||||||||||||||
| Change in unrealized gain on foreign currency contracts designated as accounting hedges (unaudited) |
— | — | — | — | — | 403 | — | 403 | ||||||||||||||||||||||||||
|
|
|
|
|
|
|
|
|
|
|
|
|
|
|
|
|
|||||||||||||||||||
| Balance as of June 30, 2014 (unaudited) |
144,452 | $ | 102,224 | 76,251 | $ | 76 | $ | 255,153 | $ | (1,177 | ) | $ | (351,222 | ) | $ | (97,170 | ) | |||||||||||||||||
|
|
|
|
|
|
|
|
|
|
|
|
|
|
|
|
|
|||||||||||||||||||
See accompanying notes.
F-6
Table of Contents
Consolidated Statements of Cash Flows
(in thousands)
| Year Ended December 31, | Six Months Ended June 30, |
|||||||||||||||||||
| 2011 | 2012 | 2013 | 2013 | 2014 | ||||||||||||||||
| (unaudited) | ||||||||||||||||||||
| Cash flows from operating activities |
||||||||||||||||||||
| Net loss |
$ | (2,087 | ) | $ | (6,521 | ) | $ | (1,181 | ) | $ | (2,632 | ) | $ | (949 | ) | |||||
| Adjustments to reconcile net loss to net cash (used in) provided by operating activities: |
||||||||||||||||||||
| Depreciation and amortization |
2,535 | 2,390 | 2,685 | 1,294 | 1,570 | |||||||||||||||
| Proceeds from insurance settlement |
— | (450 | ) | (141 | ) | (141 | ) | — | ||||||||||||
| Amortization of debt discount |
101 | 22 | — | — | — | |||||||||||||||
| Revaluation of warrant liabilities |
7 | (8 | ) | 268 | 33 | 148 | ||||||||||||||
| Stock-based compensation expense |
1,367 | 1,355 | 1,511 | 720 | 919 | |||||||||||||||
| Changes in operating assets and liabilities: |
||||||||||||||||||||
| Accounts receivable, net |
5,898 | (1,803 | ) | (2,204 | ) | 301 | (1,694 | ) | ||||||||||||
| Prepaid expenses and other assets |
6,567 | 141 | (30 | ) | 811 | (1,658 | ) | |||||||||||||
| Accounts payable |
(1,093 | ) | 190 | (207 | ) | (363 | ) | 910 | ||||||||||||
| Accrued liabilities and other long term liabilities |
(98 | ) | (945 | ) | (642 | ) | (1,359 | ) | 694 | |||||||||||
| Accrued compensation |
(299 | ) | (1,109 | ) | 2,930 | 373 | (624 | ) | ||||||||||||
| Deferred revenue |
(16,917 | ) | (4,039 | ) | 520 | (1,051 | ) | (305 | ) | |||||||||||
|
|
|
|
|
|
|
|
|
|
|
|||||||||||
| Net cash (used in) provided by operating activities |
(4,019 | ) | (10,777 | ) | 3,509 | (2,014 | ) | (989 | ) | |||||||||||
| Cash flows from investing activities |
||||||||||||||||||||
| Purchases of property and equipment |
(2,431 | ) | (3,028 | ) | (3,025 | ) | (1,846 | ) | (2,525 | ) | ||||||||||
| Proceeds from insurance settlement |
— | 450 | 141 | 141 | — | |||||||||||||||
|
|
|
|
|
|
|
|
|
|
|
|||||||||||
| Net cash used in investing activities |
(2,431 | ) | (2,578 | ) | (2,884 | ) | (1,705 | ) | (2,525 | ) | ||||||||||
| Cash flows from financing activities |
||||||||||||||||||||
| Proceeds from bank borrowings |
9,000 | 9,400 | 7,500 | 3,000 | 5,600 | |||||||||||||||
| Principal payments on bank borrowings |
(4,703 | ) | (9,809 | ) | (9,011 | ) | (992 | ) | (2,880 | ) | ||||||||||
| Proceeds from issuance of convertible preferred stock |
— | 9,421 | — | — | — | |||||||||||||||
| Proceeds from issuance of common stock upon exercise of stock options |
504 | 3,923 | 1,432 | 272 | 859 | |||||||||||||||
| Principal payments on capital lease obligations |
(473 | ) | (372 | ) | (375 | ) | (147 | ) | (517 | ) | ||||||||||
| Deferred offering costs |
— | — | — | — | (946 | ) | ||||||||||||||
| Repurchase of common stock |
— | (8 | ) | — | — | (473 | ) | |||||||||||||
|
|
|
|
|
|
|
|
|
|
|
|||||||||||
| Net cash provided by (used in) financing activities |
4,328 | 12,555 | (454 | ) | 2,133 | 1,643 | ||||||||||||||
|
|
|
|
|
|
|
|
|
|
|
|||||||||||
| Net (decrease) increase in cash and cash equivalents |
(2,122 | ) | (800 | ) | 171 | (1,586 | ) | (1,871 | ) | |||||||||||
| Cash and cash equivalents—beginning of period |
10,885 | 8,763 | 7,963 | 7,963 | 8,134 | |||||||||||||||
|
|
|
|
|
|
|
|
|
|
|
|||||||||||
| Cash and cash equivalents—end of period |
$ | 8,763 | $ | 7,963 | $ | 8,134 | $ | 6,377 | $ | 6,263 | ||||||||||
|
|
|
|
|
|
|
|
|
|
|
|||||||||||
| Supplemental disclosures of cash flow information |
||||||||||||||||||||
| Cash paid for interest |
$ | 708 | $ | 576 | $ | 595 | $ | 300 | $ | 270 | ||||||||||
| Cash paid for income taxes |
$ | 456 | $ | 767 | $ | 929 | $ | 445 | $ | 392 | ||||||||||
| Non-cash investing and financing activities |
||||||||||||||||||||
| Vesting of early exercised options |
$ | 244 | $ | — | $ | — | $ | — | $ | — | ||||||||||
| Property and equipment financed through capital lease |
$ | — | $ | — | $ | 1,693 | $ | 781 | $ | 1,804 | ||||||||||
| Property and equipment purchased but not paid atperiod-end |
$ | 161 | $ | 623 | $ | 243 | $ | 90 | $ | 768 | ||||||||||
| Issuance of convertible preferred stock upon conversion of venture debt facility, net of issuance cost |
$ | — | $ | 476 | $ | — | $ | — | $ | — | ||||||||||
| Issuance of convertible preferred stock upon exercise of warrants |
$ | 61 | $ | 41 | $ | 13 | $ | 13 | $ | — | ||||||||||
| Unpaid deferred offering costs |
$ | — | $ | — | $ | — | $ | — | $ | 1,719 | ||||||||||
See accompanying notes.
F-7
Table of Contents
Notes to Consolidated Financial Statements
(Information as of June 30, 2014 and for the six months ended
June 30, 2013 and 2014 is unaudited)
1. Description of Business and Basis of Presentation
Description of Business
Yodlee, Inc. (“Yodlee” or the “Company”) is a technology and applications platform powering digital financial services in the cloud. We refer to our platform as the Yodlee Financial Cloud. The Yodlee Financial Cloud delivers a wide variety of financial applications (“FinApps”) targeted at the retail financial, wealth management, small business, card and other financial solutions sectors. The Company was incorporated in the state of Delaware in February 1999 and is headquartered in Redwood City, California. The Company has a wholly-owned subsidiary in Bangalore, India.
Basis of Presentation
The accompanying consolidated financial statements have been prepared in accordance with U.S. generally accepted accounting principles (“GAAP”) and include the accounts of Yodlee and its wholly-owned subsidiary. Intercompany balances and transactions have been eliminated in consolidation.
Unaudited Interim Consolidated Financial Statements
The accompanying interim consolidated balance sheet as of June 30, 2014, and the consolidated statements of operations, comprehensive loss and cash flows for the six months ended June 30, 2013 and 2014 and the consolidated statement of convertible preferred stock and stockholders’ deficit for the six months ended June 30, 2014 and the related footnote disclosures are unaudited. These unaudited interim consolidated financial statements have been prepared in accordance with U.S. GAAP. The unaudited interim consolidated financial statements have been prepared on the same basis as the audited financial statements and reflect, in management’s opinion, all adjustments of a normal, recurring nature that are necessary for the fair statement of the Company’s financial position as of June 30, 2014 and its consolidated results of operations and cash flows for the six months ended June 30, 2013 and 2014. The results for the six months ended June 30, 2014 are not necessarily indicative of the results expected for the full fiscal year or any other period.
Unaudited Pro Forma Consolidated Balance Sheet
Upon the consummation of the initial public offering (“IPO”) contemplated by the Company, all of the outstanding shares of convertible preferred stock will automatically convert into 144.5 million shares of common stock. The unaudited pro forma consolidated balance sheet as of June 30, 2014 has been prepared assuming (i) the conversion of the convertible preferred stock into common stock; (ii) reclassification of the convertible preferred stock warrants, which are currently classified as liabilities, to stockholders’ deficit; and (iii) $2.5 million of stock-based compensation expense associated with the Restricted Stock Units (“RSUs”), which the Company expects to record upon the completion of the Company’s IPO.
The stock-based compensation associated with RSUs relates to the RSUs for which the services have been performed as of June 30, 2014 and the performance condition would become probable as of June 30, 2014, assuming the completion of an IPO as of the beginning of the period. Refer to Stock-Based Compensation Expense in Note 2 for further details. This pro forma adjustment related to stock-based compensation expense has been reflected as an increase to additional paid-in capital and
F-8
Table of Contents
accumulated deficit. RSUs outstanding as of June 30, 2014 have not been included in the unaudited pro forma balance sheet disclosure of shares outstanding as the settlement of these shares will take place subsequent to the IPO. Payroll tax expenses and other withholding obligations have not been included in the pro forma adjustments. RSU holders generally will incur taxable income based upon the value of the shares on the date they are settled and the Company is required to withhold taxes on such value at applicable minimum statutory rates. The Company currently expects that the average of these withholding rates will be approximately 40%. The Company is unable to quantify these obligations as of June 30, 2014 and will remain unable to quantify this amount until the settlement of the RSUs as the withholding obligations will be based on the value of the shares on the settlement date.
2. Summary of Significant Accounting Policies
Use of Estimates
The preparation of consolidated financial statements in conformity with U.S. GAAP requires management to make estimates and assumptions that affect the reported amounts of assets, liabilities, revenue and expenses, as well as related disclosure of contingent assets and liabilities. Such estimates include, but are not limited to, revenue recognition, allowance for doubtful accounts, stock-based compensation expense, fair value of the Company’s common stock and stock options issued, provision for income taxes and goodwill. The Company bases its estimates on historical experience and on assumptions that the Company believes are reasonable. The Company assesses these estimates on a regular basis; however, actual results could materially differ from those estimates and such differences could be material to the Company’s consolidated financial position and results of operations.
Revenue Recognition
The Company primarily derives revenue from subscription and support fees and professional services fees. The Company sells subscriptions to its SaaS technology platform through contracts that are generally between one to three years in length, although terms can extend to as long as five years. The Company’s arrangements do not contain general rights of return. The Company’s subscription arrangements do not provide customers with the right to take possession of the SaaS technology platform and, as a result, are accounted for as service arrangements. The Company records revenue net of any sales or excise taxes.
The Company commences revenue recognition for its SaaS technology platform and professional services when all of the following criteria are met:
| • | there is persuasive evidence of an arrangement; |
| • | the service has been or is being provided to the customer; |
| • | collection of the fees is reasonably assured; and |
| • | the amount of fees to be paid by the customer is fixed or determinable. |
Subscription and Support Revenue
Subscription and support revenue is primarily derived from customers accessing the SaaS technology platform and includes subscription, support, and usage-based fees. Subscription and support revenue is recognized ratably over the contracted term of each respective subscription agreement, commencing on the date the service is provisioned to the customer, provided the four revenue recognition criteria have been satisfied. Usage-based revenue is recognized as earned, provided the four revenue recognition criteria have been satisfied.
F-9
Table of Contents
Professional Services and Other Revenue
Professional services include implementation services, development of interfaces requested by customers, assistance with integration of the Company’s services with the customers’ applications, dedicated support, and advisory services to customers who choose to develop their own interfaces and applications. Professional services are typically performed within three to nine months of entering into an arrangement with the customer. Professional services are sold either on a fixed-fee or on a time-and-materials basis. Revenue for time-and-material arrangements is recognized as the services are performed. During the years ended December 31, 2011 and 2012, revenue for fixed-fee arrangements was recognized under the completed performance method of accounting. During the year ended December 31, 2013, and the six months ended June 30, 2013 and 2014 revenue for fixed-fee arrangements was recognized under the proportional performance method of accounting as the Company has developed a history of accurately estimating activity. The Company uses labor hours incurred to the end of each reporting period compared to the total estimated labor hours as an input based measure of performance under customer arrangements. The Company believes labor hours incurred is materially representative of the value delivered to the customer at any point in time during the performance of the service. Professional services are not considered essential to the functionality of the SaaS offering.
Included in other revenue, the Company recognized software license revenue on a straight-line basis from the acceptance date over the contractual post-sale customer support (“PCS”) period, as the Company did not have sufficient vendor-specific objective evidence of the fair value of the PCS.
Multiple Element Arrangements
The Company enters into multiple element arrangements in which a customer may purchase a subscription and professional services. For arrangements with multiple deliverables, the Company evaluates whether the individual deliverables qualify as separate units of accounting. In order to treat deliverables in a multiple element arrangement as separate units of accounting, the deliverables must have standalone value upon delivery. If the deliverables have standalone value upon delivery, the Company accounts for each deliverable separately and revenue is recognized for the respective deliverables as they are delivered. If one or more of the deliverables does not have standalone value upon delivery, the deliverables that do not have standalone value are combined with the final deliverable within the arrangement and treated as a single unit of accounting.
Subscription and support contracts have standalone value as the Company sells subscriptions and support separately. In determining whether professional services can be accounted for separately from subscription and support services, the Company considers the availability of the professional services from other vendors, the nature of its professional services and whether the Company sells its applications to new customers without professional services. Based on these considerations the Company assessed that its professional services have standalone value.
The Company determines the selling price for each element based on the selling price hierarchy of: (i) vendor-specific objective evidence (“VSOE”) of fair value, (ii) third-party evidence (“TPE”), and (iii) estimated selling price (“ESP”). The Company is unable to establish VSOE for any of its services, as the Company has not historically priced its services with sufficient consistency. The Company is also unable to establish TPE, as the Company does not have sufficient information regarding pricing of third-party subscription and professional services similar to its offerings. As a result, the Company has developed estimates of selling prices based on margins established by senior management as the targets in the Company’s selling and pricing strategies after considering the nature of the services, the economic and competitive environment, and the nature and magnitude of the costs incurred. The amount of arrangement fee allocated is limited by contingent revenue, if any.
F-10
Table of Contents
Deferred Revenue
Deferred revenue consists of billings and payments received in advance of revenue recognition from the Company’s subscription and support offerings as described above and is recognized as the revenue recognition criteria are met. For subscription agreements, the Company typically invoices its customers in monthly or annual fixed installments. Accordingly, the deferred revenue balance does not represent the total contract value of these multi-year subscription agreements. Deferred revenue also includes certain deferred professional services fees, which are recognized in accordance with the Company’s revenue recognition policy. The portion of deferred revenue the Company expects to recognize during the succeeding 12-month period is recorded as current deferred revenue, and the remaining portion is recorded as noncurrent.
Cost of Revenue
Cost of revenue-subscription and support consists primarily of personnel-related costs, including salaries, benefits and stock-based compensation, for the operations team; data center costs to host the SaaS technology platform and related support and maintenance costs; depreciation of servers and networking equipment; security operations; payment processing cost; and allocated facilities and other supporting overhead costs.
Cost of revenue-professional services and other consists primarily of personnel-related costs, including salaries, benefits and stock-based compensation, for the professional services team; cost of consultants engaged in providing professional services to customers; and allocated facilities and other supporting overhead costs.
Deferred Professional Services Costs and Commissions
Deferred professional services costs are related to deferred professional services revenue that the Company considers recoverable and are recognized in cost of revenue in the same periods as the related revenue.
Deferred commissions are the incremental costs that are directly associated with noncancelable subscription contracts and consist of sales commissions paid to direct sales representatives. The commissions are deferred and amortized over the related subscription term. The commission payments are typically paid in full the month after the customer’s service commences. The deferred commission amounts are recoverable from the future revenue streams under the noncancelable subscription contracts.
Deferred professional services and deferred commissions are included in prepaid expenses and other current assets and other assets in the accompanying consolidated balance sheets. Amortization of deferred professional services and deferred commissions are included in cost of revenue and sales and marketing expense, respectively, in the accompanying consolidated statements of operations. The professional services costs are charged to expense over the same period that the related subscription or professional services revenue is recognized. The commission costs are charged to expense over the same period that the subscription and support revenue is recognized.
During the years ended December 31, 2012 and 2013, the Company capitalized $0.6 million and $0.6 million, respectively, of commissions and amortized $0.5 million and $0.5 million, respectively, to sales and marketing expense. During the six months ended June 30, 2013 and 2014, the Company capitalized $0.1 million and $0.8 million, respectively, of commissions and amortized $0.2 million and $0.3 million, respectively, to sales and marketing expense. During the years ended December 31, 2012 and 2013, the Company capitalized $1.3 million and $0.8 million, respectively, of deferred professional services costs and amortized $1.5 million and $0.9 million, respectively, to cost of revenue-professional
F-11
Table of Contents
services and other. During the six months ended June 30, 2013, the Company capitalized $0.8 million of deferred professional services costs and amortized $0.8 million to cost of revenue-professional services and other. During the six months ended June 30, 2014, there was no deferred professional services costs capitalized or amortized to cost of revenue-professional services and other.
Deferred Offering Costs
Deferred offering costs consisted primarily of direct incremental legal and accounting fees related to our proposed initial public offering. Deferred offering costs of $2.7 million are included in other assets (non-current) on our consolidated balance sheet as of June 30, 2014. No amounts were deferred as of December 31, 2012 and 2013. Upon completion of the initial public offering contemplated herein, these amounts will be reflected in the net proceeds of the offering. If the offering is terminated, the deferred offering costs will be expensed.
Cash and Cash Equivalents
The Company considers all highly liquid investments purchased with an original maturity of three months or less to be cash equivalents. Cash and cash equivalents consist of amounts on deposit with commercial banks in checking, interest-bearing, and demand money market accounts.
Restricted Cash
As required by the lease agreement for the Company’s main facilities in Redwood City, California, the Company provided a certificate of deposit as collateral for a letter of credit issued for the benefit of the landlord in lieu of a security deposit. The letter of credit expires on July 31, 2015. The restricted certificate of deposit of $0.1 million is included in long-term restricted cash in the accompanying consolidated balance sheets.
The Company has restrictions as to the withdrawal or usage of its restricted cash until the completion of the contract term.
Operating and Capital Leases
The Company leases office spaces under noncancelable operating leases. The terms of the lease agreements provide for rental payments on a monthly basis. Certain operating lease arrangements contain rent holidays and rent escalation provisions. The Company recognizes rent expense on a straight-line basis over the lease period and accrues for rent expense incurred but not yet paid. The Company does not assume renewals in its determination of the lease term unless the renewals are deemed to be reasonably assured at lease inception.
The Company acquired certain software licenses and server and network equipment classified as capital leases. The Company’s server and networking equipment leases typically are accounted for as capital leases as they meet one or more of the four capital lease classification criteria. Assets acquired under capital leases are amortized over their estimated useful life of three years. The original term of the capital leases ranges from three to four years. The portion of the future payments designated as principal repayment was classified as a capital lease obligation on the consolidated balance sheets.
Property and Equipment
Property and equipment are stated at cost, less accumulated depreciation. Depreciation is recognized on a straight-line basis and is recorded over the estimated useful lives of the respective assets of three years. Leasehold improvements are amortized on a straight-line basis over the shorter of the estimated useful life of the assets or the term of the lease.
F-12
Table of Contents
Goodwill
Goodwill represents the excess of the purchase price over the fair value of assets acquired and liabilities assumed in a business combination. Goodwill is presumed to have an indefinite life and is not subject to amortization. The Company tests goodwill for impairment at the Company level, which is the sole reporting unit, on at least an annual basis and at any interim date whenever events or changes in circumstances indicate that the carrying value may not be recoverable.
Goodwill is evaluated for impairment by first performing a qualitative assessment to determine whether a quantitative goodwill test is necessary. If it is determined, based on qualitative factors such as macroeconomic conditions, industry and market conditions, overall financial performance and any other Company developments, that the fair value of the reporting unit more likely than not is less than the carrying amount, or if significant changes to macroeconomic factors have occurred that could materially impact fair value, a quantitative goodwill impairment test would be required. Additionally, there is an option to bypass the qualitative assessment and directly perform the quantitative test.
The quantitative test for goodwill impairment is a two-step process. The first step is a comparison of the fair value of the reporting unit with its carrying amount, including goodwill. If this step indicates an impairment, then the second step is performed to measure the loss as the excess of recorded goodwill over its implied fair value. Implied fair value is the excess of the fair value of the reporting unit over the fair value of all identified assets and liabilities.
The Company has goodwill of $3.1 million reported on the accompanying consolidated balance sheets as of December 31, 2012 and 2013 and June 30, 2014. Goodwill is examined for impairment in the fourth quarter of each fiscal year, or earlier if indicators of potential impairment exist. The Company completed the annual impairment test during the fourth quarter of the years ended December 31, 2011, 2012 and 2013. When assessing goodwill for impairment, the Company chose to bypass the qualitative assessment and directly perform the quantitative assessment. The fair value of the reporting unit, at Company level, was compared with its carrying amount including goodwill. The first step of quantitative assessment indicated that the fair value of the Company’s reporting unit was significantly higher than the carrying amount including goodwill, and hence the second step was not required to be performed. Based on the above quantitative assessment, it was concluded that goodwill was not impaired during the years ended December 31, 2011, 2012 and 2013.
For the years ended December 31, 2011, 2012 and 2013 and the six months ended June 30, 2013 and 2014, gross goodwill balance equaled the net balance of $3.1 million since no impairment charges have been recorded.
Impairment of Long-Lived Assets
The Company identifies and records impairment losses on long-lived assets used in operations when events and circumstances indicate that assets may be impaired and when projected undiscounted cash flows from those assets are less than the carrying amounts of the assets. If those conditions are present, the impairment loss is measured as the amount by which the carrying amount of the asset exceeds the fair value. No significant impairment charges to long-lived assets were recorded during the years ended December 31, 2011, 2012 and 2013, and the six months ended June 30, 2013 and 2014.
Research and Development
The Company expenses the cost of research and development as incurred. Research and development expenses consist primarily of personnel costs for research and development staff, the cost of third-party service providers, allocated facilities and other supporting overhead costs.
F-13
Table of Contents
Capitalized Software Costs
For website development costs and the development costs related to the SaaS technology platform, the Company’s policy is to capitalize costs incurred during the application development stage, if material. Costs related to preliminary project activities and post-implementation activities are expensed as incurred.
While most of the Company’s customer arrangements are delivered to customers on the Company’s SaaS technology platform, whereby the customers do not have the ability to take possession of the software, customers could, and on occasion have, negotiated to purchase licenses to the Company’s products that would not involve hosting by the Company. Accordingly, when determining which software development costs to capitalize, the Company follows the guidance for cost of software to be sold, leased, or otherwise marketed. The Company begins to capitalize software development costs upon the establishment of technological feasibility, which is generally the completion of a working prototype that has been certified as having no critical bugs and is available to be purchased by the customers. To date, software development costs incurred between completion of a working prototype and general availability of the related product have not been material and are expensed as incurred.
Segment Information
The Company considers operating segments to be components of Yodlee in which separate financial information is available that is evaluated regularly by the chief operating decision-maker, the Company’s Chief Executive Officer, in deciding how to allocate resources and in assessing performance. The Chief Executive Officer reviews financial information presented on a consolidated basis, accompanied by information about revenue by geographic region, for purposes of allocating resources and evaluating financial performance. The Company has one business activity, and there are no segment managers who are held accountable for operations, operating results, or plans for levels or components below the consolidated unit level. Accordingly, the Company has determined that it has a single reporting segment and operating unit structure.
Stock-Based Compensation
Compensation costs related to stock options granted to employees are based on the fair value of the stock options on the date of grant, net of estimated forfeitures. The Company determines the grant date fair value of the options using the Black-Scholes option-pricing model and recognizes the fair value as stock-based compensation expense on a straight-line basis over the vesting period of the stock options. The stock options granted have a contractual term of ten years and generally vest over four years. Refer to Note 12 for further information.
During 2013, the Company granted RSUs which vest upon the satisfaction of both a performance condition and a service condition. The performance condition includes, among other alternatives, an IPO no later than September 30, 2014. The service condition for the awards is satisfied if the RSU holder continues to be a service provider six months after an IPO, and the awards vest quarterly over 2 1⁄2 years from that date. During the six months ended June 30, 2014, the Company granted RSUs which vest upon the satisfaction of both a performance condition and a service condition. The performance condition includes, among other alternatives, the completion of an IPO no later than May 15, 2017. The service condition for the awards is satisfied if the RSU holder continues to be a service provider through the applicable annual vesting dates. RSUs for which the service condition or performance condition has not been satisfied are forfeited. Share-based compensation expense related to these grants is based on the grant date fair value of the RSUs and is recognized based on the accelerated attribution method over the applicable service period, net of estimated forfeitures. The grant date fair value of the RSUs is determined by the estimated fair value of Company’s common stock at the time of grant.
F-14
Table of Contents
As of June 30, 2014, the Company had not recognized any stock-based compensation expense for the RSUs, because the completion of the Company’s IPO had not occurred and was not probable of occurrence. Although the performance condition for the RSUs will be satisfied on a date subsequent to the IPO, because the satisfaction of the performance condition becomes probable upon the completion of the Company’s IPO, provided the services have been performed as of such date, the Company will record a significant cumulative stock-based compensation expense for these RSUs in the quarter in which the IPO occurs, using the accelerated attribution method, net of estimated forfeitures. The remaining unrecognized stock-based compensation expense related to the RSUs will be recorded over the remaining requisite service period using the accelerated attribution method, net of estimated forfeitures.
Income Taxes
Income taxes are accounted for under the liability method. Deferred tax assets and liabilities are recognized for the estimated future tax consequences attributable to differences between the tax bases of assets and liabilities and their financial statement carrying amounts, and consideration is given to operating losses and tax credit carryforwards. Deferred tax assets and liabilities are measured using enacted tax rates expected to apply to taxable income in the years in which those temporary differences are expected to be recovered or settled. The Company estimates actual current tax expense together with assessing temporary differences resulting from differences for financial reporting purposes and tax purposes for certain items, such as accruals and allowances not currently deductible for tax purposes. These temporary differences result in deferred tax assets and liabilities, which are included in the consolidated balance sheets. In general, deferred tax assets represent future tax benefits to be received when certain expenses previously recognized in the consolidated statements of operations become deductible expenses under applicable income tax laws or when net operating loss or credit carryforwards are utilized. Accordingly, realization of deferred tax assets is dependent on future taxable income against which these deductions, losses, and credits can be utilized.
The Company assesses the likelihood that deferred tax assets will be recovered from future taxable income, and, to the extent the Company believes that recovery is not likely, it establishes a valuation allowance.
The Company recognizes and measures uncertain tax positions using a two-step approach. The first step is to evaluate the tax position taken or expected to be taken in a tax return by determining if the weight of available evidence indicates that it is more likely than not that the tax position will be sustained upon audit, including resolution of any related appeals or litigation processes. For tax positions that are more likely than not of being sustained upon audit, the second step is to measure the tax benefit as the largest amount that is more than 50% likely of being realized upon settlement. Significant judgment is required to evaluate uncertain tax positions. The Company evaluates its uncertain tax positions on a regular basis. Evaluations are based upon a number of factors, including changes in facts or circumstances, changes in tax law, correspondence with tax authorities during the course of audits, and effective settlement of audit issues. The Company recognizes interest accrued and penalties related to unrecognized tax benefits in the income tax provision.
Foreign Currency
The assets and liabilities of the foreign subsidiary, where the local currency is the functional currency, are translated into U.S. dollars at the exchange rate in effect at the consolidated balance sheet date. Income and expense amounts are translated at average rates during the period. The resulting foreign currency translation adjustment is recorded in accumulated other comprehensive income (loss) (“AOCI”) in stockholders’ equity (deficit) in the accompanying consolidated balance sheets. The Company is also subject to gains and losses from foreign currency denominated transactions and the remeasurement of foreign currency denominated balance sheet accounts, both of which are included in other income (expense), net in the accompanying consolidated statements of operations.
F-15
Table of Contents
Derivative Financial Instruments
The Company uses foreign currency forward contracts to reduce its exposure to foreign currency exchange rate changes of the Indian Rupee on certain forecasted operating expenses and on certain existing assets and liabilities.
The contracts typically mature within 12 months, and they are not held for trading purposes. The Company may designate certain of its foreign currency forward contracts as hedging instruments subject to hedge accounting treatment. The Company records all of its derivative instruments at their gross fair value on the consolidated balance sheet, at each balance sheet date.
The accounting for changes in the fair value of a derivative instrument depends on whether the instrument has been designated and qualifies as a cash flow hedge for accounting purposes. For foreign currency forward contracts that are designated and qualify as hedging instruments, the effective portion of the gain or loss on the derivative instrument is reported as a component of AOCI in stockholders’ equity (deficit) and reclassified into operating expenses and cost of revenue in the same period during which the hedged transaction affects earnings. The ineffective portion of the gain or loss on the derivative instrument, if any, is recognized in other income (expense), net in the accompanying consolidated statements of operations. To receive hedge accounting treatment, cash flow hedges must be highly effective in offsetting changes to expected future cash flows on hedged transactions. The changes in the time value are excluded from the assessment of hedge effectiveness and are recognized in other income (expense), net in the accompanying consolidated statements of operations.
Gains and losses related to derivative instruments that do not qualify for hedge accounting treatment are recognized in other income (expense), net in the accompanying consolidated statements of operations.
The Company classifies its cash flows from the derivative instruments as operating activities.
Credit Risk and Significant Concentrations
Financial instruments that potentially subject the Company to credit risk primarily consist of cash equivalents, accounts receivable, and derivative instruments to the extent of the amounts recorded as an asset on the accompanying consolidated balance sheets. For cash equivalents, the Company is exposed to credit risk in the event of default by the financial institution, and deposits may exceed federally insured limits. For accounts receivable, the Company does not require collateral, but instead limits its exposure to credit risk by performing ongoing credit evaluations of its customers’ financial condition and by limiting the amount of credit extended whenever deemed necessary. Derivative financial instruments are used to manage exposure to foreign currency risks. Derivatives expose the Company to credit risk to the extent the counterparty may be unable to meet the terms of the arrangement. The Company seeks to minimize such risk by limiting the counterparty to those with high credit ratings. The Company has not historically experienced any losses due to credit risk or lack of performance by counterparties.
During the years ended December 31, 2011 and 2012, one customer, a related party, accounted for 21% and 18% of total revenue, respectively. During the year ended December 31, 2013, two customers accounted for 15% (a related party) and 11% of total revenue. During the six months ended June 30, 2013 two customers accounted for 17% (a related party) and 10% of total revenue. During the six months ended June 30, 2014, one customer, a related party, accounted for 14% of total revenue. As of December 31, 2012, two customers accounted for 25% (a related party) and 11% of total accounts receivable. As of December 31, 2013, one customer, a related party, accounted for 17% of total accounts receivable. As of June 30, 2014, one customer, a related party, accounted for 19% of total accounts receivable.
F-16
Table of Contents
Accounts Receivable
Accounts receivable are recorded at the invoiced amount, net of allowances for doubtful accounts, and are not interest bearing. The Company maintains an allowance for doubtful accounts to reserve for potentially uncollectible receivables. The Company does not require collateral from customers. An allowance for doubtful accounts is determined using the specific-identification method for doubtful accounts. Uncollectible receivables are written off against the allowance for doubtful accounts when all efforts to collect them have been exhausted, and recoveries are recorded as a decrease to the bad debt expense when they are received. If the financial condition of customers were to deteriorate, additional allowances may be required and the Company’s operating results and financial position could be adversely affected.
Advertising Expense
Advertising costs are expensed as incurred and included in sales and marketing expense on the consolidated statements of operations. Advertising expenses were not significant during the years ended December 31, 2011, 2012, and 2013, and the six months ended June 30, 2013 and 2014.
Freestanding Convertible Preferred Stock Warrants
The Company accounts for freestanding warrants to purchase shares of convertible preferred stock that are contingently redeemable as liabilities on the consolidated balance sheets at their estimated fair value because the Company may be obligated to redeem the preferred stock issuable upon exercise of these warrants at some point in the future. At the end of each reporting period, changes in the estimated fair value of the convertible preferred stock warrants during the period are recorded through other income (expense), net in the consolidated statements of operations. The Company will continue to adjust the convertible preferred stock warrant liabilities for changes in the estimated fair value of the warrants until the earlier of the exercise of the warrants or the completion of a liquidation event, including the completion of an IPO, at which time the convertible preferred stock issuable upon exercise of the warrants will become common stock and the related liability will be reclassified to stockholders’ equity (deficit).
Fair Value of Financial Instruments
The Company measures and reports its cash equivalents, foreign currency forward exchange contracts, and convertible preferred stock warrant liabilities at fair value. Fair value is defined as the exchange price that would be received for an asset or an exit price paid to transfer a liability in the principal or most advantageous market for the asset or liability in an orderly transaction between market participants on the measurement date. Valuation techniques used to measure fair value must maximize the use of observable inputs and minimize the use of unobservable inputs.
The fair value hierarchy defines a three-level valuation hierarchy for disclosure of fair value measurements as follows:
Level I—Inputs are unadjusted quoted prices in active markets for identical assets or liabilities.
Level II—Inputs other than quoted prices included within Level I that are observable, unadjusted quoted prices in markets that are not active, or other inputs that are observable or can be corroborated by observable market data for substantially the full term of the related assets or liabilities.
Level III—Unobservable inputs that are supported by little or no market activity for the related assets or liabilities and typically reflect management’s estimate of assumptions that market participants would use in pricing the assets or liabilities.
F-17
Table of Contents
The categorization of a financial instrument within the valuation hierarchy is based upon the lowest level of input that is significant to the fair value measurement.
Recent Accounting Pronouncements
In February 2013, the Financial Accounting Standards Board (“FASB”) issued additional guidance regarding the presentation of comprehensive income. The new guidance requires an entity to present the effects on net income line items of significant amounts reclassified out of accumulated other comprehensive income, but only if the item reclassified is required under GAAP to be reclassified to net income in its entirety in the same reporting period. An entity shall provide this information either on the face of the consolidated financial statements or in the notes to the consolidated financial statements. The guidance was effective for fiscal years beginning after December 15, 2012. The adoption of this guidance effective January 1, 2013 did not result in a material impact on the consolidated financial statements.
In March 2013, the FASB issued an accounting standard update requiring an entity to release into net income the entire amount of a cumulative translation adjustment related to its investment in a foreign entity when as a parent it either sells a part or all of its investment in a foreign entity or no longer holds a controlling financial interest in a subsidiary or group of assets within a foreign entity. This accounting standard update will be effective prospectively for the Company beginning in the fiscal year 2015. The Company does not expect the adoption of this accounting standard update will have a material impact on the consolidated financial statements.
In July 2013, the FASB issued a new accounting standard update on the financial statement presentation of unrecognized tax benefits. The new guidance provides that a liability related to an unrecognized tax benefit would be presented as a reduction of a deferred tax asset for a net operating loss carryforward, a similar tax loss or a tax credit carryforward if such settlement is required or expected in the event the uncertain tax position is disallowed. The new guidance became effective for the Company on January 1, 2014 and it should be applied prospectively to unrecognized tax benefits that exist at the effective date with retrospective application permitted. The Company adopted the guidance in the six months ended June 30, 2014, and there was no material impact of this new guidance on the consolidated financial statements.
In May 2014, the FASB issued an accounting standard update on revenue from contracts with customers, which requires an entity to recognize the amount of revenue to which it expects to be entitled for the transfer of promised goods or services to customers. The new guidance will replace most existing revenue recognition guidance in U.S. GAAP when it becomes effective. The new standard is effective for the Company on January 1, 2017. Early application is not permitted. The standard permits the use of either the retrospective or cumulative effect transition method. The Company is currently evaluating the effect that the new guidance will have on its consolidated financial statements and related disclosures. The Company has not yet selected a transition method nor has it determined the effect of the standard on its ongoing financial reporting.
F-18
Table of Contents
3. Derivative Financial Instruments
Derivative instruments measured at fair value and their classification on the consolidated balance sheets are presented in the following tables (in thousands):
| December 31, | June 30, 2014 |
|||||||||||||||||||||||
| 2012 | 2013 | |||||||||||||||||||||||
| Notional Amount |
Fair Value |
Notional Amount |
Fair Value |
Notional Amount |
Fair Value |
|||||||||||||||||||
| (unaudited) | ||||||||||||||||||||||||
| Derivative instruments included in prepaid and other current assets: |
||||||||||||||||||||||||
| Derivatives designated as hedging instruments |
$ | 1,293 | $ | 42 | $ | 1,231 | $ | 1 | $ | 6,459 | $ | 345 | ||||||||||||
| Derivatives not designated as hedging instruments |
1,458 | 45 | — | — | 3,982 | 238 | ||||||||||||||||||
|
|
|
|
|
|
|
|
|
|
|
|
|
|||||||||||||
| Total |
$ | 2,751 | $ | 87 | $ | 1,231 | $ | 1 | $ | 10,441 | $ | 583 | ||||||||||||
|
|
|
|
|
|
|
|
|
|
|
|
|
|||||||||||||
| Derivative instruments included in accrued liabilities: |
||||||||||||||||||||||||
| Derivatives designated as hedging instruments |
$ | 2,714 | $ | (50 | ) | $ | 3,859 | $ | (213 | ) | $ | — | $ | — | ||||||||||
| Derivatives not designated as hedging instruments |
3,249 | (80 | ) | 4,189 | (101 | ) | — | — | ||||||||||||||||
|
|
|
|
|
|
|
|
|
|
|
|
|
|||||||||||||
| Total |
$ | 5,963 | $ | (130 | ) | $ | 8,048 | $ | (314 | ) | $ | — | $ | — | ||||||||||
|
|
|
|
|
|
|
|
|
|
|
|
|
|||||||||||||
Gains (losses) on derivative instruments designated as hedging instruments and their classification on the consolidated statements of operations are presented in the following tables (in thousands):
| Year Ended December 31, | Six Months Ended June 30, |
|||||||||||||||||||
| 2011 | 2012 | 2013 | 2013 | 2014 | ||||||||||||||||
| (unaudited) | ||||||||||||||||||||
| Gain (losses) recognized in AOCI—effective portion |
$ | (325 | ) | $ | (101 | ) | $ | (268 | ) | $ | (437 | ) | 135 | |||||||
| Losses reclassified from AOCI into net loss—effective portion(1) |
(55 | ) | (469 | ) | (442 | ) | (34 | ) | (193 | ) | ||||||||||
| Gain (losses) recognized—ineffective portion and amount excluded from effectiveness testing(2) |
254 | (244 | ) | (445 | ) | 50 | (61 | ) | ||||||||||||
| (1) | For the year ended December 31, 2011, the amount includes losses reclassified from AOCI into net loss for the effective portion of cash flow hedges, of which losses of $31,000 and $24,000 were recognized within cost of sales and operating expenses, respectively, within the consolidated statement of operations. For the year ended December 31, 2012, the amount includes gains (losses) reclassified from AOCI into net gain (loss) for the effective portion of cash flow hedges, of which net losses of $0.3 million and $0.2 million were recognized within cost of sales and operating expenses, respectively, within the consolidated statement of operations. For the year ended December 31, 2013, the amount includes gains (losses) reclassified from AOCI into net gain (loss) for the effective portion of cash flow hedges, of which net losses of $0.2 million and $0.2 million were recognized within cost of sales and operating expenses, respectively, within the consolidated statement of operations. For the six months ended June 30, 2013, the amount includes gains (losses) reclassified from AOCI into net gain (loss) for the effective portion of cash flow hedges of which net losses of $18,000 and $16,000 were recognized within cost of sales and |
F-19
Table of Contents
| operating expenses, respectively, within the consolidated statement of operations. For the six months ended June 30, 2014, the amount includes gains (losses) reclassified from AOCI into net gain (loss) for the effective portion of cash flow hedges, of which net losses of $0.1 million and $0.1 million were recognized within cost of sales and operating expenses, respectively, within the consolidated statement of operations. |
| (2) | Included in other income (expense), net. |
As of December 31, 2013 and June 30, 2014, the Company estimated that the entire net unrealized gain (loss) of $(0.3) million and $0.1 million included in AOCI will be reclassified into earnings within the next 12 months.
The gain (loss) recognized in other income (expense), net for foreign currency forward contracts not designated as hedging instruments amounted to $(1.0) million, $23,000, $(0.4) million, $(0.2) million and $0.3 million in the years ended December 31, 2011, 2012, and 2013, and the six months ended June 30, 2013 and 2014, respectively.
4. Fair Value Measurements
The following tables set forth the fair value of the Company’s financial assets and liabilities measured at fair value on a recurring basis as of December 31, 2012 and 2013, and June 30, 2014 based on the three-tier fair value hierarchy (in thousands):
| As of December 31, 2012 | ||||||||||||||||
| Fair Value | Level I | Level II | Level III | |||||||||||||
| Assets |
||||||||||||||||
| Money market funds(1) |
$ | 4,465 | $ | 4,465 | $ | — | $ | — | ||||||||
| Foreign currency forwards(2) |
87 | — | 87 | — | ||||||||||||
|
|
|
|
|
|
|
|
|
|||||||||
| Total assets measured at fair value |
$ | 4,552 | $ | 4,465 | $ | 87 | $ | — | ||||||||
|
|
|
|
|
|
|
|
|
|||||||||
| Liabilities |
||||||||||||||||
| Convertible preferred stock warrant liabilities |
$ | 505 | $ | — | $ | — | $ | 505 | ||||||||
| Foreign currency forwards(3) |
130 | — | 130 | — | ||||||||||||
|
|
|
|
|
|
|
|
|
|||||||||
| Total liabilities measured at fair value |
$ | 635 | $ | — | $ | 130 | $ | 505 | ||||||||
|
|
|
|
|
|
|
|
|
|||||||||
| As of December 31, 2013 | ||||||||||||||||
| Fair Value | Level I | Level II | Level III | |||||||||||||
| Assets |
||||||||||||||||
| Money market funds(1) |
$ | 4,966 | $ | 4,966 | $ | — | $ | — | ||||||||
| Foreign currency forwards(2) |
1 | — | 1 | — | ||||||||||||
|
|
|
|
|
|
|
|
|
|||||||||
| Total assets measured at fair value |
$ | 4,967 | $ | 4,966 | $ | 1 | $ | — | ||||||||
|
|
|
|
|
|
|
|
|
|||||||||
| Liabilities |
||||||||||||||||
| Convertible preferred stock warrant liabilities |
$ | 760 | $ | — | $ | — | $ | 760 | ||||||||
| Foreign currency forwards(3) |
314 | — | 314 | — | ||||||||||||
|
|
|
|
|
|
|
|
|
|||||||||
| Total liabilities measured at fair value |
$ | 1,074 | $ | — | $ | 314 | $ | 760 | ||||||||
|
|
|
|
|
|
|
|
|
|||||||||
F-20
Table of Contents
| As of June 30, 2014 | ||||||||||||||||
| Fair Value | Level I | Level II | Level III | |||||||||||||
| (unaudited) | ||||||||||||||||
| Assets |
||||||||||||||||
| Money market funds(1) |
$ | 2,966 | $ | 2,966 | $ | — | $ | — | ||||||||
| Foreign currency forwards(2) |
583 | — | 583 | — | ||||||||||||
|
|
|
|
|
|
|
|
|
|||||||||
| Total assets measured at fair value |
$ | 3,549 | $ | 2,966 | $ | 583 | $ | — | ||||||||
|
|
|
|
|
|
|
|
|
|||||||||
| Liabilities |
||||||||||||||||
| Convertible preferred stock warrant liabilities |
$ | 908 | $ | — | $ | — | $ | 908 | ||||||||
| Foreign currency forwards(3) |
— | — | — | — | ||||||||||||
|
|
|
|
|
|
|
|
|
|||||||||
| Total liabilities measured at fair value |
$ | 908 | $ | — | $ | — | $ | 908 | ||||||||
|
|
|
|
|
|
|
|
|
|||||||||
| (1) | Included in cash and cash equivalents in the consolidated balance sheets. The carrying value of money market funds approximates fair value because of their short maturities. |
| (2) | Included in prepaid and other current assets in the consolidated balance sheets. |
| (3) | Included in accrued liabilities in the consolidated balance sheets. |
There were no transfers of financial instruments, which are measured at fair value, between Level I, Level II, and Level III during the years ended December 31, 2012 and 2013, and the six months ended June 30, 2013 and 2014.
Level II assets and liabilities consist of unrealized gain or loss on forward currency contracts, which are measured using the difference between the market quotes of trading currencies adjusted for forward points and the executed contract rate. For further details on the Company’s derivative financial instruments, refer to Note 3.
Level III liabilities consist of convertible preferred stock warrant liabilities, which are measured using the Black Scholes option-pricing model. Inputs used to determine their estimated fair value include the estimated fair value of the underlying stock at the measurement date, the remaining contractual term of the warrants, risk-free interest rates, expected dividends, and the expected volatility of the underlying stock. For further details on the convertible preferred stock warrant liabilities, refer to Note 10.
The following table sets forth a summary of the changes in the fair value of Level III financial liabilities (in thousands):
| Year Ended December 31, | Six Months Ended June 30, |
|||||||||||||||||||
| 2011 | 2012 | 2013 | 2013 | 2014 | ||||||||||||||||
| (unaudited) | ||||||||||||||||||||
| Fair value—beginning of year |
$ | 608 | $ | 554 | $ | 505 | $ | 505 | $ | 760 | ||||||||||
| Exercise of convertible preferred stock warrants |
(61 | ) | (41 | ) | (13 | ) | (13 | ) | — | |||||||||||
| Change in fair value of Level III liabilities recorded in other income (expense), net |
7 | (8 | ) | 268 | 33 | 148 | ||||||||||||||
|
|
|
|
|
|
|
|
|
|
|
|||||||||||
| Fair value—end of year |
$ | 554 | $ | 505 | $ | 760 | $ | 525 | $ | 908 | ||||||||||
|
|
|
|
|
|
|
|
|
|
|
|||||||||||
F-21
Table of Contents
5. Balance Sheet Components
Allowance for Doubtful Accounts
Activity related to the allowance for doubtful accounts consisted of the following (in thousands):
| Year Ended December 31, | Six Months Ended June 30, 2014 |
|||||||||||||||
| 2011 | 2012 | 2013 | ||||||||||||||
| (unaudited) | ||||||||||||||||
| Balance, beginning of year |
$ | 108 | $ | 37 | $ | 9 | $ | 20 | ||||||||
| Additions to the allowance |
384 | 17 | 22 | 123 | ||||||||||||
| Write-offs of bad debt |
(169 | ) | (30 | ) | (11 | ) | (20 | ) | ||||||||
| Recovery of previously reserved items |
(286 | ) | (15 | ) | — | (17 | ) | |||||||||
|
|
|
|
|
|
|
|
|
|||||||||
| Balance, end of year |
$ | 37 | $ | 9 | $ | 20 | $ | 106 | ||||||||
|
|
|
|
|
|
|
|
|
|||||||||
Prepaid Expenses and Other Current Assets
Prepaid expenses and other current assets consist of the following (in thousands):
| December 31, | June 30, 2014 |
|||||||||||
| 2012 | 2013 | |||||||||||
| (unaudited) | ||||||||||||
| Prepaid expenses |
$ | 972 | $ | 1,607 | $ | 1,682 | ||||||
| Refundable tax |
1,256 | 510 | 456 | |||||||||
| Deferred commissions |
— | 593 | 712 | |||||||||
| Unrealized gain on foreign currency forward contracts |
— | 1 | 583 | |||||||||
| Other current assets |
802 | 818 | 1,314 | |||||||||
|
|
|
|
|
|
|
|||||||
| Prepaid expenses and other current assets |
$ | 3,030 | $ | 3,529 | $ | 4,747 | ||||||
|
|
|
|
|
|
|
|||||||
Property and Equipment, Net
Property and equipment, net consist of the following (in thousands):
| December 31, | June 30, 2014 |
|||||||||||
| 2012 | 2013 | |||||||||||
| (unaudited) | ||||||||||||
| Computer equipment |
$ | 16,198 | $ | 20,217 | $ | 24,512 | ||||||
| Furniture, fixtures, and equipment |
722 | 702 | 724 | |||||||||
| Leasehold improvements |
1,419 | 1,760 | 1,871 | |||||||||
|
|
|
|
|
|
|
|||||||
| Total property and equipment(1) |
18,339 | 22,679 | 27,107 | |||||||||
| Less accumulated depreciation and amortization(2) |
(14,004 | ) | (16,382 | ) | (18,049 | ) | ||||||
|
|
|
|
|
|
|
|||||||
| Property and equipment, net |
$ | 4,335 | $ | 6,297 | $ | 9,058 | ||||||
|
|
|
|
|
|
|
|||||||
| (1) | Includes assets under capital lease of $1.9 million, $3.6 million and $5.4 million as of December 31, 2012 and 2013, and June 30, 2014, respectively. |
| (2) | Includes accumulated amortization of $1.8 million, $1.9 million and $2.2 million relating to assets under capital lease as of December 31, 2012 and 2013, and June 30, 2014, respectively. |
Depreciation and amortization expense during the years ended December 31, 2011, 2012, and 2013, and the six months ended June 30, 2013 and 2014, was $2.5 million, $2.4 million, $2.7 million, $1.3 million and $1.6 million respectively. Included in these amounts were depreciation expenses for assets acquired under capital leases in the amount of $0.3 million, $0.2 million, $0.1 million $0.1 million
F-22
Table of Contents
and $0.3 million for the years ended December 31, 2011, 2012 and 2013, and the six months ended June 30, 2013 and 2014, respectively.
Other Assets
Other assets consist of the following (in thousands):
| December 31, | ||||||||||||
| 2012 | 2013 | June 30, 2014 | ||||||||||
| (unaudited) | ||||||||||||
| Deferred offering costs |
$ | — | $ | — | $ | 2,665 | ||||||
| Deferred costs and commissions |
998 | 365 | 713 | |||||||||
| Facility deposits for operating leases |
751 | 683 | 725 | |||||||||
| Others |
137 | 64 | 50 | |||||||||
|
|
|
|
|
|
|
|||||||
| Other assets |
$ | 1,886 | $ | 1,112 | $ | 4,153 | ||||||
|
|
|
|
|
|
|
|||||||
Accumulated Other Comprehensive Loss
The components of accumulated other comprehensive loss, net of tax, are as follows (in thousands):
| December 31, | ||||||||||||
| 2012 | 2013 | June 30, 2014 | ||||||||||
| (unaudited) | ||||||||||||
| Foreign currency translation adjustments |
$ | 1,195 | $ | 1,462 | $ | 1,312 | ||||||
| Net unrealized (gain) loss on foreign currency contracts designated as cash flow hedges |
(232 | ) | 268 | (135 | ) | |||||||
|
|
|
|
|
|
|
|||||||
| Total accumulated other comprehensive loss |
$ | 963 | $ | 1,730 | $ | 1,177 | ||||||
|
|
|
|
|
|
|
|||||||
6. Other Income (Expense), Net
Other income (expense), net consists of the following (in thousands):
| Year Ended December 31, | Six Months Ended June 30, |
|||||||||||||||||||
| 2011 | 2012 | 2013 | 2013 | 2014 | ||||||||||||||||
| (unaudited) | ||||||||||||||||||||
| Interest expense |
$ | (708 | ) | $ | (576 | ) | $ | (595 | ) | $ | (300 | ) | $ | (270 | ) | |||||
| Foreign exchange gain (loss) |
756 | 116 | 553 | 339 | (131 | ) | ||||||||||||||
| Gain (loss) on foreign currency forward contracts |
(968 | ) | 249 | (186 | ) | (126 | ) | 612 | ||||||||||||
| Convertible preferred stock warrants remeasurement |
(7 | ) | 8 | (268 | ) | (33 | ) | (148 | ) | |||||||||||
| Gain on proceeds from insurance settlement |
— | 450 | 141 | 141 | — | |||||||||||||||
| Other non-operating income (expense), net |
10 | (17 | ) | 37 | 19 | 24 | ||||||||||||||
|
|
|
|
|
|
|
|
|
|
|
|||||||||||
| Total other income (expense), net |
$ | (917 | ) | $ | 230 | $ | (318 | ) | $ | 40 | $ | 87 | ||||||||
|
|
|
|
|
|
|
|
|
|
|
|||||||||||
7. Commitments and Contingencies
Operating Leases: The Company has several operating leases for its office facilities with various expiration dates through May 2017. Rental expenses from these leases are recognized on a straight-line basis through the end of the lease. Under the terms of certain leases, the Company is responsible for certain taxes, insurance, maintenance and management expenses.
F-23
Table of Contents
Future rental payments under noncancelable operating leases with initial terms in excess of one year, as of December 31, 2013, are as follows (in thousands):
| Year ending December 31: |
||||
| 2014 |
$ | 1,909 | ||
| 2015 |
1,018 | |||
| 2016 |
749 | |||
| 2017 |
229 | |||
|
|
|
|||
| Total minimum payments |
$ | 3,905 | ||
|
|
|
Rent expense during the years ended December 31, 2011, 2012, and 2013, and the six months ended June 30, 2013 and 2014, was $2.1 million, $1.8 million, and $2.0 million, $1.0 million and $1.0 million, respectively. As of December 31, 2012, the short-term deferred rent liability and long-term liability was $0.2 million and $0.3 million, respectively. As of December 31, 2013, the short-term deferred rent liability and long-term liability was $0.2 million and $0.1 million, respectively. As of June 30, 2014, the short term deferred rent liability and long-term liability was $0.2 million and $38,000, respectively.
Capital Leases: The Company acquired certain software licenses and server and network equipment classified as capital leases. The original term of the capital leases unpaid as of December 31, 2013 ranges from three to four years. The portion of the future payments designated as principal repayment was classified as a capital lease obligation on the consolidated balance sheets. Future payments under the capital leases, as of December 31, 2013, are as follows (in thousands):
| Year ending December 31: |
||||
| 2014 |
$ | 574 | ||
| 2015 |
515 | |||
| 2016 |
289 | |||
|
|
|
|||
| Total capital lease obligations |
$ | 1,378 | ||
|
|
|
Interest expense recognized in years ended December 31, 2011, 2012 and 2013, and the six months ended June 30, 2013 and 2014, is immaterial in relation to these capital lease arrangements.
Other Commitments: As of December 31, 2013, the Company has several other commitments for telecommunication and data center services and support and maintenance with various expiration dates through the end of 2016 as follows (in thousands):
| Year ending December 31: |
||||
| 2014 |
$ | 1,858 | ||
| 2015 |
850 | |||
| 2016 |
362 | |||
|
|
|
|||
| Total minimum payments |
$ | 3,070 | ||
|
|
|
Indemnification
Under the indemnification provisions of its standard sales contracts, the Company agrees to defend its customers against third-party claims asserting infringement of certain intellectual property rights, which may include patents, copyrights, trademarks, or trade secrets, and to indemnify its customers for certain losses resulting from such claims. In addition, the Company also agrees to indemnify its customers against losses, expenses, and liabilities from damages that may be awarded
F-24
Table of Contents
against them if its applications are found to result in a security breach in certain circumstances. The exposure to the Company under these indemnification provisions could potentially expose it to losses in excess of the amount received under the agreement. It is not possible to determine the maximum potential amount under these indemnification obligations due to the limited history of prior indemnification claims and the unique facts and circumstances involved in each particular agreement. To date, there have been no material claims under such indemnification provisions, and no liability related to these indemnification agreements has been recorded as of December 31, 2012 and 2013, and June 30, 2014.
Legal Matters
In the ordinary course of business, the Company may be involved in lawsuits, claims, investigations, and proceedings consisting of intellectual property, commercial, employment, and other matters. Legal fees and other costs associated with such actions are expensed as incurred. The Company will record a provision for these claims when it is both probable that a liability has been incurred and the amount of the loss, or a range of the potential loss, can be reasonably estimated. These provisions are reviewed regularly and adjusted to reflect the impacts of negotiations, settlements, rulings, advice of legal counsel, and other information or events pertaining to a particular case. Litigation accruals are recorded when and if it is determined that a loss is both probable and reasonably estimable. Material loss contingencies that are reasonably possible of occurrence, if any, are subject to disclosures. The Company believes that liabilities associated with any claims, while possible, are not probable, and therefore has not recorded any accrual for any claims as of December 31, 2013 and June 30, 2014. Further, any possible range of loss cannot be reasonably estimated at this time.
8. Bank Borrowings
Bank borrowings consist of the following (in thousands):
| December 31, | June 30, 2014 | |||||||||||
| 2012 | 2013 | |||||||||||
| (unaudited) | ||||||||||||
| Bank borrowings: |
||||||||||||
| Revolving line of credit |
$ | 4,100 | $ | 1,600 | $ | 5,200 | ||||||
| Equipment financing facility |
1,193 | 145 | — | |||||||||
| Term loans |
2,604 | 4,640 | 3,905 | |||||||||
|
|
|
|
|
|
|
|||||||
| Total |
7,897 | 6,385 | 9,105 | |||||||||
| Less: current portion |
6,111 | 3,471 | 7,210 | |||||||||
|
|
|
|
|
|
|
|||||||
| Bank borrowings, net of current portion |
$ | 1,786 | $ | 2,914 | $ | 1,895 | ||||||
|
|
|
|
|
|
|
|||||||
Future principal payments under the bank borrowings, as of December 31, 2013, are as follows (in thousands):
| Year ending December 31: |
||||
| 2014 |
$ | 3,471 | ||
| 2015 |
1,608 | |||
| 2016 |
1,038 | |||
| 2017 |
268 | |||
|
|
|
|||
| Total |
$ | 6,385 | ||
|
|
|
F-25
Table of Contents
In 2005, the Company entered into a loan and security agreement, as amended, with a lender. The agreement, as amended, provides for borrowings up to $15.0 million in revolving loans as of December 31, 2013 and June 30, 2014, subject to a borrowing base of trailing three months subscription and support revenue. As of December 31, 2013, $1.6 million was outstanding on the revolving loans and up to $13.4 million was available for drawdown, subject to the borrowing base limitation. As of June 30, 2014, $5.2 million was outstanding on the revolving loans and up to $9.8 million was available for drawdown, subject to the borrowing base limitation.
Borrowings under the revolving line of credit bear interest at the prime rate plus 1.25% per annum (prime rate was 3.25% per annum as of December 31, 2012 and 2013, and June 30, 2014). The drawdown on the revolving line of credit can be made until March 2015 and must be repaid on or before March 2015.
The agreement also provided an equipment financing facility for the purchase of equipment through March 31, 2011, with a repayment period of 36 months from the date of advance. The equipment financing facility is nonrevolving, and repaid equipment advances may not be reborrowed. As of December 31, 2012 and 2013, the interest rate for borrowings under the facility was 5.5% per annum. As of December 31, 2013 and June 30, 2014, $0.1 million and $0, respectively, was outstanding, and no amount remains available to be borrowed.
In July 2012, the Company entered into an amendment to its credit facility with the same lender to borrow $3.0 million term loans with a repayment period of 36 months including interest and principal. This loan bears interest at a fixed rate of 5.5% per annum. In August 2013, the Company entered into another amendment to its credit facility with the same lender to borrow an additional $3.0 million in term loans with a repayment period of 42 months including interest only payments for the first six months and equal monthly payments including principal and interest for the next 36 months. This loan bears interest at a fixed rate of 5.0% per annum. As of December 31, 2013 and June 30, 2014, $4.6 million and $3.9 million, respectively, was outstanding on the term loans.
These borrowings are secured by all of the Company’s assets, other than intellectual property, and the Company is required to comply with certain financial and reporting covenants. Certain events may result in the accelerated maturity of the borrowings, including a default in repayment of any obligations, a merger or consolidation that results in decreasing net worth by more than 25%, sale of all or substantially all of the Company’s property, a breach of financial or reporting covenants, material adverse change in business, material change in management and change in location of collateral without prior written consent of the lender, or insolvency. Upon occurrence of one of these events, the principal of and accrued interest on these borrowings may become immediately due and payable. As of December 31, 2013 and June 30, 2014, the Company was in compliance with its financial and reporting loan covenants.
9. Net Loss per Share
The Company computes net loss per share of common stock in conformity with the two-class method required for participating securities. The Company considers all series of the Company’s convertible preferred stock to be participating securities as the holders of the preferred stock are entitled to receive a noncumulative dividend on a pari passu basis in the event that a dividend is paid on common stock. The holders of all series of convertible preferred stock do not have a contractual obligation to share in the losses of the Company. As such, the Company’s net losses for the years ended December 31, 2011, 2012 and 2013, and the six months ended June 30, 2013 and 2014, were not allocated to these participating securities.
F-26
Table of Contents
Basic net loss per share is computed by dividing total net loss attributable to common stockholders by the weighted-average common shares outstanding. The weighted-average common shares outstanding is adjusted for shares subject to repurchase. Diluted net loss per share is computed by dividing the net loss attributable to common stockholders by the weighted-average number of common shares outstanding including potential dilutive common stock instruments. In the years ended December 31, 2011, 2012 and 2013, and the six months ended June 30, 2013 and 2014, the Company’s potential common stock instruments such as stock options, RSUs, shares of preferred stock and the preferred stock warrants were not included in the computation of diluted net loss per share as the effect of including these shares in the calculation would have been anti-dilutive.
Basic loss per share from continuing operations is computed using the same two-class method as described above and is computed by dividing loss from continuing operations attributable to common stockholders by the weighted-average common shares outstanding. In the years ended December 31, 2011, 2012 and 2013, and the six months ended June 30, 2013 and 2014, the Company’s potential common stock instruments such as stock options, RSUs, shares of convertible preferred stock and the convertible preferred stock warrants were not included in the computation of diluted loss from continuing operations per share as the effect of including these shares in the calculation would have been anti-dilutive.
The following table presents the calculation of basic and diluted net loss per share for periods presented (in thousands, except per share amounts).
| Year Ended December 31, | Six Months Ended June 30, |
|||||||||||||||||||
| 2011 | 2012 | 2013 | 2013 | 2014 | ||||||||||||||||
| (unaudited) | ||||||||||||||||||||
| Loss from continuing operations attributable to common stockholders |
$ | (9,086 | ) | $ | (6,521 | ) | $ | (1,181 | ) | $ | (2,632 | ) | $ | (949 | ) | |||||
|
|
|
|
|
|
|
|
|
|
|
|||||||||||
| Net loss attributable to common stockholders |
$ | (2,087 | ) | $ | (6,521 | ) | $ | (1,181 | ) | $ | (2,632 | ) | $ | (949 | ) | |||||
|
|
|
|
|
|
|
|
|
|
|
|||||||||||
| Basic shares: |
||||||||||||||||||||
| Weighted-average common shares outstanding |
67,058 | 74,489 | 72,631 | 72,173 | 75,175 | |||||||||||||||
| Less: Weighted-average shares subject to repurchase |
(8,182 | ) | (8,000 | ) | — | — | — | |||||||||||||
|
|
|
|
|
|
|
|
|
|
|
|||||||||||
| Weighted-average shares used to compute basic and diluted net loss per share |
58,876 | 66,489 | 72,631 | 72,173 | 75,175 | |||||||||||||||
|
|
|
|
|
|
|
|
|
|
|
|||||||||||
| Loss per share from continuing operations attributable to common stockholders |
$ | (0.15 | ) | $ | (0.10 | ) | $ | (0.02 | ) | $ | (0.04 | ) | $ | (0.01 | ) | |||||
|
|
|
|
|
|
|
|
|
|
|
|||||||||||
| Net loss per share attributable to common stockholders |
$ | (0.04 | ) | $ | (0.10 | ) | $ | (0.02 | ) | $ | (0.04 | ) | $ | (0.01 | ) | |||||
|
|
|
|
|
|
|
|
|
|
|
|||||||||||
F-27
Table of Contents
The following potential common shares were excluded from the calculation of diluted loss per share from continuing operations and diluted net loss per share attributable to common stockholders because their effect would have been anti-dilutive for the periods presented (in thousands):
| Year Ended December 31, | Six Months Ended June 30, |
|||||||||||||||||||
| 2011 | 2012 | 2013 | 2013 | 2014 | ||||||||||||||||
| (unaudited) | ||||||||||||||||||||
| Convertible preferred stock |
136,387 | 144,437 | 144,452 | 144,452 | 144,452 | |||||||||||||||
| Stock options |
47,388 | 40,329 | 46,616 | 46,375 | 51,971 | |||||||||||||||
| RSUs |
— | — | 2,245 | 2,150 | 6,194 | |||||||||||||||
| Shares subject to repurchase |
8,182 | 8,000 | — | — | — | |||||||||||||||
| Convertible preferred stock warrants |
1,427 | 1,196 | 1,135 | 1,135 | 1,135 | |||||||||||||||
|
|
|
|
|
|
|
|
|
|
|
|||||||||||
| 193,384 | 193,962 | 194,448 | 194,112 | 203,752 | ||||||||||||||||
|
|
|
|
|
|
|
|
|
|
|
|||||||||||
Unaudited Pro Forma Net Loss per Share
Pro forma basic and diluted net loss per share were computed to give effect to the automatic conversion of convertible preferred stock using the if converted method, the reclassification of preferred stock warrant liabilities to additional paid in capital as though the conversion had occurred as of the beginning of the period or the original date of issuance, if later, and the repayment of the outstanding balance under the credit facility using proceeds from the Company’s IPO.
F-28
Table of Contents
The pro forma share amounts give effect to the Company’s RSUs that have satisfied the service condition as of December 31, 2013 and June 30, 2014. These RSUs will vest subject to performance condition as further described in Note 1. Stock-based compensation expense associated with the RSUs is excluded from this pro forma presentation as well as consolidated statement of operations for the year ended December 31, 2013 and the six months ended June 30, 2014. If an IPO was completed as of the beginning of the period, the Company would have recorded $1.8 million and $2.5 million of stock-based compensation expense related to these RSUs, net of estimated forfeitures during the year ended December 31, 2013 and the six months ended June 30, 2014, respectively. In addition, the pro forma calculation assumes the sale by the Company of shares of its common stock in this offering, at the assumed initial public offering price of $ per share, which is the midpoint of the estimated offering price range, the proceeds from which will be used to repay the outstanding balance of $9.1 million, as of June 30, 2014, under our credit facility. Interest expense associated with the credit facility of $0.5 million and $0.2 million during the year ended December 31, 2013 and the six months ended June 30, 2014, respectively, is excluded from this pro forma calculation. The following table is in thousands except per share amount:
| Year Ended December 31, 2013 |
Six Months Ended June 30, 2014 |
|||||||
| Net loss |
$ | (1,181 | ) | $ | (949 | ) | ||
| Pro forma adjustment to reflect change in fair value of preferred stock warrant liabilities |
268 | 148 | ||||||
| Pro forma adjustment to add the interest expense related to the credit facility |
460 | 185 | ||||||
|
|
|
|
|
|||||
| Pro forma net loss |
$ | (453 | ) | $ | (616 | ) | ||
|
|
|
|
|
|||||
| Basic shares: |
||||||||
| Weighted-average shares used to compute basic net loss per share |
72,631 | 75,175 | ||||||
| Pro forma adjustment to reflect assumed conversion of preferred stock to occur upon completion of the Company’s IPO |
144,447 | 144,452 | ||||||
| Pro forma adjustment to reflect assumed vesting of RSUs |
594 | — | ||||||
| Pro forma adjustment to reflect shares issued to repay the credit facility |
||||||||
|
|
|
|
|
|||||
| Weighted-average shares used to compute basic and diluted pro forma net loss per share |
||||||||
|
|
|
|
|
|||||
| Pro forma net loss per share attributable to common stockholders: |
||||||||
| Basic and diluted |
$ | $ | ||||||
|
|
|
|
|
|||||
The following potential common shares were excluded from the calculation of pro forma diluted net loss per share because their effect would have been anti-dilutive for the periods presented (in thousands):
| Year Ended December 31, 2013 |
Six Months Ended June 30, 2014 |
|||||||
| Stock options |
46,616 | 51,971 | ||||||
| Convertible preferred stock warrants |
1,135 | 1,135 | ||||||
|
|
|
|
|
|||||
| 47,751 | 53,106 | |||||||
|
|
|
|
|
|||||
F-29
Table of Contents
10. Convertible Preferred Stock Warrant Liabilities
The Company issued 1,196,152 warrants to purchase shares of convertible preferred stock at various times between the years ended December 31, 2006 and 2010, in connection with various financing arrangements. The convertible preferred stock warrants are exercisable immediately. As of December 31, 2012 and 2013, and June 30, 2014, the following warrants were issued and outstanding (fair value in thousands):
| Number of Warrants Issued and Outstanding as of |
Exercise | Fair Value as of | ||||||||||||||||||||||||||||||
| Date Issued |
December 31, | June 30, 2014 |
Class |
Price per Share |
Expiration Date |
December 31, | June 30, 2014 |
|||||||||||||||||||||||||
| 2012 | 2013 | 2012 | 2013 | |||||||||||||||||||||||||||||
| (unaudited) | (unaudited) | |||||||||||||||||||||||||||||||
| April 2006 |
61,538 | — | — | Preferred Series AA | $ | 0.65 | Earlier of 2013 or liquidation event | $ | 15 | $ | — | $ | — | |||||||||||||||||||
| December 2007 |
230,769 | 230,769 | 230,769 | Preferred Series BB | $ | 0.65 | Earlier of 2014 or liquidation event | 73 | 129 | 164 | ||||||||||||||||||||||
| November 2008 |
538,461 | 538,461 | 538,461 | Preferred Series BB | $ | 0.65 | Earlier of 2018 or liquidation event | 244 | 371 | 437 | ||||||||||||||||||||||
| March 2009 |
215,384 | 215,384 | 215,384 | Preferred Series BB | $ | 0.65 | Earlier of 2019 or liquidation event | 100 | 151 | 178 | ||||||||||||||||||||||
| March 2010 |
150,000 | 150,000 | 150,000 | Preferred Series BB | $ | 0.65 | Earlier of 2020 or liquidation event | 73 | 109 | 129 | ||||||||||||||||||||||
|
|
|
|
|
|
|
|
|
|
|
|
|
|||||||||||||||||||||
| 1,196,152 | 1,134,614 | 1,134,614 | $ | 505 | $ | 760 | $ | 908 | ||||||||||||||||||||||||
|
|
|
|
|
|
|
|
|
|
|
|
|
|||||||||||||||||||||
During the years ended December 31, 2012 and 2013, there was a cashless exercise of 230,769 and 61,538 warrants, respectively, and 50,046 and 15,242 shares of Series AA convertible preferred stock, respectively, were issued to the warrant holders.
The Company utilized the Black-Scholes option pricing model to determine the fair value of the outstanding convertible preferred stock warrants. Estimates of the volatility for the option pricing model were based on the volatility of common stock of a group of comparable, publicly-traded companies. Estimates of expected term were based on the remaining contractual period of the warrant. The risk-free interest rate was based on the U.S. Treasury yield for a term consistent with the estimated expected term.
The key inputs used in convertible preferred stock warrant valuation were as follows:
| December 31, | June 30, | |||||||||||||||||||
| 2011 | 2012 | 2013 | 2013 | 2014 | ||||||||||||||||
| (unaudited) | ||||||||||||||||||||
| Dividend rate |
— | % | — | % | — | % | — | % | — | % | ||||||||||
| Risk-free interest rate |
1.0 | % | 0.8 | % | 1.5 | % | 1.3 | % | 1.2 | % | ||||||||||
| Remaining contractual term (in years) |
5.2 | 5.1 | 4.3 | 4.8 | 3.8 | |||||||||||||||
| Expected volatility |
50 | % | 50 | % | 40 | % | 50 | % | 40 | % | ||||||||||
F-30
Table of Contents
11. Convertible Preferred Stock
During the year ended December 31, 2012, the Company issued and sold 8,000,000 shares of Series DD convertible preferred stock (Series DD) at $1.25 per share for aggregate gross cash proceeds of $9.5 million and conversion of a portion of the Venture Debt Facility of $0.5 million to Series DD. Convertible preferred stock comprised the following (in thousands):
| December 31, 2012 | ||||||||||||||||
| Shares Authorized |
Shares Issued and Outstanding |
Net Proceeds |
Liquidation Preference |
|||||||||||||
| Series AA |
74,369 | 73,822 | $ | 47,223 | $ | 47,984 | ||||||||||
| Series BB |
56,288 | 54,615 | 35,149 | 35,500 | ||||||||||||
| Series CC |
8,000 | 8,000 | 9,937 | 10,000 | ||||||||||||
| Series DD |
8,000 | 8,000 | 9,902 | 10,000 | ||||||||||||
|
|
|
|
|
|
|
|
|
|||||||||
| Total |
146,657 | 144,437 | $ | 102,211 | $ | 103,484 | ||||||||||
|
|
|
|
|
|
|
|
|
|||||||||
| December 31, 2013 | ||||||||||||||||
| Shares Authorized |
Shares Issued and Outstanding |
Net Proceeds |
Liquidation Preference |
|||||||||||||
| Series AA |
74,369 | 73,837 | $ | 47,236 | $ | 47,994 | ||||||||||
| Series BB |
56,288 | 54,615 | 35,149 | 35,500 | ||||||||||||
| Series CC |
8,000 | 8,000 | 9,937 | 10,000 | ||||||||||||
| Series DD |
8,000 | 8,000 | 9,902 | 10,000 | ||||||||||||
|
|
|
|
|
|
|
|
|
|||||||||
| Total |
146,657 | 144,452 | $ | 102,224 | $ | 103,494 | ||||||||||
|
|
|
|
|
|
|
|
|
|||||||||
| June 30, 2014 | ||||||||||||||||
| Shares Authorized |
Shares Issued and Outstanding |
Net Proceeds |
Liquidation Preference |
|||||||||||||
| (unaudited) | ||||||||||||||||
| Series AA |
74,369 | 73,837 | $ | 47,236 | $ | 47,994 | ||||||||||
| Series BB |
56,288 | 54,615 | 35,149 | 35,500 | ||||||||||||
| Series CC |
8,000 | 8,000 | 9,937 | 10,000 | ||||||||||||
| Series DD |
8,000 | 8,000 | 9,902 | 10,000 | ||||||||||||
|
|
|
|
|
|
|
|
|
|||||||||
| Total |
146,657 | 144,452 | $ | 102,224 | $ | 103,494 | ||||||||||
|
|
|
|
|
|
|
|
|
|||||||||
Significant terms of the convertible preferred stock are as follows:
Liquidation Preference
In the event of a liquidating event, each holder of Series DD, Series CC, and Series BB is entitled to receive, prior and in preference to any distribution of any of the assets or surplus funds to the holders of the Series AA and the common stock, a liquidation preference of $1.25 for each share of Series DD and Series CC, and $0.65 for Series BB, plus an amount equal to all declared but unpaid dividends on such shares. After payment in full to the holders of Series DD, Series CC, and Series BB, each holder of Series AA is entitled to receive, prior and in preference to any distribution of any of the assets or surplus funds to the holders of the common stock, a liquidation preference of $0.65 for each share of Series AA, plus an amount equal to all declared but unpaid dividends on such shares. After payment has been made to the holders of the Series AA, the remaining assets available for distribution
F-31
Table of Contents
will be distributed ratably among the common stockholders. A liquidation or winding up of Yodlee, a greater than 50% change in control, or a sale of substantially all of its assets would constitute a liquidating event, provided that the holders of at least 66 2⁄3% of the convertible preferred stock may elect for a change of control transaction not to be treated as a liquidating event.
These liquidation features cause the convertible preferred stock to be classified as mezzanine equity rather than as a component of stockholders’ equity (deficit).
Conversion Rights
Each share of convertible preferred stock is, at the option of the holder, convertible into such number of fully paid and non-assessable shares of common stock as is determined by dividing $0.65, $0.65, $1.25, and $1.25 for Series AA, Series BB, Series CC, and Series DD, respectively, by the conversion price per share in effect on the date the certificate is surrendered for conversion. The conversion price is equal to the original issue price, which is subject to adjustment for certain dilutive issuances of stock, combinations, stock splits, and stock dividends. Each of the Series AA, Series BB, Series CC, and Series DD currently converts on a one for one basis.
Conversion is automatic upon the earlier of either (i) the date of the closing of a firm commitment underwritten public offering pursuant to an effective registration statement covering the offer and sale of its common stock in which the public offering price per share is least $1.93 per share (as adjusted for stock splits, stock dividends or distributions, recapitalizations, and similar events) and the net proceeds to the Company is at least $30 million or (ii) upon the written consent of the holders of at least a majority of the then-outstanding shares of convertible preferred stock.
Dividend Rights
Dividends or other distributions shall first be paid to holders of convertible preferred stock in preference to common stockholders. Convertible preferred stock shall be entitled to receive dividends only when and as declared by the Board of Directors on a pro-rata, pari passu basis.
Voting Rights
Holders of each share of convertible preferred stock are entitled to one vote for each share of common stock into which such share is convertible.
The holders of Series AA are entitled to elect three directors as long as 10% of the shares of Series AA originally issued remain outstanding. The holders of Series BB are entitled to elect one director as long as 10% of the shares of Series BB originally issued remain outstanding. The holders of common stock are entitled to elect two directors. The holders of preferred stock and common stock, voting together as a single class and on an as-converted to common stock basis, by the affirmative vote of at least 66 2/3% of the then-outstanding shares of preferred stock and common stock, are entitled to elect two directors, one of whom must not be employed by, or an officer, director or affiliate of, the Company or any shareholder. The holders of convertible preferred stock are entitled to have full voting rights and powers equal to the voting rights and powers of the holders of common stock and are entitled to vote, together with the holders of common stock, with respect to any questions upon which holders of common stock have the right to vote.
Redemption Rights
None of the Series AA, BB, CC, or DD is redeemable.
F-32
Table of Contents
12. Equity Incentive Plans
As of December 31, 2013 and June 30, 2014, the equity incentive plans consisted of the 1999 Stock Plan (the 1999 Plan), 2001 Stock Plan (the 2001 Plan) and 2009 Equity Incentive Plan (the 2009 Plan). The 1999 Plan expired during the year ended December 31, 2009, and the 2001 Plan expired during the year ended December 31, 2011, and further stock option grants cannot be made from these plans. Upon expiration of the 1999 Plan, the Company adopted the 2009 Plan. The remaining shares available for grant under the 1999 Plan were transferred to the 2009 Plan. Upon expiration of the 2001 Plan, remaining shares available for grant under 2001 Plan were cancelled. The 2009 Plan provides for the issuance of stock options, RSUs, stock appreciation rights and restricted stock awards.
Stock options granted under the 2009 Plan vest over the periods determined by the Board of Directors, generally four years, and expire no more than ten years after the date of grant. In the case of an incentive stock option granted to an employee, who at the time of grant, owns stock representing more than 10% of the total combined voting power of all classes of stock, the exercise price shall be no less than 110% of the fair value per share on the date of grant, and expire five years from the date of grant, and for options granted to any other employee, the per share exercise price shall be no less than 100% of the fair value per share on the date of grant. Stock options become exercisable at such times and under such conditions as determined by the board of directors.
RSUs, stock appreciation rights and restricted stock awards are granted under such conditions as determined by the board of directors.
As of December 31, 2013 and June 30, 2014, the Company was authorized to grant up to 50,249,761 and 74,958,699 shares, respectively, under equity incentive plans.
Determining the Fair Values of Common Stock and Options
The fair value of the common stock has historically been determined by the Company’s Board of Directors, in good faith, with assistance from management. Because there has been no public market for the Company’s common stock, the Board of Directors has determined fair value of its common stock at the time of the grant of the option by considering a number of objective and subjective factors, including but not limited to, (i) valuations of comparable companies, (ii) sales of convertible preferred stock or common stock to unrelated third parties, (iii) operating and financial performance, (iv) lack of liquidity of capital stock, (v) the general and industry-specific economic outlook and (vi) the likelihood of achieving a liquidity event, such as the sale of the Company or an IPO, given prevailing market conditions. The fair value of the Company’s common stock will be determined by the Board of Directors until such time as the Company’s common stock is listed on an established stock exchange or national market system.
The Company utilizes the Black-Scholes model for valuing its stock options. This model utilizes several inputs including expected term, volatility, risk free interest rate and dividend yield. The expected term of the options is determined using the “simplified” method. The Company used the “simplified method” due to the lack of sufficient historical exercise data to provide a reasonable basis upon which to otherwise estimate the expected life of the stock options. Volatility is based on an average of the historical volatilities of a group of publicly listed peers over a period equal to the expected term. The risk-free interest rate is based on the implied yield of U.S. Treasury zero coupon bonds with a term comparable to the expected option term. Since the Company currently has no history or expectation of paying dividends on its common stock, a dividend yield of zero was used. Expected forfeitures are based on the Company’s historical experience.
F-33
Table of Contents
The weighted-average grant-date fair value of options granted during the years ended December 31, 2011, 2012, and 2013, and six months ended June 30, 2013 and 2014, was $0.28, $0.34, $0.41, $0.40 and $0.50 per share, respectively. The following table presents the weighted-average assumptions used to estimate the fair value of the stock options granted in the Company’s consolidated financial statements:
| Year Ended December 31, | Six Months Ended June 30, |
|||||||||||||||||||
| 2011 | 2012 | 2013 | 2013 | 2014 | ||||||||||||||||
| (unaudited) | ||||||||||||||||||||
| Dividend rate |
— | % | — | % | — | % | — | % | — | % | ||||||||||
| Risk-free interest rate |
2.2 | % | 1.0 | % | 1.0 | % | 0.9 | % | 2.0 | % | ||||||||||
| Expected term (in years) |
6.1 | 6.0 | 6.1 | 6.1 | 6.0 | |||||||||||||||
| Expected volatility |
45 | % | 50 | % | 49 | % | 50 | % | 40 | % | ||||||||||
The following table presents the effects of stock-based compensation on the Company’s consolidated statements of operations during the periods presented (in thousands):
| Year Ended December 31, | Six Months Ended June 30, |
|||||||||||||||||||
| 2011 | 2012 | 2013 | 2013 | 2014 | ||||||||||||||||
| (unaudited) | ||||||||||||||||||||
| Cost of revenue—subscription and support |
$ | 163 | $ | 170 | $ | 201 | $ | 106 | $ | 99 | ||||||||||
| Cost of revenue—professional services and other |
112 | 119 | 107 | 55 | 64 | |||||||||||||||
| Research and development |
266 | 236 | 243 | 128 | 128 | |||||||||||||||
| Sales and marketing |
302 | 242 | 302 | 153 | 172 | |||||||||||||||
| General and administrative |
524 | 588 | 658 | 278 | 456 | |||||||||||||||
|
|
|
|
|
|
|
|
|
|
|
|||||||||||
| Total |
$ | 1,367 | $ | 1,355 | $ | 1,511 | $ | 720 | $ | 919 | ||||||||||
|
|
|
|
|
|
|
|
|
|
|
|||||||||||
No current income tax benefit has been recognized relating to stock-based compensation expense and no tax benefits realized from exercised stock options. No stock-based compensation cost was capitalized for any of the periods presented.
F-34
Table of Contents
A summary of stock option activity for the year ended December 31, 2013 and the six months ended June 30, 2014 is as follows (in thousands, except per share amounts and contractual term):
| Options Outstanding | ||||||||||||||||||||
| Shares Available for Grant |
Number of Shares |
Weighted- Average Exercise Price per Share |
Weighted- Average Remaining Contractual Term |
Aggregate Intrinsic Value(1) |
||||||||||||||||
| Balance as of December 31, 2012 |
2,692 | 40,329 | $ | 0.47 | ||||||||||||||||
| Increase in shares authorized |
10,000 | — | ||||||||||||||||||
| Options granted |
(10,590 | ) | 10,590 | 0.86 | ||||||||||||||||
| RSUs granted |
(2,245 | ) | — | |||||||||||||||||
| Options exercised |
— | (2,772 | ) | 0.52 | ||||||||||||||||
| Options forfeited |
1,531 | (1,531 | ) | 0.55 | ||||||||||||||||
|
|
|
|
|
|||||||||||||||||
| Balance as of December 31, 2013 |
1,388 | 46,616 | $ | 0.56 | 6.1 | $ | 24,412 | |||||||||||||
| Increase in share authorized (unaudited) |
27,000 | — | ||||||||||||||||||
| Options granted (unaudited) |
(8,892 | ) | 8,892 | 1.20 | ||||||||||||||||
| RSU granted (unaudited) |
(3,984 | ) | — | |||||||||||||||||
| Options exercised (unaudited) |
— | (2,291 | ) | 0.38 | ||||||||||||||||
| Options forfeited (unaudited) |
1,246 | (1,246 | ) | 0.71 | ||||||||||||||||
| RSU forfeited (unaudited) |
35 | — | ||||||||||||||||||
|
|
|
|
|
|||||||||||||||||
| Balance as of June 30, (unaudited) |
16,793 | 51,971 | $ | 0.67 | 6.5 | $ | 28,534 | |||||||||||||
|
|
|
|
|
|||||||||||||||||
| Vested and expected to vest—December 31, 2013 |
44,661 | $ | 0.54 | 6.0 | $ | 23,920 | ||||||||||||||
| Vested—December 31, 2013 |
30,652 | $ | 0.43 | 4.7 | $ | 19,825 | ||||||||||||||
| Vested and expected to vest—June 30, 2014 (unaudited) |
49,314 | $ | 0.65 | 6.3 | $ | 28,112 | ||||||||||||||
| Vested—June 30, 2014 (unaudited) |
32,014 | $ | 0.48 | 4.9 | $ | 23,547 | ||||||||||||||
| (1) | The aggregate intrinsic value is calculated as the difference between the exercise price of the underlying stock option awards and the assessed fair value of the Company’s common stock as of December 31, 2013, and June 30, 2014. |
The intrinsic value of options exercised during the years ended December 31, 2011, 2012, and 2013, and the six months ended June 30, 2013 and 2014, was $0.4 million, $5.2 million, $0.9 million, $0.4 million and $1.8 million respectively. The fair value of stock options vested during the years ended December 31, 2011, 2012, and 2013, and the six months ended June 30, 2013 and 2014, was $1.0 million, and $1.2 million, $1.6 million, $0.8 million and $1.6 million, respectively. As of December 31, 2013 and June 30, 2014, $4.8 million and $7.2 million, respectively, of total unrecognized compensation expense related to stock options was expected to be recognized over a weighted-average remaining vesting period of 2.8 years and 2.9 years, respectively.
F-35
Table of Contents
The following table summarizes the activity related to the Company’s RSUs for the year ended December 31, 2013 and six months ended June 30, 2014:
| Number of RSUs |
Weighted- Average Fair Value per Share(1) |
|||||||
| (in thousands) | ||||||||
| Balance as of December 31, 2012 |
— | — | ||||||
| RSUs granted |
2,245 | $ | 1.00 | |||||
|
|
|
|||||||
| Balance as of December 31, 2013 |
2,245 | $ | 1.00 | |||||
| Restricted stock units granted (unaudited) |
3,984 | $ | 1.21 | |||||
| Restricted stock units forfeited (unaudited) |
(35 | ) | $ | 1.20 | ||||
|
|
|
|||||||
| Balance as of June 30, 2014 (unaudited) |
6,194 | $ | 1.13 | |||||
|
|
|
|||||||
| (1) | Represents assessed fair value of RSUs |
The Company has not recognized any stock compensation expense during the years ended December 31, 2011, 2012 and 2013 and the six months ended June 30, 2013 and 2014 related to RSUs. As of December 31, 2013 and June 30, 2014, total unrecognized compensation expense, net of forfeitures, related to RSUs was $2.2 million and $7.1 million, respectively, and would be recognized over a weighted-average period of approximately 1.3 years and 1.9 years, respectively.
13. Common Stock Reserved For Future Issuance
Common stock reserved for future issuance as of December 31, 2013 and June 30, 2014, is as follows (in thousands):
| December 31, 2013 |
June 30, 2014 |
|||||||
| (unaudited) | ||||||||
| Issuances under equity incentive plan |
50,250 | 74,959 | ||||||
| Conversion of convertible preferred stock |
144,452 | 144,452 | ||||||
| Issuances upon exercise of convertible preferred stock warrants |
1,135 | 1,135 | ||||||
|
|
|
|
|
|||||
| Total |
195,837 | 220,546 | ||||||
|
|
|
|
|
|||||
14. Employee Benefit Plans
401(k) Retirement Plan. The Company has a 401(k) retirement plan that covers substantially all of its U.S. employees. The 401(k) plan provides for voluntary salary deductions of up to 100% of eligible participants’ annual compensation, subject to the maximum allowed by law. The Company does not provide matching contributions.
Non-U.S. Pension Benefits. The Company also provides a defined benefit pension plan to its employees in India. Consistent with the requirements of local law, funds are deposited for the pension plan with an insurance company and the Company accrues for the unfunded portion of the obligation, which is not significant.
15. Related-Party Transactions
The Company recorded revenue from a major financial institution, which is a significant stockholder, totaling $11.2 million, $10.6 million, $10.4 million, $5.3 million and $5.9 million, during the
F-36
Table of Contents
years ended December 31, 2011, 2012, and 2013, and the six months ended June 30, 2013 and 2014, respectively. That financial institution comprised 25%, 17% and 19% of total accounts receivable as of December 31, 2012 and 2013, and June 30, 2014, respectively.
The Company recorded revenue of $0.3 million, $0.5 million, $0.8 million, $0.3 million and $0.5 million from other related parties in years ended December 31, 2011, 2012, and 2013, and the six months ended June 30, 2013 and 2014, respectively. Total accounts receivable from other related parties as of December 31, 2012 and 2013, and June 30, 2014, was not significant.
16. Income Taxes
The components of the provision for (benefit from) income taxes from continuing operations consist of the following (in thousands):
| Year Ended December 31, | ||||||||||||
| 2011 | 2012 | 2013 | ||||||||||
| Current: |
||||||||||||
| Federal |
$ | (4,033 | ) | $ | 16 | $ | (104 | ) | ||||
| State |
(680 | ) | — | — | ||||||||
| Foreign |
891 | 1,099 | 1,529 | |||||||||
|
|
|
|
|
|
|
|||||||
| Total current |
(3,822 | ) | 1,115 | 1,425 | ||||||||
| Deferred: |
||||||||||||
| Foreign |
86 | (24 | ) | 14 | ||||||||
|
|
|
|
|
|
|
|||||||
| Total deferred |
86 | (24 | ) | 14 | ||||||||
|
|
|
|
|
|
|
|||||||
| Total provision for (benefit from) income taxes |
$ | (3,736 | ) | $ | 1,091 | $ | 1,439 | |||||
|
|
|
|
|
|
|
|||||||
During the years ended December 31, 2011, 2012, and 2013, the Company recorded income tax expense from discontinued operations of approximately $4.8 million, $0, and $0, respectively. For further details on the Company’s discontinued operations, refer to Note 17.
The Company’s geographical breakdown of its income (loss) from continuing operations before provision for (benefit from) income taxes is as follows (in thousands):
| Year Ended December 31, | ||||||||||||
| 2011 | 2012 | 2013 | ||||||||||
| Domestic |
$ | (15,026 | ) | $ | (7,237 | ) | $ | (1,688 | ) | |||
| Foreign |
2,204 | 1,807 | 1,946 | |||||||||
|
|
|
|
|
|
|
|||||||
| Income (loss) from continuing operations before provision for (benefit from) income taxes |
$ | (12,822 | ) | $ | (5,430 | ) | $ | 258 | ||||
|
|
|
|
|
|
|
|||||||
F-37
Table of Contents
Net deferred tax assets consist of the following (in thousands):
| December 31, | ||||||||
| 2012 | 2013 | |||||||
| Deferred tax assets: |
||||||||
| Net operating loss carryforward |
$ | 51,530 | $ | 52,307 | ||||
| Accruals and other |
2,318 | 1,284 | ||||||
| Deferred revenue |
2,411 | 2,412 | ||||||
| Income tax credits |
2,334 | 3,606 | ||||||
|
|
|
|
|
|||||
| Gross deferred tax asset |
58,593 | 59,609 | ||||||
| Valuation allowance |
(56,621 | ) | (58,780 | ) | ||||
|
|
|
|
|
|||||
| Net deferred tax assets |
1,972 | 829 | ||||||
| Deferred tax liabilities: |
||||||||
| Depreciation and amortization |
(1,794 | ) | (744 | ) | ||||
|
|
|
|
|
|||||
| Total deferred tax liabilities |
(1,794 | ) | (744 | ) | ||||
|
|
|
|
|
|||||
| Net deferred tax assets |
$ | 178 | $ | 85 | ||||
|
|
|
|
|
|||||
Reconciliations of the statutory federal income tax to the Company’s effective tax consist of the following (in thousands):
| Year Ended December 31, | ||||||||||||
| 2011 | 2012 | 2013 | ||||||||||
| Tax at statutory federal rate |
$ | (4,488 | ) | $ | (1,902 | ) | $ | 90 | ||||
| State tax—net of federal benefit |
(842 | ) | (460 | ) | 15 | |||||||
| Impact of foreign taxes |
238 | 432 | 628 | |||||||||
| Nondeductible stock-based compensation |
556 | 437 | 455 | |||||||||
| Nondeductible permanent items |
25 | 41 | 73 | |||||||||
| Foreign income inclusion |
— | 358 | 34 | |||||||||
| Release of uncertain tax position |
— | — | (110 | ) | ||||||||
| Warrant revaluation |
— | — | 110 | |||||||||
| Other |
179 | 50 | 7 | |||||||||
| Valuation allowance |
596 | 2,135 | 137 | |||||||||
|
|
|
|
|
|
|
|||||||
| Provision for (benefit from) income taxes |
$ | (3,736 | ) | $ | 1,091 | $ | 1,439 | |||||
|
|
|
|
|
|
|
|||||||
As of December 31, 2013, the Company had net operating loss carryforwards of approximately $134 million and $101 million to offset federal and state future taxable income, respectively. Of these amounts, $3.2 million and $3.3 million, respectively, represent federal and state tax deductions from stock based compensation, which will be recorded as an adjustment to additional paid-in capital when they reduce taxes payable. The federal and state net operating loss carryforwards will expire beginning in 2022 and 2014, respectively. In addition, the Company has federal research tax credits of $3.0 million and state research tax credits of $3.8 million. The federal research tax credits will expire beginning in 2022. The state credits may be carried forward indefinitely.
Utilization of the Company’s net operating loss carryforwards is subject to substantial annual limitations due to ownership change limitations imposed by Section 382 of the Internal Revenue Code (“IRC”) and similar state provisions. Such an annual limitation could result in the expiration of the net operating losses before utilization. The Company believes a change of control occurred, as defined by Sections 382 and 383 of the IRC, which resulted in a forfeiture of a significant portion of the Company’s net operating loss and credit carryforwards. The deferred tax assets related to these tax attributes have been reduced accordingly.
F-38
Table of Contents
The tax benefit of operating losses, temporary differences, and credit carryforwards is recorded as a deferred tax asset to the extent that management assesses that realization is “more likely than not.” Realization of the future tax benefit is dependent upon the Company’s ability to generate sufficient taxable income within the carryforward period. Because of the Company’s history of domestic losses, management believes that recognition of its federal and state deferred tax assets arising from the above mentioned tax benefit is not currently more likely than not to be realized, and accordingly, the Company’s domestic deferred tax assets have been fully offset by a valuation allowance.
The Company has not provided U.S. income tax on certain foreign earnings that are deemed to be permanently reinvested outside the U.S. As of December 31, 2012 and 2013, the amount of accumulated unremitted earnings from the Company’s foreign subsidiaries is approximately $2.4 million and $3.6 million, respectively. Determination of the amount of unrecognized deferred tax liability related to these earnings is not practicable.
A reconciliation of the beginning and ending balances of the unrecognized tax benefit during the years ended December 31, 2011, 2012 and 2013 is as follows (in thousands):
| Year Ended December 31, | ||||||||||||
| 2011 | 2012 | 2013 | ||||||||||
| Unrecognized benefit—beginning of year |
$ | 11,734 | $ | 12,616 | $ | 13,309 | ||||||
| Gross increases—current year tax positions |
840 | 623 | 1,061 | |||||||||
| Gross increases—prior year tax positions |
352 | 70 | 365 | |||||||||
| Gross decreases—current year tax positions |
(244 | ) | — | — | ||||||||
| Gross decreases—lapse of prior year statute of limitation |
— | — | (87 | ) | ||||||||
| Gross decreases—prior year tax positions settlement |
(66 | ) | — | — | ||||||||
|
|
|
|
|
|
|
|||||||
| Unrecognized benefit—end of year |
$ | 12,616 | $ | 13,309 | $ | 14,648 | ||||||
|
|
|
|
|
|
|
|||||||
The total amount of unrecognized tax benefit that would affect the Company’s effective tax rate is $1.6 million as of December 31, 2013. The Company accounts for any applicable interest and penalties on uncertain tax positions as a component of income tax expense. The amount accrued as of December 31, 2012 and 2013 for interest and penalties was $0.8 million and $1.2 million, respectively. The amount of interest and penalties that the Company recognized in the consolidated statement of operations during the years ended December 31, 2011, 2012, and 2013 was $0.2 million, $0.2 million, and $0.4 million, respectively.
The Company’s tax jurisdictions are the United States, various state jurisdictions, India and United Kingdom. The tax years 2002 through 2013 remain open and subject to examination by the appropriate governmental agencies in the U.S. due to tax attribute carryforwards and the tax years 2005 through 2013 remain open in India.
17. Discontinued Operations
The consolidated financial statements and related footnote disclosures reflect the results of the software customization and managed services component as discontinued operations, net of applicable income taxes, for all reporting periods presented.
The Company launched software customization and managed services in 2006. As part of these services, which had operations and cash flows separate from the rest of the business, the Company sold offerings to customers in the form of heavily customized enterprise solutions, which the customers took possession of and deployed, as well as fully outsourced software management services, and allowed the customers to take possession of the source code. During the year ended December 31, 2011, the Company decided to discontinue its software customization and managed services.
F-39
Table of Contents
As the software customization and managed services were abandoned and not sold or transferred to another entity, the Company ceased to have any continued involvement in this component. In addition, the Company was not required nor does it plan to provide any continuing support as it relates to the software customization and managed services component subsequent to 2011. No cash outflows or inflows were incurred in 2012 and 2013, and in the six months ended June 30, 2013 and 2014, and none are expected in the future relating to this component.
The following table summarizes results from discontinued operations for the periods indicated included in the consolidated statements of operations (in thousands, except per share amount):
| Year Ended December 31, 2011 |
||||
| Revenue (related party) |
$ | 17,855 | ||
| Cost of revenue |
5,729 | |||
| Operating expenses |
346 | |||
|
|
|
|||
| Income from discontinued operations before provision for income taxes |
11,780 | |||
| Provision for income taxes |
4,781 | |||
|
|
|
|||
| Income from discontinued operations, net of provision for income taxes |
$ | 6,999 | ||
|
|
|
|||
| Weighted average shares used to compute income per share from discontinued operations attributable to common stockholders—basic and diluted |
58,876 | |||
|
|
|
|||
| Income from discontinued operations, per share attributable to common stockholders—basic and diluted. |
$ | 0.11 | ||
|
|
|
|||
Basic income per share from discontinued operations is computed using the same two-class method as described in Note 9 and is computed by dividing income from discontinued operations attributable to common stockholders by the weighted-average common shares outstanding. Diluted income per share from discontinued operations is computed by dividing income from discontinued operations attributable to common stockholders by the weighted-average number of common shares outstanding including potential dilutive common stock instruments such as stock options. No dilutive potential common shares were included in the computation of any diluted per share amount when a loss from continuing operations was reported by the Company. Income or loss from continuing operations is the “control number” in determining whether potential common shares are dilutive or anti-dilutive.
During the years ended December 31, 2012 and 2013, and for the six months ended June 30, 2013 and 2014, there were no discontinued operations.
18. Information About Geographic Areas
Revenue by geography is based on the billing address of the customer. The following table sets forth revenue by geographic area (in thousands):
| Year Ended December 31, | Six Months Ended June 30, |
|||||||||||||||||||
| 2011 | 2012 | 2013 | 2013 | 2014 | ||||||||||||||||
| (unaudited) | ||||||||||||||||||||
| United States |
$ | 48,491 | $ | 49,909 | $ | 60,419 | $ | 27,229 | $ | 35,904 | ||||||||||
| International(1) |
5,938 | 7,885 | 9,741 | 4,627 | 5,162 | |||||||||||||||
|
|
|
|
|
|
|
|
|
|
|
|||||||||||
| Total |
$ | 54,429 | $ | 57,794 | $ | 70,160 | $ | 31,856 | $ | 41,066 | ||||||||||
|
|
|
|
|
|
|
|
|
|
|
|||||||||||
| (1) | No foreign country accounted for more than 10% of total revenue. |
F-40
Table of Contents
The following table sets forth long-lived assets by geographic area (in thousands):
| December 31, | June 30, | |||||||||||
| 2012 | 2013 | 2014 | ||||||||||
| (unaudited) | ||||||||||||
| United States |
$ | 3,942 | $ | 5,440 | $ | 6,926 | ||||||
| India |
393 | 857 | 2,132 | |||||||||
|
|
|
|
|
|
|
|||||||
| Total |
$ | 4,335 | $ | 6,297 | $ | 9,058 | ||||||
|
|
|
|
|
|
|
|||||||
19. Subsequent Events
The annual consolidated financial statements have been evaluated for subsequent events through March 21, 2014, which is the date upon which these financial statements were available to be issued. The Company is not aware of any material recognizable subsequent event during this period.
20. Subsequent Events – Unaudited
The interim consolidated financial statements as of June 30, 2014 and for the six months then ended have been evaluated for subsequent events through July 18, 2014, which is the date upon which these interim financial statements were available to be issued. The Company is not aware of any material recognizable subsequent event during this period.
F-41
Table of Contents

The Yodlee Platform Retail Banking n Small Business n Wealth Management n PFM n Money Movement n Risk Management n APIs n Data Solutions n Mobile Solutions
Table of Contents
Shares
Yodlee, Inc.
Common Stock

| Goldman, Sachs & Co. | Credit Suisse | BofA Merrill Lynch | ||
| UBS Investment Bank | ||||
| Pacific Crest Securities | ||||
Through and including , 2014 (the 25th day after the date of this prospectus), all dealers effecting transactions in these securities, whether or not participating in this offering, may be required to deliver a prospectus. This is in addition to a dealer’s obligation to deliver a prospectus when acting as an underwriter and with respect to an unsold allotment or subscription.
Table of Contents
PART II
INFORMATION NOT REQUIRED IN THE PROSPECTUS
| Item 13. | Other Expenses of Issuance and Distribution. |
Estimated costs and expenses, other than underwriting discounts and commissions, payable by us in connection with the sale of the common stock being registered under this registration statement are as follows:
| SEC registration fee |
$ | * | ||
| FINRA filing fee |
* | |||
| Exchange listing fee |
* | |||
| Printing and engraving expenses |
* | |||
| Legal fees and expenses |
* | |||
| Accounting fees and expenses |
* | |||
| Transfer agent and registrar fees and expenses |
* | |||
| Blue Sky Fees and Expenses |
* | |||
| Miscellaneous |
* | |||
| Total |
$ | * |
| * | To be filed by amendment. |
| Item 14. | Indemnification of Directors and Officers. |
On completion of this offering, our amended and restated certificate of incorporation will contain provisions that eliminate, to the maximum extent permitted by the General Corporation Law of the State of Delaware, the personal liability of our directors and executive officers for monetary damages for breach of their fiduciary duties as directors or officers. Our amended and restated certificate of incorporation and amended and restated bylaws will provide that we must indemnify our directors and executive officers and may indemnify our employees and other agents to the fullest extent permitted by the General Corporation Law of the State of Delaware.
Section 145 of the General Corporation Law of the State of Delaware provides that a corporation may indemnify any person made a party to an action by reason of the fact that he or she was a director, executive officer, employee or agent of the corporation or is or was serving at the request of a corporation against expenses (including attorneys’ fees), judgments, fines and amounts paid in settlement actually and reasonably incurred by him or her in connection with such action if he or she acted in good faith and in a manner he or she reasonably believed to be in, or not opposed to, the best interests of the corporation and, with respect to any criminal action or proceeding, had no reasonable cause to believe his or her conduct was unlawful, except that, in the case of an action by or in right of the corporation, no indemnification may generally be made in respect of any claim as to which such person is adjudged to be liable to the corporation.
We have entered into indemnification agreements with our directors and executive officers, in addition to the indemnification provided for in our amended and restated certificate of incorporation and amended and restated bylaws, and intend to enter into indemnification agreements with any new directors and executive officers in the future.
We have purchased and intend to maintain insurance on behalf of each and any person who is or was one of our directors or officers against any loss arising from any claim asserted against him or her and incurred by him or her in any such capacity, subject to certain exclusions.
II-1
Table of Contents
The Underwriting Agreement (Exhibit 1.1 hereto) provides for indemnification by the underwriters of us and our executive officers and directors for certain liabilities, including liabilities arising under the Securities Act of 1933, as amended, or the Securities Act.
Reference is made to the following documents filed as exhibits to this Registration Statement regarding relevant indemnification provisions described above and elsewhere herein:
| Exhibit Document |
Number | |||
| Form of Underwriting Agreement |
1.1 | |||
| Form of Restated Certificate of Incorporation to be effective upon the closing of this offering |
3.2 | |||
| Form of Amended and Restated Bylaws of the Registrant, to be effective upon closing of this offering |
3.4 | |||
| Ninth Amended and Restated Investors’ Rights Agreement dated as of April 27, 2012 by and among the Registrant and certain holders of the Registrant’s capital stock party thereto |
4.2 | |||
| Form of Indemnification Agreement |
10.1 | |||
See also the undertakings set out in response to Item 17 herein.
| Item 15. | Recent Sales of Unregistered Securities. |
Since January 1, 2011, we have made the following sales of unregistered securities:
| 1. | Sales of Preferred Stock |
In May and June 2012, we issued and sold an aggregate of 8,000,000 shares of our Series DD convertible preferred stock to a total of twelve investors at $1.25 per share, for aggregate gross cash proceeds of $9,518,905, and the conversion of indebtedness in the amount of $481,095 to Series DD preferred stock.
| 2. | Options and Common Stock Issuances |
Option Plan Grants and Exercises
From January 1, 2011 through June 30, 2014, we granted to our officers, directors, employees, consultants, and other service providers options to purchase an aggregate of 33,229,749 shares of common stock under our 2009 Equity Incentive Plan at exercise prices ranging from $0.58 to $1.22 per share. Of the options granted, options to purchase 1,530,430 shares of common stock were granted to five non-employee directors at exercise prices ranging from $0.58 to $1.20 per share, options to purchase 15,575,209 shares of common stock were granted to twelve executives at exercise prices ranging from $0.58 to $1.20 per share and options to purchase 16,124,110 shares of common stock were granted to 663 other employees and consultants at exercise prices ranging from $0.58 to $1.22 per share. In addition we granted 6,229,468 restricted stock units to certain of our officers, non-employee directors and employees under our 2009 Equity Incentive Plan.
From January 1, 2011 through June 30, 2014, we issued and sold to our officers, directors, employees, consultants, and other service providers an aggregate of 18,291,683 shares of common stock upon exercise of options under our 2009 Equity Incentive Plan at exercise prices ranging from $0.33 to $0.85 per share, for a weighted average exercise price of $0.37 per share. Of the options exercised, 1,176,563 shares of common stock were issued to three non-employee directors at exercise prices ranging from $0.33 to $0.85 per share, 12,748,075 shares of common stock were issued to six executives at exercise prices ranging from $0.33 to $0.69 per share, and 4,367,045 shares of common stock were issued to 72 other employees and consultants at exercise prices ranging from $0.33 to $0.85 per share.
II-2
Table of Contents
None of the foregoing transactions involved any underwriters, underwriting discounts or commissions, or any public offering.
The offers, sales and issuances of the securities described in this Item 15 were deemed to be exempt from registration under the Securities Act under either (1) Rule 701 promulgated under the Securities Act as offers and sales of securities pursuant to certain compensatory benefit plans and contracts relating to compensation in compliance with Rule 701 or (2) Section 4(a)(2) of the Securities Act as transactions by an issuer not involving any public offering. The recipients of securities in each of these transactions represented their intention to acquire the securities for investment only and not with a view to or for sale in connection with any distribution thereof and appropriate legends were affixed to the stock certificates and instruments issued in such transactions. All recipients had adequate access, through their relationships with us, to information about us.
| ITEM 16. | EXHIBITS AND FINANCIAL STATEMENT SCHEDULES. |
(a) Exhibits.
See the Exhibit Index immediately following the signature page hereto for a list of exhibits filed as part of this registration statement on Form S-1, which Exhibit Index is incorporated herein by reference.
(b) Financial Statement Schedules.
All financial statement schedules are omitted because the information called for is not required or is shown either in the consolidated financial statements or in the notes thereto.
| ITEM 17. | UNDERTAKINGS. |
The undersigned Registrant hereby undertakes to provide to the underwriters at the closing specified in the underwriting agreement certificates in such denominations and registered in such names as required by the underwriters to permit prompt delivery to each purchaser.
Insofar as indemnification for liabilities arising under the Securities Act of 1933 may be permitted to directors, officers, and controlling persons of the Registrant pursuant to the foregoing provisions, or otherwise, the Registrant has been advised that in the opinion of the Securities and Exchange Commission such indemnification is against public policy as expressed in the Act and is, therefore, unenforceable. In the event that a claim for indemnification against such liabilities (other than the payment by the Registrant of expenses incurred or paid by a director, officer, or controlling person of the Registrant in the successful defense of any action, suit, or proceeding) is asserted by such director, officer, or controlling person in connection with the securities being registered, the Registrant will, unless in the opinion of its counsel the matter has been settled by controlling precedent, submit to a court of appropriate jurisdiction the question whether such indemnification by it is against public policy as expressed in the Act and will be governed by the final adjudication of such issue.
The undersigned Registrant hereby undertakes that:
| • | For purposes of determining any liability under the Securities Act of 1933, the information omitted from the form of prospectus filed as part of this registration statement in reliance upon Rule 430A and contained in a form of prospectus filed by the Registrant pursuant to Rule 424(b)(1) or (4) or 497(h) under the Securities Act shall be deemed to be part of this registration statement as of the time it was declared effective. |
| • | For the purpose of determining any liability under the Securities Act of 1933, each post-effective amendment that contains a form of prospectus shall be deemed to be a new registration statement relating to the securities offered therein, and the offering of such securities at that time shall be deemed to be the initial bona fide offering thereof. |
II-3
Table of Contents
SIGNATURES
Pursuant to the requirements of the Securities Act of 1933, the registrant has duly caused this registration statement to be signed on its behalf by the undersigned, thereunto duly authorized, in the City of Redwood City, State of California, on the 18th day of July, 2014.
| YODLEE, INC. | ||
| By: | /s/ ANIL ARORA | |
| Name: Anil Arora | ||
| Title: President and Chief Executive Officer | ||
POWER OF ATTORNEY
Each person whose signature appears below hereby constitutes and appoints Anil Arora and Michael Armsby, jointly and severally, as such person’s true and lawful attorneys-in-fact and agents, with full power of substitution and resubstitution, and full power to act without the other, for such person and in such person’s name, place and stead and to execute in the name and on behalf of such person, individually and in each capacity stated below, and to file this Registration Statement on Form S-1 of Yodlee, Inc. and any or all amendments (including post-effective amendments) thereto, and any registration statement relating to the same offering as this Registration Statement that is to be effective upon filing pursuant to Rule 462(b) under the Securities Act and to file the same, with all exhibits thereto, and other documents in connection therewith, with the Securities and Exchange Commission, granting unto said attorneys-in-fact and agents, and each of them, full power and authority to do and perform each and every act and thing requisite or necessary to be done in and about the premises hereby ratifying and confirming all that said attorneys-in-fact and agents, or any of them or their substitute or substitutes, may lawfully do or cause to be done by virtue thereof.
Pursuant to the requirements of the Securities Act of 1933, this registration statement has been signed by the following persons in the capacities and on the dates indicated below:
| Signature |
Title |
Date | ||
| /s/ ANIL ARORA Anil Arora |
Director, President and Chief Executive Officer (Principal Executive Officer) |
July 18, 2014 | ||
| /s/ MICHAEL ARMSBY Michael Armsby |
Chief Financial Officer (Principal Accounting and Financial Officer) |
July 18, 2014 | ||
| * Gayle Crowell |
Director | July 18, 2014 | ||
| * Bruce C. Felt, Jr. |
Director | July 18, 2014 | ||
| * William Harris, Jr. |
Director | July 18, 2014 | ||
| * Patrick T. Hackett |
Director | July 18, 2014 | ||
| * Dennis B. Phelps |
Director |
July 18, 2014 | ||
| *By: | /S/ MICHAEL ARMSBY Michael Armsby Attorney-in-Fact |
|||||
II-4
Table of Contents
EXHIBIT INDEX
| Exhibit |
Exhibit Title | |
| 1.1* | Form of Underwriting Agreement | |
| 3.1** | Amended and Restated Certificate of Incorporation of the Registrant, as currently in effect | |
| 3.2** | Form of Amended and Restated Certificate of Incorporation of the Registrant, to be effective upon closing of the offering | |
| 3.3** | Bylaws of the Registrant, as currently in effect | |
| 3.4** | Form of Amended and Restated Bylaws of the Registrant, to be effective upon closing of the offering | |
| 4.1* | Specimen Common Stock Certificate of the Registrant | |
| 4.2†** | Ninth Amended and Restated Investors’ Rights Agreement dated as of April 27, 2012, by and among the Registrant and certain holders of the Registrant’s capital stock party thereto | |
| 5.1* | Opinion of Wilson Sonsini Goodrich & Rosati, Professional Corporation | |
| 10.1 | Form of Indemnification Agreement between the Registrant and each of its officers and directors | |
| 10.2** | 1999 Stock Plan | |
| 10.3** | Forms of option agreement under 1999 Stock Plan | |
| 10.4** | 2001 Stock Plan | |
| 10.5** | Form of option agreement under 2001 Stock Plan | |
| 10.6** | 2009 Equity Incentive Plan | |
| 10.7** | Forms of option agreement under 2009 Equity Incentive Plan | |
| 10.8** | Form of restricted stock unit agreement under 2009 Equity Incentive Plan | |
| 10.9* | 2014 Equity Incentive Plan | |
| 10.10* | Form of option agreement under 2014 Equity Incentive Plan | |
| 10.11* | Form of restricted stock unit under 2014 Equity Incentive Plan | |
| 10.12* | Form of restricted stock award agreement under 2014 Equity Incentive Plan | |
| 10.13* | 2014 Employee Stock Purchase Plan | |
| 10.14 | Executive Incentive Compensation Plan | |
| 10.15** | Offer letter, dated January 27, 2000, by and between the Registrant and Anil Arora | |
| 10.16** | Offer letter, dated April 8, 2013, by and between the Registrant and Michael Armsby | |
| 10.17** | Offer letter, dated September 28, 2007, by and between the Registrant and William Parsons | |
| 10.18** | Lease Agreement between the Registrant and Westport Office Park, LLC, dated August 31, 2001, as amended on August 7, 2003, June 30, 2007, August 1, 2009 and May 17, 2010 | |
| 10.19** | Lease Agreement between Yodlee Infotech Private Limited and NSL Properties Private Limited, Mr. M. Venkataramaiah and Mrs. M. Rama Devi, dated April 16, 2012 | |
| 10.20** | Lease Agreement between Yodlee Infotech Private Limited and M/s. Omtek Technology Park Private Limited, dated December 1, 2012 | |
| 10.21** | Lease Agreement between Yodlee Infotech Private Limited and M/s. Omtek Technology Park Private Limited, dated April 1, 2014 | |
Table of Contents
| Exhibit |
Exhibit Title | |
| 10.22†** | Amended and Restated General Services Agreement, dated May 12, 2014, by and between the Registrant and Bank of America, N.A. | |
| 10.22.1† | Amendment to the General Services Agreement, dated June 30, 2014, by and between the Registrant and Bank of America, N.A. | |
| 10.23* | Form of Change of Control and Severance Agreement | |
| 10.24** | Amended and Restated Loan and Security Agreement, dated July 11, 2011, by and between the Registrant and Silicon Valley Bank, as amended on March 2, 2012, July 12, 2012, February 28, 2013, August 2013 and February 2014. | |
| 21.1** | List of subsidiaries of the Registrant | |
| 23.1 | Consent of Independent Registered Public Accounting Firm | |
| 23.2* | Consent of Wilson Sonsini Goodrich & Rosati, Professional Corporation (included in Exhibit 5.1) | |
| 24.1 | Power of Attorney (see page II-4 to this registration statement on Form S-1) | |
| * | To be filed by amendment. |
| ** | Previously filed. |
| † | Confidential treatment has been requested for portions of this exhibit. These portions have been omitted from this Registration Statement and have been filed separately with the Securities and Exchange Commission. |