Attached files
| file | filename |
|---|---|
| EX-99.1 - EXHIBIT 99.1 - JOHNSON CONTROLS INC | exh991-johnsonctrlsq3fy14.htm |
| 8-K - 8-K - JOHNSON CONTROLS INC | a8-kq3fy14results.htm |

July 18, 2014 Quarterly update FY 2014 third quarter Exhibit 99.2

Agenda Introduction Glen Ponczak, Vice President, Global Investor Relations Overview Alex Molinaroli, Chairman and Chief Executive Officer Business results and financial review Bruce McDonald, Executive Vice President and Chief Financial Officer Q&A 2 FORWARD-LOOKING STATEMENTS Johnson Controls, Inc. has made statements in this document that are forward-looking and, therefore, are subject to risks and uncertainties. All statements in this document other than statements of historical fact are statements that are, or could be, deemed "forward-looking statements" within the meaning of the Private Securities Litigation Reform Act of 1995. In this document, statements regarding future financial position, sales, costs, earnings, cash flows, other measures of results of operations, capital expenditures or debt levels and plans, objectives, outlook, targets, guidance or goals are forward-looking statements. Words such as “may,” “will,” “expect,” “intend,” “estimate,” “anticipate,” “believe,” “should,” “forecast,” “project” or “plan” or terms of similar meaning are also generally intended to identify forward-looking statements. Johnson Controls cautions that these statements are subject to numerous important risks, uncertainties, assumptions and other factors, some of which are beyond Johnson Controls’ control, that could cause Johnson Controls’ actual results to differ materially from those expressed or implied by such forward- looking statements. These factors include required regulatory approvals that are material conditions for proposed transactions to close, strength of the U.S. or other economies, automotive vehicle production levels, mix and schedules, energy and commodity prices, availability of raw materials and component products, currency exchange rates, and cancellation of or changes to commercial contracts, as well as other factors discussed in Item 1A of Part I of Johnson Controls’ most recent Annual Report on Form 10-K for the year ended September 30, 2013. Shareholders, potential investors and others should consider these factors in evaluating the forward-looking statements and should not place undue reliance on such statements. The forward-looking statements included in this document are only made as of the date of this document, and Johnson Controls assumes no obligation, and disclaims any obligation, to update forward-looking statements to reflect events or circumstances occurring after the date of this document.

2014 third quarter Macro environment Higher global automotive industry production – North America 4% – Europe 1% – China 11% Mixed battery demand – Higher Original Equipment globally – Aftermarket demand stronger in North America and Asia, lower in Europe – European customer aftermarket inventories trending lower Overall U.S. and Europe commercial building HVAC demand lower; seeing some improvements in certain verticals – K-12 and higher education new construction – State/local government new construction – Healthcare retrofit – Federal government retrofit – Industrial new construction and retrofit Strong markets in China across all businesses 3

2014 third quarter Buildings markets Institutional buildings (more than half our N.A. business) Institutional sector of the nonresidential construction market continues decline ─ Construction starts down 45% vs. 2008 peak ─ Government building starts down 69% from the 2008 peak Q3 decline in NA secured business is largely attributable to a continued decline in large Federal construction jobs JCI Applied HVAC equipment sales: up 9% in the quarter vs. a flat market representing market share gains Light Commercial: JCI up 10.9% y/y Strength in smaller tonnages partially offset by softness across larger tonnages ─ ADT acquisition doubles JCI exposure Residential: JCI level y/y versus up market 4

2014 third quarter (continuing operations)* Net revenues: $10.8 billion, up 3% vs. $10.5 billion in Q3 2013 Segment income: $794 million, up 15% vs. $690 million in Q3 2013 EPS: $0.84 per diluted share, up 17% vs. $0.72 in Q3 2013 5 *Excluding non-recurring items Thank you to our employees: Delivering on commitments during a period of significant organizational change Portfolio Update Completed in 2014 third quarter Divestiture of Headliner and Visors business Divestiture of Automotive Electronics business Acquisition of Air Distribution Technologies, Inc. (ADT) ─ Completed $1.7 billion bond offering to fund ADT acquisition Q3 results at the high end of earnings guidance for the quarter

Winning in the marketplace 2014 third quarter Automotive Experience Awarded $3 billion in new metals programs BMW Brilliance Automotive - new complete seat program for luxury sedan in China, launch in 2017. Expected annual revenues $325+ million Significant level of new interiors business wins following announcement of partnership with Yanfeng Building Efficiency Standard Chartered Bank, 22 countries ─ Largest GWS contract ever in Asia New rooftop products introduced Power Solutions Awarded new original equipment battery business in China ─ Traditional and AGM lead-acid batteries. Expected production launch in 2016 Awarded new aftermarket business in the United States, Europe and Japan ─ Approximately 3 million incremental units per year ─ Initial production to launch in calendar 2014 6 New Prestige® Rooftop Units

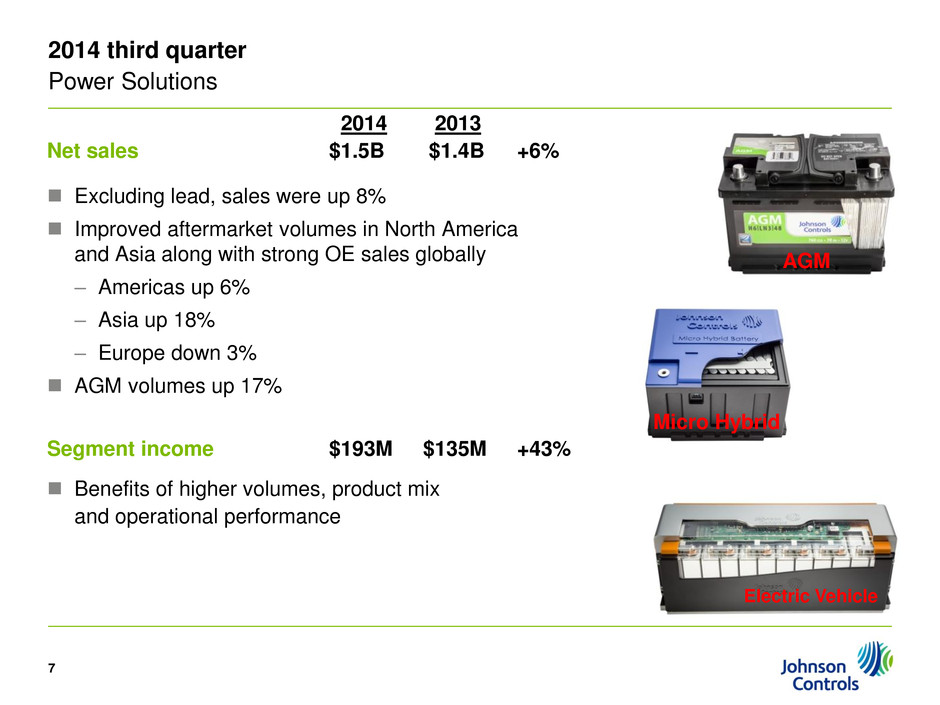
2014 third quarter Power Solutions 2014 2013 Net sales $1.5B $1.4B +6% Excluding lead, sales were up 8% Improved aftermarket volumes in North America and Asia along with strong OE sales globally – Americas up 6% – Asia up 18% – Europe down 3% AGM volumes up 17% Segment income $193M $135M +43% Benefits of higher volumes, product mix and operational performance 7 Micro Hybrid Electric Vehicle AGM

2014 third quarter Building Efficiency* 2014 2013 Net sales $3.6B $3.7B -4% BE sales down 1% excluding GWS and divestitures – Asia flat – North America down 4% – Europe up 6%** – Middle East down 15%; Latin America down 27% Global Workplace Solutions revenues down 4% Segment income $306M $314M -3% Segment margins up 10 bps year over year BE margins (ex-GWS) 10.3%; down 40 bps due to lower volumes and transaction-related costs GWS is up 46%, benefiting from restructuring initiatives and operating model changes 8 Commercial backlog and orders (at June 30, 2014) Backlog $4.7B, down 6% ─ Adjusted for divestitures and foreign exchange Orders down 8% ─ 2013 orders included $70+ million VA Hospital order * Excluding non-recurring items **Adjusted for divestitures

2014 third quarter Automotive Experience* 2014 2013 Net sales $5.7B $5.4B +7% Higher volumes globally China sales (mostly non-consolidated) up 28% to $1.8B Segment income $295M $241M +22% Profitability improvements attributable to higher volumes and improved operational performance – Seating margins 5.6% (+20 bps) – Interiors margins 3.5% (+240 bps) Restructuring initiatives and European improvements in line with internal expectations 9 Fiscal Q3 production North America up 4% Europe up 1% China up 11% * Excluding non-recurring items

(in millions) 2014 (excluding items1) 2013 (excluding items) % change 2014 (reported) 2013 (reported) Sales $10,812 $10,499 3% $10,812 $10,499 Gross profit % of sales 1,669 15.4% 1,564 14.9% 7% 1,663 15.4% 1,564 14.9% SG&A expenses 963 948 2% 1,097 948 Equity income 88 74 19% 88 74 Segment income $794 $690 15% $654 $690 7.3% 6.6% Third quarter 2014 Financial highlights (continuing operations) 10 Sales – Excluding FX, sales up 2% (Euro/dollar average exchange rate at $1.37 in Q3 2014 vs. $1.31 in Q3 2013) Gross profit – Impact of higher volumes, improved operational performance and pricing initiatives Equity income – Improved performance from Automotive JVs 1 Q3 2014 items: 1) $120 million pre-tax loss on business divestitures 2) $20 million pre-tax transaction related costs

Third quarter 2014 Financial highlights (continuing operations) 11 (in millions, except earnings per share) 2014 (excluding items1) 2013 (excluding items 2) 2014 (reported) 2013 (reported) Segment income $794 $690 $654 $690 Restructuring costs ----- ----- 162 143 Financing charges - net 67 67 67 67 Income from continuing ops. before taxes 727 623 425 480 Income tax provision / (benefit) 144 107 167 (72) Net income from continuing ops. 583 516 258 552 Income attributable to non-controlling interests 20 22 20 22 Net income from continuing operations attributable to JCI $563 $494 $238 $530 Diluted EPS from continuing operations $0.84 $0.72 $0.35 $0.77 Income tax provision – Underlying 2014 tax rate of 19.8%, compared to 17.2% last year Financing charges – Comparable to prior year; financing charges post-ADT acquisition expected to be approximately $75M – $80M per quarter 1 Q3 2014 items: 1) $120 million pre-tax loss on business divestitures 2) $162 million pre-tax restructuring charge 3) $20 million pre-tax transaction related costs 2 Q3 2013 items: 1) $143 million pre-tax restructuring charge 2) $140 million of non-recurring tax benefits

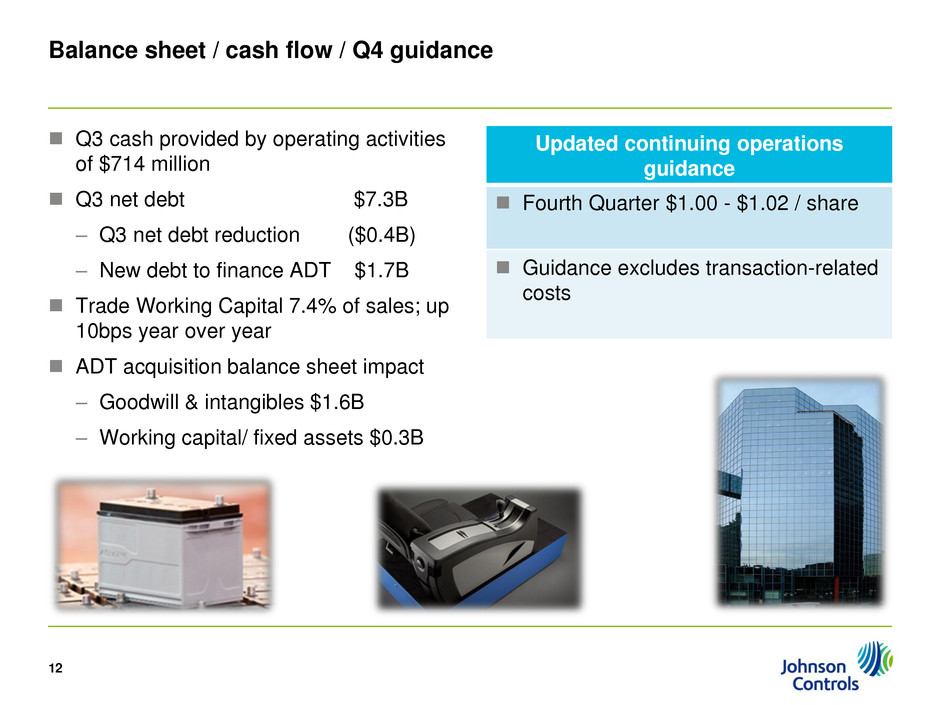
Balance sheet / cash flow / Q4 guidance Q3 cash provided by operating activities of $714 million Q3 net debt $7.3B – Q3 net debt reduction ($0.4B) – New debt to finance ADT $1.7B Trade Working Capital 7.4% of sales; up 10bps year over year ADT acquisition balance sheet impact – Goodwill & intangibles $1.6B – Working capital/ fixed assets $0.3B 12 Updated continuing operations guidance Fourth Quarter $1.00 - $1.02 / share Guidance excludes transaction-related costs
