Attached files
| file | filename |
|---|---|
| 8-K - 8-K - Franchise Group, Inc. | form8-k071614investorprese.htm |

Liberty Tax, Inc. (formerly known as JTH Holding, Inc.) I n v e s t o r P r e s e n t a t i o n

Safe Harbor Statement This presentation may contain forward-looking statements within the meaning of the securities laws. Forward- looking statements can be identified by the fact that they do not relate strictly to historical or current facts. They often include words or variations of words such as “expects,” “anticipates,” “intends,” “plans,” “believes,” “seeks,” “estimates,” “projects,” “forecasts,” “targets,” “would,” “will,” “should,” “could,” or “may” or other similar expressions. Forward-looking statements provide management’s current expectations or predictions of future conditions, events or results. All statements that address operating performance, events or developments that we expect or anticipate will occur in the future are forward-looking statements. They may include estimates of revenues, income, earnings per share, capital expenditures, dividends, liquidity, capital structure or other financial items, descriptions of management’s plans or objectives for future operations, products or services, or descriptions of assumptions underlying any of the above. All forward-looking statements speak only as of the date they are made and reflect the Company’s good faith beliefs, assumptions and expectations, but they are not guarantees of future performance or events. Furthermore, the Company disclaims any obligation to publicly update or revise any forward-looking statement to reflect changes in underlying assumptions, factors, or expectations, new information, data or methods, future events or other changes, except as required by law. By their nature, forward-looking statements are subject to risks and uncertainties that could cause actual results to differ materially from those suggested by the forward-looking statements. Factors that might cause such differences include, but are not limited to, a variety of economic, competitive and regulatory factors, many of which are beyond the Company’s control and that are described in our Annual Report on Form 10-K for the fiscal year ended April 30, 2014 in the section entitled “Risk Factors”, as well as additional factors we have described and may describe from time to time in other filings with the Securities and Exchange Commission. You should understand that it is not possible to predict or identify all such factors and, consequently, you should not consider any such list to be a complete set of all potential risks or uncertainties. 2

Agenda The Industry The Company Financial Overview Future Opportunities

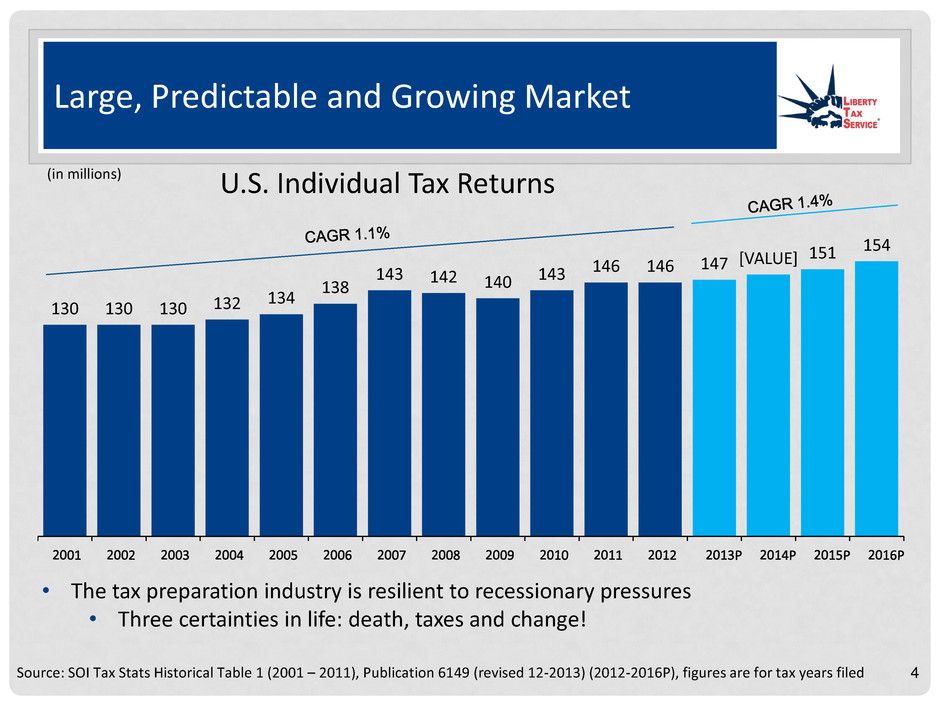
130 130 130 132 134 138 143 142 140 143 146 146 147 [VALUE] 151 154 Large, Predictable and Growing Market Source: SOI Tax Stats Historical Table 1 (2001 – 2011), Publication 6149 (revised 12-2013) (2012-2016P), figures are for tax years filed U.S. Individual Tax Returns (in millions) 4 • The tax preparation industry is resilient to recessionary pressures • Three certainties in life: death, taxes and change!

Paid Preparer Portion of Market Has Remained Consistent 58% 59% 60% 62% 63% 63% 63% 60% 61% 60% 61% 60% 60% 60% 42% 41% 40% 38% 37% 37% 37% 40% 39% 40% 39% 40% 40% 40% 2001 2002 2003 2004 2005 2006 2007 2008 2009 2010 2011 2012 2013 2014 Paid Preparer DIY Source: Liberty Tax, Inc. estimates and IRS data. 5

This is NOT a DIY Generation 6 From 2010 to 2013, revenue in Nail Salons has grown 34% Revenue in Pet Grooming & Boarding has grown 20% since 2010 In 2013, Sales in Landscaping grew 12% and Profitability improved by more than 50% Molly Maid cleaning service has a 97% customer retention rate, with nearly $20 billion in annual sales and a projected growth rate of 20% Source: Forbes article (4/23/2014), Statista, www.mollymaid.com, www.about.com Franchises

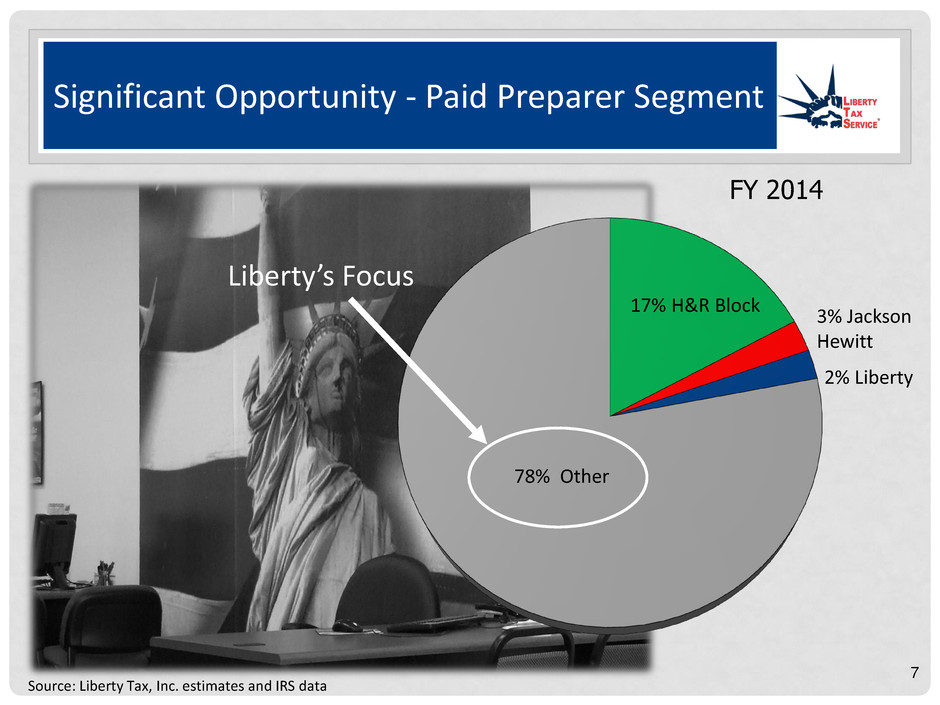
Significant Opportunity - Paid Preparer Segment 78% Other 2% Liberty 3% Jackson Hewitt 17% H&R Block Liberty’s Focus 7 Source: Liberty Tax, Inc. estimates and IRS data FY 2014

Industry Attractive to Entrepreneurs Predictability and history of tax industry adds a sense of security Low capital requirements Short duration of tax season results in low annual overhead Labor force is plentiful and inexpensive Annual filing requirements result in “annuity like” demand Recession resistant 8

Two Tax Seasons Early Season - “Fastest Access to Refund” younger customer base lower income simple returns Late Season - “Delay & Minimize Tax Payment” older customer base higher income more complex returns FY 2014 Source: Liberty Tax, Inc. 9 2-Jan 9-Jan 16-Jan 23-Jan 30-Jan 6-Feb 13-Feb 20-Feb 27-Feb 6-Mar 13-Mar 20-Mar 27-Mar 3-Apr 10-Apr 17-Apr 24-Apr 1-May

Agenda The Industry The Company Financial Overview Future Opportunities

Company Overview Fastest growing national retail preparer of paid tax returns Gaining market share every year for 15 years Third largest in the United States and second largest in Canada Ranked the 7th best franchise on Forbes “Top 20 Franchises for the Buck” in February 2012. 11

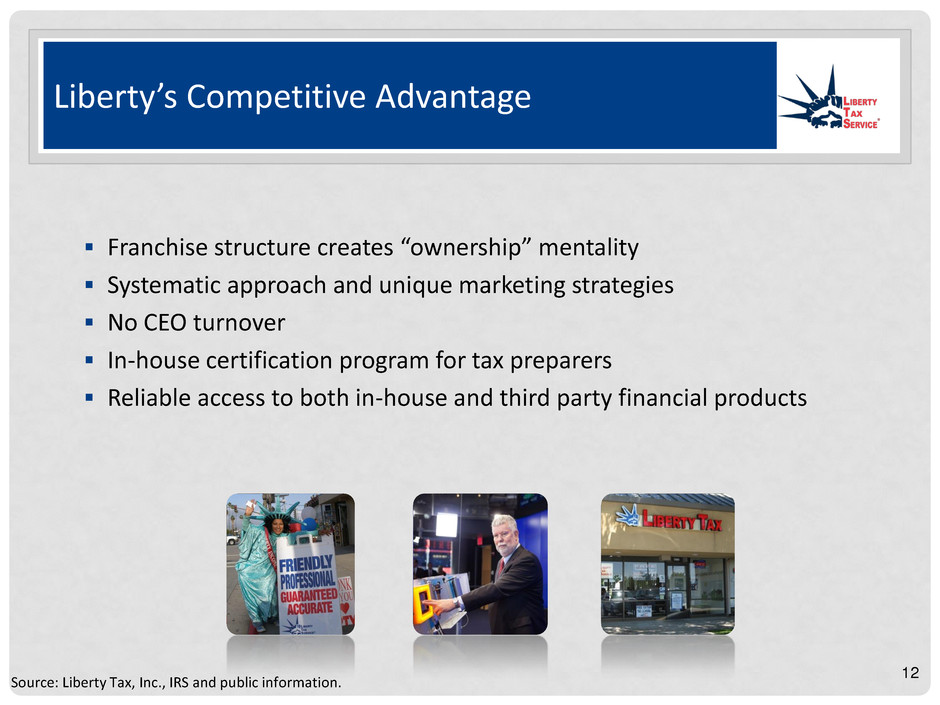
Liberty’s Competitive Advantage Franchise structure creates “ownership” mentality Systematic approach and unique marketing strategies No CEO turnover In-house certification program for tax preparers Reliable access to both in-house and third party financial products Source: Liberty Tax, Inc., IRS and public information. 12

Two Tier Franchise System Franchise Territories ~10,000 territories in the U.S., each targets ~30,000 people In fiscal 2014, Liberty had ~2,100 franchisees and ~4,400 offices in the U.S. and Canada ~$70,000 to open a franchise ($40,000 franchise fee, $30,000 other costs) Area Developer (AD) Areas AD area consists of multiple franchise territories ADs responsible for selling franchise territories and providing the first line of operational support to franchisees Receive 50% of franchise fees and 50% of ongoing royalty stream for their area Allows Liberty local representation in the area 13

Demand for Financial Products is Strong • Allows faster access to refunds • Good solution for unbanked clients • Client doesn’t pay prep fees out of pocket • Delivery can be via paper check or prepaid card Refund Transfer Products 14 ~50% of U.S. Customers Receive a Refund Transfer Product

Growth across all Metrics 1,801 1,901 1,941 2,098 2,211 2,104 2009 2010 2011 2012 2013 2014 Total Franchisees CAGR = 3.2% 3,091 3,531 3,845 4,183 4,520 4,438 2009 2010 2011 2012 2013 2014 Total Offices CAGR = 7.5% Total Returns (in thousands) CAGR = 6.4% 2009 2010 2011 2012 2013 2014 Offices Online 1,766 1,912 2,044 2,188 2,275 2,409 Systemwide Revenue (offices only) (in millions) CAGR = 11.6% $243.6 $304.3 $338.6 $359.1 $381.2 $421.2 2009 2010 2011 2012 2013 2014 15

Agenda The Industry The Company Financial Overview Future Opportunities

Financial Performance Adjusted Net Income and EPS1 Adjusted Net Income Revenue $101 $113 $118 $131 $148 $160 2009 2010 2011 2012 2013 2014 $13 $16 $15 $17 $19 $21 2009 2010 2011 2012 2013 2014 1 Net income and EPS adjusted for non-recurring items. See reconciliation on page 25. ($ in millions except per share data) $1.04 $1.00 $1.22 $1.39 $1.45 17 $0.84

Agenda The Industry The Company Financial Overview Future Opportunities

Growth Opportunities – Affordable Care Act More people will be driven to file New tax forms adding complexity, may cause Shift from DIY to paid preparers Price increase for more complicated returns Several pilots underway to help customers and franchisees navigate through the ACA 19

NextGen - Single Tax Platform • Platform Roll-out • DIY – Tax Season 2014 • Office – Tax Season 2015 • Competitive Advantage • vs. H&R Block and Jackson Hewitt: single platform with single team of developers used for both DIY and Brick & Mortar tax preparation software • vs. Intuit and Mom & Pops: seamless migration of customers between DIY platform and Brick & Mortar retail locations 20 Single Customer Database Single Tax Application & Content (Tax Rules) Two Interfaces DIY Offices

Other Growth Opportunities • Possible Immigration Reform • Hispanic Certified offices with bilingual staff • Created Una Familia Sin Fronteras Foundation, a non-profit foundation, that focuses on educating new Hispanic immigrants • Spanish website with office locator • Separate Hispanic brand office to be launched for 2015 tax season • Conversion of Mom and Pops • Aging owners • Availability of financial products • Complexity of ACA forms and requirements • Financial Product Opportunities • Prepaid card • Refund transfer product: increased volume and shift in-house 21

Long-term Goal Be the world’s largest tax preparation provider Do one more return in offices than any other paid preparer in the U.S. by 2020 Do one more return online than any other online DIY provider in the U.S. by 2025 22

Liberty Tax, Inc. (formerly known as JTH Holding, Inc.) I n v e s t o r P r e s e n t a t i o n

Appendix

Non-GAAP Reconciliation 25 2014 2013 2012 2011 2010 2009 Net income - as reported 21,982$ 17,627$ 16,383$ 14,670$ 14,389$ 13,157$ Add back (net of tax): (538) 1,607 - - - - 379 260 - - - - Costs associated with postponed IPO - - 845 - - - Foreign currency transaction gains - - (3) (44) (633) 263 Net gain in short-term investments (1,347) - - - (1,532) (444) Restatement costs 559 Loss on discontinued use of software - - - 3,478 - Net income - as adjusted 21,035$ 19,494$ 17,225$ 14,626$ 15,702$ 12,976$ Earnings per diluted share - as adjusted 1.45$ 1.39$ 1.22$ 1.00$ 1.04$ 0.84$ Severance including stock-based compensation/restructuring charge Fiscal years ended April 30, Liberty Tax, Inc. GAAP to Non - GAAP Reconciliation Unaudited, amounts in thousands, except per share and share data We report our financial results in accordance with generally accepted accounting principles (GAAP). However, we believe certain non- GAAP performance measures and ratios used in managing the business may provide additional meaningful comparisons between current year results and prior periods. Reconciliations to GAAP financial measures are provided below. These non-GAAP financial measures should be viewed in addition to, not as an alternative for, our reported GAAP results. Adjusted Net Income Stock-based compensation expense related to liability classified awards
