Attached files
| file | filename |
|---|---|
| EX-99.1 - EX-99.1 - WELLS FARGO & COMPANY/MN | d752866dex991.htm |
| 8-K - 8-K - WELLS FARGO & COMPANY/MN | d752866d8k.htm |
 2Q14 Quarterly Supplement
July 11, 2014
©
2014 Wells Fargo & Company. All rights reserved.
Exhibit 99.2 |
 Wells Fargo
2Q14 Supplement 1
Appendix
-
Non-strategic/liquidating loan portfolio
20
-
Purchased credit-impaired (PCI) portfolios
21
-
Residential mortgage trends
22
-
Real estate 1-4 family first mortgage portfolio
23
-
Real estate 1-4 family junior lien mortgage portfolio
24
-
Consumer credit card portfolio
25
-
Auto portfolios
26
-
Student lending portfolio
27
Common Equity Tier 1 under Basel III (General
Approach)
28
Common Equity Tier 1 under Basel III (Advanced
Approach, fully phased-in)
29
Forward-looking statements and
additional information
30
Table of contents
2Q14 Results
-
2Q14 Highlights
Page 2
-
Year-over-year results
3
-
Strong revenue diversification
4
-
Balance Sheet and credit overview (linked quarter)
5
-
Income Statement overview (linked quarter)
6
-
Loans
7
-
Broad-based, year-over-year loan growth
8
-
Deposits
9
-
Net interest income
10
-
Noninterest income
11
-
Noninterest expense and efficiency ratio
12
-
Community Banking
13
-
Wholesale Banking
14
-
Wealth, Brokerage and Retirement
15
-
Credit quality
16
-
Capital
17
-
Summary
18
As previously disclosed with our first quarter 2014 results, financial information for certain
periods prior to 2014 was revised to reflect our determination that certain factoring
arrangements previously included within commercial loans, which were recorded with a corresponding obligation in other liabilities, did not qualify as loan
purchases under ASC Topic 860 (Transfers and Servicing of Financial Assets) based on
interpretations of the specific arrangements. Accordingly, we revised our commercial
loan balances for year-end 2012 and each of the quarters in 2013 in order to appropriately present the Company’s lending trends over this period. This
revision, which resulted in a reduction to total commercial loans and a corresponding decrease
to other liabilities, did not impact the Company’s consolidated net income or
total cash flows. We reduced our commercial loans by $3.5 billion, $3.2 billion, $2.1 billion, $1.6 billion, and $1.2 billion at December 31, 2013,
September 30, 2013, June 30, 2013, March 31, 2013, and December 31, 2012, respectively, which
represented less than 1% of total commercial loans and less than 0.5% of our total loan
portfolio. Other affected financial information, including ratios, has been appropriately revised to reflect this revision.
Pages 19-30 |
 Wells Fargo
2Q14 Supplement 2
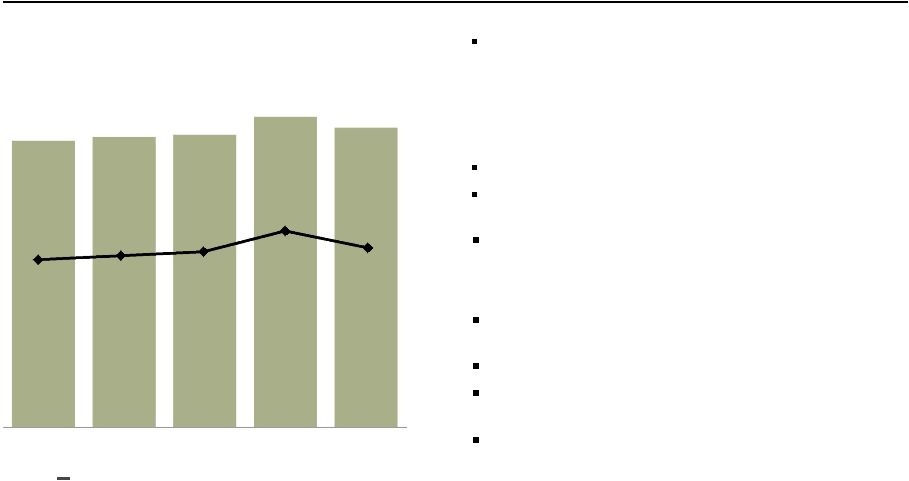
2Q14 Highlights
Strong earnings of $5.7 billion, up $207 million,
or 4% year-over-year (YoY), and down 3% linked
quarter (LQ)
–
1Q14 included a $423 million discrete tax
benefit, or $0.08 impact to diluted earnings per
common share
Pre-tax income of $8.7 billion, up 4% LQ
Diluted earnings per common share of $1.01, up
3% YoY and down 4% LQ
Diversified revenue growth
-
Net
interest
income
up
2%
LQ
-
Noninterest
income
up
3%
LQ
Strong loan and deposit growth, with both core
loans
(1)
and deposits up 2% LQ
Pre-tax pre-provision profit (PTPP)
(2)
up 2% LQ
Provision expense down 33% LQ on lower net
charge-offs
Increased return to shareholders
-
Returned $3.6 billion to shareholders through
common stock dividends and net share
repurchases including $1.0 billion forward share
repurchase expected to settle in 3Q14
Wells Fargo Net Income
($ in millions)
Diluted earnings per common share
5,519
5,578
5,610
5,893
5,726
2Q13
3Q13
4Q13
1Q14
2Q14
$0.98
$0.99
$1.00
$1.05
$1.01
(1) See pages 7 and 20 for additional information regarding core loans and the
non-strategic/liquidating portfolio, which is comprised of Pick-a-Pay, liquidating
home equity, legacy WFF indirect auto, legacy WFF debt consolidation, Education
Finance-government guaranteed, and legacy Wachovia commercial &
industrial, commercial real estate, foreign and other PCI loan portfolios. At the end of 2Q14,
$9.7 billion in Education Finance-government guaranteed loans were
transferred to loans held for sale.
(2) Pre-tax pre-provision profit (PTPP) is total revenue less noninterest
expense. Management believes PTPP is a useful financial measure because it enables
investors and others to assess the Company’s ability to generate capital to cover credit
losses through a credit cycle. |
 Wells Fargo
2Q14 Supplement 3
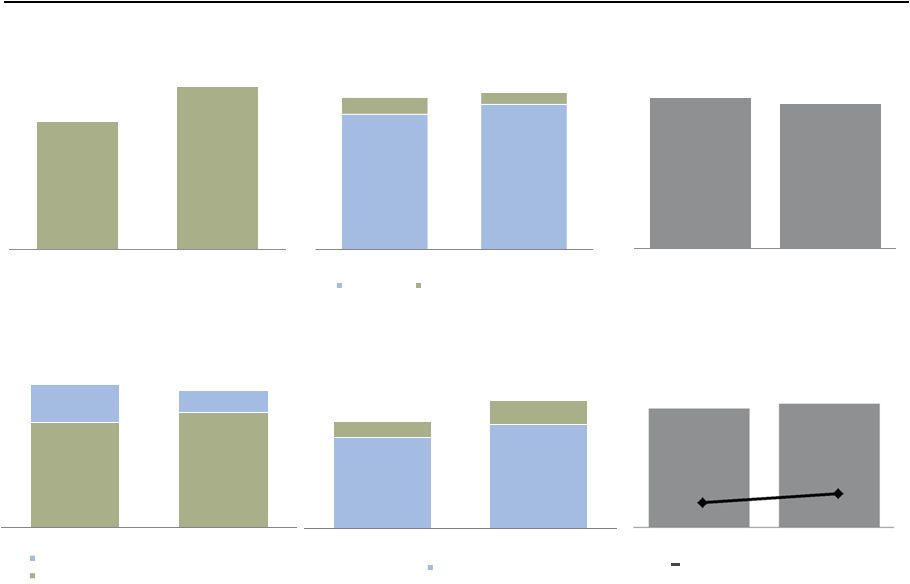
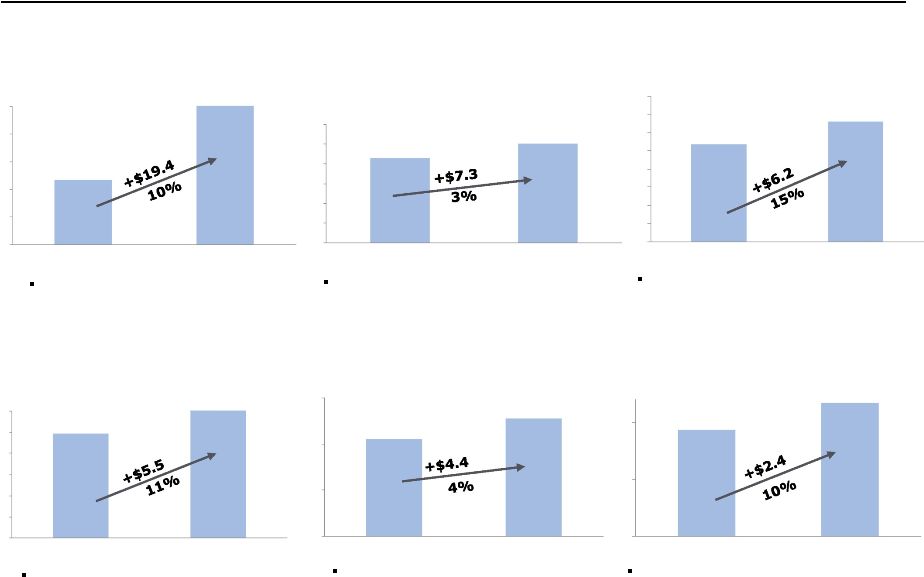
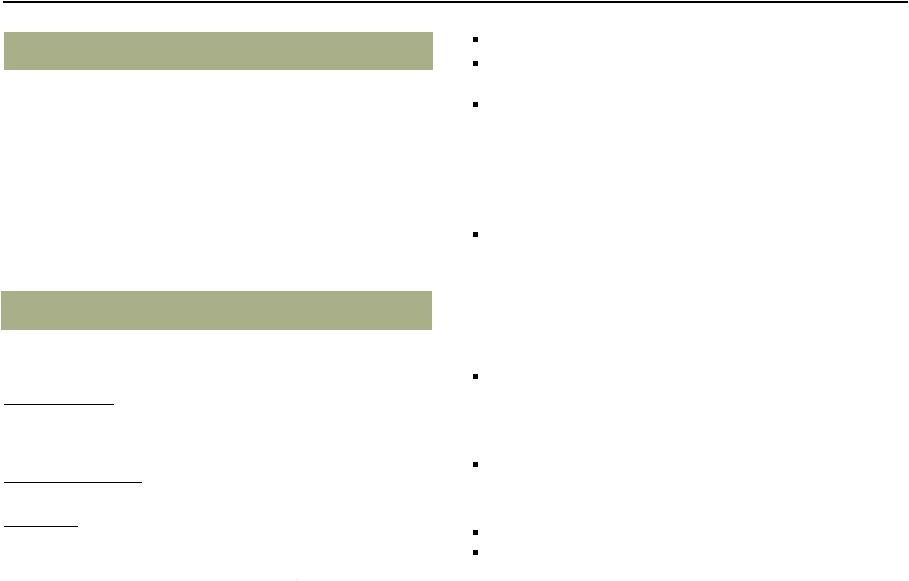
Year-over-year results
Pre-tax
Pre-provision
Profit
(2)
($ in millions)
Net Income
($ in millions, except EPS)
Diluted earnings per common share
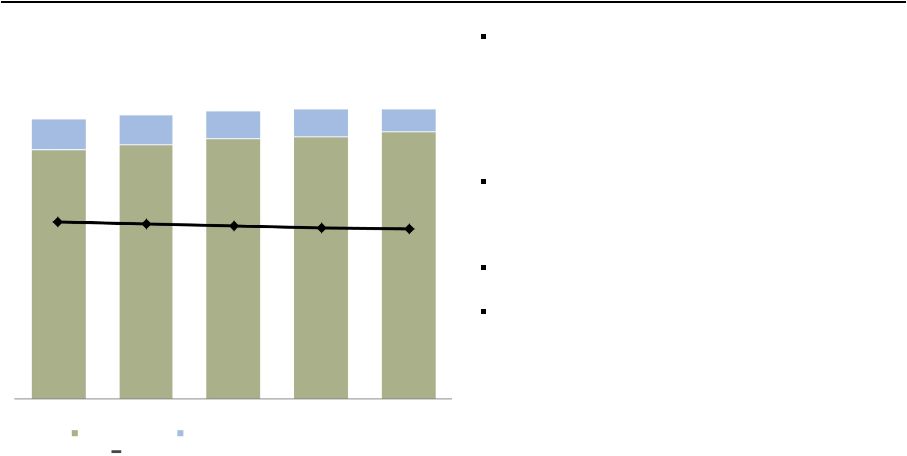
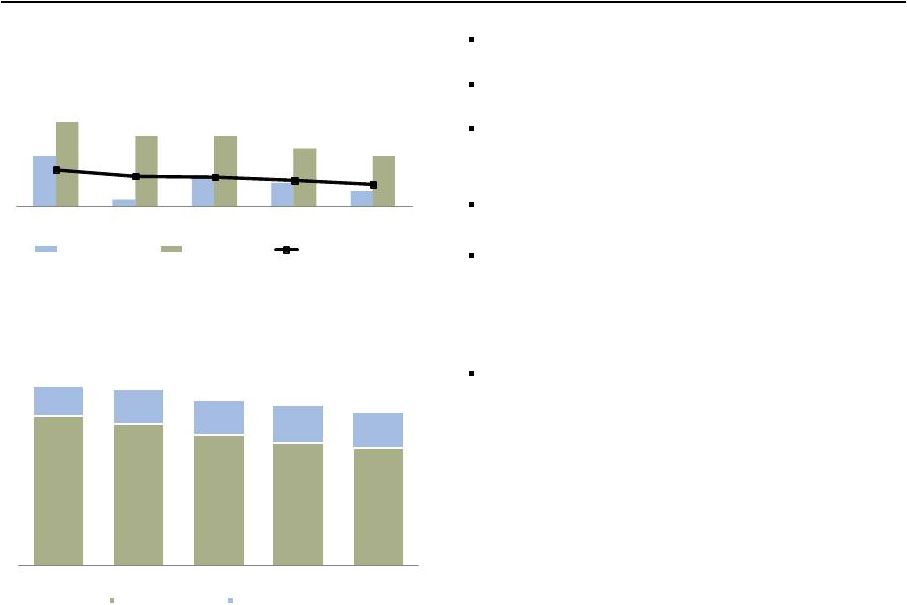
Period-end Loans
(1)
($ in billions)
Net Interest Income
($ in millions)
Noninterest Income
($ in millions)
Period-end Deposits
($ in billions)
(1)
Please see page 1 for information on certain prior period revisions.
(2)
Pre-tax pre-provision profit (PTPP) is total revenue less noninterest expense.
Management believes PTPP is a useful financial measure because it enables investors and
others to assess the Company’s ability to generate capital to cover credit losses through a credit cycle.
10,750
10,791
2Q13
2Q14
7,826
8,552
2,802
1,723
10,628
10,275
2Q13
2Q14
Mortgage banking
Noninterest income excluding Mortgage banking
9,123
8,872
2Q13
2Q14
941.2
1,007.5
80.4
111.1
1,021.6
1,118.6
2Q13
2Q14
Core Deposits
$0.98
$1.01
5,519
5,726
2Q13
2Q14
712.3
763.6
87.6
65.3
799.9
828.9
2Q13
2Q14
Core loans
Non-strategic/liquidating loans |
 Wells Fargo
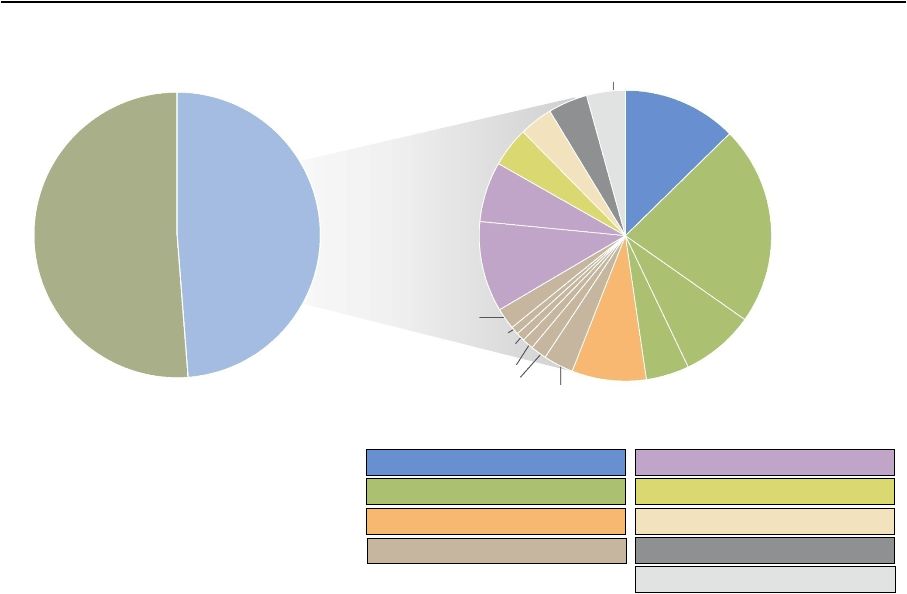
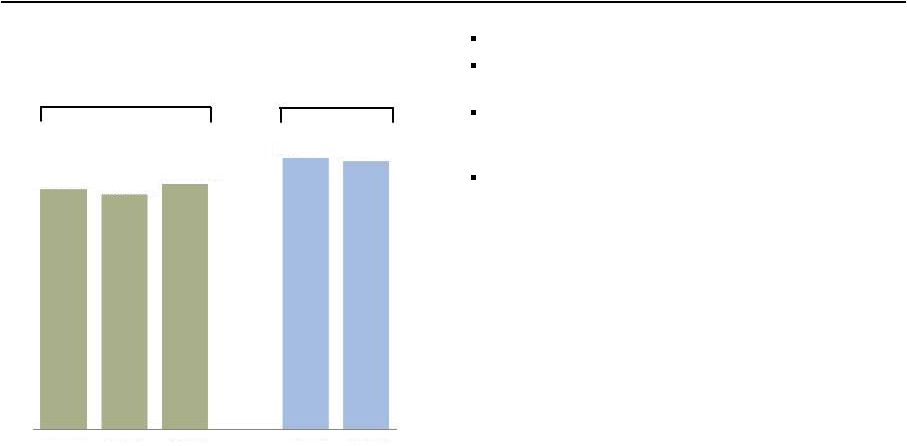
2Q14 Supplement 4
Balanced Spread and
Fee Income
Diversified Fee Generation
Deposit Service Charges
13%
Card Fees
8%
Total Mortgage Banking
17%
Insurance
4%
Net Gains from Trading
4%
All data is for 2Q14.
Strong revenue diversification
Total Trust & Investment Fees 35%
Total Other Fees
11%
Net Gains from Equity Inv.
4%
Mortgage Orig./
Sales, net
Mortgage Servicing, net
Trust and investment
management
Investment banking
Charges and fees on loans
2% Merchant processing
1% Cash network
1% CRE brokerage commissions
1% Letters of credit
Card fees
Deposit service charges
Net gains from trading
Insurance
Net Interest
Income
Noninterest
Income
3% All other fees
Net gains from equity investments
Other
Noninterest
Income
(1)
4%
13%
22%
8%
5%
8%
3%
10%
7%
4%
4%
4%
4%
49%
51%
(1) Other noninterest income includes net gains on debt securities, lease income, life
insurance investment income and all other noninterest income.
Other
noninterest
income
(1)
Brokerage advisory,
commissions and other |
 Wells Fargo
2Q14 Supplement 5
Balance Sheet and credit overview (linked quarter)
Loans
Core loans
(1)
increased $15.2 billion, or 8% annualized LQ, on broad-based growth
Short-term investments/
Fed funds sold
Up $15.9 billion primarily due to deposit growth and liquidity-related actions
Trading assets
Up $7.9 billion on increased inventory for market making activity
Investment securities
Up $8.7 billion as gross purchases of ~$17 billion were partially offset by run-off
Deposits
Up $24.0 billion on strong commercial growth and liquidity-related fundings
Long term debt
Up $14.5 billion including $7.8 billion in liquidity-related issuance
Common stock
repurchases
Common shares outstanding down 15.8 million on net share repurchases
Purchased 39.4 million common shares in the quarter and entered into a $1.0 billion
forward
repurchase
transaction
that
is
expected
to
settle
for
an
estimated
19.4
million shares in 3Q14
Credit
Provision expense of $217 million, down $108 million
-
Net charge-offs of $717 million, or 35 bps, down $108 million
-
$500 million reserve release
(2)
vs. $500 million in 1Q14 on continued strong
credit performance
Period-end balances. All comparisons are 2Q14 compared with 1Q14.
(1)
See pages 7 and 20 for additional information regarding core loans and the
non-strategic/liquidating portfolio, which is comprised of Pick-a-Pay, liquidating home
equity, legacy WFF indirect auto, legacy WFF debt consolidation, Education
Finance-government guaranteed, and legacy Wachovia commercial & industrial,
commercial real estate, foreign and other PCI loan portfolios. At the end of 2Q14, $9.7
billion in Education Finance-government guaranteed loans were transferred to loans
held for sale.
(2)
Provision expense minus net charge-offs. loans held for sale (HFS) of $9.7 billion in government-guaranteed student loans
Non-strategic/liquidating
portfolio
(1)
decreased
$12.7
billion
including
transfer
to |
 Wells Fargo
2Q14 Supplement 6
Income Statement overview (linked quarter)
Total revenue
Revenue of $21.1 billion, up $441 million
Net interest income
NII up $176 million on growth in earning assets and 1 more day in the quarter
NIM down 5 bps to 3.15% reflecting deposit growth
Noninterest income
Noninterest income up $265 million
-
Service
charges
on
deposit
accounts
up
$68
million
and
card
fees
up
$63
million from a seasonally lower 1Q14
-
Trust and investment fees up $197 million on higher investment banking and
retail brokerage asset-based fees
-
Mortgage banking up $213 million on higher production revenue and servicing
income
Noninterest expense
Noninterest expense up $246 million
-
Personnel expense down $106 million from seasonally high employee benefits
and incentive compensation expense in 1Q14, partially offset by higher
revenue-based
incentive
compensation,
deferred
compensation
expense
(2)
and
annual merit increases
-
Operating losses up $205 million primarily from litigation accruals on various
legal matters
-
Outside professional services up $87 million and advertising expense up $69
million from a seasonally low 1Q14
Income tax
Tax expense up $592 million from a 1Q14 that included a $423 million discrete tax
benefit
•
Net gains from trading down $50 million as lower customer
accommodation results were partially offset by higher deferred
compensation
plan
investment
results
(2)
•
Net gains from equity investments down $398 million from a
stronger 1Q14
-
Market
sensitive
revenue
(1)
down
$460
million
All comparisons are 2Q14 compared with 1Q14. (1)
Consists of net gains from trading activities, debt securities and equity investments.
(2) Deferred compensation plan investment results are P&L neutral as the
compensation expense is hedged with offsetting trading revenue.
|
 Wells Fargo
2Q14 Supplement 7
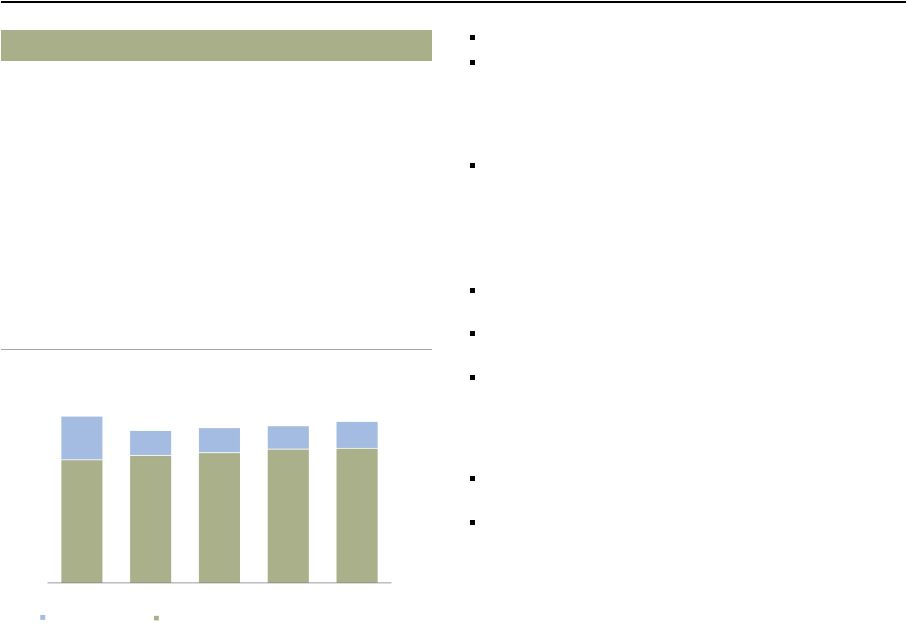
Loans
(1)
Core loans grew $51.3 billion, or 7%, YoY and
$15.2 billion, or 8% annualized, LQ
-
Commercial loans up $10.3 billion LQ
driven by growth in C&I
-
Consumer loans up $4.8 billion LQ on
growth in nonconforming mortgage, auto
and credit card
Non-strategic/liquidating
loans
(2)
down
$22.3
billion YoY and $12.7 billion from 1Q14
-
Included transfer of $9.7 billion in
government-guaranteed student loans to HFS
Total average loans of $831.0 billion up $32.6
billion YoY and $7.2 billion LQ
Total average loan yield of 4.28%, down 1 bp LQ
-
Core loan yield excluding the non-strategic/
liquidating portfolio was down 2 bps
-
Non-strategic/liquidating portfolio yield
of 4.99%
(1) Please see page 1 for information on certain prior period revisions.
(2) See page 20 for additional information regarding the non-strategic/liquidating
portfolio, which is comprised of Pick-a-Pay, liquidating home equity, legacy WFF
indirect auto, legacy WFF debt consolidation, Education Finance-government guaranteed, and
legacy Wachovia commercial & industrial, commercial real estate, foreign and other
PCI loan portfolios. At the end of 2Q14, $9.7 billion in Education Finance-government guaranteed loans were transferred to loans held for sale.
Period–end Loans Outstanding
($ in billions)
(2)
Total average loan yield
712.3
725.0
741.4
748.4
763.6
87.6
84.1
80.9
78.0
65.3
799.9
809.1
822.3
826.4
828.9
2Q13
3Q13
4Q13
1Q14
2Q14
4.47%
4.42%
4.36%
4.29%
4.28%
Core loans
Non-strategic/liquidating loans |
 Wells Fargo
2Q14 Supplement 8
Broad-based, year-over-year loan
growth
Growth in nonconforming mortgage
Strong originations, up 9%
Solid new account growth, up 4%
($ in billions)
Broad-based growth with particular
strength in asset backed, corporate,
government, commercial and asset
based
Trade finance growth and 3Q13 U.K.
CRE acquisition
(1) Please see page 1 for information on certain prior period revisions.
New originations and 3Q13
acquisition
175.0
180.0
185.0
190.0
195.0
200.0
2Q13
2Q14
Commercial
and
Industrial
(1)
210.0
220.0
230.0
240.0
250.0
260.0
270.0
2Q13
2Q14
Real Estate 1-4 Family First
Mortgage
15.0
20.0
25.0
30.0
35.0
40.0
45.0
50.0
55.0
2Q13
2Q14
Foreign
(1)
24.0
29.0
34.0
39.0
44.0
49.0
54.0
2Q13
2Q14
Automobile
100.0
110.0
120.0
130.0
2Q13
2Q14
Commercial Real Estate
15.5
20.5
25.5
2Q13
2Q14
Credit Card |
 Wells Fargo
2Q14 Supplement 9
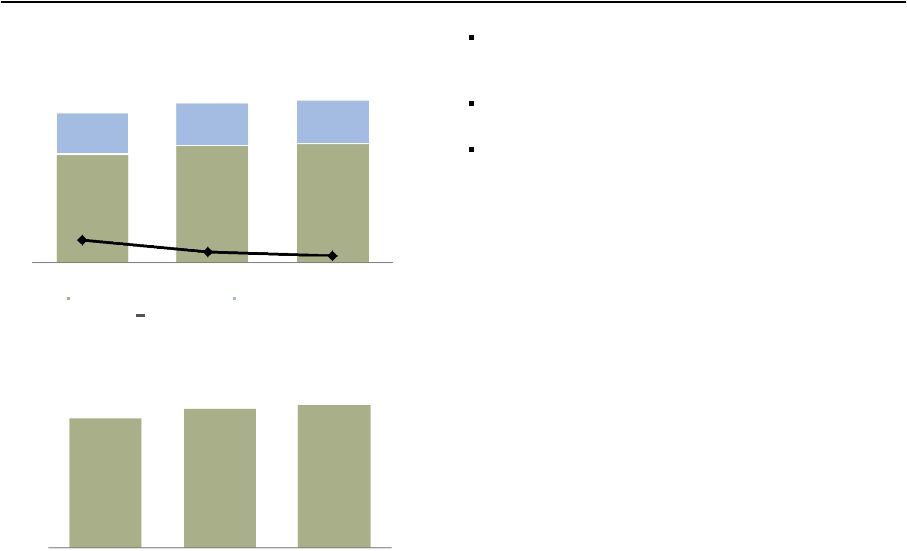
Deposits
Average deposits up $91.7 billion, or 9%, YoY
and $24.2 billion, or 9% annualized, LQ on
commercial and consumer growth
Average deposit cost of 10 bps, down 1 bp from
1Q14 and 4 bps from 2Q13
Average core deposits of $991.7 billion up $55.6
billion, or 6%, YoY and up $17.9 billion, or 7%
annualized, LQ
–
Average retail core deposits up 6% YoY and
11% annualized, LQ
–
Primary
consumer
checking
customers
(2)
up
a
net 4.6% YoY
Average Deposits and Rates
($ in billions)
Average deposit cost
Average Core Deposits
(1)
($ in billions)
729.7
793.2
805.6
280.1
284.1
295.9
1,009.8
1,077.3
1,101.5
2Q13
1Q14
2Q14
Interest-bearing deposits
Noninterest-bearing deposits
936.1
973.8
991.7
2Q13
1Q14
2Q14
(1)
(2)
0.14%
0.11%
0.10%
Core deposits are noninterest-bearing deposits, interest-bearing checking, savings
certificates, certain market rate and other savings, and certain foreign deposits
(Eurodollar sweep balances). Data as of
May 2014, comparisons with May 2013; customers who actively use their checking account with transactions such as debit card purchases, online bill
payments, and direct deposits. |
 Net interest
income (TE) (1)
up $184 million LQ on
1 additional day in the quarter, loan growth,
higher mortgages held for sale and higher trading
assets
Average earning assets up $38.3 billion, or
3%, LQ
-
Short-term investments/fed funds sold up
$16.5 billion
-
Loans up $7.2 billion
-
Trading assets up $6.2 billion
-
Investment securities up $6.2 billion
NIM of 3.15% down 5 bps from 1Q14 on:
-
Customer-driven deposit growth = (5) bps
-
Liquidity-related activity = (1) bp
-
Variable income = 1 bp
-
Balance sheet repricing, growth and mix = 0 bps
Net interest income
Net Interest Income (TE)
(1)
($ in millions)
Net Interest Margin (NIM)
(2)
10,946
10,949
11,022
10,832
11,016
2Q13
3Q13
4Q13
1Q14
2Q14
3.47%
3.39%
3.27%
3.20%
3.15%
(1)
(2)
Tax-equivalent net interest income is based on the federal statutory rate of 35% for the
periods presented. Net interest income was $10,750 million, $10,748 million, $10,803
million, $10,615 million and $10,791 million for 2Q13, 3Q13, 4Q13, 1Q14 and 2Q14 respectively.
Please see page 1 for information on certain prior period revisions.
Wells Fargo 2Q14 Supplement
10 |
 Wells Fargo
2Q14 Supplement 11
Noninterest income
Deposit service charges up $68 million LQ
Trust and investment fees up $197 million, or
6%, LQ on higher investment banking and retail
brokerage asset-based fees
-
Investment Banking fees up on broad-based
growth across all products
Mortgage banking up $213 million
-
Gain on sale revenue up $116 million reflecting
a 31% increase in originations
-
Net servicing income up $97 million reflecting
higher MSR hedge performance and servicing
fees
Mortgage banking
vs
vs
($ in millions)
2Q14
1Q14
2Q13
Noninterest income
Service charges on deposit accounts
$
1,283
6
%
3
Trust and investment fees
Brokerage advisory, commissions
and other fees
2,280
2
7
Trust and investment management
838
(1)
1
Investment banking
491
50
(9)
Card fees
847
8
4
Other fees
1,088
4
-
Mortgage banking
1,723
14
(39)
Insurance
453
5
(7)
Net gains from trading activities
382
(12)
15
Net gains on debt securities
71
(14)
n.m.
Net gains from equity investments
449
(47)
n.m.
Lease income
129
(3)
(43)
Life insurance investment income
138
5
(3)
Other
103
n.m.
n.m.
Total noninterest income
$
10,275
3
%
(3)
7,826
8,122
8,292
8,500
8,552
2,802
1,608
1,570
10,628
9,730
9,862
10,010
10,275
2Q13
3Q13
4Q13
1Q14
2Q14
1,723
1,510
Noninterest income excluding Mortgage banking
Card fees up $63 million on seasonality and new
customer growth in credit and debit cards
Other fees up $41 million reflecting higher
commercial real estate brokerage commissions
Trading gains down $50 million as lower customer
accommodation trading was partially offset by an
$87 million increase in deferred compensation
investment income (P&L neutral) ($110 million in
2Q14 vs. $23 million in 1Q14)
Equity gains down $398 million from a stronger
1Q14
Other income up $120 million predominantly from
the sale of 40 insurance offices in 2Q14 |
 Wells Fargo
2Q14 Supplement 12
Noninterest expense and efficiency ratio
(1)
Noninterest expense up $246 million LQ
-
Personnel expense down $106 million from
seasonally high employee benefits and incentive
compensation expense in 1Q14
•
Salaries up $67 million reflecting annual merit
increases and one extra day in the quarter
•
Commission and incentive compensation up
$29 million and included $130 million higher
revenue-based incentive compensation
•
Employee benefits expense down $202 million
and included $84 million higher deferred
compensation expense ($116 million vs. $32
million in 1Q14)
-
Outside
professional
services
(2)
up
$87
million
on higher project spend following 1Q seasonal
lows
-
Other expense
(2)
up $340 million
•
Operating losses up $205 million on litigation
accruals for various legal matters
•
Advertising up $69 million from 1Q seasonal
lows
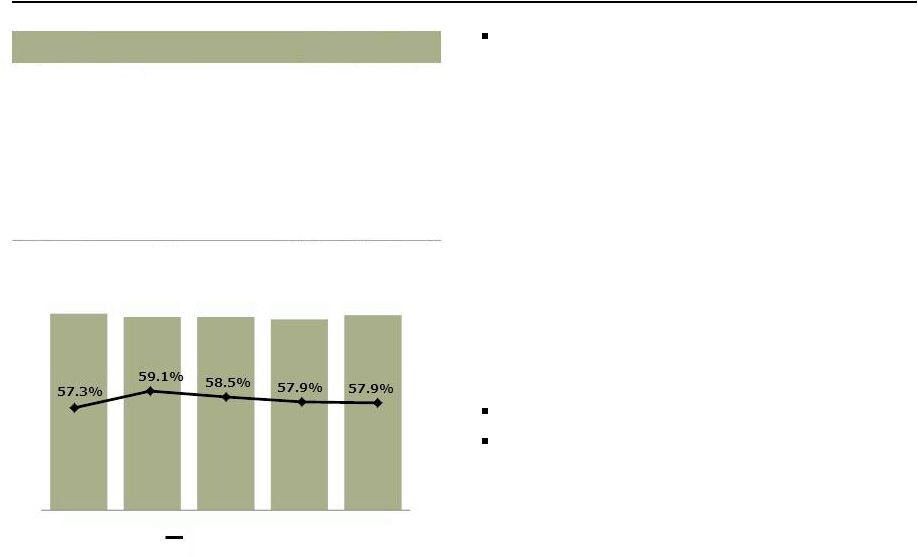
Efficiency ratio stable LQ at 57.9%
Expect to operate within targeted efficiency ratio
range of 55%-59% in 3Q14
Efficiency Ratio
vs
vs
($ in millions)
2Q14
1Q14
2Q13
Noninterest expense
Salaries
$
3,795
2
%
1
Commission and incentive compensation
2,445
1
(7)
Employee benefits
1,170
(15)
5
Equipment
445
(9)
6
Net occupancy
722
(3)
1
Core deposit and other intangibles
349
2
(7)
FDIC and other deposit assessments
225
(7)
(13)
Outside professional services
(2)
646
16
6
Other
(2)
2,397
17
1
Total noninterest expense
$
12,194
2
%
-
(1)
Efficiency ratio defined as noninterest expense divided by total revenue (net interest income
plus noninterest income). Noninterest expense and our efficiency ratio may be affected
by a variety of factors, including business and economic cyclicality, seasonality, changes in our business composition and operating
environment, growth in our business and/or acquisitions, and unexpected expenses relating to,
among other things, litigation and regulatory matters.
(2)
The sum of Outside professional services expense and Other expense ties to Other noninterest
expense in the Consolidated Statement of Income, pages 19 and 21 of the press release.
12,255
12,102
12,085
11,948
12,194
2Q13
3Q13
4Q13
1Q14
2Q14 |
 Wells Fargo
2Q14 Supplement 13
Community Banking
Net income of $3.4 billion, up 6% YoY
and down 11% LQ primarily on taxes
Regional
Banking
(1)
Primary consumer checking customers
(2)
up a net
4.6% YoY
Primary business checking customers
(2)
up a net
5.2% YoY
Retail bank cross-sell of 6.17 products per
household up from 6.14 in 2Q13
Consumer Lending
Credit card penetration
(1) (3)
rose to 39.0%, up
from 38.0% in 1Q14 and 34.9% in 2Q13
Consumer auto originations of $7.8 billion, down
1% LQ and up 9% YoY
Mortgage originations of $47 billion up 31% LQ
and down 58% YoY
-
5%
of
originations
were
from
HARP
(4)
vs.
7%
in
1Q14
and 9% in 2Q13
-
74% of originations were purchases, up from 44% in
2Q13
vs
vs
($ in millions)
2Q14
1Q14
2Q13
Net interest income
$
7,386
2
%
2
Noninterest income
5,220
(2)
(8)
Provision for credit losses
279
(33)
(63)
Noninterest expense
7,020
4
(3)
Income tax expense
1,820
32
11
Segment net income
$
3,431
(11)
%
6
($ in billions)
Avg loans, net
$
505.4
-
1
Avg core deposits
639.8
2
3
vs
vs
($ in billions)
2Q14
1Q14
2Q13
Consumer Lending
Credit card payment volumes (POS)
$
15.4
16
%
16
Credit card penetration
(1)(3)
39.0
%
98
bps
401
Home Lending
Applications
$
72
20
%
(51)
Application pipeline
30
11
(52)
Originations
47
31
(58)
Gain on sale margin
1.41
%
(20)
bps
(80)
2Q14
1Q14
2Q13
Regional Banking
Primary consumer checking customers
(1)(2)
4.6
%
5.1
3.5
Primary business checking customers
(1)(2)
5.2
5.1
Retail Bank household cross-sell
(1)
6.17
6.17
6.14
(1) Metrics reported on a one-month lag from reported quarter-end; for example
2Q14 data as of May 2014 compared with May 2013.
(2) Customers who actively use their checking account with transactions such as debit
card purchases, online bill payments, and direct deposit.
(3) Household penetration as of May 2014 and defined as the percentage of retail bank
households that have a credit card with Wells Fargo.
(4) Home Affordable Refinance Program. |
  Wells Fargo
2Q14 Supplement 14
Wholesale Banking
Net income of $2.0 billion, down 3% YoY and up
12% LQ
Net interest income up 2% LQ reflecting loan
growth; average loans up 2% on broad-based
growth
Noninterest income up 11% LQ on higher
investment banking, commercial real estate
brokerage, and asset management fees, as well
as a gain on the sale of 40 insurance offices
Cross-sell
Cross-sell
of
7.2
products
per
relationship
(2)
up
from 6.9 in 2Q13
Treasury Management
Commercial card spend volume of $5.6 billion up
6% LQ and 18% YoY
Wholesale treasury management revenue up 5%
LQ and 7% YoY reflecting new product sales and
2Q14 repricing
Investment Banking
U.S. investment banking market share
(3)
of 4.5%
Asset Management
Total AUM up $35 billion YoY on growth in long-
term assets driven by higher market valuations
and equity inflows, partially offset by money
market outflows
–
Equity AUM as a % of total AUM = 30%, up from
26% in 2Q13
(1) Please see page 1 for information on certain prior period revisions.
(2) Cross-sell reported on a one-quarter lag.
(3) Source: Dealogic U.S. investment banking fee market share.
vs
vs
($ in millions)
2Q14
1Q14
2Q13
Net interest income
$
2,953
2
%
(5)
Noninterest income
2,993
11
(1)
Reversal of provision for
credit losses
(49)
(47)
(58)
Noninterest expense
3,203
-
1
Income tax expense
838
17
(21)
Segment net income
$
1,952
12
%
(3)
($ in billions)
Avg loans, net
(1)
$
308.1
2
8
Avg core deposits
265.8
3
15
vs
vs
($ in billions)
2Q14
1Q14
2Q13
Key Metrics:
Cross-sell
(2)
7.2
-
%
4
Commercial card spend
volume
$
5.6
6
18
U.S. investment banking
market share %
(3)
4.5
%
50
bps
(130)
Total AUM
$
489.7
2
%
8
Advantage Funds AUM
235.0
-
7 |
 Wells Fargo
2Q14 Supplement 15
Wealth, Brokerage and Retirement
Net income up 25% YoY and 15% LQ
Net interest income up 1% LQ; average loans
up 2%
Noninterest income up 3% LQ as higher asset-
based fees and deferred compensation gains
were partially offset by lower brokerage
transaction revenue
–
Brokerage managed account asset fees priced
at beginning of quarter, reflecting 3/31/2014
market valuations
Noninterest expense down 1% LQ from
seasonally high 1Q14 personnel expenses,
partially offset by higher deferred compensation
plan and revenue-based incentive compensation
expenses
Retail Brokerage
Managed account assets of $409 billion, up 5%
LQ and 24% YoY driven by market performance
and net flows
Wealth Management
Wealth
Management
client
assets
up
2%
LQ
and
10% YoY
Retirement
IRA assets up 4% LQ and 13% YoY
Institutional Retirement plan assets up 3% LQ
and 12% YoY
(1) Includes deposits.
(2) Data as of May 2014.
vs
vs
($ in millions)
2Q14
1Q14
2Q13
Net interest income
$
775
1
%
11
Noninterest income
2,775
3
8
Reversal of provision for
credit losses
(25)
n.m.
n.m.
Noninterest expense
2,695
(1)
6
Income tax expense
334
15
26
Segment net income
$
544
15
%
25
($ in billions)
Avg loans, net
$
51.0
2
12
Avg core deposits
153.0
(2)
5
vs
vs
($ in billions, except where noted)
2Q14
1Q14
2Q13
Key Metrics:
WBR Client Assets
(1)
($ in trillions)
$
1.6
2
%
12
Cross-sell
(2)
10.44
-
1
Retail Brokerage
Financial Advisors
15,189
-
(1)
Managed account assets
$
409
5
24
Client assets
(1)
($ in trillions)
1.4
3
12
Wealth Management
Client assets
(1)
221
2
10
Retirement
IRA Assets
357
4
13
Institutional Retirement
Plan Assets
319
3
12 |
 Wells Fargo
2Q14 Supplement 16
Credit quality
Provision expense of $217 million, down $108
million from 1Q14
Net charge-offs of $717 million, down $108 million,
or 13%, LQ
0.35% net charge-off rate
-
Commercial losses of 0.03%, up 2 bps LQ
-
Consumer losses of 0.62%, down 13 bps LQ
NPAs declined $686 million LQ
-
$678 million decline in nonaccrual loans
Reserve release
(3)
of $500 million flat LQ
-
Continue to expect future reserve releases absent
significant deterioration in the economy, but
expect a lower level of future releases, reflecting
expected slower rate of improvement in credit
and continued loan growth
Allowance for credit losses = $13.8 billion
-
Allowance covered 4.8x annualized 2Q14
net charge-offs
(1) Please see page 1 for information on certain prior period revisions.
(2) 30-89 days and 90 days or more past due and still accruing, and
nonperforming loans, include held for sale loans reported on Balance Sheet.
(3) Provision expense minus net charge-offs.
Provision Expense and Net Charge-offs
($ in billions)
Nonperforming
Assets
(2)
($ in billions)
(1)
0.7
0.1
0.4
0.3
0.2
1.2
1.0
1.0
0.8
0.7
0.58%
0.48%
0.47%
0.41%
0.35%
2Q13
3Q13
4Q13
1Q14
2Q14
Net Charge-offs
Net charge-off rate
Provision Expense
17.9
16.9
15.7
14.7
14.0
3.2
3.8
3.9
4.1
4.1
21.1
20.7
19.6
18.8
18.1
2Q13
3Q13
4Q13
1Q14
2Q14
Nonaccrual loans
Foreclosed assets |
 Wells Fargo
2Q14 Supplement 17
Capital
Capital remained strong
Common Equity Tier 1 ratio under Basel III
(General Approach) of 11.31%
Common Equity Tier 1 ratio under Basel III
(Advanced Approach, fully phased-in) of
10.09% at 6/30/14
(1)
Period-end common shares outstanding down
15.8 million LQ
-
Purchased 39.4 million common shares
-
Issued 23.6 million common shares
-
Entered into a $1.0 billion forward
repurchase transaction which is expected to
settle in 3Q14 for an estimated 19.4 million
shares
Common Equity Tier 1 Ratio
Under Basel I
Basel III
(General Approach)
10.71%
10.60%
10.82%
11.36%
11.31%
2Q13
3Q13
4Q13
1Q14
2Q14
See pages 28-29 for additional information regarding common equity ratios. 2Q14 capital
ratios are preliminary estimates.
(1) Estimated based on final rules adopted July 2, 2013, by the Federal Reserve Board
establishing a new comprehensive capital framework for U.S. banking organizations that
would implement the Basel III capital framework and certain provisions of the Dodd-Frank Act.
|
 Wells Fargo
2Q14 Supplement 18
Summary
2Q14
-
Diluted EPS of $1.01, up 3%
-
ROA = 1.47%
-
ROE = 13.40%
-
Loans
(1)
up $29.0 billion, or 4%, with core loans up $51.3 billion, or 7%, on broad-based
growth -
Deposits up $97.0 billion, or 9%
-
Net charge-offs of 0.35%, down 23 bps
-
Returned $3.6 billion to shareholders through common stock dividends and net share repurchases
including $1.0 billion forward repurchase transaction expected to settle in 3Q14
-
Net payout ratio
(2)
of 66%
All comparisons are 2Q14 compared with 2Q13.
(1) Please see page 1 for information on certain prior period revisions.
(2) Net payout ratio means the ratio of (i) common stock dividends and share repurchases
less issuances, divided by (ii) net income applicable to common stock. Strong earnings of
$5.7 billion, up $207 million, or 4% from 2Q13 Solid returns
Strong loan and deposit growth
Improved credit quality
Increased capital return to shareholders
Well positioned for the future |
 Appendix |
 Wells Fargo
2Q14 Supplement 20
(1) Net of purchase accounting adjustments.
-$103.2
Non-strategic/liquidating loan portfolio
-$3.5
-$125.5
-$3.2
-$2.9
-$12.7
$9.7 billion Education Finance –
government guaranteed loan portfolio transferred to loans held for sale (HFS)
($ in billions)
2Q14
1Q14
4Q13
3Q13
2Q13
4Q08
Pick-a-Pay mortgage
(1)
$
48.0
49.5
51.0
52.8
54.8
95.3
Liquidating home equity
3.3
3.5
3.7
3.9
4.2
10.3
Legacy WFF indirect auto
0.1
0.1
0.2
0.3
0.5
18.2
Legacy WFF debt consolidation
12.2
12.6
12.9
13.3
13.7
25.3
Education Finance -
gov't guaranteed
-
10.2
10.7
11.1
11.5
20.5
Legacy WB C&I, CRE and foreign PCI loans
(1)
1.5
1.7
2.0
2.3
2.5
18.7
Legacy WB other PCI loans
(1)
0.2
0.4
0.4
0.4
0.4
2.5
Total
$
65.3
78.0
80.9
84.1
87.6
190.8 |
 Wells Fargo
2Q14 Supplement 21
Purchased credit-impaired (PCI) portfolios
Nonaccretable difference
$3.1 billion remains to absorb losses on PCI loans following $2.0 billion reclassification to
accretable yield Accretable yield
$362 million accreted into interest income in 2Q14 vs. $375 million in 1Q14
Balance increased $1.3 billion LQ
$2.0 billion reclassification from nonaccretable difference, primarily driven by the
Pick-a-Pay portfolio $18.4
billion
expected
to
accrete
to
income
over
the
remaining
life
of
the
underlying
loans
($ in billions)
Adjusted
unpaid
principal
balance
(1)
December 31, 2008
$
29.2
62.5
6.5
98.2
June 30, 2014
2.4
27.6
0.7
30.7
Nonaccretable
difference
rollforward
12/31/08 Nonaccretable difference
$
10.4
26.5
4.0
40.9
Addition of nonaccretable difference due to acquisitions
0.2
-
-
0.2
Losses from loan resolutions and write-downs
(6.9)
(17.9)
(2.9)
(27.7)
Release of nonaccretable difference since merger
(3.6)
(5.8)
(0.9)
(10.3)
(2)
6/30/14 Remaining nonaccretable difference
0.1
2.8
0.2
3.1
Life-to-date net performance
Additional provision since 2008 merger
$
(1.6)
-
(0.1)
(1.7)
Release of nonaccretable difference since 2008 merger
3.6
5.8
0.9
10.3
(2)
Net performance
2.0
5.8
0.8
8.6
Commercial
Pick-a-Pay
Other
consumer
Total
$272 million reduction largely due to higher pre-pay expectations on the
Pick-a-Pay portfolio $362 million accreted into interest income
-
Commercial accretable yield balance of $426 million; weighted average life of portfolio is 2.1
years -
Pick-a-Pay accretable yield balance of $17.6 billion; weighted average life of 12.1
years •
2Q14 accretable yield percentage of 4.98% will increase in 3Q14 to ~6.15% on the $2.0 billion
reclassification (1) Includes write-downs taken on loans where severe
delinquency (normally 180 days) or other indications of severe borrower financial stress
exist that indicate there will be a loss of contractually due amounts upon final resolution of
the loan. (2)
Reflects releases of $1.9 billion for loan resolutions and $8.4 billion from the
reclassification of nonaccretable difference to the accretable yield, which will result
in increasing income over the remaining life of the loan or pool of loans.
|
  Wells Fargo 2Q14
Supplement 22
Residential mortgage trends
Mortgage production
-
74% of originations were purchases, up from 66% in 1Q14 and 44% in 2Q13
Mortgage repurchase liability
Servicing portfolio
-
Wells
Fargo
servicing
portfolio’s
total
delinquency
and
foreclosure
ratio
for
2Q14
was
5.64%,
up
8
bps
LQ
and
down 101 bps YoY
(1) Net gains on mortgage loan origination/or sales activities less repurchase reserve
build divided by total originations. Residential mortgage production trends
($ in billions)
2Q14
1Q14
4Q13
3Q13
2Q13
Applications
$
72
60
65
87
146
Pipeline
30
27
25
35
63
Originations
47
36
50
80
112
Refinance %
26
%
34
32
41
56
Purchase %
74
66
68
59
44
Gain on Sale
(1)
1.41
1.61
1.77
1.42
2.21
$47 billion of mortgage originations, up 31% LQ
$766 million mortgage repurchase liability included a $26 million release in the quarter vs. a
$6 million build in 1Q14
Residential servicing portfolio of $1.8 trillion |
 Wells Fargo
2Q14 Supplement 23
Real estate 1-4 family first mortgage portfolio
First lien mortgage loans relatively stable as growth
in core first lien mortgage was partially offset by
continued run-off in the liquidating portfolio
Core first lien up $2.6 billion, or 1%, reflecting
nonconforming mortgage originations
-
Nonconforming mortgages increased $8.1 billion
to $95.5 billion
(4)
-
First lien home equity lines and loans of $17.7
billion, down $239 million
(2)
Strong core first lien credit performance
-
Nonaccrual loans down $130 million LQ
-
Net charge-offs down $37 million LQ to 9 bps
Pick-a-Pay non-PCI portfolio
(1) The carrying value, which does not reflect the allowance for loan losses, includes
purchase accounting adjustments, which, for PCI loans, are the
nonaccretable difference and the accretable yield, and for all other loans, an
adjustment
to
mark
the
loans
to
a
market
yield
at
date
of
merger
less
any
subsequent charge-offs.
(2) Includes
first
lien
liquidating
home
equity
lines
and
loans
of
$144
million
and
$156 million in 2Q14 and 1Q14, respectively.
(3) Ratios
on
Legacy
WFF
debt
consolidation
first
mortgage
loan
portfolio
only.
(4) Nonconforming mortgages originated post February 2009.
(5) Current LTV calculated as net carrying value divided by collateral value.
($ in millions)
2Q14
1Q14
Total real estate 1-4 family first mortgage
$
260,104
259,478
Less consumer non-strategic/liquidating portfolios:
Pick-a-Pay non-PCI first lien mortgage
25,301
26,241
PCI first lien mortgage
22,888
23,530
Debt consolidation first mortgage portfolio
11,930
12,292
Core first lien mortgage
199,985
197,415
Non-PCI loans
Nonaccrual loans
$
3,113
3,253
as % of loans
12.30
%
12.40
Net charge-offs
$
29
24
as % of average loans
0.30
%
0.36
90+ days past due as % of loans
8.29
8.57
PCI loans carrying value
(1)
22,664
23,292
Nonaccrual loans
$
2,031
2,092
Net charge-offs
$
74
65
Pick-a-Pay first lien mortgage
Legacy
WFF
debt
consolidation
first
mortgage
(3)
(1)
(1)
(2)
Nonaccrual loans
$
3,882
4,012
as % of loans
1.94
%
2.03
Net charge-offs
$
44
81
as % of loans
0.09
%
0.17
Core
first
lien
mortgage
(2)
-
Loans down 4% LQ driven by loans paid-in-full
-
87% of portfolio current
-
72% of portfolio with LTV
(5)
<80%, up from 69%
in 1Q14
-
Nonaccrual loans decreased $140 million,
or 4%, LQ
•
$142 million of nonaccrual TDRs reclassified to
accruing TDR status based on borrower
payment performance
•
$3.1 billion in nonaccruals included $1.7 billion of
nonaccruing TDRs
-
Net charge-offs of $19 million down $5
million LQ |
 Wells Fargo
2Q14 Supplement 24
Real estate 1-4 family junior lien mortgage portfolio
Outstandings
down 2% LQ
-
High quality new originations with weighted
average CLTV of 67%, 776 FICO and 33% total
debt service ratio
Net charge-offs down $32 million, or 18 bps, LQ
2+ delinquencies decreased $72 million, or 6 bps
Delinquency rate for loans with a CLTV >100%
decreased 7 bps
49% in junior lien position behind WFC owned or
serviced 1
lien
-
Current 1
st
lien, Current junior lien = 96.8%
-
Current 1
st
lien, Delinquent junior lien = 1.0%
-
Delinquent 1
st
lien, Current junior lien = 1.0%
-
Delinquent 1
st
lien, Delinquent junior lien = 1.2%
51% in junior lien position behind third party 1
st
lien
(1) CLTV
is
calculated
based
on
outstanding
balance
plus
unused
lines
of
credit
divided
by estimated home value. Estimated home values are determined predominantly
based on automated valuation models updated through May 2014.
(2) Unsecured balances, representing the percentage of outstanding balances above
the most recent home value.
($ in millions)
2Q14
1Q14
Outstandings
62,455
63,965
Net charge-offs
160
192
as % of avg loans
1.02
%
1.20
2+ payments past due
1,489
1,561
as % of loans
2.39
%
2.45
% CLTV > 100%
(1)
24
27
2+ payments past due
2.79
%
2.86
% Unsecured balances
(2)
11
12
st |
  Wells Fargo
2Q14 Supplement 25
Consumer credit card portfolio
Credit card outstandings up 4% LQ and 10% YoY
reflecting account growth
-
New accounts
(1)
down 2% LQ and up
4% YoY
-
Credit card household penetration
(2)
of 39.0%,
up 98 bps LQ and 401 bps YoY
-
Purchase dollar volume up 16% LQ and YoY
reflecting growth in the account base
-
POS transactions up 14% LQ and 18% YoY
Net charge-offs down $20 million, or 37 bps, LQ
(1)
Consumer credit card new account openings, excludes private label.
(2)
Household penetration as of May 2014 and defined as the percentage of retail banking deposit
households that have a credit card with Wells Fargo. ($ in millions)
2Q14
1Q14
Credit card outstandings
$
27,215
26,061
Net charge-offs
211
231
as % of avg loans
3.20
%
3.57
Key Metrics:
Purchase volume
$
15,388
13,280
POS transactions (millions)
215
188
New accounts
(1)
601,631
613,157
Penetration
(2)
39.0
%
38.0 |
 Wells Fargo
2Q14 Supplement 26
Auto portfolios
(1)
Consumer Portfolio
Auto outstandings of $54.1 billion up 3% LQ and
11% YoY
-
2Q14 originations of $7.8 billion down 1% LQ
and up 9% YoY
Nonaccrual loans declined $11 million LQ and $50
million YoY
Net charge-offs were down $44 million LQ
reflecting seasonality, and up $4 million YoY
-
June Manheim index of 124.0 stable LQ and up
4% from June 2013
30+ days past due increased $208 million, or 34
bps, LQ reflecting seasonality and increased $251
million, or 31 bps, YoY
Commercial Portfolio
Loans of $8.7 billion up 3% LQ and 14% YoY
(1)
The consumer auto portfolio includes the liquidating legacy Wells Fargo Financial indirect
portfolio of $85 million. ($ in millions)
2Q14
1Q14
Auto outstandings
$
51,345
50,058
Nonaccrual loans
142
150
as % of loans
0.28
%
0.30
Net charge-offs
$
46
89
as % of avg loans
0.36
%
0.73
30+ days past due
$
944
737
as % of loans
1.84
%
1.47
Auto outstandings
$
2,750
2,549
Nonaccrual loans
8
11
as % of loans
0.29
%
0.43
Net charge-offs
$
-
1
as % of avg loans
0.05
%
0.22
30+ days past due
$
10
9
as % of loans
0.36
%
0.35
Commercial
Auto outstandings
$
8,705
8,477
Nonaccrual loans
18
19
as % of loans
0.21
%
0.22
Net charge-offs
$
-
-
as % of avg loans
n.m.
%
n.m.
Indirect Consumer
Direct Consumer |
 Wells Fargo
2Q14 Supplement 27
Student lending portfolio
$21.4 billion student loan outstandings down
2% LQ
Private Portfolio
$11.6 billion private loan outstandings down 1%
LQ and 6% YoY
-
Average FICO of 752 and 80% of the total
outstandings have been co-signed
-
Originations up 10% YoY
Credit remained strong with net charge-offs stable
and 30+ days past due down LQ
Government Portfolio
$9.7 billion liquidating government guaranteed
outstandings declined 5% LQ and 16% YoY
-
Transferred to HFS at the end of 2Q14
from held for investment
($ in millions)
2Q14
1Q14
Education Finance
Held for investment
$
11,633
21,907
Held for sale
9,743
0
Total outstandings
21,376
21,907
Private Portfolio
Private outstandings
$
11,633
11,703
Net charge-offs
33
33
as % of avg loans
1.14
%
1.14
30 days past due
$
195
223
as % of loans
1.68
%
1.90
Government Guaranteed Portfolio
Government outstandings
$
0
10,204 |
 Wells Fargo
2Q14 Supplement 28
Common Equity Tier 1 under Basel III (General
Approach) Wells Fargo & Company
FIVE QUARTER RISK-BASED CAPITAL COMPONENTS
Under Basel III
(General Approach) (1)
June 30,
Mar. 31,
Dec. 31,
Sept 30,
June 30,
(in billions)
2014
2014
2013
2013
2013
Total equity
$
181.5
176.5
171.0
168.8
163.8
Noncontrolling interests
(0.6)
(0.8)
(0.9)
(1.6)
(1.4)
Total Wells Fargo stockholders' equity
180.9
175.7
170.1
167.2
162.4
Adjustments:
Preferred stock
(17.2)
(15.2)
(15.2)
(14.3)
(12.6)
Cumulative other comprehensive income (2)
(3.2)
(2.2)
(1.4)
(2.2)
(1.8)
Goodwill and other intangible assets (2)(3)
(25.6)
(25.6)
(29.6)
(29.8)
(30.0)
Investment in certain subsidiaries and other
(0.1)
-
(0.4)
(0.6)
(0.5)
Common Equity Tier 1 (1)(4)
(A)
134.8
132.7
123.5
120.3
117.5
Preferred stock
17.2
15.2
15.2
14.3
12.6
Qualifying hybrid securities and noncontrolling interests
-
-
2.0
2.9
2.9
Other
(0.3)
(0.3)
-
-
-
Total Tier 1 capital
151.7
147.6
140.7
137.5
133.0
Long-term debt and other instruments qualifying as Tier 2
24.0
21.7
20.5
18.9
18.0
Qualifying allowance for credit losses
13.8
14.1
14.3
14.3
13.8
Other
-
0.2
0.7
0.6
0.2
Total Tier 2 capital
37.8
36.0
35.5
33.8
32.0
Total qualifying capital
(B) $
189.5
183.6
176.2
171.3
165.0
Basel III (General Approach) / Basel I Risk-Weighted Assets (RWAs)
(5)(6): Credit risk
$
1,144.9
1,120.3
1,105.2
1,099.2
1,061.1
Market risk
46.8
48.1
36.3
35.9
36.3
Total Basel III (General Approach) / Basel I RWAs
(C) $
1,191.7
1,168.4
1,141.5
1,135.1
1,097.4
Capital Ratios (6):
Common Equity Tier 1 to total RWAs
(A)/(C)
11.31
%
11.36
10.82
10.60
10.71
Total capital to total RWAs
(B)/(C)
15.90
15.71
15.43
15.09
15.03
(1)
(2)
(3)
(4)
(5)
(6)
Under the regulatory guidelines for risk-based capital,
on-balance sheet assets and credit equivalent amounts of derivatives and off-balance sheet items are assigned to one of
several broad risk categories according to the obligor, or, if
relevant, the guarantor or the nature of any collateral. The aggregate dollar amount in each risk category is then
multiplied by the risk weight associated with that category. The
resulting weighted values from each of the risk categories are aggregated for determining total RWAs.
The Company's June 30, 2014, RWAs and capital ratios are
preliminary. Under transition provisions to Basel III, cumulative
other comprehensive income (previously deducted under Basel I) is included in CET1 over a specified phase-in period. In
addition, certain intangible assets includable in CET1 are phased out
over a specified period. Goodwill and other intangible assets are
net of any associated deferred tax liabilities. CET1 (formerly
Tier 1 common equity under Basel I) is a non-GAAP financial measure that is used by investors, analysts and bank regulatory agencies to assess the capital
position of financial services companies. Management reviews CET1 along
with other measures of capital as part of its financial analyses and has included this non-GAAP
financial information, and the corresponding reconciliation to total
equity, because of current interest in such information on the part of market participants.
Basel III revises the definition of capital, increases minimum capital
ratios, and introduces a minimum Common Equity Tier 1 (CET1) ratio. These changes are being phased
in effective January 1, 2014 through the end of 2021, and the capital
ratios will be determined using Basel I (General Approach) RWAs during 2014.
Under Basel I |
 Wells Fargo
2Q14 Supplement 29
Common Equity Tier 1 under Basel III (Advanced Approach, fully
phased-in)
Wells Fargo & Company
COMMON EQUITY TIER 1 UNDER BASEL III (ADVANCED APPROACH, FULLY
PHASED-IN) (1)(2)
(in billions)
June 30, 2014
Common Equity Tier 1 (transition amount) under Basel III
134.8
$
Adjustments from transition amount to fully phased-in under Basel
III (3): Cumulative other comprehensive income
3.2
Other
(2.6)
Total adjustments
0.6
Common Equity Tier 1 (fully phased-in) under Basel III
(C)
135.4
$
Total RWAs anticipated under Basel III (4)
(D)
1,342.4
$
Common Equity Tier 1 to total RWAs anticipated under Basel III
(Advanced Approach, fully phased-in) (C)/(D)
10.09
%
(1)
(2)
(3)
(4)
The Basel III CET1 and RWA are estimated based on the Basel III capital
rules adopted July 2, 2013, by the FRB. The rules establish a new comprehensive capital framework
for U.S. banking organizations that implement the Basel III capital
framework and certain provisions of the Dodd-Frank Act. The rules are being phased in effective January
1, 2014 through the end of 2021.
Assumes cumulative other comprehensive income is fully phased in and
certain other intangible assets are fully phased out under Basel III capital rules.
The final Basel III capital rules provide for two capital frameworks:
the Standardized Approach intended to replace Basel I, and the Advanced Approach applicable to certain
institutions. Under the final rules, we will be subject to the lower of
our CET1 ratio calculated under the Standardized Approach and under the Advanced Approach in the
assessment of our capital adequacy. Accordingly, the estimate of RWAs
has been determined under the Advanced Approach because management's estimate of RWAs is
currently higher using the Advanced Approach, and thus results in a
lower CET1, compared with the Standardized Approach. Basel III capital rules adopted by the Federal
Reserve Board incorporate different classification of assets, with risk
weights based on Wells Fargo's internal models, along with adjustments to address a combination of
credit/counterparty, operational and market risks, and other Basel III
elements. CET1 (formerly Tier 1 common equity under Basel I) is a
non-GAAP financial measure that is used by investors, analysts and bank regulatory agencies to assess the capital
position of financial services companies. Management reviews CET1 along
with other measures of capital as part of its financial analyses and has included this non-GAAP
financial information, and the corresponding reconciliation to total
equity, because of current interest in such information on the part of market participants. |
| Wells Fargo
2Q14 Supplement 30
Forward-looking statements and additional information
Forward-looking statements:
This document contains “forward-looking statements”
within the meaning of the Private Securities Litigation Reform Act of 1995. In addition, we
may make forward-looking statements in our other documents filed or furnished with
the SEC, and our management may make forward-looking statements orally to analysts,
investors, representatives of the media and others. Forward-looking statements can
be identified by words such as “anticipates,”
“intends,”
“plans,”
“seeks,”
“believes,”
“estimates,”
“expects,”
“target,”
“projects,”
“outlook,”
“forecast,”
“will,”
“may,”
“could,”
“should,”
“can”
and similar references to future periods. In particular, forward-looking statements
include, but are not limited to, statements we make about: (i) the future operating or
financial performance of the Company, including our outlook for future growth; (ii) our
noninterest expense and efficiency ratio; (iii) future credit quality and performance,
including our expectations regarding future loan losses and allowance releases; (iv)
the appropriateness of the allowance for credit losses; (v) our expectations regarding net
interest income and net interest margin; (vi) loan growth or the reduction or
mitigation of risk in our loan portfolios; (vii) future capital levels and our estimated Common Equity Tier 1 ratio under Basel III
capital standards; (viii) the performance of our mortgage business and any related exposures;
(ix) the expected outcome and impact of legal, regulatory and legislative developments,
as well as our expectations regarding compliance therewith; (x) future common stock dividends, common
share repurchases and other uses of capital; (xi) our targeted range for return on assets and
return on equity; (xii) the outcome of contingencies, such as legal proceedings; and
(xiii) the Company’s plans, objectives and strategies. Forward-looking statements are not based on historical facts
but instead represent our current expectations and assumptions regarding our business, the
economy and other future conditions. Investors are urged to not unduly rely on
forward-looking statements as actual results could differ materially from expectations. Forward-looking statements
speak only as of the date made, and we do not undertake to update them to reflect changes or
events that occur after that date. For more information about factors that could cause
actual results to differ materially from expectations, refer to the “Forward-Looking Statements”
discussion in Wells Fargo’s press release announcing our second quarter 2014 results and
in our most recent Quarterly Report on Form 10-Q, as well as to Wells Fargo’s
other reports filed with the Securities and Exchange Commission, including the discussion under “Risk Factors”
in our
Annual Report on Form 10-K for the year ended December 31, 2013.
Purchased credit-impaired loan portfolio:
Loans that were acquired from Wachovia that were considered credit impaired were written down
at acquisition date in purchase accounting to an amount estimated to be collectible and
the related allowance for loan losses was not carried over to Wells Fargo’s
allowance. In addition, such purchased credit-impaired loans are not classified as
nonaccrual or nonperforming, and are not included in loans that were contractually 90+ days
past due and still accruing. Any losses on such loans are charged against the nonaccretable
difference established in purchase accounting and are not reported as charge-offs
(until such difference is fully utilized). As a result of accounting for purchased loans with evidence of credit
deterioration, certain ratios of the combined company are not comparable to a portfolio that
does not include purchased credit-impaired loans. In certain cases, the purchased
credit-impaired loans may affect portfolio credit ratios and trends. Management believes that the presentation of
information adjusted to exclude the purchased credit-impaired loans provides useful
disclosure regarding the credit quality of the non-impaired loan portfolio.
Accordingly, certain of the loan balances and credit ratios in this document have been adjusted to exclude the purchased credit-impaired
loans. References in this document to impaired loans mean the purchased credit-impaired
loans. Please see pages 32-34 of the press release announcing our 2Q14 results for
additional information regarding the purchased credit-impaired loans.
|