Attached files
| file | filename |
|---|---|
| 8-K - 8-K - CMS ENERGY CORP | a14-16829_18k.htm |
Exhibit 99.1
|
|
Investor Meetings July 10 & 11, 2014 |

|
|
This presentation is made as of the date hereof and contains “forward-looking statements” as defined in Rule 3b-6 of the Securities Exchange Act of 1934, Rule 175 of the Securities Act of 1933, and relevant legal decisions. The forward-looking statements are subject to risks and uncertainties. All forward-looking statements should be considered in the context of the risk and other factors detailed from time to time in CMS Energy’s and Consumers Energy’s Securities and Exchange Commission filings. Forward-looking statements should be read in conjunction with “FORWARD-LOOKING STATEMENTS AND INFORMATION” and “RISK FACTORS” sections of CMS Energy’s and Consumers Energy’s Form 10-K for the year ended December 31, 2013 and as updated in subsequent 10-Qs. CMS Energy’s and Consumers Energy’s “FORWARD-LOOKING STATEMENTS AND INFORMATION” and “RISK FACTORS” sections are incorporated herein by reference and discuss important factors that could cause CMS Energy’s and Consumers Energy’s results to differ materially from those anticipated in such statements. CMS Energy and Consumers Energy undertake no obligation to update any of the information presented herein to reflect facts, events or circumstances after the date hereof. The presentation also includes non-GAAP measures when describing CMS Energy’s results of operations and financial performance. A reconciliation of each of these measures to the most directly comparable GAAP measure is included in the appendix and posted on our website at www.cmsenergy.com. CMS Energy provides historical financial results on both a reported (Generally Accepted Accounting Principles) and adjusted (non-GAAP) basis and provides forward-looking guidance on an adjusted basis. Management views adjusted earnings as a key measure of the company’s present operating financial performance, unaffected by discontinued operations, asset sales, impairments, regulatory items from prior years, or other items. These items have the potential to impact, favorably or unfavorably, the company's reported earnings in future periods. Because the company is not able to estimate the impact of these matters, the company is not providing a reconciliation to the comparable future period reported earnings. 1 |
|
|
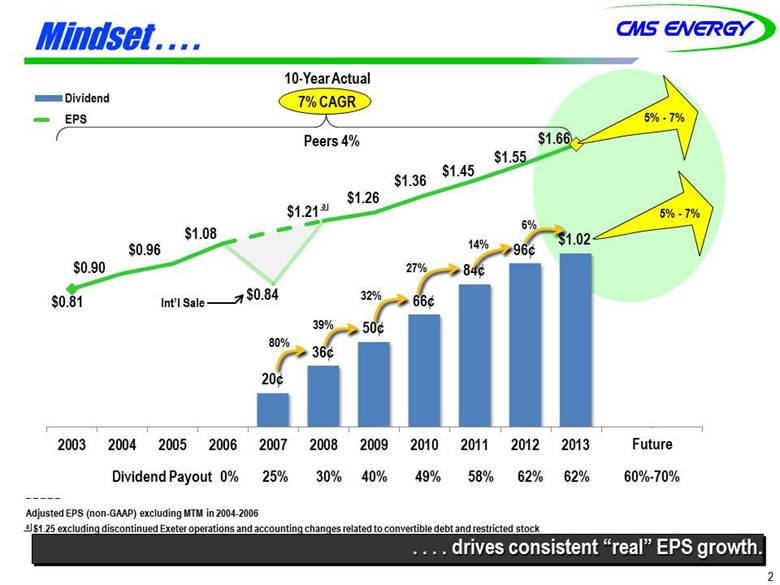
Mindset . . . . 2 . . . . drives consistent “real” EPS growth. $0.81 _ _ _ _ _ Adjusted EPS (non-GAAP) excluding MTM in 2004-2006 a $1.25 excluding discontinued Exeter operations and accounting changes related to convertible debt and restricted stock Int’l Sale a 10-Year Actual 7% CAGR Dividend Payout 0% 25% 30% 40% 49% 58% 62% 62% 60%-70% 32% 27% 14% 39% 80% Peers 4% 6% 5% - 7% 5% - 7% $1.66 Future |
|
|
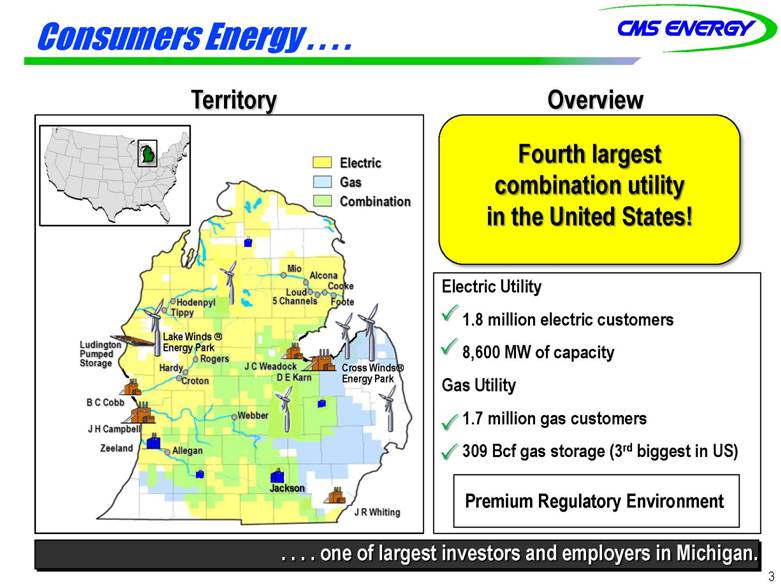
Electric Utility 1.8 million electric customers 8,600 MW of capacity Gas Utility 1.7 million gas customers 309 Bcf gas storage (3rd biggest in US) Consumers Energy . . . . Territory . . . . one of largest investors and employers in Michigan. Lake Winds Energy Park 3 Fourth largest combination utility in the United States! Overview Premium Regulatory Environment Jackson Cross Winds Energy Park |
|
|
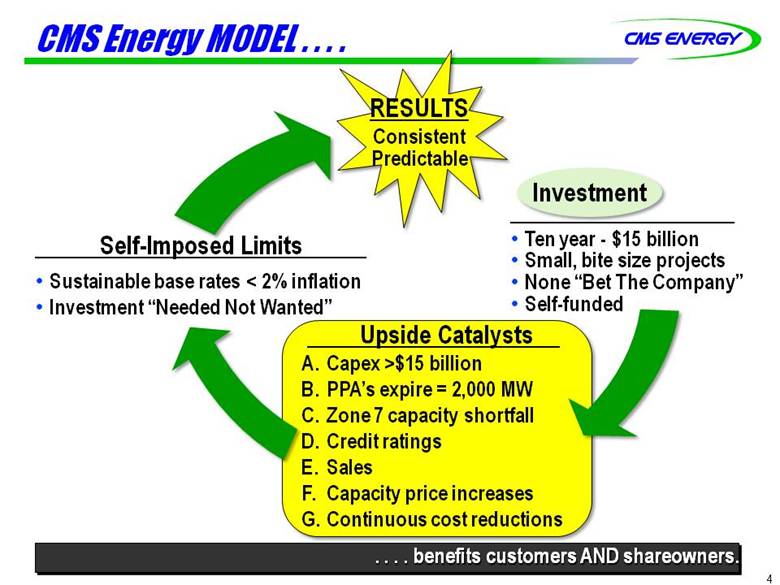
CMS Energy MODEL . . . . Investment Ten year - $15 billion Small, bite size projects None “Bet The Company” Self-funded Upside Catalysts A. Capex >$15 billion B. PPA’s expire = 2,000 MW C. Zone 7 capacity shortfall D. Credit ratings E. Sales F. Capacity price increases G. Continuous cost reductions Self-Imposed Limits Sustainable base rates < 2% inflation Investment “Needed Not Wanted” RESULTS Consistent Predictable . . . . benefits customers AND shareowners. 4 |
|
|
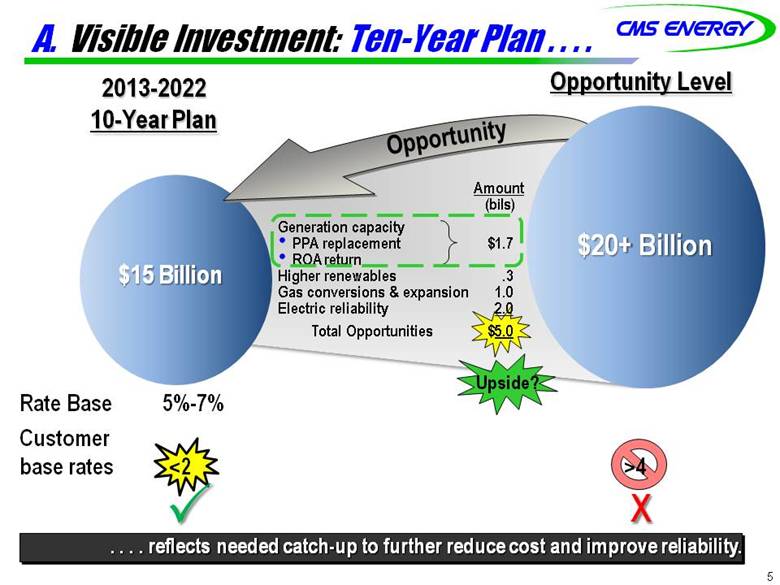
A. Visible Investment: Ten-Year Plan . . . . 5 . . . . reflects needed catch-up to further reduce cost and improve reliability. 2013-2022 10-Year Plan Opportunity Level $15 Billion $20+ Billion Opportunity Amount (bils) Generation capacity PPA replacement $1.7 ROA return Higher renewables .3 Gas conversions & expansion 1.0 Electric reliability 2.0 Total Opportunities $5.0 X Rate Base 5%-7% Customer base rates <2 >4 Upside? |
|
|
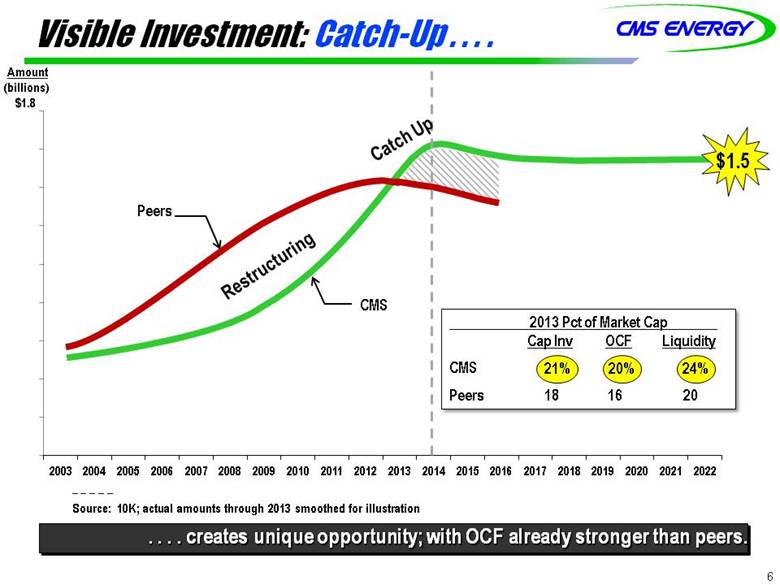
Visible Investment: Catch-Up . . . . 6 2013 Pct of Market Cap Cap Inv OCF Liquidity CMS 21% 20% 24% Peers 18 16 20 21% 20% 24% . . . . creates unique opportunity; with OCF already stronger than peers. Amount (billions) $1.8 CMS Peers _ _ _ _ _ Source: 10K; actual amounts through 2013 smoothed for illustration Restructuring Catch Up $1.5 |
|
|
Visible Investment: Customer-Driven . . . . Clean Power $2.3 Billion Reliability $4.2 Billion . . . . ten-year plan small and incremental with no big bets. Renewable energy Jackson gas plant Gas storage Propane switching Gas transmission Gas distribution Electric reliability Consumers Smart Energy Electric distribution Capacity $1.6 Billion Infrastructure $5.4 Billion Environmental New gas capacity Ludington Pumped Storage 7 |

|
|
Visible Investment: Ten-Year Plan . . . . . . . . clear for next ten years – needed, not just wanted. Amount (bils) $ Environmental Gas Smart Energy Maintenance $5 $7 $8 New Generation Gas Electric Reliability Renewables 8 |
|
|
B. PPA’s Expire and MISO Zone 7 Shortage . . . . 9 . . . . replacement not yet in plan! Ten-year Capacity Growth ~780 MW 1,240 MW MW PPA 2,600 capacity ~30% ~8,600 MW 540 MW 410 MW Shortfall Owned (6,000) 780 MW 8,600 MW 1,000 MW PPA ~Potential for 3,000 MW of owned capacity 2 GW 11,000 Further Upside |
|
|
C. MISO Zone 7 Forecast . . . . 10 . . . . expected shortfall of 2.0 GW in 2016. As of June 2, 2014 (in GW) 22.8 3.2 21.6 24.8 Reserves Demand 2.0 |
|
|
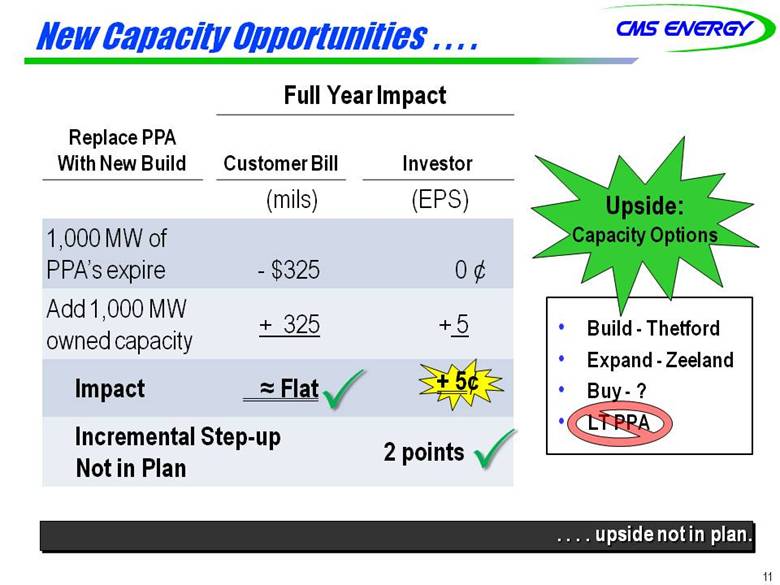
New Capacity Opportunities . . . . Replace PPA With New Build Full Year Impact Customer Bill Investor (mils) (EPS) 1,000 MW of PPA’s expire - $325 0 ¢ Add 1,000 MW owned capacity + 325 + 5 Impact Flat Incremental Step-up Not in Plan 2 points Build - Thetford Expand - Zeeland Buy - ? LT PPA 11 . . . . upside not in plan. + 5¢ Upside: Capacity Options |
|
|
Consumers Appears to be in a Good Carbon Position . . . . 12 . . . . but lots of work to understand new guidelines. Carbon Tonnage Reduction (Preliminary) Million Tons of CO2 U.S. Presidential Target Consumers Energy On 2014 2030 2019 2024 2029 target |
|
|
D. Credit Ratings . . . . . . . . recently upgraded, more ahead? Consistent Performance Less Risk Customer Focus Constructive Regulation Good Energy Policy Reflects Present Prior 2002 Scale S&P / Fitch Moody’s S&P (March) Moody’s (January) Fitch (February) A+ A1 A A2 Consumers Secured A- A3 BBB+ Baa1 BBB Baa2 BBB- Baa3 BB+ Ba1 CMS Unsecured BBB Baa2 BBB- Baa3 BB+ Ba1 BB Ba2 BB- Ba3 B+ B1 B B2 B- B3 Outlook Positive Stable Stable 13 |
|
|
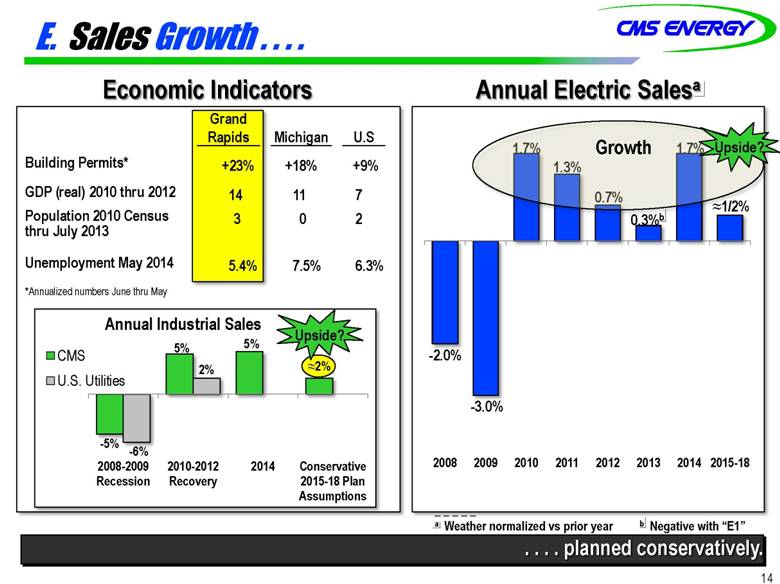
E. Sales Growth . . . . . . . . planned conservatively. Annual Electric Salesa Economic Indicators Annual Industrial Sales Grand Rapids Michigan U.S Building Permits* +23% +18% +9% GDP (real) 2010 thru 2012 14 11 7 Population 2010 Census thru July 2013 3 0 2 Unemployment May 2014 5.4% 7.5% 6.3% *Annualized numbers June thru May _ _ _ _ _ a Weather normalized vs prior year b Negative with “E1” 14 Growth Upside? Upside? |
|
|
Michigan Economy . . . . . . . . among the best in the nation. Gross Domestic Product – 2010 through 2013 Source: U.S. Department of Commerce – bea.gov, real GDP 2009 chained dollars, 2013 advance and 2009 – 2012 revised, 6/12/14 Highest quintile Fourth quintile Third quintile Second quintile Lowest quintile 11.4% WA 8.8 OR 17.3 CA 7.6 NV 3.2 MT 11.6 ID 5.5 WY 4.3 UT 14.5 AZ 7.6 NM 3.6 CO 10.3 ND 54.9 SD 11.3 NE 13.1 KS 9.4 OK 11.8 TX 18.9 MN 11.5 IA 10.3 MO 3.0 AR 9.4 LA 5.8 WI 7.4 IL 5.4 MS 5.2 AL 6.9 TN 8.9 MI 11.4 IN 12.1 OH 10.5 KY 9.3 VA 5.0 WV 9.2 PA 5.7 MD 5.9 DE 3.5 NJ 4.1 NY 6.5 CT 1.7 RI 5.0 NH 6.2 MA 9.8 ME 1.7 DC 3.5 HI 7.7 AK 3.2 FL 4.0 GA 5.1 SC 7.6 NC 7.4 VT 9.8 U.S. Total = 8.4% 15 Top 10 |

|
|
F. Capacity Price Market Increases . . . . 16 . . . . could add value to the 700 MW “DIG” plant. Capacity price ($ kW per month) Today (mils) Future Scenarios (mils) $55 $35 +$50 Opportunity Recent Contracts DIG “energy” contract 9 years 250 MW @ $4.06 kW per month < +$30 $5 Upside: Capacity and energy contracts layered in over time |
|
|
G. Continuous O&M Cost Reductions . . . . 17 . . . . holds down rates and allows better system reliability. _ _ _ _ _ a O&M Change excluding major storms Amount (mils) $ |
|
|
O&M Cost Control . . . . 18 Average Annual O&M Change +6% Peers -2% -2% Average -3% Plan Conservatively Upside? _ _ _ _ _ a -8% Before reinvestment Peers +2% Peers CMS Future Examples Fuel Mix Benefits MW Employees 2016 Retire Coal - 900 - 300 2016 Add GCC + 540 + 20 Total -360 - 280 Future Savings (mils) $25 2002-2012 Actions completed $25 2013 EGWP, OPEB & other 50 $75 Fuel and Benefits $100 Future Annual Savings (mils) . . . . at peer leading pace. CMS -1% Future Savings |

|
|
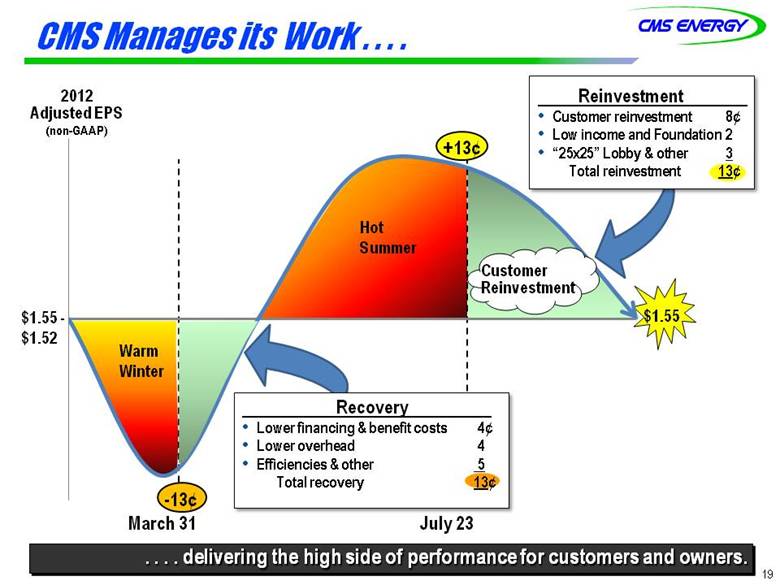
CMS Manages its Work . . . . 19 Adjusted EPS (non-GAAP) -13¢ $1.55 Hot Summer . . . . delivering the high side of performance for customers and owners. +13¢ Customer Reinvestment Hot Summer Reinvestment Customer reinvestment 8¢ Low income and Foundation 2 “25x25” Lobby & other 3 Total reinvestment 13¢ Warm Winter $1.55 - $1.52 Recovery Lower financing & benefit costs 4¢ Lower overhead 4 Efficiencies & other 5 Total recovery 13¢ 2012 |
|
|
Adjusted EPS (non-GAAP) . . . . deliver for customers AND investors. CMS Mindset . . . . 2013 2013 Cold Winter & Cost Savings $1.66 +7% 20 Guidance 2012 Warm Winter 2012 Cost Saving +13¢ 2012 Hot Summer Reinvested earlier -13¢ 2012 Icy Late December O&M B/(W) Than Forecast (mils) Storm(total $50 M) $(37) Insurance 16 Lower contributions 9 Sales-weather 12 Total $ 0 2013 Reinvestment Reinvestment Amount EPS (mils) Electric reliability $14 3¢ Gas reliability 16 4 Generation & Corp “pull-aheads” 7 2 Service restoration cost & other 21 5 Subtotal - pre-Nov/Dec Storms $58 14¢ November Service Restoration 15 3 |

|
|
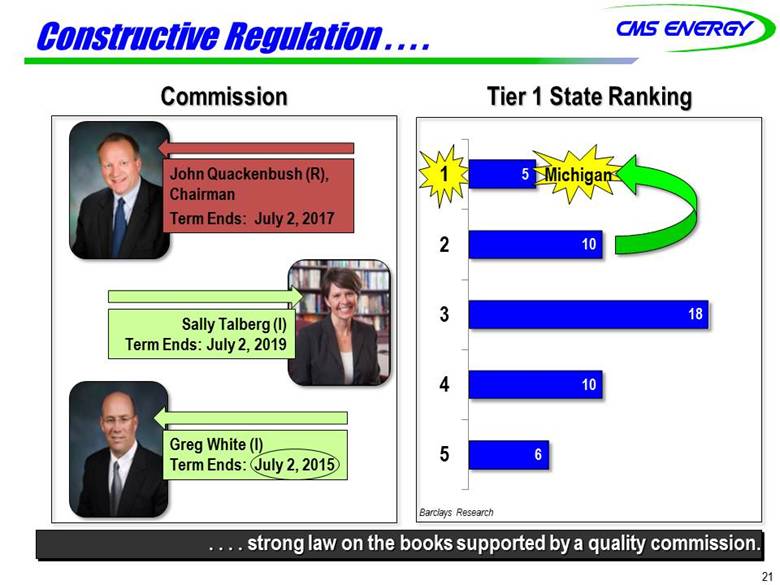
Constructive Regulation . . . . 21 . . . . strong law on the books supported by a quality commission. Tier 1 State Ranking Barclays Research Michigan John Quackenbush (R), Chairman Term Ends: July 2, 2017 Greg White (I) Term Ends: July 2, 2015 Sally Talberg (I) Term Ends: July 2, 2019 Commission |
|
|
Energy Law Improvements . . . . 22 . . . . builds on 2008 Law. Outlook Regulatory Support (from the right) Michigan Governor Rick Snyder MPSC Chairman John Quackenbush Michigan Energy Office Director Steve Bakkal Industrial class Energy-intensive $150 million customer opportunity (“ROA”) 780 MW capacity Governor’s Race Non-energy campaign issues New wind, gas generation Buy, build, convert Rate Design Elections Near-term catalysts next 12 to 18 months Law Update New Capacity Competitiveness |
|
|
Michigan Governor’s Race . . . . 23 . . . . focus on non-energy issues. Mark Schauer Democrat, Challenger Rick Snyder Republican, Incumbent Campaign Issues Education Jobs Roads Detroit On Energy On ROA As Senate Democratic Leader, Mark played a key role in the successful passage of the 2008 Energy Law. “Choice creates a lot of challenges and problems, essentially trying to arbitrage markets.” -Governor Rick Snyder |

|
|
$49M Gas Customer Bills . . . . . . . . down 10% over the last three years! 24 Settled $16M 2012 2013 2014 2015 $0 Investment $0 Stay-out Cost BILLS DOWN 10%! -- $88M |
|
|
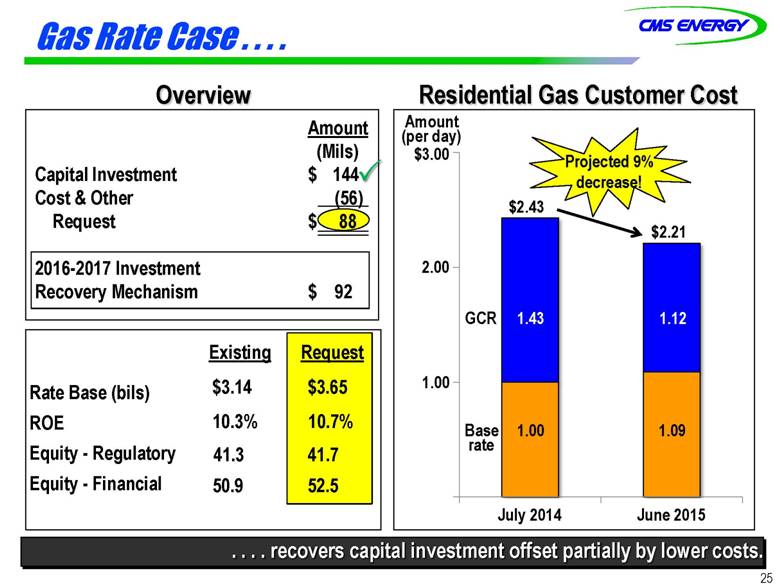
Gas Rate Case . . . . 25 Overview Rate Base (bils) XX ROE XX Equity - Regulatory XX Equity - Financial XX Residential Gas Customer Cost . . . . recovers capital investment offset partially by lower costs. Amount (Mils) Capital Investment $ Cost & Other (56) Request $ 88 2016-2017 Investment Recovery Mechanism $ 92 Existing $3.14 10.3% 41.3 50.9 144 Request $3.65 10.7% 41.7 52.5 Amount $3.00 2.00 1.00 July 2014 June 2015 1.00 1.43 $2.43 1.09 1.12 $2.21 Projected 9% decrease! (per day) GCR Base rate |
|
|
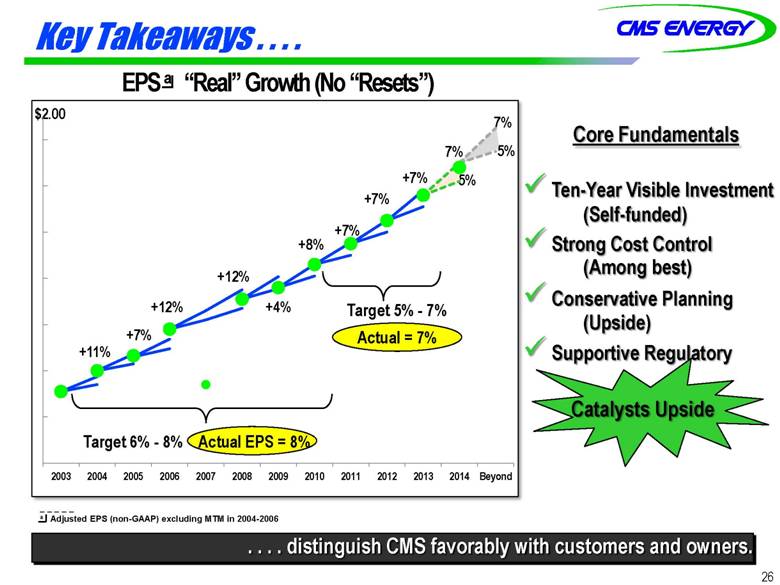
Key Takeaways . . . . 26 . . . . distinguish CMS favorably with customers and owners. _ _ _ _ _ a Adjusted EPS (non-GAAP) excluding MTM in 2004-2006 EPS a “Real” Growth (No “Resets”) $2.00 Core Fundamentals Ten-Year Visible Investment Strong Cost Control Conservative Planning Supportive Regulatory Catalysts Upside Target 5% - 7% Actual = 7% +11% Target 6% - 8% Actual EPS = 8% +7% +12% +12% +4% +7% +7% +7% +8% 7% 5% 7% 5% (Self-funded) (Among best) (Upside) |
|
|
Appendix |

|
|
Capital Expenditures 28 (mils) 2013-2017 2018-2022 Total 2013 2014 2015 2016 2017 Subtotal Subtotal 2013-2022 (mils) (mils) (mils) (mils) (mils) (mils) (mils) (mils) New Generation (includes Renewables) 136 $ 222 $ 61 $ 213 $ 44 $ 676 $ 1,105 $ 1,781 $ Environmental 314 280 201 122 114 1,031 420 1,451 Gas 172 227 237 215 188 1,039 1,435 2,474 Smart Energy 69 84 134 174 120 581 - 581 Electric Reliability 160 244 259 157 179 999 1,405 2,404 Maintenance 601 600 605 601 598 3,005 3,645 6,650 Total 1,452 $ 1,657 $ 1,497 $ 1,482 $ 1,243 $ 7,331 $ 8,010 $ 15,341 $ Electric 1,049 $ 1,212 $ 1,004 $ 1,003 $ 797 $ 5,065 $ 5,378 $ 10,443 $ Gas 403 445 493 479 446 2,266 $ 2,632 4,898 Total 1,452 $ 1,657 $ 1,497 $ 1,482 $ 1,243 $ 7,331 $ 8,010 $ 15,341 $ |
|
|
Operating Cash Flow Growth . . . . Amount (bils) $ Investment Cash flow before dividend a Non-GAAP NOLs & Credits $0.7 $0.6 $0.4 $0.5 $0.4 $0.2 $0.1 Gross operating cash flowa up $0.1 billion per year . . . . self-funds investment and strategy. Up $0.5 Billion $2.1 Interest Working capital and taxes $1.6 $1.9 $2.0 $1.7 $1.8 $1.45 $2.2 $1.4 $1.5 29 |
|
|
Electric Customer Base Diversified . . . . 30 . . . . “autos” 5% of 2013 electric gross margin. Hemlock Semiconductor (zero margin) General Motors Nexteer Automotive Corporation Gerdau Macsteel Denso International America Meijer Packaging Corp of America State of Michigan Spectrum Health AT&T Top Ten Customers $2.1 Billion 2013 Electric Gross Margin Residential, 50% Commercial, 32% Industrial, 14% Percentage of electric gross margin is 2.5% Other 4% 2013 ranked by deliveries |
|
|
31 Generation Strategy: New Supply Sources . . . . . . . . combined cycle gas is the most attractive new source of supply. Levelized cost of new build (¢/kWh) Gas price= $3.00 $4.50 $6.00 W/ tax credit W/o tax credit W/ emission controls Today $3.00 per watt 5¢ 6¢ 7¢ 6¢ 9¢ 10¢ 12¢ 22¢ 8¢ Back -up 11¢ Back -up 6¢ Wind Combined Cycle Gas Plant Residential Solar 15¢ Future $2.00 per watt? Consumers Energy Sources 5¢ 7¢ 5.5¢ New Build |
|
|
Capacity Diversity . . . . 32 . . . . evolving to cleaner generation while becoming more cost competitive. 2005 2017 2014 |
|
|
Visible Investment: Gas Distribution . . . . 33 . . . . investing $2 billion over the next 5 years. New Customers Inspection Storage Compression Transmission 50,000 New customers $200 Million 1,700 Miles $100 Million 23 Wells $100 Million 800 Miles $450 Million 19,000 + Horsepower $400 Million 32 Miles $200 Million Includes switching Commission approved Main Replacement |
|
|
34 Demand $ 1.0 Billion . . . . investing $2 billion over the next 5 years. Visible Investment: Electric Distribution . . . . Reliability $ 0.7 Billion Capacity $ 0.3 Billion Total $ 2.0 Billion Circuits In service 2,253 Upgrade 603 Transformers In service 663,044 Replace 16,175 Poles In service 1,554,309 40 years old 761,711 Replace 50,763 Meters In service 2,039,283 Replace 1,732,393 |
|
|
Visible Investment: Renewable Energy . . . . 35 10% 40% 25 15 Biomass Landfill & other 10% renewables by 2015 Purchase 50% and build 50% Renewables by 2015 8% already in place! . . . . Michigan’s largest renewable energy supplier. Michigan Energy Law Requires Hydro Cross Winds under construction 105 MW 20 Wind |
|
|
36 Electric Utility Financial & Operating Statistics Consumers Energy Count on Us Years Ended December 31 2013 2012 2011 2010 2009 2008 ELECTRIC REVENUE AND POWER COSTS ($ Millions) Residential $1,319 $1,785 $1,678 $1,614 $1,387 $1,414 Commercial 1,301 1,228 1,197 1,166 1,099 1,129 Industrial 772 781 784 749 677 810 Other 34 38 39 40 36 32 Total revenue from customers $3,926 $3,832 $3,698 $3,569 $3,199 $3,385 Wholesale 24 23 21 20 19 22 Retail open access/direct access 46 53 43 54 31 15 Intersystem 114 64 91 99 94 113 Miscellaneous 69 59 60 60 64 59 Total electric utility revenue $4,173 $4,031 $3,913 $3,802 $3,407 $3,594 Fuel for electric generation $541 $517 $559 $520 $460 $483 Purchased and interchange power 1,450 1,425 1,348 1,308 1,232 1,388 DEPRECIATION AND AMORTIZATION $484 $459 $412 $450 $441 $438 OPERATING INCOME $783 $743 $712 $672 $488 $576 NET INCOME $363 $325 $333 $303 $194 $271 DELIVERIES (Million k Whs) System sales Residential 12,793 12,901 12,931 12,968 12,386 12,854 Commercial 10,908 10,950 10,903 11,026 11,211 11,969 Industrial 8,647 9,685 9,544 9,061 9,290 10,563 Other 209 220 224 235 230 225 Total sales to ultimate customers 32,667 33,756 33,602 33,290 33,117 35,611 Wholesale 341 347 332 325 328 333 Retail open access/direct access 3,996 3,981 3,901 4,079 2,326 1,541 Intersystem 2,379 1,711 1,349 1,394 1,277 1,176 Total electric system deliveries 39,273 39,795 39,184 39,088 37,048 38,661 AVERAGE ELECTRIC REVENUE(¢ per kWh) Residential 14.22 13.84 12.98 12.45 11.20 11.00 Commercial 11.93 11.21 10.98 10.58 9.80 9.43 Industrial 8.93 8.06 8.21 8.27 7.29 7.67 Other 16.27 17.27 17.41 17.02 15.65 14.22 Total 12.06 11.35 11.01 10.72 9.66 9.51 ELECTRIC CUSTOMERS BILLED (At December 31) Residential 1,573,602 1,571,873 1,571,319 1,569,183 1,566,980 1,584,752 Commercial 206,396 206,627 207,490 209,464 210,223 208,931 Industrial 8,588 8,706 8,691 8,702 8,770 8,505 Retail open access/direct access 1,081 1,065 1,078 1,095 861 642 Other 1,363 1,320 1,300 1,287 1,282 2,045 Total 1,791,230 1,789,591 1,789,878 1,789,731 1,788,116 1,804,875 AUTHORIZED RETURN ON EQUITY 10.30% 10.30% 10.70% 10.70% 10.70% 10.70% EARNED RETURN ON EQUITY-FINANCIAL 10.90% 10.20% 11.00% 10.60% 6.40%(1) 9.40% RATE BASE ($ Millions) 13 month average $8,374 $7,741 $7,442 $6,815 $6,459 $6,175 COOLING DEGREE DAYS(2) Normal degree days in calendar year 665 607 584 571 578 579 Actual degree days 675 942 767 884 379 542 Warmer (colder) than normal (%) 2 55 31 55 (34) (6) Increase (decrease) from normal in: Electric deliveries (millions of kWh) 395 502 513 855 (461) 146 HEADCOUNT (total utility) 7,435 7,221 7,452 7,551 7,787 7,727 (1) 9.1% excluding Big Rock Decommissioning refund (2) CDO base 65 degrees, Lansing weather station, normal equals average of preceding 15 year time period CMS Energy Investor Relations One Energy Plaza, Jackson, Ml 49201 517-788-2590 www.cmsenergy.com |
|
|
37 Electric Utility Financial & Operating Statistics Consumers Energy Count on Us Years Ended December 31 2013 2012 2011 2010 2009 2008 FUEL COST ($ per MMBtu) Coal 2.90 2.98 2.94 2.51 2.37 2.01 Oil 19.47 19.08 18.55 10.98 9.59 11.54 Gas 4.68 3.16 4.95 5.57 6.57 10.94 Weighted average for all fuels 3.07 3.05 3.18 2.71 2.56 2.47 FUEL COST FOR GENERATION (%) Coal 89.2 84.9 83.5 88.2 90.6 81.0 Oil 1.8 1.5 2.1 3.3 2.5 4.1 Gas 8.6 13.6 14.3 8.4 6.8 14.6 Nox allowances 0.4 0.0 0.1 0.1 0.1 0.3 POWER GENERATED(Millions of k Whs) Coal 15,951 14,027 15,468 17,879 17,255 17,701 Oil 4 6 7 21 14 41 Gas 1,415 3,003 1,912 1,043 565 804 Renewable energy (hydro, wind ‘12) 704 433 425 365 466 454 Net pumped storage1 (371) (295) (365) (366) (303) (382) Total net generation 17,703 17,174 17,447 18,942 17,997 18,618 Purchased and interchange: Non-utility generation 13,121 14,539 12,674 12,003 11,538 13,643 Net interchange power 3,656 4,151 6,825 6,045 6,925 6,653 Total net purchased and interchange power 16,777 18,690 19,499 18,048 18,463 20,296 Total net power supply 34,480 35,864 36,946 36,990 36,480 38,914 POWER GENERATED (%) Total net generation 51.3 47.9 47.2 51.2 49.4 47.8 Non-utility generation 38.1 40.5 34.3 32.5 31.6 35.1 Net interchange power 10.6 11.6 18.5 16.3 19.0 17.1 Total net purchased and interchange power 48.7 52.1 52.8 48.8 50.6 52.2 Total net power supply 100.0 100.0 100.0 100.0 100.0 100.0 NET DEMONSTRATED CAPABILITY AT PEAK(MW) Coal 2,799 2,846 2,823 2,828 2,850 2,850 Oil and gas 1,795 1,795 1,810 1,814 1,814 1,997 Combustion turbine 348 348 465 517 661 661 Renewable energy (hydro, wind ‘12) 89 176 77 74 74 73 Pumped storage 953 954 955 955 955 955 Total owned generation 5,984 6,119 6,130 6,188 6,354 6,536 P&I power capability 2,619 2,488 2,458 3,058 2,600 3,050 Total owned and P&I 8,603 8,607 8,588 9,246 8,954 9,586 NET DEMONSTRATED CAPABILITY AT PEAK(%) Total owned generation 69.6 71.1 71.4 66.9 71.0 68.2 P&I power capability 30.4 28.9 28.6 33.1 29.0 31.8 Total owned and P&I 100.0 100 0 100.0 100.0 100.0 100.0 Peak load (M/V)(2) 8,509 9,006 8,930 8,190 7,756 7,705 Reserve capacity (%) 6 4 4 11 17 22 Net demonstrated capacity, summer (MW) 5,984 6,119 6,091 6,151 6,353 8,353 Load factor (%)3 62.4 48.7 50.8 55.3 55.9 59.2 (1) Consumers’ portion of the Ludington pumped storage facility (2) Includes Retail Open Access customers (3) Includes bundled service customers CMS Energy Investor Relations One Energy Plaza. Jackson. Ml 49201 517-788-2590 www.cmsenergy.com |
|
|
38 Gas Utility Financial & Operating Statistics Consumers Energy CountonUs Years Ended December 31 2013 2012 2011 2010 2009 2008 GAS REVENUE AND COST OF GAS ($ Millions) Residential Commercial Industrial Other $1,515 399 69 2 $1,415 351 65 2 $1,655 438 89 3 $1,677 449 88 3 $1,808 511 101 3 $1,971 598 124 5 Total sales revenue Transportation fees Miscellaneous $1,985 62 101 $1,833 58 91 $2,185 60 95 $2,217 53 84 $2,423 48 85 $2,698 45 84 Total gas utility revenue Cost of gas sold $2,148 1,187 $1,982 1,110 $2,340 1,438 $2,354 1,516 $2,556 1,778 $2,827 2,079 Gas utility revenue, net of cost of gas $961 $872 $902 $838 $778 $748 DEPRECIATION, DEPLETION AND AMORTIZATION $138 $133 $130 $122 $118 $136 OPERATING INCOME $334 $240 $272 $252 $201 $190 NET INCOME $168 $110 $130 $127 $96 $89 SALES AND DELIVERIES (Bcf) Residential Commercial Industrial 169 54 10 139 44 9 157 50 11 152 47 10 163 52 11 171 57 12 Total gas sates ‘ Gas transportation deliveries 233 119 192 137 218 119 209 108 226 93 240 98 Total gas sales and transportation deliveries 352 329 337 317 319 338 GAS CUSTOMERS BILLED (at December 31) Residential Commercial Industrial Transportation 1,589,407 119,441 6,026 3,523 1,582,123 118,781 6,437 3,347 1,579,835 118,223 6,721 3,179 1,576,520 117,660 6,938 3,005 1,574,246 118,199 7,073 2,725 1,577,863 118,870 6,961 2,507 Total customers 1,718,397 1,710,688 1,707,958 1,704,323 1,702,243 1,706,201 AVERAGE GAS REVENUE ($ per Mcf) Residential Commercial Industrial Transportation(2) $8.96 7.39 6.90 0.83 $10.18 7.98 7.22 0.87 $10.54 8.76 8.09 0.88 $11.03 9.55 8.80 0.82 $11.09 9.83 9.18 0.82 $11,53 10.49 10.33 0.70 GAS SUPPLY (MMcf) Gas cost recovery Gas customer choice 175,812 62,807 145,400 48,923 175,431 48,338 176,247 36,389 205,329 26,816 219,848 25,211 Total 238,619 194,323 223,769 212,638 232,145 245,059 WORKING GAS STORAGE CAPACITY (Bcf) 143 143 142 142 142 142 AVERAGE COST OF GAS SOLD ($ per Mcf) (3) Gas cost recovery Gas customer choice $4.93 5.17 $5.84 5.41 $6.42 6.56 $7.09 7.48 $7.57 8.72 $8.36 9.99 AUTHORIZED RETURN ON EQUITY 10.30% 10.30% 10.50% 10.55% 10.55% 10.55% EARNED RETURN ON EQUITY-FINANCIAL 12.30% 8.60% 10.50% 10.90% 9.90% 9.20% RATE BASE ($ Millions) 13 month average $3,187 $3,138 $3,110 $2,867 $2,778 $2,638 HEATING DEGREE DAYS (4) Normal degree days in calendar year Actual degree days Colder (warmer) than normal (%) Increase (decrease) from normal in: Gas deliveries (Bcf) 6,516 6,924 6.3 16.5 6,626 5,714 (13.8) (22.9) 6,678 6,606 (1.1) (0.4) 6,731 6,305 (6.3) (6.4) 6,732 6,913 2.7 4.8 6,741 6,965 3.3 4.1 (1) Includes Gas Customer Choice sales (2) Average gas revenue for transportation excludes amounts related to MCV and off-system transportation (3) Includes pipeline transportation charges (4) HDD base 65 degrees, seven weather station average, normal equals average of preceding 15 year time period CMS Energy Investor Relations One Energy Plaza, Jackson, Ml 49201 517-788-2590 www.cmsenergy.com |
|
|
39 GAS RATE CASE U-17643* On July 1, 2014, Consumers Energy filed an application with the Michigan Public Service Commission seeking an increase in its gas delivery and transportation rates based on a 12 months ending December 2015 test year. The request seeks authority to recover new investment in system reliability, regulatory compliance and technology enhancements. These investments are part of the Company’s Growing Forward strategy which calls for investing about $15 billion in utility operations over the next 10 years. The filing also seeks approval of two rate adjustment mechanisms, an investment recovery mechanism and a revenue decoupling mechanism. The investment recovery mechanism would allow recovery in 2016 and 2017 of an additional $92 million for incremental 2016 and 2017 investments, subject to reconciliation. The revenue decoupling mechanism would increase certainty that the Company would collect its authorized nonfuel revenue. The proposed overall rate of return is based on a 10.70% authorized return on equity. If approved, the $88 million revenue deficiency would add about 4.2% to the typical residential customer’s average monthly bill. We expect the GCR decrease in 2015 to more than offset the base rate increase requested in this case. Because the rates approved in Case No. U-16855 were the result of a settlement agreement, specific cost of service items were not identified in that rate order. Therefore, the items identified on Lines 1-5 below are comparisons to amounts which the Company assumed were reflected in the U-16855 final order: Item $ Millions Remarks 1. Investment $124 New investment gas infrastructure: $81 Depreciation: $40 Property taxes: $14 Income taxes. AFUDC and other: $9 Cost of Removal Tax Accounting: $(20) 2. Working Capital (31) Lower gas inventory cost 3. Cost of Capital 2 Reduced debt cost and capital structure change: $(7) ROE at 10.7% versus authorized 10.3%: $9 4. O&M 8 Distribution & Cust Ops; Corporate: $30 Compensation: $6 Benefits: $(29) Technology: $8 LAUF and company nse: $(8) Other: $1 5. Gross Margin (15) Sales and transportation revenue: $(19) (293 bcf vs 285 bcf) Miscellaneous revenues: $4 6. Total $88 Ratemaking Existing As Filed After-Tax Capital Structure U-16855(1) Percent of Total Annual Cost Weighted Costs Long Term Debt 39.37% 37.51% 5.15% 1.93% Short Term Debt 1.71 2.21 2.71 0.07 Preferred Stock 0.40 0.29 4.50 0.01 Common Equity 41.34(2) 41.70(3) 10.70 4.46 Deferred FIT 16.24 17.48 0.00 0.00 JDITC/Other .94 .81 8.04 0.06 100.00% 100.00% 6.53%(4) Rate Base and Return Existing Percentage U-16855(1) As Filed Rate Base $(billion) $3.14 $3.65 Return on Rate Base 6.59% 6.53% Return on Equity 10.30% 10.70% (1)Assumed Final order was a result of a June 2012 settlement agreement which did not identify these items specifically. (2)Equivalent to 50.96% on financial basis. (3)Equivalent to 52.46% on financial basis. (4)Equivalent to 9.41% pre-tax basis. *Gas rate case U-17643 can be accessed at the Michigan Public Service Commission’s website. http://efile.mpsc.state.ml.us/efile/viewcase.php?casenum=17643 |
|
|
40 Enterprises As of December 31, 2013 Independent Power Production Plant Primary Fuel Ownership Interest Gross Capacity In-Service Year Capacity Under LT Contract State Craven Wood 50% 50 1990 100% NC DIG Natural Gas 100 710 2001 61 MI Filer City Coal 50 73 1990 100 MI Genesee Wood 50 40 1996 100 MI Grayling Wood 50 38 1992 100 MI MI Power Natural Gas 100 224 1999 40 MI Total MW 1,034 (net owned) 1,135 Michigan Power (Livingston) Grayling Filer City Genesee Renewables Other Michigan Power (Kalamazoo River) DIG Craven CMS Energy Investor Relations One Energy Plaza, Jackson, MI 49201 517-788-2590 wwww.cmsenergy.com |
|
|
GAAP Reconciliation |
|
|
42 2003 2004 2005 2006 2007 2008 2009 2010 2011 2012 2013 Reported earnings (loss) per share - GAAP ($0.30) $0.64 ($0.44) ($0.41) ($1.02) $1.20 $0.91 $1.28 $1.58 $1.42 $1.66 After-tax items: Electric and gas utility 0.21 (0.39) - - (0.07) 0.05 0.33 0.03 - 0.17 - Enterprises 0.74 0.62 0.04 (0.02) 1.25 (0.02) 0.09 (0.03) (0.11) (0.01) * Corporate interest and other 0.16 (0.03) 0.04 0.27 (0.32) (0.02) 0.01 * (0.01) * * Discontinued operations (income) loss (0.16) 0.02 (0.07) (0.03) 0.40 (*) (0.08) 0.08 (0.01) (0.03) * Asset impairment charges, net - - 1.82 0.76 0.60 - - - - - - Cumulative accounting changes 0.16 0.01 - - - - - - - - - Adjusted earnings per share, including MTM - non-GAAP $0.81 $0.87 $1.39 $0.57 $0.84 $1.21 (a) $1.26 $1.36 $1.45 $1.55 $1.66 Mark-to-market impacts 0.03 (0.43) 0.51 Adjusted earnings per share, excluding MTM - non-GAAP NA $0.90 $0.96 $1.08 NA NA NA NA NA NA NA * Less than $500 thousand or $0.01 per share. (a) $1.25 excluding discontinued Exeter operations and accounting changes related to convertible debt and restricted stock. Earnings Per Share By Year GAAP Reconciliation (Unaudited) |
|
|
43 2012 2013 2014 2015 2016 2017 2018 Consumers Operating Income + Depreciation & Amortization 1,635 $ (a) 1,740 $ 1,820 $ 1,876 $ 1,952 $ 2,054 $ 2,162 $ Enterprises Project Cash Flows 17 16 25 30 28 35 36 Gross Operating Cash Flow 1,652 $ 1,756 $ 1,845 $ 1,906 $ 1,980 $ 2,089 $ 2,198 $ (411) (335) (395) (356) (730) (739) (748) Net cash provided by operating activities 1,241 $ 1,421 $ 1,450 $ 1,550 $ 1,250 $ 1,350 $ 1,450 $ (a) excludes $(59) million 2012 disallowance related to electric decoupling CMS Energy Reconciliation of Gross Operating Cash Flow to GAAP Operating Activities (unaudited) (mils) Other operating activities including taxes, interest payments and working capital |