Attached files
| file | filename |
|---|---|
| 8-K - FORM 8-K - MSC INDUSTRIAL DIRECT CO INC | v383447_8-k.htm |
| EX-99.1 - EXHIBIT 99.1 - MSC INDUSTRIAL DIRECT CO INC | v383447_ex99-1.htm |
Exhibit 99.2

1 Fiscal 3Q’14 Earnings Presentation July 9, 2014
2 Risks and Non - GAAP Disclosures This presentation contains forward - looking statements within the meaning of U.S. securities laws, including guidance about expec ted future results, expectations regarding our ability to gain market share, expected benefits from our investment and strategic plans, including the Class C Solutions Group (“CCSG”) (formerly Barnes Distribution North America) acquisition and expectations regarding future revenue and margin growth. These forward - looking statements involve risks and uncertainties that could cause actual results to differ materially from those anticipated by these statements; are based on our current expectations; and we assume no obligat ion to update them. These risks include the Company’s ability to timely and efficiently integrate its recent acquisition of CCSG and realize the anticipated synergies from the transaction ; current economic, political, and social conditions; general economic conditions in the markets in which the Company operates ; changing customer and product mixes ; competition; industry consolidation and other changes in the industrial distribution sector ; volatility in commodity and energy prices ; the outcome of potential government or regulatory proceedings or future litigation ; credit risk of our customers ; risk of cancellation or rescheduling of customer orders ; work stoppages or other business interruptions (including those due to extreme weather conditions) at transportation centers or shipping ports ; risk of loss of key suppliers, key brands or supply chain disruptions ; dependence on our information systems ; retention of key personnel; risk of delays in opening or expanding our customer fulfillment centers; goodwill and intangible assets recorded as a result of our acquisitions could be impaired; disclosing our use of “conflict minerals” in certain of the products we distribute could raise certain reputational and other ri sks; and the Company’s ability to enhance its information technology systems without disruption to our business operations. Information about these risks is noted in the earnings press release and in the Risk Factors and MD&A sections of our latest annual and quarterly reports filed with the SEC, as well as in our other SEC filings. Investors are cautioned not to place undue relianc e o n these forward - looking statements . Throughout this conference call we will reference both GAAP and adjusted financial results, which are non - GAAP financial measure s. Please refer to the reconciliation tables at the end of this presentation and at the end of our earnings release for a reconciliation of the adjusted financial measures to the most directly comparable GAAP measures .
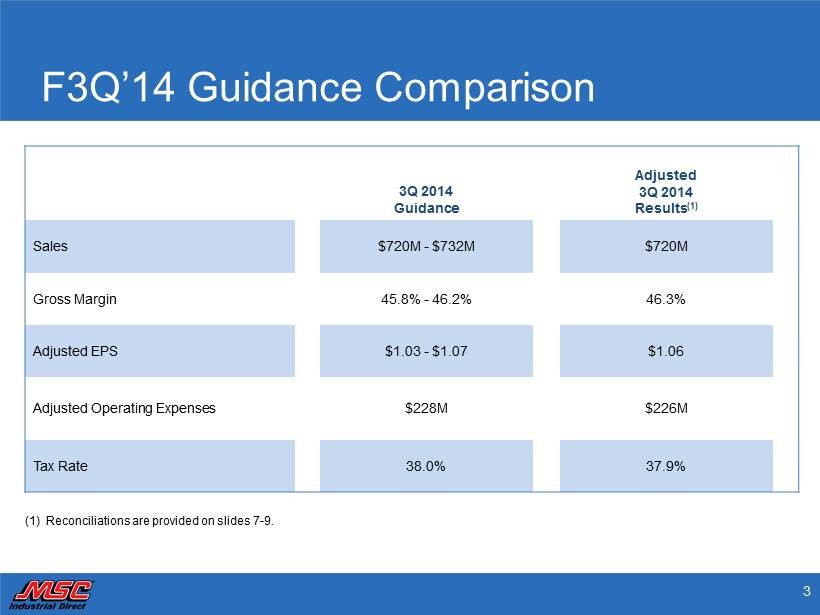
3 F3Q’14 Guidance Comparison 3Q 2014 Guidance Adjusted 3Q 2014 Results (1) Sales $720M - $732M $720M Gross Margin 45.8% - 46.2% 46.3% Adjusted EPS $1.03 - $1.07 $1.06 Adjusted Operating Expenses $228M $226M Tax Rate 38.0% 37.9% (1) Reconciliations are provided on slides 7 - 9.

4 F3Q’14 EPS Walk (1,2) $1.06 ($0.02) $1.03 Adjusted EPS CCSG Integration Costs GAAP EPS (1) Previously provided guidance for F3Q 2014 included the impact from CCSG operating results and excluded non - recurring integration costs associated with the CCSG acquisition. Non - recurring costs associated with our Davidson facility had less than a $0.01 per share impact. Reconciliations are provided on slides 7 - 9. (2) Individual earnings per share amounts may not agree to total due to rounding.
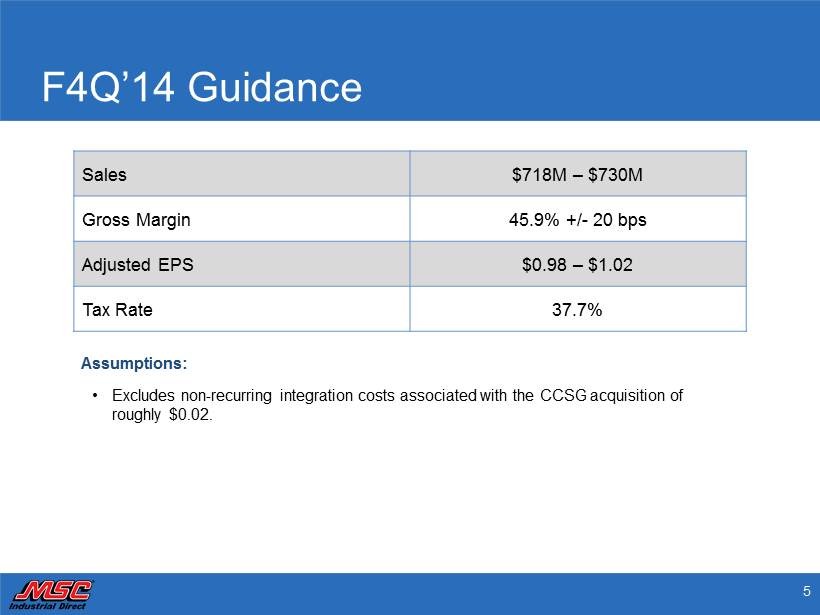
5 F4Q’14 Guidance Sales $718M – $730M Gross Margin 45.9% +/ - 20 bps Adjusted EPS $0.98 – $1.02 Tax Rate 37.7% Assumptions: • Excludes non - recurring integration costs associated with the CCSG acquisition of roughly $0.02.
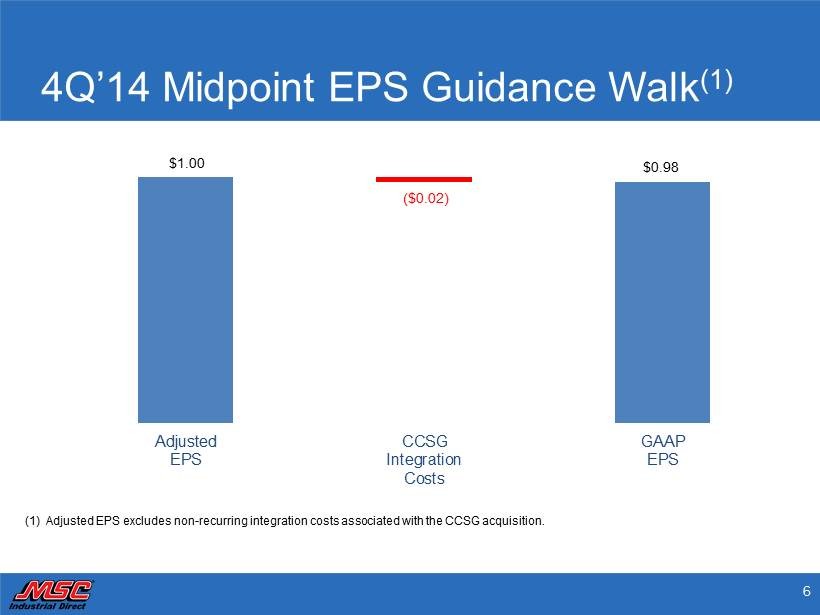
6 4Q’14 Midpoint EPS Guidance Walk (1) (1) Adjusted EPS excludes non - recurring integration costs associated with the CCSG acquisition . $1.00 $0.98 ($0.02) Adjusted EPS CCSG Integration Costs GAAP EPS
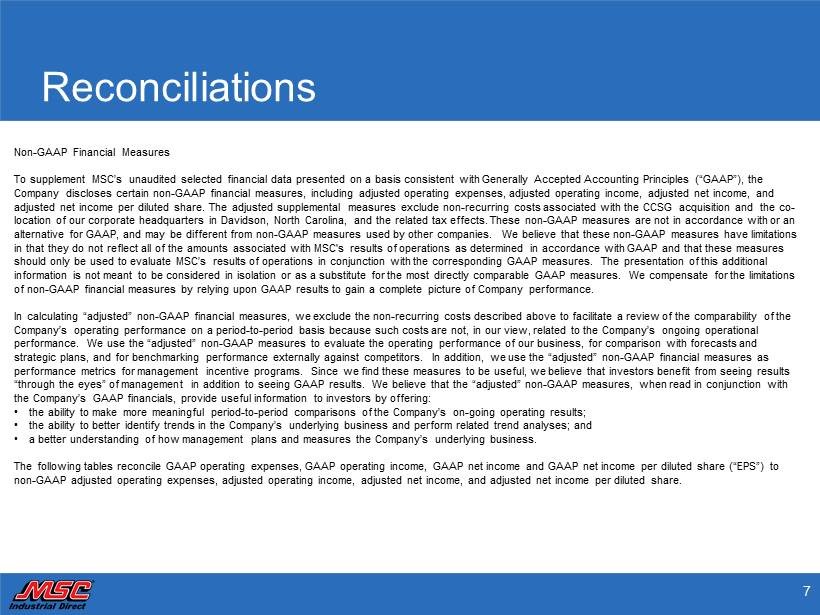
7 Reconciliations Non - GAAP Financial Measures To supplement MSC’s unaudited selected financial data presented on a basis consistent with Generally Accepted Accounting Prin cip les (“GAAP”), the Company discloses certain non - GAAP financial measures, including adjusted operating expenses, adjusted operating income, adjusted net income, and adjusted net income per diluted share. The adjusted supplemental measures exclude non - recurring costs associated with the CCSG acquisition and the co - location of our corporate headquarters in Davidson, North Carolina, and the related tax effects. These non - GAAP measures are not in accordance with or an alternative for GAAP, and may be different from non - GAAP measures used by other companies. We believe that these non - GAAP measu res have limitations in that they do not reflect all of the amounts associated with MSC's results of operations as determined in accordance with G AAP and that these measures should only be used to evaluate MSC’s results of operations in conjunction with the corresponding GAAP measures. The present ati on of this additional information is not meant to be considered in isolation or as a substitute for the most directly comparable GAAP measures. We co mpensate for the limitations of non - GAAP financial measures by relying upon GAAP results to gain a complete picture of Company performance. In calculating “adjusted” non - GAAP financial measures, we exclude the non - recurring costs described above to facilitate a review of the comparability of the Company’s operating performance on a period - to - period basis because such costs are not, in our view, related to the Company’s on going operational performance. We use the “adjusted” non - GAAP measures to evaluate the operating performance of our business, for comparison with forecasts and strategic plans, and for benchmarking performance externally against competitors. In addition, we use the “adjusted” non - GAAP f inancial measures as performance metrics for management incentive programs. Since we find these measures to be useful, we believe that investors ben efit from seeing results “through the eyes” of management in addition to seeing GAAP results. We believe that the “adjusted” non - GAAP measures, when rea d in conjunction with the Company’s GAAP financials, provide useful information to investors by offering: • the ability to make more meaningful period - to - period comparisons of the Company’s on - going operating results; • the ability to better identify trends in the Company’s underlying business and perform related trend analyses; and • a better understanding of how management plans and measures the Company’s underlying business. The following tables reconcile GAAP operating expenses, GAAP operating income, GAAP net income and GAAP net income per diluted share (“EPS”) to non - GAAP adjusted operating expenses, adjusted operating income, adjusted net income, and adjusted net income per diluted share.
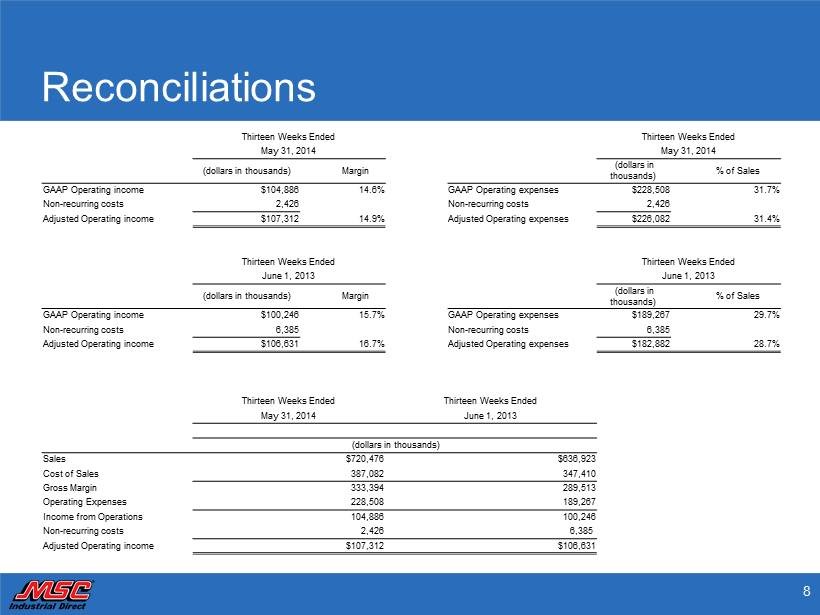
8 Reconciliations Thirteen Weeks Ended Thirteen Weeks Ended May 31, 2014 May 31, 2014 (dollars in thousands) Margin (dollars in thousands) % of Sales GAAP Operating income $104,886 14.6% GAAP Operating expenses $228,508 31.7% Non - recurring costs 2,426 Non - recurring costs 2,426 Adjusted Operating income $107,312 14.9% Adjusted Operating expenses $226,082 31.4% Thirteen Weeks Ended Thirteen Weeks Ended June 1, 2013 June 1, 2013 (dollars in thousands) Margin (dollars in thousands) % of Sales GAAP Operating income $100,246 15.7% GAAP Operating expenses $189,267 29.7% Non - recurring costs 6,385 Non - recurring costs 6,385 Adjusted Operating income $106,631 16.7% Adjusted Operating expenses $182,882 28.7% Thirteen Weeks Ended Thirteen Weeks Ended May 31, 2014 June 1, 2013 (dollars in thousands) Sales $720,476 $636,923 Cost of Sales 387,082 347,410 Gross Margin 333,394 289,513 Operating Expenses 228,508 189,267 Income from Operations 104,886 100,246 Non - recurring costs 2,426 6,385 Adjusted Operating income $107,312 $106,631

9 Reconciliations Thirteen Weeks Ended May 31, 2014 ( in thousands, except per share amounts ) $(after tax) Diluted EPS** GAAP net income $64,696 $1.03 Non - recurring costs* 1,507 0.02 Adjusted net income $66,203 $1.06 * On a pre - tax basis includes approximately $127 of non - recurring relocation costs associated with the Co - Location of the Compan y’s headquarters in Davidson, North Carolina and approximately $2,299 of non - recurring integration costs associated with the CCSG acquisition for the thirteen weeks ended Ma y 31, 2014. The non - recurring costs were calculated using an effective tax rate of 37.9%. ** Individual amounts of earnings per share may not agree to the total due to rounding Thirteen Weeks Ended June 1, 2013 ( in thousands, except per share amounts ) $(after tax) Diluted EPS GAAP net income $62,354 $0.98 Non - recurring costs* 4,390 0.07 Adjusted net income $66,744 $1.05 * On a pre - tax basis includes approximately $930 of non - recurring relocation costs associated with the Co - Location of the Compan y’s headquarters in Davidson, North Carolina and approximately $6,049 of non - recurring transaction costs associated with the CCSG acquisition for the thirteen weeks ended Ju ne 1, 2013. The non - recurring costs were calculated using an effective tax rate of 37.1%.