Attached files
| file | filename |
|---|---|
| EX-10.3 - EX-10.3 - YODLE INC | d721498dex103.htm |
| EX-10.3.1 - EX-10.3.1 - YODLE INC | d721498dex1031.htm |
| EX-4.2 - EX-4.2 - YODLE INC | d721498dex42.htm |
| EX-23.1 - EX-23.1 - YODLE INC | d721498dex231.htm |
| EX-10.3.3 - EX-10.3.3 - YODLE INC | d721498dex1033.htm |
| EX-10.3.2 - EX-10.3.2 - YODLE INC | d721498dex1032.htm |
| EX-3.3 - EX-3.3 - YODLE INC | d721498dex33.htm |
| EX-99.1 - EX-99.1 - YODLE INC | d721498dex991.htm |
| EX-3.1 - EX-3.1 - YODLE INC | d721498dex31.htm |
| EX-2.1 - EX-2.1 - YODLE INC | d721498dex21.htm |
Table of Contents
As filed with the U.S. Securities and Exchange Commission on July 7, 2014.
Registration No. 333-
UNITED STATES
SECURITIES AND EXCHANGE COMMISSION
Washington, D.C. 20549
FORM S-1
REGISTRATION STATEMENT
UNDER
THE SECURITIES ACT OF 1933
YODLE, INC.
(Exact name of Registrant as specified in its charter)
| Delaware | 7311 | 57-1219336 | ||
| (State or other jurisdiction of incorporation or organization) |
(Primary Standard Industrial Classification Code Number) |
(I.R.S. Employer Identification Number) |
50 West 23rd Street, Suite 401
New York, NY 10010
(212) 542-5400
(Address, including zip code, and telephone number, including area code, of Registrant’s principal executive offices)
Court Cunningham
Chief Executive Officer
Yodle, Inc.
50 West 23rd Street, Suite 401
New York, NY 10010
(212) 542-5400
(Name, address, including zip code, and telephone number, including area code, of agent for service)
Copies to:
| Babak Yaghmaie Nicole Brookshire Stephane Levy Cooley LLP 1114 Avenue of the Americas New York, NY 10036 (212) 479-6000 |
Michael Gordon Chief Operating Officer and Chief Financial Officer Yodle, Inc. 50 West 23rd Street, Suite 401 New York, NY 10010 (212) 542-5400 |
Kirk A. Davenport Latham & Watkins LLP 885 Third Avenue New York, NY 10022-4834 (212) 906-1200 |
Approximate date of commencement of proposed sale to the public:
As soon as practicable after the effective date of this registration statement.
If any of the securities being registered on this Form are to be offered on a delayed or continuous basis pursuant to Rule 415 under the Securities Act of 1933, as amended, check the following box. ¨
If this Form is filed to register additional securities for an offering pursuant to Rule 462(b) under the Securities Act, check the following box and list the Securities Act registration statement number of the earlier effective registration statement for the same offering. ¨
If this Form is a post-effective amendment filed pursuant to Rule 462(c) under the Securities Act, check the following box and list the Securities Act registration statement number of the earlier effective registration statement for the same offering. ¨
If this Form is a post-effective amendment filed pursuant to Rule 462(d) under the Securities Act, check the following box and list the Securities Act registration number of the earlier effective registration statement for the same offering. ¨
CALCULATION OF REGISTRATION FEE
|
| ||||
| Title of Securities being Registered | Proposed Maximum Aggregate Offering Price(1) |
Amount of Registration Fee(2) | ||
| Common Stock, $0.0002 par value per share |
$75,000,000 | $9,660 | ||
|
| ||||
|
| ||||
| (1) | Estimated solely for purposes of computing the amount of the registration fee pursuant to Rule 457(o) under the Securities Act. |
| (2) | Calculated pursuant to Rule 457(o) under the Securities Act of 1933, as amended, based on an estimate of the proposed maximum aggregate offering price. |
Indicate by check mark whether the registrant is a large accelerated filer, an accelerated filer, a non-accelerated filer, or a smaller reporting company. See the definitions of “large accelerated filer,” “accelerated filer” and “smaller reporting company” in Rule 12b-2 under the Securities Exchange Act of 1934. (Check one):
| Large Accelerated Filer ¨ | Accelerated Filer ¨ | Non-accelerated Filer x | Smaller Reporting Company ¨ |
The registrant hereby amends this Registration Statement on such date or dates as may be necessary to delay its effective date until the registrant shall file a further amendment that specifically states that this Registration Statement shall thereafter become effective in accordance with Section 8(a) of the Securities Act of 1933, as amended, or until the registration statement shall become effective on such date as the Commission, acting pursuant to said Section 8(a), may determine.
Table of Contents
The information in this prospectus is not complete and may be changed. We and the selling stockholders may not sell these securities until the registration statement filed with the Securities and Exchange Commission is effective. This prospectus is not an offer to sell these securities and we and the selling stockholders are not soliciting offers to buy these securities in any state where the offer or sale is not permitted.
SUBJECT TO COMPLETION, DATED JULY 7, 2014
PRELIMINARY PROSPECTUS
Shares

Common Stock
We are selling shares of common stock and the selling stockholders are selling shares of common stock. We will not receive any of the proceeds from the shares of common stock sold by the selling stockholders.
Prior to this offering, there has been no public market for our common stock. The initial public offering price of our common stock is expected to be between $ and $ per share. We intend to apply to list our common stock on under the symbol “YO.”
We are an “emerging growth company” as defined under the U.S. federal securities laws and, as such, may elect to comply with certain reduced public company reporting requirements for this and future filings. See “Prospectus Summary—Implications of Being an Emerging Growth Company.”
The underwriters have an option to purchase a maximum of additional shares from solely to cover over-allotments of shares.
Investing in our common stock involves risks. See “Risk Factors” beginning on page 12.
| Price to Public |
Underwriting Discounts and Commissions(1) |
Proceeds to Yodle, Inc. |
Proceeds to Selling | |||||
| Per Share |
$ | $ | $ | $ | ||||
| Total |
$ | $ | $ | $ |
| (1) | See “Underwriting” on page 135 for additional information regarding underwriting compensation. |
Delivery of the shares of common stock will be made on or about , 2014.
Neither the Securities and Exchange Commission nor any state securities commission has approved or disapproved of these securities or determined if this prospectus is truthful or complete. Any representation to the contrary is a criminal offense.
| Credit Suisse | Deutsche Bank Securities | Jefferies | Piper Jaffray |
| Canaccord Genuity | Needham & Company | Oppenheimer & Co. | ||
The date of this prospectus is , 2014.
Table of Contents
| 1 | ||||
| 12 | ||||
| 41 | ||||
| 43 | ||||
| 45 | ||||
| 46 | ||||
| 48 | ||||
| 50 | ||||
| MANAGEMENT’S DISCUSSION AND ANALYSIS OF FINANCIAL CONDITION AND RESULTS OF OPERATIONS |
53 | |||
| 79 | ||||
| 96 | ||||
| 103 | ||||
| 114 | ||||
| 119 | ||||
| 122 | ||||
| 128 | ||||
| MATERIAL U.S. FEDERAL INCOME TAX CONSIDERATIONS FOR NON-U.S. HOLDERS |
131 | |||
| 135 | ||||
| 140 | ||||
| 140 | ||||
| 140 | ||||
| F-1 |
You should rely only on the information contained in this document or to which we have referred you. We have not, the selling stockholders have not and the underwriters have not authorized anyone to provide you with information that is different. This document may only be used where it is legal to sell these securities. The information in this document may only be accurate on the date of this document.
Dealer Prospectus Delivery Obligation
Until , 2014 (the 25th day after the date of this prospectus), all dealers that effect transactions in these securities, whether or not participating in this offering, may be required to deliver a prospectus. This is in addition to the dealer’s obligation to deliver a prospectus when acting as an underwriter and with respect to unsold allotments or subscriptions.
For investors outside the United States: We have not, the selling stockholders have not and the underwriters have not done anything that would permit this offering, or possession or distribution of this prospectus, in any jurisdiction where action for that purpose is required, other than in the United States. Persons outside the United States who come into possession of this prospectus must inform themselves about, and observe any restrictions relating to, the offering of the shares of common stock and the distribution of this prospectus outside of the United States.
i
Table of Contents
This summary highlights information contained elsewhere in this prospectus and does not contain all of the information that you should consider in making your investment decision. Before investing in our common stock, you should carefully read this entire prospectus, including our consolidated financial statements and the related notes and the information set forth under the sections titled “Risk Factors,” “Special Note Regarding Forward-Looking Statements,” and “Management’s Discussion and Analysis of Financial Condition and Results of Operations,” in each case included in this prospectus. Unless the context otherwise requires, we use the terms “Yodle,” “company,” “our,” “us,” and “we” in this prospectus to refer to Yodle, Inc. and, where appropriate, our consolidated subsidiaries.
Overview
Yodle is a leading provider of cloud-based marketing automation solutions for local businesses that makes digital marketing easy, affordable and transparent. Our platform provides our customers with an online, mobile and social presence, as well as automates, manages and optimizes their marketing activities and other consumer interactions. We utilize our proprietary data assets and algorithms to increase the likelihood that consumers will find our customers and become their paying consumers. Our platform provides our customers with transparency into their marketing activities and business operations, thereby enabling them to evaluate their return on investment, or ROI. Our solutions are highly integrated and designed to be easy-to-use, helping local businesses navigate the rapidly evolving, technologically challenging and highly fragmented digital marketing landscape without having to invest a significant amount of time and money or needing any in-house marketing or IT expertise.
We believe the market for our local marketing automation platform is large and underserved. According to the most recent U.S. Census Bureau data, there are more than 28 million local businesses in the United States. We currently target industry verticals with approximately 7 million local businesses, the largest categories of which include legal and professional, dental and medical and contractor and other home services. We served approximately 44,800 local businesses as of March 31, 2014. Local businesses are increasingly purchasing cloud-based technologies and services to operate and grow. According to a report by Parallels, a hosting and cloud services company, small- and medium-sized businesses, or SMBs, in the United States spent $8.5 billion in 2013 on cloud services related to web presence, web applications and business applications, and are expected to spend $15.1 billion in 2017. BIA/Kelsey estimates that spending on local digital advertising will increase from $28 billion in 2013 to $53 billion in 2018. In addition, AMI-Partners, an independent market research firm, estimates that there are approximately 74 million local businesses globally.
We generate revenues from subscriptions to our platform and sales of our media offering. Our platform revenue is attributable to direct sales of subscriptions to our platform products, which currently include our Marketing Essentials, Centermark and Lighthouse products. Marketing Essentials is our flagship product that includes three modules: presence, conversion optimization and communication automation. Centermark leverages certain core capabilities of Marketing Essentials by providing a standardized source of shared data, communication and reporting to address the needs of national franchisors and other similar businesses. Lighthouse is our business practice automation product, which automates many of our customers’ daily consumer interactions or office routines. We also derive additional platform revenues from sales of our products sold through resellers. Our media revenue is attributable to direct sales of our Yodle Ads media product, which automates, manages and optimizes our customers’ media spend across mobile and desktop search engines. We refer to our offerings and the packages in which we sell them as products.
Over nine years of focusing on the unique and constantly evolving digital marketing needs of local businesses, we have developed a differentiated approach to addressing this large and fragmented market. We use our sophisticated technology, rigorous data collection and analytics and scalable process automation in all key aspects of our business. Our solutions are highly integrated and optimized using our proprietary algorithms and
1
Table of Contents
the data assets we have built by tracking billions of consumer interactions. Our local inside sales force utilizes our proprietary and sophisticated customer prospecting and sales force automation system, which helps us determine the most effective sales strategy for each local business prospect. In addition, our customer onboarding and service processes for all of our products are highly automated, which enables us to rapidly launch the digital presence of our customers. We also offer some customization for our brand network customers that enables them to tailor our products for their specific business objectives. As a result, we believe we have a compelling business model which is characterized by low customer acquisition and onboarding costs and rapid payback, resulting in attractive customer economics and high returns on our initial investment.
We have grown our revenues from $87.6 million in 2011 to $161.9 million in 2013, representing a compound annual growth rate of 36%. Over this same period, our cost of revenues as a percentage of revenues have decreased from 39% to 33%, while our net loss has decreased from $15.4 million to $10.4 million. For the three months ended March 31, 2014, we had revenues of $45.7 million and net losses of $5.9 million. Our customers have increased from approximately 6,000 as of December 31, 2009 to approximately 44,800 as of March 31, 2014.
Our Industry
Consumers are increasingly changing the way they discover and interact with local businesses, shifting away from traditional media such as yellow pages directories, newspapers, radio and television, and interactions in person and over the telephone, to various digital resources, including desktop and mobile search, online directories, review sites, email and other mobile applications. As a result, businesses are challenged to navigate and manage an increasingly complex marketing landscape. Businesses need a comprehensive digital presence that includes a professional quality website that is easily discoverable and optimized for mobile devices, exposure on leading online directories and ratings and reviews sites, and tools to communicate with customers via email, text messages and social media. Large enterprises address this complexity by using sophisticated third-party software solutions that are expensive and require significant internal expertise to manage. However, local businesses generally lack the resources and expertise to access the benefits of enterprise-level solutions. Instead, they are left to choose from a number of disparate point solutions that only address a limited set of their challenges, are not integrated to work together and require local businesses to pay for and manage multiple vendors.
In addition, many national franchisors, manufacturers and multi-location businesses operate networks of individually-operated franchises, dealerships and offices that sell products or provide services at a local level. We refer to these businesses as brand networks. We believe that the challenges faced by individual locations within a brand network are very similar to those of independent local businesses. Brand network owners, however, have additional unique challenges that include ensuring that individual network locations have a robust local digital presence that is consistent with their brand identity and facilitating their individual locations to maximize their investments in local marketing solutions in order to increase sales across the network. To accomplish this, a brand network owner requires clear visibility and analytics into the performance of its marketing programs across its network and an ability to enable the individual locations within its network to achieve the brand network owner’s marketing objectives.
Our Solution
We are seeking to transform the way that local businesses create and manage their online and mobile presence, and how they attract and engage with consumers. Our platform provides local businesses with a comprehensive suite of capabilities to compete in the digital world. For our customers, we establish a digital presence that is algorithmically optimized to increase the likelihood that consumers will find and transact with them and provide powerful tools that we believe help them attract, manage and retain consumers. Our cloud-based marketing automation platform provides local businesses with the following key benefits:
| • | Comprehensive, intuitive and easy-to-use platform for attracting and engaging consumers. Our local marketing automation platform provides the essential features that local businesses need to attract, manage and retain consumers, including a mobile-optimized website, social presence, offer management, automated media buying and communication tools, such as email and text messaging. These features are |
2
Table of Contents
| bundled into an integrated and easy-to-use platform, thereby liberating a local business from the confusion and complexity of deciding which point solutions to utilize and avoiding the expense and challenges of managing multiple vendors. |
| • | Increased revenues from new and existing consumers. Our platform is designed to help our customers to efficiently acquire and retain consumers, improve the effectiveness of their marketing efforts and help them meet their marketing and business objectives. |
| • | Mobile solutions optimized for consumers and local business owners. We optimize our customers’ websites for use on mobile devices in order to make their websites easier for consumers to discover and use. We also provide our customers with a mobile dashboard that allows them to monitor performance metrics and manage their content from their mobile devices. |
| • | Transparency. Our platform allows our customers to easily monitor and manage their digital presence and marketing activities. We present relevant, real-time performance metrics which enable our customers to better understand and evaluate their ROI. |
| • | Affordable pricing. Based on data from BIA/Kelsey, we believe the average SMB spends approximately $400 per month on marketing. We have generally priced our flagship product, Marketing Essentials, including all three of its current modules, at less than $300 per month since its introduction in March 2014. We believe, based on publicly available market pricing information, that re-creating the functionality of our Marketing Essentials product by purchasing multiple point solutions would cost a local business at least twice that amount. |
As a result of these benefits, we refer to our platform as a “CMO-in-a-box” for our local business customers, because our solutions are designed to develop and manage their marketing activities and other consumer interactions, similar to the manner in which a chief marketing officer, or CMO, would for a large enterprise.
We also address the unique requirements of brand networks with our Centermark product, which leverages the core capabilities of our platform by providing a standardized source of shared data, communication and reporting to brand network owners. Centermark enables brand network owners to extend many of the same benefits enjoyed by our local business customers to the individual locations in their network. Additionally, Centermark incorporates powerful communication, monitoring and analytics tools, which help brand network owners increase the value of their networks.
Our Competitive Strengths
Our key competitive strengths include:
| • | Comprehensive, integrated and easy-to-use platform. The breadth, depth and highly integrated nature of our platform offers significant advantages to our customers as it is designed to be comprehensive and work together. We believe that these attributes provide our customers with superior value and performance results compared to the disparate point solutions available in the market. |
| • | Proprietary data assets. We utilize our proprietary data assets to algorithmically optimize our customers’ online and mobile content, email campaigns, website and ad copy templates, and keywords for search engine optimization, or SEO, and search engine marketing, or SEM, purposes. We believe our proprietary data assets allow us to more effectively measure and improve the marketing performance of websites, digital advertising and communications for our customers. |
| • | Powerful data-driven network effects. As we continue to add more local business customers to our platform and collect and analyze more data about our customers’ marketing performance and business operations, we are able to improve the performance of our platform and ultimately drive higher value to our current and future customers by further improving their ROI. |
3
Table of Contents
| • | Vertical expertise. We currently target local businesses in the following key categories of industry verticals: legal and professional, dental and medical and contractor and other home services. As we grow our presence in these industry verticals, we are able to develop additional expertise in those verticals. We believe that our scale, depth and operational integration in specific verticals provide us with a competitive advantage in gathering data and optimizing marketing performance and business operations for our customers in those industry verticals. |
| • | Low customer acquisition costs. Our highly automated, technology- and data-driven approach to sales promotes efficiency and scalability in our business model and enables us to efficiently acquire customers. Between 2011 and 2013, we reduced our average cost to acquire a customer while at the same time more than doubling the headcount of our sales force. |
| • | Rapid and scalable customer onboarding and service driven by process automation. We have made technology investments in process automation that allow us to scale rapidly and onboard customers without adding significant incremental costs or impacting the level of quality. Although we have designed our products to be highly intuitive, we provide our customers access to our responsive, technology-enabled customer service team. |
| • | Track record of innovation. We are focused on driving innovation in the local digital marketing industry, identifying and interpreting emerging technology and trends on behalf of our customers to enable them to benefit from our innovation. Our focus on innovation allows us to quickly adapt to the evolving landscape and provide our customers with valuable solutions, often before they identify a need for such solutions. |
Our competitive strengths result in what we believe is an attractive business model. Our low customer acquisition and onboarding costs minimize our initial investment to bring on new customers and allow us to achieve rapid payback. We define payback as occurring when the costs associated with acquiring and launching a cohort of new customers in any given quarter is offset by the ongoing cash flow from those customers, less our ongoing costs. We are typically able to generate positive cash flows within the first year after acquiring and launching a cohort of new customers, including the impact from customers who do not renew their subscriptions or service during the first year and excluding overhead costs. As a result, we believe our business model benefits from rapid payback. We refer to customers who we acquired directly (i.e., not through resellers) and who remain as customers after their initial year as our tenured customers. For the 12 months ended March 31, 2014, we experienced a monthly average revenue retention rate of 97.5% for our tenured customers. We expect the revenue retention rate for our tenured customers to continue to improve as our mix of revenues shifts toward revenues from platform products, as revenue derived from customers who subscribe to our platform products generally exhibits a higher retention rate than revenue derived from customers who purchase our media product. We believe that our low customer acquisition and onboarding costs, rapid payback and high monthly revenue retention of our tenured customers results in a business model that generates attractive customer economics and high returns on our initial investment.
Our Growth Strategy
We believe that we are in the very early stages of a large and long-term business opportunity. Our growth strategy for pursuing this opportunity includes the following key components:
| • | Further penetrate our existing industry verticals. Of the estimated 28 million local businesses in the United States, we currently target industry verticals that include approximately 7 million local businesses. We plan to further penetrate these verticals by leveraging our existing sales infrastructure, investing in our direct sales teams and expanding our sales through partnerships with resellers. |
| • | Increase the number of customers that are operationally integrated with our platform. We intend to increase the number of customers with whom we have operational systems integration, including business |
4
Table of Contents
| management, scheduling and billing. We intend to accomplish this by increasing the number of salespeople selling Lighthouse, our business practice automation product, and Centermark, and increasing the number of industry verticals that we are targeting with our Lighthouse product. |
| • | Expand our distribution channels. We intend to pursue opportunities to sell our products through organizations that have existing relationships with local businesses, including by targeting brand network owners through our Centermark product and selectively partnering with resellers. |
| • | Expand into new industry verticals and geographies. We see significant opportunity in continuing to expand our footprint beyond our current industry verticals across a broad spectrum of local businesses in the United States. While we believe that the global market of 74 million local businesses provides us with further growth opportunities over the long term, our focus in the near term is growing our business in the United States and Canada. |
| • | Continue to introduce new products and enhance the functionality of our platform. We plan to introduce new products, develop new functionality for our platform and address the latest marketing opportunities and challenges facing local businesses. |
| • | Pursue selective strategic acquisitions. We intend to selectively acquire businesses that can provide us with complementary technologies and products, or access to new customers, industry verticals or geographies. |
Risks Related to Our Business and Our Industry
Our business is subject to numerous risks and uncertainties, including those highlighted in the section titled “Risk Factors” immediately following this prospectus summary. These risks include, among others, the following:
| • | We have a short operating history in an evolving industry, which makes it difficult to evaluate our future prospects and may increase the risk that we will not be successful. |
| • | We have incurred significant operating losses in the past, and we may not be able to generate sufficient revenues to achieve or maintain profitability. |
| • | Our products are sold on a short-term basis, and if subscription renewal or customer retention rates decrease or we do not accurately predict these rates, our future revenues and operating results may be harmed. |
| • | Many of our products are new and if we are unsuccessful at marketing our products to local businesses, we may not be able to achieve our growth and business objectives. |
| • | Our future success will depend in part on our ability to expand into new industry verticals. |
| • | We purchase a majority of our media from Google, and our business could be adversely affected if Google takes actions that are adverse to our interests. Similar actions from Yahoo!, Microsoft and other media providers could adversely affect our business to a lesser degree. |
| • | If our SEO strategies fail to help our customers get discovered more easily in unpaid search results, our business could be adversely affected. |
| • | Our revenue growth will be adversely affected if we cannot continue to successfully retain, hire, train and manage qualified personnel, especially those in sales and marketing. |
| • | We may not be able to continue to add new customers or retain or increase sales to our existing customers, which could adversely affect our operating results. |
| • | We expect to face increased competition in the digital marketing industry, which could require us to reduce our selling prices or expand the products or features that we offer. As a result of such competitive pressures, we may not be able to maintain or improve our competitive position or market share. |
5
Table of Contents
Implications of Being an Emerging Growth Company
We qualify as an “emerging growth company” as defined in the Jumpstart Our Business Startups Act of 2012, or the JOBS Act. An emerging growth company may take advantage of specified reduced reporting and other burdens that are otherwise applicable generally to public companies. These provisions include:
| • | a requirement to have only two years of audited financial statements and only two years of related selected financial data and management’s discussion and analysis of financial condition and results of operations disclosure; |
| • | an exemption from the auditor attestation requirement in the assessment of our internal control over financial reporting pursuant to the Sarbanes-Oxley Act of 2002, or the Sarbanes-Oxley Act; |
| • | an exemption from new or revised financial accounting standards until they would apply to private companies and from compliance with any new requirements adopted by the Public Company Accounting Oversight Board requiring mandatory audit firm rotation; |
| • | reduced disclosure about the emerging growth company’s executive compensation arrangements; and |
| • | no requirement to seek non-binding advisory votes on executive compensation or golden parachute arrangements. |
We may take advantage of some or all these provisions until we are no longer an emerging growth company. We will remain an emerging growth company until the earlier to occur of (1) the last day of the fiscal year (a) following the fifth anniversary of the completion of this offering, (b) in which we have total annual gross revenues of at least $1.0 billion or (c) in which we are deemed to be a “large accelerated filer,” under the rules of the U.S. Securities and Exchange Commission, or SEC, which means the market value of our common stock that is held by non-affiliates exceeds $700 million as of the prior June 30th, and (2) the date on which we have issued more than $1.0 billion in non-convertible debt during the prior three-year period.
We are choosing to “opt out” of the provision of the JOBS Act that permits emerging growth companies to take advantage of an extended transition period to comply with new or revised accounting standards applicable to public companies and, as a result, we will comply with new or revised accounting standards as required when they are adopted. This decision to opt out of the extended transition period is irrevocable.
We have elected to adopt the reduced disclosure requirements available to emerging growth companies, and only provide three years of selected financial data and reduced disclosure about our executive compensation arrangements in this prospectus. As a result of these elections, the information that we provide in this prospectus may be different than the information you may receive from other public companies in which you hold equity interests. In addition, it is possible that some investors will find our common stock less attractive as a result of these elections, which may result in a less active trading market for our common stock and higher volatility in our stock price.
Corporate Information
Yodle, Inc. was originally incorporated under the laws of the State of Delaware under the name Natpal, Inc. in March 2005. We changed our name to Yodle, Inc. in July 2007.
Our principal executive office is located at 50 West 23rd Street, Suite 401, New York, NY 10010. Our telephone number is (212) 542-5400. Our website address is www.yodle.com. Information contained in, or accessible through, our website does not constitute a part of, and is not incorporated into, this prospectus.
The Yodle logo and names Yodle® and Centermark™ and other trademarks or service marks of Yodle, Inc. appearing in this prospectus are the property of Yodle, Inc. and its consolidated subsidiaries. This prospectus contains additional trade names, trademarks and service marks of others, which are the property of their respective owners. Solely for your convenience, trade names, trademarks and service marks contained in this prospectus may appear without the “®” or “™” symbols. Such references are not intended to indicate, in any way, that we will not assert, to the fullest extent possible under applicable law, our rights or the rights of the applicable licensor to those trade names, trademarks and service marks.
6
Table of Contents
THE OFFERING
| Common stock offered by Yodle |
shares |
| Common stock offered by the selling stockholders |
shares |
| Total common stock offered |
shares |
| Total common stock to be outstanding after this offering |
shares |
| Over-allotment option offered by |
shares |
| Use of proceeds |
The principal purposes of this offering are to create a public market for our common stock and to facilitate our future access to the public equity markets, as well as to obtain additional capital. We intend to use a portion of the net proceeds from this offering to repay (1) $ million of indebtedness outstanding under our existing credit facilities and (2) a $6.2 million deferred payment obligation. We intend to use the remainder of the net proceeds for general corporate purposes. In addition, we may use a portion of the proceeds from this offering for acquisitions of complementary businesses, technologies or other assets, although we do not currently have any plans for any acquisitions. We will not receive any of the proceeds from the sale of shares to be offered by the selling stockholders. See the section of this prospectus titled “Use of Proceeds.” |
| Risk factors |
See the section of this prospectus titled “Risk Factors” and the other information included in this prospectus for a discussion of factors you should carefully consider before deciding to invest in our common stock. |
| Proposed Symbol |
“YO” |
The number of shares of our common stock that will be outstanding after this offering is based on the number of shares outstanding as of May 31, 2014, and excludes:
| • | 21,929,642 shares of common stock issuable upon the exercise of options outstanding as of May 31, 2014, at a weighted-average exercise price of $1.5648 per share; |
| • | shares of our common stock reserved for future issuance pursuant to our equity incentive plans, including (1) shares pursuant to our 2014 Equity Incentive Plan, or 2014 Plan, (2) shares pursuant to our 2014 Employee Stock Purchase Plan, or 2014 ESPP, each of which will become effective prior to the completion of this offering and will include provisions that automatically increase the number of shares of common stock reserved for issuance thereunder each year and (3) 1,170,473 shares of our common stock reserved for issuance under our 2007 Equity Incentive Plan, or the 2007 Plan, which shares will be added to the shares reserved under the 2014 Plan upon its effectiveness; |
| • | 1,242,829 shares of common stock issuable upon the exercise of certain preferred stock warrants that were outstanding as of May 31, 2014, at a weighted-average exercise price of $0.9937 per share; and |
| • | 200,553 shares of common stock issuable upon the exercise of certain common stock warrants that were outstanding as of May 31, 2014, at a weighted-average exercise price of $1.1676 per share. |
7
Table of Contents
Unless otherwise indicated, this prospectus reflects and assumes the following:
| • | a -for- reverse stock split of our common stock expected to be completed prior to the completion of this offering; |
| • | the reclassification of 1,242,829 shares of preferred stock issuable upon the exercise of outstanding preferred stock warrants immediately prior to the completion of this offering into 1,242,829 shares of common stock issuable upon the exercise of such warrants, which reclassification is expected to occur automatically immediately prior to the completion of this offering; |
| • | the automatic net exercise of preferred stock warrants to purchase 1,537,917 shares of our common stock at an exercise price of $1.4045 per share, which will occur immediately prior to the completion of this offering, as described in the section titled ‘‘Description of Capital Stock—Warrants,’’ which we refer to as the automatic preferred stock warrant exercise; |
| • | the automatic conversion of 82,650,815 outstanding shares of our preferred stock into an aggregate of shares of our common stock, which will occur automatically immediately prior to the completion of this offering (assuming a conversion ratio equal to common shares for each Series F preferred share based on an assumed initial public offering price of $ per share, which is the midpoint of the range set forth on the cover page of this prospectus); |
| • | the filing and effectiveness of our certificate of incorporation in Delaware and the adoption of our bylaws, each of which will occur immediately prior to the completion of this offering; |
| • | no exercise of outstanding options, common stock warrants or preferred stock warrants (other than the automatic preferred stock warrant exercise) after May 31, 2014; and |
| • | no exercise by the underwriters of their over-allotment option. |
Series F Conversion Ratio
The number of shares of our common stock to be issued upon the automatic conversion of all outstanding shares of our Series F preferred stock depends on the initial public offering price of our common stock. The terms of our Series F preferred stock provide that the ratio at which each share of this series of preferred stock automatically converts into shares of our common stock in connection with this offering will increase if the initial public offering price is below $ per share, which would result in additional shares of our common stock being issued upon conversion of our Series F preferred stock immediately prior to the closing of this offering. Based upon the assumed initial public offering price of $ per share, the midpoint of the price range set forth on the cover page of this prospectus, the outstanding shares of our Series F preferred stock will convert into an aggregate of approximately shares of our common stock immediately prior to the completion of this offering.
For illustrative purposes only, the table below shows the number of shares of our common stock that would be issuable upon conversion of the Series F preferred stock at various initial public offering prices, as well as the total number of outstanding shares of our common stock as a result:
| Assumed Public Offering Price |
Series F Preferred Stock Conversion Ratio |
Shares of Common Stock Issuable upon Conversion of Series F Preferred Stock |
Total Shares of Common Stock Outstanding After this Offering | |||
8
Table of Contents
SUMMARY CONSOLIDATED FINANCIAL AND OTHER DATA
The following tables set forth a summary of our consolidated financial and other data for, and as of the periods ended on, the dates indicated. The consolidated statements of operations and comprehensive loss data for the years ended December 31, 2011, 2012 and 2013 and the consolidated balance sheet data as of December 31, 2013 are derived from our audited consolidated financial statements included elsewhere in this prospectus. The condensed consolidated statements of operations and comprehensive income (loss) data for the three months ended March 31, 2013 and March 31, 2014 and the condensed consolidated balance sheet data as of March 31, 2014 are derived from our unaudited interim condensed consolidated financial statements included elsewhere in this prospectus. Our unaudited interim condensed consolidated financial statements were prepared on a basis consistent with our audited consolidated financial statements and include, in management’s opinion, all normal recurring adjustments necessary for the fair presentation of the financial information set forth in those statements included elsewhere in this prospectus.
When you read this summary consolidated financial and other data, it is important that you read it together with the historical consolidated financial statements and related notes to those statements, as well as the sections of this prospectus titled “Selected Consolidated Financial and Other Data” and “Management’s Discussion and Analysis of Financial Condition and Results of Operations.” Our historical results are not necessarily indicative of the results that may be expected for any future period.
| Year Ended December 31, | Three Months Ended March 31, |
|||||||||||||||||||
| 2011 | 2012 | 2013 | 2013 | 2014 | ||||||||||||||||
| (in thousands, except per share and customer data) | ||||||||||||||||||||
| (unaudited) | ||||||||||||||||||||
| Consolidated Statements of Operations Data: |
||||||||||||||||||||
| Revenues |
$ | 87,584 | $ | 132,321 | $ | 161,863 | $ | 35,202 | $ | 45,746 | ||||||||||
|
|
|
|
|
|
|
|
|
|
|
|||||||||||
| Costs and expenses: |
||||||||||||||||||||
| Cost of revenues (exclusive of depreciation and amortization shown separately below)(1) |
33,876 | 42,760 | 53,843 | 11,925 | 14,446 | |||||||||||||||
| Selling and marketing(1) |
36,318 | 51,623 | 64,605 | 14,076 | 18,628 | |||||||||||||||
| Technology and product development(1) |
10,157 | 14,977 | 20,346 | 4,568 | 5,660 | |||||||||||||||
| General and administrative(1) |
15,305 | 19,591 | 29,271 | 6,085 | 8,349 | |||||||||||||||
| Depreciation and amortization |
2,328 | 3,721 | 6,419 | 1,248 | 1,845 | |||||||||||||||
|
|
|
|
|
|
|
|
|
|
|
|||||||||||
| Total costs and expenses |
97,984 | 132,672 | 174,484 | 37,902 | 48,928 | |||||||||||||||
|
|
|
|
|
|
|
|
|
|
|
|||||||||||
| Loss from operations |
(10,400 | ) | (351 | ) | (12,621 | ) | (2,700 | ) | (3,182 | ) | ||||||||||
| Interest expense and other |
(7,074 | ) | (4,690 | ) | (2,912 | ) | (440 | ) | (2,660 | ) | ||||||||||
|
|
|
|
|
|
|
|
|
|
|
|||||||||||
| Loss before income taxes |
(17,474 | ) | (5,041 | ) | (15,533 | ) | (3,140 | ) | (5,842 | ) | ||||||||||
| (Benefit) provision for income taxes |
(2,035 | ) | 387 | (5,131 | ) | (5,327 | ) | 103 | ||||||||||||
|
|
|
|
|
|
|
|
|
|
|
|||||||||||
| Net (loss) income and comprehensive (loss) income |
$ | (15,439 | ) | $ | (5,428 | ) | $ | (10,402 | ) | $ | 2,187 | $ | (5,945 | ) | ||||||
|
|
|
|
|
|
|
|
|
|
|
|||||||||||
| Net (loss) income per share attributable to common stockholders(2) |
||||||||||||||||||||
| Basic |
$ | (0.48 | ) | $ | (0.17 | ) | $ | (0.29 | ) | $ | — | $ | (0.14 | ) | ||||||
|
|
|
|
|
|
|
|
|
|
|
|||||||||||
| Diluted |
$ | (0.48 | ) | $ | (0.17 | ) | $ | (0.29 | ) | $ | — | $ | (0.14 | ) | ||||||
|
|
|
|
|
|
|
|
|
|
|
|||||||||||
| Weighted-average shares used to compute net (loss) income per share attributable to common stockholders(2) |
||||||||||||||||||||
| Basic |
31,955 | 32,573 | 35,743 | 34,279 | 41,243 | |||||||||||||||
|
|
|
|
|
|
|
|
|
|
|
|||||||||||
| Diluted |
31,955 | 32,573 | 35,743 | 46,876 | 41,243 | |||||||||||||||
|
|
|
|
|
|
|
|
|
|
|
|||||||||||
| Pro forma net (loss) income per share attributable to common stockholders—basic and diluted(3) |
||||||||||||||||||||
|
|
|
|||||||||||||||||||
| Pro forma weighted-average shares used to compute pro forma net (loss) income per share attributable to common stockholders—basic and diluted(3) |
||||||||||||||||||||
|
|
|
|||||||||||||||||||
| Other Financial and Other Data (unaudited): |
||||||||||||||||||||
| Number of Customers(4) |
27,200 | 29,300 | 42,000 | 33,800 | 44,800 | |||||||||||||||
| Adjusted EBITDA(5) |
$ | (5,899 | ) | $ | 6,236 | $ | 1,819 | $ | 286 | $ | 378 | |||||||||
9
Table of Contents
| As of December 31, 2013 |
As of March 31, 2014 | |||||||||
| Actual | Pro forma as adjusted(6) | |||||||||
| (in thousands) | ||||||||||
| (unaudited) | ||||||||||
| Consolidated Balance Sheet Data: |
||||||||||
| Cash and cash equivalents |
$ | 12,345 | $ | 10,274 | ||||||
| Working capital (deficit)(7) |
(27,325 | ) | (32,721 | ) | ||||||
| Total assets |
93,729 | 93,663 | ||||||||
| Long-term debt, including current portion(8) |
29,609 | 30,228 | ||||||||
| Total liabilities |
74,456 | 75,825 | ||||||||
| Convertible preferred stock |
62,411 | 65,159 | ||||||||
| Total stockholders’ (deficit) equity |
(43,138 | ) | (47,321 | ) | ||||||
| (1) | Includes stock-based compensation expense as follows: |
| Year Ended December 31, | Three Months Ended March 31, |
|||||||||||||||||||
| 2011 | 2012 | 2013 | 2013 | 2014 | ||||||||||||||||
| (in thousands) | ||||||||||||||||||||
| (unaudited) | ||||||||||||||||||||
| Cost of revenues |
$ | 15 | $ | 17 | $ | 15 | $ | 4 | $ | 10 | ||||||||||
| Selling and marketing |
422 | 577 | 780 | 241 | 237 | |||||||||||||||
| Technology and product development |
235 | 445 | 675 | 159 | 218 | |||||||||||||||
| General and administrative |
1,160 | 1,827 | 1,161 | 521 | 214 | |||||||||||||||
|
|
|
|
|
|
|
|
|
|
|
|||||||||||
| Total stock-based compensation expense |
$ | 1,832 | $ | 2,866 | $ | 2,631 | $ | 925 | $ | 679 | ||||||||||
|
|
|
|
|
|
|
|
|
|
|
|||||||||||
| (2) | See note 15 to our unaudited interim condensed consolidated financial statements and note 21 to our consolidated financial statements for an explanation of the calculations of our actual basic and diluted net (loss) income per share attributable to common stockholders. |
| (3) | Pro forma basic and diluted net (loss) income per share attributable to common stockholders represents net (loss) income and comprehensive (loss) income divided by the pro forma weighted-average shares of common stock outstanding. Pro forma weighted-average shares of common stock outstanding reflects (a) the automatic preferred stock warrant exercise and (b) the conversion of preferred stock (using the if-converted method) into common stock as though the conversion had occurred on the later of the issuance date or the first day of the relevant period (assuming a conversion ratio equal to common shares for each Series F preferred share based on an assumed initial public offering price of $ per share, which is the midpoint of the range set forth on the cover page of this prospectus). See the section “—The Offering” above for a description of the number of shares issuable upon conversion of our Series F preferred stock, which depends on the initial public offering price of our common stock. |
| (4) | We calculate the number of customers at the end of each fiscal year as the number of unique customers with a subscription to one or more of our platform products and customers of our Yodle Ads product, rounded down to the nearest hundred. We consider as separate customers each location of a brand network that uses one of our more of our products. In cases where our customers have subscriptions to our platform obtained through resellers, we include those customers in our customer count. |
| (5) | We define Adjusted EBITDA as our net (loss) income and our comprehensive (loss) income plus (minus): interest expense and other, (benefit) provision for income taxes and depreciation and amortization expense, adjusted to eliminate the impact of stock-based compensation expense, which is a non-cash item, and the effect of charges related to business combination and asset acquisition. Please see footnote (5) to the table of the section of this prospectus titled “Selected Consolidated Financial and Other Data” for more information and for a reconciliation of Adjusted EBITDA to net (loss) income and our comprehensive (loss) income, the most directly comparable financial measure calculated and presented in accordance with accounting principles generally accepted in the United States of America, or GAAP. |
| (6) | Reflects on a pro forma as adjusted basis (a) the conversion described in footnote (3)(b) above, (b) the reclassification of our preferred stock warrant liabilities to additional paid-in capital upon the automatic conversion of certain of our preferred stock warrants into warrants exercisable for our common stock, which will occur automatically upon the completion of this offering, (c) the automatic preferred stock warrant exercise, (d) our sale of shares of common stock in this offering at an assumed initial public offering price of $ per share, which is the midpoint of the range set forth on the cover page of this prospectus, after deducting estimated underwriting discounts and commissions and estimated offering expenses payable by us, (e) a $ million deemed dividend on our Series F preferred stock, as described in “Capitalization,” and (f) the application of $ million of the net proceeds of this offering to repay indebtedness outstanding under our existing credit facilities and $6.2 million of the net proceeds of this offering to satisfy certain of our deferred payment obligations, as described in “Use of Proceeds.” |
10
Table of Contents
| The pro forma as adjusted information presented in the summary balance sheet data is illustrative only and will change based on the actual initial public offering price and other terms of this offering determined at pricing. Each $1.00 increase or decrease in the assumed initial public offering price of $ per share, which is the midpoint of the range set forth on the cover page of this prospectus, would increase or decrease each of cash and cash equivalents, working capital, total assets and total stockholders’ (deficit) equity on a pro forma as adjusted basis by approximately $ million, assuming that the number of shares offered by us, as set forth on the cover page of this prospectus, remains the same, after deducting estimated underwriting discounts and commissions. We may also increase or decrease the number of shares we are offering. Each increase or decrease of in the number of shares offered by us would increase or decrease each of cash and cash equivalents, working capital, total assets and total stockholders’ (deficit) equity by approximately $ million, assuming that the assumed initial public offering price of $ per share, which is the midpoint of the range set forth on the cover page of this prospectus, remains the same, and after deducting the estimated underwriting discounts and commissions. |
| (7) | Working capital (deficit) includes all current assets less all current liabilities. |
| (8) | Includes current and long-term portions of bank loan, current and long-term portions of subordinated debt and deferred consideration. As of March 31, 2014, it also included $4.8 million in accrued expenses and other current liabilities and $0.3 million in other liabilities, long-term portion, which includes deferred payments of $4.5 million related to our acquisition of Lighthouse Practice Management classified as accrued compensation expense and $0.6 million related to our asset acquisition from New Service, LLC. As of December 31, 2013, it also included the cash portion of contingent consideration in business combination and $4.0 million in long-term portion of other liabilities, but excluded the fair value attributable to 869,565 shares of Series E preferred stock payable as non-cash earn-out consideration. Amounts are disclosed at full payment value and do not reflect reductions for fair value adjustments that are reflected on the balance sheet. |
11
Table of Contents
Investing in our common stock involves a high degree of risk. You should carefully consider the risks and uncertainties described below, together with all of the other information in this prospectus, including the information set forth under “Management’s Discussion and Analysis of Financial Condition and Results of Operations” and our consolidated financial statements and related notes, before deciding whether to purchase shares of our common stock. Any of the following risks could materially and adversely affect our business, financial condition, results of operations and future growth prospects. As a result, the market price of our common stock could decline and you could lose some or all of your investment.
Risks Related to Our Business and Our Industry
We have a short operating history in an evolving industry, which makes it difficult to evaluate our future prospects and may increase the risk that we will not be successful.
We were founded in 2005, and our first product was a search engine marketing, or SEM, optimization bidding engine, which we typically sold in conjunction with building a website for our customers. We have since expanded our product offerings to address a broad array of digital marketing needs of local businesses, which we define as non-employer firms and businesses with up to 99 employees. Our short history, evolving strategy and operations in a new and developing market make it difficult to effectively assess our future prospects. You should, therefore, consider our future prospects in light of the challenges and uncertainties that we face, including, among other things:
| • | that our business has grown rapidly, and we only recently expanded from an SEM, website building and SEO company to a company offering a broad suite of marketing products to local businesses and brand networks; |
| • | that it may not be possible to discern fully the trends that we are subject to based on our limited operating history in a new and developing market; |
| • | increased competition and the offering of new products and solutions by our competitors; |
| • | our ability to retain and increase sales to existing customers and attract new customers on a cost-effective basis; |
| • | our ability to monitor and comply with evolving regulations affecting our business or our customers’ businesses; |
| • | our ability to meet our customers’ evolving needs and expectations; and |
| • | our ability to manage, measure and demonstrate the effectiveness of our platform and to continue to develop or acquire new products and technologies that are appealing to our customers. |
These factors and others may make it difficult to evaluate our current business and future prospects. Failure to adequately address any of the challenges above could adversely affect our business and, as a result, our revenues and results of operations.
We have incurred significant operating losses in the past, and we may not be able to generate sufficient revenue to achieve or maintain profitability.
Since our inception, we have incurred significant operating losses, and, as of March 31, 2014, we had an accumulated deficit of approximately $84.5 million. Although our revenues have grown rapidly, increasing from $87.6 million in 2011 to $161.9 million in 2013, we have experienced net losses of $15.4 million, $5.4 million and $10.4 million in 2011, 2012 and 2013, respectively. For the three months ended March 31, 2014, we had revenues of $45.7 million and net losses of $5.9 million. In addition, we may not be able
12
Table of Contents
to continue our historical growth rate and you should not rely on the revenue growth of any prior quarterly or annual period as an indication of our future performance. We also expect our costs to increase in future periods as we continue to expend substantial financial resources on:
| • | sales and marketing; |
| • | customer service; |
| • | product and feature development; |
| • | our technology infrastructure; |
| • | domestic expansion efforts; |
| • | strategic opportunities, including commercial relationships and acquisitions; |
| • | ongoing compliance efforts in connection with new and evolving regulatory requirements; and |
| • | general and administration functions, including legal and accounting expenses related to being a public company. |
These investments may not result in increased revenue or growth of our business. If we are unable to maintain adequate revenue growth and to manage our expenses, we may continue to incur significant losses in the future and may not be able to achieve or maintain profitability.
Our products are sold on a short-term basis, and if subscription renewal or customer retention rates decrease or we do not accurately predict these rates, our future revenue and operating results may be harmed.
Typically, subscriptions to Marketing Essentials and related modules of our platform (including predecessor products) range from three- to 12-month initial subscription terms. Historically, these contracts have generally been extended on a month-to-month basis after the initial subscription term. After the initial subscription term, our customers can cancel their subscription at any time with little or no penalty. Subscriptions to our Centermark product, which we introduced in December 2013, typically have 12-month initial subscription terms or longer; however, some of these agreements are subject to termination if we do not achieve certain criteria. Typically, subscriptions to our Lighthouse product are for month-to-month subscription terms. In addition, sales of our Yodle Ads media product are generally on a short-term basis. As a result, we may have limited visibility into our future revenue streams, our revenues could quickly decelerate and we may not accurately forecast our future revenue streams or our subscription renewal or customer retention rates. If we fail to project accurately and/or our revenues decline, our operating results would be harmed and our stock price may decline.
Historically, we have experienced a high turnover rate in our customer base, especially within the first year of launching a customer. We believe there are a variety of factors which may result in increases in our turnover rate or fluctuations in our revenue. These factors include:
| • | customer satisfaction with our products; |
| • | our customers’ perceived value of our products and their return on investment, or ROI; |
| • | changes to pricing, including in connection with expanding our offerings; |
| • | the number of our products used by our customers; |
| • | decreased spending by our customers on advertising and marketing generally, and on digital marketing in particular; |
| • | cessation of our customers’ businesses, as small- and medium-sized local businesses have historically experienced high failure rates; |
| • | increased competition in the local business digital marketing environment; |
13
Table of Contents
| • | the products and prices offered by us and our competitors; |
| • | the evolving use of technology-based marketing solutions by local businesses; and |
| • | the overall economic environment in the United States and its impact on local businesses. |
If our customers do not renew their subscriptions or if they decrease the amount they spend with us, our revenue could decline and our operating results could suffer. In particular, if our Centermark customers do not renew their subscriptions or we do not renew our relationship with any of our resellers, we would likely lose a large number of customers at once, which could cause our revenue to decline and our operating results to suffer.
Many of our products are new and if we are unsuccessful at marketing our products to local businesses, we may not be able to achieve our growth and business objectives.
We introduced Marketing Essentials in the first quarter of 2014 as an integrated product to address the broad array of marketing needs of local businesses, and we introduced Centermark in December 2013 to address the marketing needs of brand networks. We have designed our products to address how our customers engage with and expand their relationships with consumers. For example, we have recently launched many of our mobile and social functionalities, as well as photo management, email automation, review management and offer management. Historically, and prior to expanding our product offerings, we focused our efforts on SEO and SEM activities. Because our growth strategy involves marketing our products to local businesses for use across a broader spectrum of our customers’ marketing objectives, such as retention, outreach and appointment automation, our ability to grow our business and increase our revenues will depend on our ability to successfully market our products and solutions to existing and prospective customers.
In addition, some of our newer products, such as Lighthouse, our business practice automation product, require integration into a customer’s practice management system, or PMS, or other customer relationship management or point of sale systems. While we have successfully integrated into a number of PMSs available in the marketplace, some of the PMSs, or other customer relationship management or point of sale systems, providers may not allow us to integrate into their systems or may charge a fee for this integration. Therefore, we may not be able to integrate with all PMSs, or other customer relationship management or point of sale systems, on terms that are reasonable to us, or at all. If we face significant challenges in integrating into widely used or newly adopted and popular PMSs, or other customer relationship management or point of sale systems, our ability to market our business practice automation product to our existing customers and prospective customers would be impaired, which could have a material adverse effect on our growth and business objectives.
We need to continue to make significant investments in product development and enhance our ability to demonstrate measurable benefits of the use of our products for our customers. Further, we may need to make significant additional investments in sales, marketing and customer service to educate the market on the benefits of our products. However, we have limited experience marketing our products to address the broader array of marketing and customer management objectives. Therefore, if we are unable to successfully market our products and local businesses do not adopt our products to pursue those objectives, our business will suffer.
Our future success will depend in part on our ability to expand into new industry verticals.
As we market our products to a wider group of potential customers outside of our current primary industry verticals, legal and professional, dental and medical and contractor and other home services, we will need to adapt and effectively market our products. We have limited experience with businesses within industry verticals which we have recently expanded into and businesses that are outside of the industry verticals we have historically focused on. Our success in expanding our products to businesses in new industry verticals and verticals into which we have recently expanded will depend on various factors, including our ability to:
| • | design products that are attractive to businesses in these industries and integrate new products and features into our platform; |
14
Table of Contents
| • | tailor our products to enable our customers to comply with rules and regulations applicable to businesses in these industries, including potential professional licensing requirements and/or advertising and marketing restrictions; |
| • | hire personnel with relevant industry vertical experience to lead sales, marketing, customer service and product development teams; and |
| • | accumulate sufficient data sets relevant for those industry verticals to ensure that we can deliver efficient and effective offerings within that industry. |
In particular, Lighthouse depends on our customers gathering sufficient data from their clients, customers or patients and having necessary consents from those clients, customers or patients in order for them to be contacted. Local businesses within certain industry verticals may not keep digital records of operational activities, such as appointments, which may make it more challenging for us to sell to these businesses, as we would not have access to the data on which our product relies. In addition, our appointment automation tool that is part of Lighthouse involves making telephone calls and sending text messages, which requires consent from the recipients of those calls and messages that may be challenging for a local business to obtain.
Because our business model depends, in part, on developing a highly standardized and scalable digital marketing solution for local businesses, we may face challenges in adapting our products to account for the needs of potential customers in new industry verticals, including due to the diverse ways in which they manage their clients, customers or patients and the broad array of potentially applicable licensing and regulatory regimes. If we are unable to successfully adapt or market our products to appeal to businesses in industries other than the verticals we have historically focused on, we may not be able to achieve our growth or business objectives. Further, as we expand our customer base and products into new industry verticals, we may be unable to maintain our current customer retention rates.
We purchase a majority of our media from Google, and our business could be adversely affected if Google takes actions that are adverse to our interests. Similar actions from Yahoo!, Microsoft and other media providers could adversely affect our business to a lesser degree.
A significant portion of our cost of revenues is composed of net traffic acquisition costs for the purchase of media, and a majority of the media we purchase is from Google. Google accounts for a large majority of all U.S. Internet searches, and Google’s share in foreign markets is often even greater. As a result, we expect that our media revenue will continue to depend on purchases from Google. This dependence makes us vulnerable to actions that Google may take to change the manner in which it sells AdWords, as described below, or conducts its business on a number of levels:
| • | Google can change the terms and conditions upon which it does business with us. Google can act unilaterally to change the terms and conditions for our purchase of media or the purchase of Google products, and Google has done so in the past. For example, Google requires us to disclose to customers of our Yodle Ads product the cost of our media purchases from Google, and recently requested that we increase the prominence of such disclosure. Failure to adequately comply with such requests could cause Google to remove certain benefits that we rely on for our business, such as free access to its application programming interfaces, or APIs, and our ability to benefit from its rebate programs described below, which could have a material adverse impact on our business and results of operations. Future changes by Google to the terms and conditions upon which we purchase media could materially and adversely affect our business. |
| • | Competitive risk. Google offers its products directly to local businesses through an online self-service option. Google enjoys substantial competitive advantages over us, such as substantially greater financial, technical and other resources. In addition, Google continues to launch products that are targeted directly at local businesses, which Google does not always make available to third parties. While we cannot assess at this time the effect of Google offering such products directly to local businesses, the prices charged by Google for direct service are lower than the prices we charge for the same media. As a result, we must convince our customers of the added value or performance of our products. |
15
Table of Contents
| • | Technology risk. Our technology platform interacts with Google through publicly available APIs. If Google were to discontinue or change the availability of all or a portion of these APIs to us, we may have to change our technology, incur additional costs or discontinue certain products that we currently offer our customers. Any of these changes could adversely affect our ability to provide effective digital marketing and reporting solutions to our customers. In addition, Google may decide to charge us for the right to use its APIs, which would adversely impact our results of operations absent any change in our pricing to our customers. |
| • | Rebate/Incentive risk. Google retains broad authority with respect to its rebate programs and has, from time to time, canceled certain of its rebate programs. In January 2014, we entered into a revised agreement with Google that, among other things, provides us with certain performance bonuses if we meet certain advertiser spend targets and other requirements. If we fail to meet those requirements, and as a result do not qualify for the rebates, our operating results would be harmed. Our agreement with Google expires in January 2016 and is subject to broad mutual termination rights. We may not be able to renew our agreement with Google on favorable terms, or at all. Termination of this agreement, or our failure to meet the requirements to earn the applicable rebates, would negatively affect our cost of revenues. |
In addition, any new developments or rumors of developments regarding Google’s business practices that affect the local online advertising industry may create perceptions with our customers or investors that our ability to compete has been impaired.
The above risks also apply to other publishers from whom we purchase media, including Yahoo! and Microsoft, which together with Google, accounted for approximately 89% of our traffic acquisition costs in 2013. Similar actions from Yahoo! and Microsoft would also have adverse effects on our operating results, the impact of which we believe would most likely be in proportion to their market share relative to Google’s.
If our SEO strategies fail to help our customers get discovered more easily in unpaid search results, our business could be adversely affected.
Our success depends in part on our ability to help our customers’ websites and contact information get discovered more easily in unpaid Internet search results on search engines like Google, Yahoo! and Bing. Algorithms are used by these search engines to determine search result listings and the order of such listings displayed in response to specific searches. Accordingly, our products help our customers to be discovered more easily in organic search engine results, making it more likely that search engine users will visit our customers’ websites. This is commonly referred to as search engine optimization, or SEO. However, there can be no assurance that our SEO efforts on behalf of our customers will succeed in improving the discoverability of their content. Google in particular is the most significant source of traffic to our customers’ websites. Therefore, it is important for us to maintain an effective SEO strategy so that our local business customers maintain a prominent presence in Google search results for queries regarding their businesses.
In addition, search engines frequently change the criteria that determine the order in which their search results are displayed, and our SEO efforts on behalf of our customers will be unsuccessful if we do not effectively respond to those changes on a timely basis. Therefore, if we are unable to respond effectively to changes made by search engine providers in their algorithms and other processes, our customers may experience substantial decreases in traffic to their websites. This may lead to a decrease in the perceived value of our products, which could result in our inability to acquire new customers, the loss of existing customers, a decrease in revenues and a material adverse effect on our results of operations.
Our revenue growth will be adversely affected if we cannot continue to successfully retain, hire, train and manage qualified personnel, especially those in sales and marketing.
Our ability to successfully pursue our growth strategy and to further penetrate our target markets will depend on our ability to attract, retain and motivate our personnel, especially those in sales and marketing. We
16
Table of Contents
face intense competition for these employees from numerous technology, software, advertising, media and other companies, and we cannot ensure that we will be able to attract, integrate or retain additional qualified employees in the future. In addition, as we target new industry verticals, we may need to attract sales personnel who are familiar with the relevant industry vertical. We believe that there is significant competition for these employees with the sales skills that we require, and that qualified individuals of the requisite caliber and number needed to fill these positions may be in short supply in some geographical areas. For example, our competitors may be able to attract and retain more qualified personnel by offering more competitive compensation packages. If we are unable to attract new employees and retain our current employees, we may not be able to develop, maintain and adequately market our products at the same levels as our competitors and we may, therefore, lose customers and market share. Our failure to attract and retain personnel, especially those in sales and marketing for which we have historically had a high turnover rate, could have an adverse effect on our ability to execute our business objectives and, as a result, our ability to compete could decrease, our operating results could suffer and our revenues could decrease.
In addition, due in part to the high standards of performance we expect from our sales personnel, we have historically experienced relatively high turnover in such personnel. Therefore, our ability to achieve significant revenue growth in the future will depend, in large part, on our success in identifying, recruiting, training and retaining sufficient numbers of qualified sales personnel. Even if we are able to identify and recruit a sufficient number of new hires, those new hires will require significant training before they achieve full productivity. Newly hired customer development personnel may not become productive as quickly as we would like, or at all, thus representing increased operating costs and lost opportunities which in turn could adversely affect our business, financial condition and results of operations. Therefore, if we are not successful in recruiting and training our customer development personnel and streamlining our sales and business development processes with customers to cost-effectively grow our customer base, our ability to grow our business and our results of operation could be adversely affected.
Providing technology-based marketing products to local businesses is an evolving market that may not grow as quickly as we anticipate, or at all.
Our products and the market for our products are relatively new. We believe our future success depends on our ability to offer an integrated and comprehensive suite of cost-effective digital marketing products to local businesses. Although we expect continued demand in the local business market for such products, it is possible that the rate of growth may not meet our expectations, or that the market may not grow at all, either of which could adversely affect our business.
The value of our products is predicated upon the assumption that an online and mobile presence, acquisition and retention marketing and the ability to connect and interact with consumers online and on mobile devices are, and will continue to be, important and valuable strategies for local businesses to enhance their abilities to establish, grow, manage and market their businesses. If this assumption is incorrect, or if local businesses do not, or perceive that they do not, derive sufficient value from our products, then our ability to retain existing customers, attract new customers to our products and grow our revenues could be adversely affected.
We must keep up with rapid and ongoing technological change to remain competitive in a rapidly evolving industry.
Our industry is characterized by rapid and ongoing technological change and frequent new product introductions. Our future success will depend on our ability to adapt quickly to rapidly changing technologies and to improve the performance and reliability of our product offerings. To achieve market acceptance for our products, we must anticipate the needs of our customers and offer products that meet changing customer demands quickly and effectively. For example, application marketplaces, mobile platforms and new search engines and search methods are changing the way in which consumers find and purchase products and services
17
Table of Contents
from our existing and potential local business customers, including the emergence of consumer-facing booking services that allow consumers to connect directly with local businesses. While these services generally have not been available in our target industry verticals, they may become available in the future. Therefore, our existing and potential local business customers may require features and functionality that our current product offerings do not have or our products are unable to support. While we continuously seek to enhance our product offerings, as we have recently with the launch of our communication automation module and business practice automation product, such additional features may not fully address the needs of our customers and may not gain market acceptance. Moreover, the success of such new offerings may depend, in part, on our ability to timely integrate such new products into our existing customers’ PMSs, or other customer relationship management or point of sale systems. If we fail to develop products that satisfy customer preferences in a timely and cost-effective manner or if the products that we do develop and deploy fail to gain market acceptance, our existing customers may not want to pay for such additional offerings and may be less likely to renew their subscriptions for our products, and our ability to attract new customers will be harmed.
In addition, the sale of new product offerings, the value or utility of which may be different from our current product offerings or less easily understood by our customers, may require increasingly sophisticated and costly sales efforts related, in part, to additional training of our employees and education of our customers. These efforts would likely result in increased operating costs, and if not successful, our results of operations may suffer. Further, many local businesses have modest advertising budgets. Accordingly, introduction of new product offerings may adversely affect sales of our current product offerings and may not result in an increase in our customers’ aggregate spending as a result of the introduction of new product offerings.
We may not be able to continue to add new customers or retain or increase sales to our existing customers, which could adversely affect our operating results.
Our growth is dependent on our ability to further penetrate our existing industry verticals and continue to attract new customers while retaining and increasing sales of our products, including new product offerings, to our existing customers. To do so, we must convince prospective local business customers, including those who may not be familiar with the products we offer, of the benefits of our products. In addition, we must continuously educate our existing local business customers with respect to newly launched products that we may offer. Many of our target customers are more accustomed to using more traditional methods of advertising, such as newspapers or yellow pages directories. Moreover, historically we have experienced a high turnover rate in our customer base, especially within the first year of launching a customer. Growth in the demand for our products may be inhibited, and we may be unable to retain customers or sustain growth in our customer base, for a number of reasons, including, but not limited to:
| • | the quality, cost and effectiveness of our products compared to other alternatives; |
| • | our failure to develop or offer new or additional products in a timely manner that keeps pace with new technologies and the evolving needs of our customers; |
| • | our inability to market our products in a cost-effective manner to new customers and to increase our sales to existing customers, including due to rules and regulations applicable to customers within particular industries, changes in regulations or changes in the enforcement of existing regulations that would impair our marketing practices or require us to change our onboarding processes; |
| • | our inability to offer products that are adequately integrated and customizable to meet the needs of our highly diverse and fragmented customer base; |
| • | our focus on developing a standardized, scalable digital marketing solution for local businesses, which may limit our ability to successfully adapt our products to customers in industries that are subject to regulation of their marketing activities, including adapting to the ways in which they are required to manage, communicate and/or interact with their clients, customers or patients; |
18
Table of Contents
| • | changes in search engine algorithms that reduce the actual or perceived value of the products we offer to our customers; |
| • | the inability of our customers to differentiate our products from those of our competitors or our inability to effectively communicate the distinctions; |
| • | our inability to maintain, or strengthen awareness of, our brands; |
| • | our inability to enter into automatically renewing contracts with our customers or increase subscription prices; |
| • | our inability to integrate into our customers’ PMSs, or other customer relationship management or point of sale systems, in order to deliver Lighthouse, our business practice automation product to these customers; |
| • | our inability to demonstrate the effectiveness of our products and consistently deliver a meaningful ROI to our customers relative to offline and other digital marketing alternatives; |
| • | our disclosure of costs on media purchases for our customers, which could impact our customers’ perception of the value of our solutions; |
| • | customer perception that the value of our products is not commensurate with the cost of those products as a result of the feedback and transparency we provide; |
| • | our customers’ unwillingness to adopt our integrated Marketing Essentials product due to their preference for a more tailored and potentially less expensive solution that meets their more limited needs; |
| • | customer dissatisfaction causing our existing customers to stop utilizing our products and to stop referring prospective customers to us; and |
| • | perceived or actual security, integrity, reliability, quality or compatibility problems with our platform, including related to unscheduled downtime or outages. |
Any inability to grow demand for our products or sustain growth in our customer base could have a material adverse effect on our business and results of operations.
We expect to face increased competition in the digital marketing industry, which could require us to reduce our selling prices or expand the products or features that we offer. As a result of such competitive pressures, we may not be able to maintain or improve our competitive position or market share.
The market for digital marketing solutions is intensely competitive and rapidly changing, and with the emergence of new technologies and market entrants, we expect competition to intensify in the future. Our competitors include:
| • | traditional yellow pages directories, direct mail campaign providers and advertising and listings services on local newspapers, magazines, television and radio, such as Dex Media, Gannett, Hearst and YP.com; |
| • | online search engines, such as Google, Yahoo! and Bing and online business directories, such as Yelp and Angie’s List; |
| • | providers of digital presence offerings, such as domain name registrars, shared hosting providers and website creation and reputation management companies, including Endurance, GoDaddy, Main Street Hub, Web.com and Wix; |
| • | providers of digital marketing solutions, such as search engine marketing companies and search engine optimization companies; and |
| • | productivity and office management tools, such as business-class email, scheduling and practice management systems, including Constant Contact, Demandforce, MailChimp and Solutionreach. |
19
Table of Contents
We have only recently launched our Marketing Essentials, Lighthouse and Centermark products. We are also developing other new subscription products designed to provide local businesses with additional tools to enable them to convert leads to paying consumers and to retain and transact with consumers. In each case, as we enter new markets we will encounter new competitors. Many of our current and potential competitors enjoy substantial competitive advantages, such as greater name recognition, longer operating histories, exclusive relationships, substantially greater financial, technical and other resources and, in some cases, the ability to combine their digital marketing products with traditional offline media such as newspapers or yellow pages directories. These companies may use these advantages to offer products similar to ours at a lower price, develop different products to compete with our current products and respond more quickly and effectively than we can to new or changing opportunities, technologies, standards or customer requirements. In particular, if major Internet search companies such as Google, Yahoo! and Microsoft decide to devote greater resources to develop and market online advertising offerings directly to local businesses, greater numbers of our current and potential customers may choose to purchase online advertising services directly from these competitors, particularly if and as the ease of their self-service models increases. In addition, many of our current and potential competitors have established marketing relationships with and access to larger customer bases and are heavily investing in recruiting sales personnel, which may affect our ability to achieve our salespeople hiring targets.
As the market for local online advertising increases, we expect new competitors, business models and solutions to emerge, some of which may be superior to ours. For example, a new competitor may elect to specialize in just one industry vertical, which may give them a competitive advantage and a larger share of the market opportunity in that particular vertical. Moreover, we also believe that the marketplace for online media is more transparent than other media marketplaces. Our competitors may use information available to them to price their products at a discount to the prices that we currently offer and to identify and target our current customers. In particular, we face competitive pressure with our Yodle Ads product, which may adversely impact the margins associated with this product. If we are not able to differentiate our products and convince customers that our products are more effective than our competitors’ offerings, current and potential customers may adopt competitive products in lieu of purchasing our products and solutions, even if our digital marketing and reporting solutions are more effective than those offered by our competitors. For all of these reasons, we may not be able to compete successfully against our current and potential competitors.
If economic conditions or other factors negatively affect levels of spending by local businesses, local businesses may become unwilling or unable to subscribe to our platform or purchase media, which could adversely affect our business.
Our existing and target customers are local businesses, and our performance is subject to economic conditions and their impact on levels of spending by local businesses. These businesses are more likely to be significantly affected by economic downturns than larger, more established businesses. Historically, economic downturns have resulted in overall reductions in spending on advertising and marketing by local businesses as local businesses often have limited discretionary funds, which they may choose to spend on other items. In particular, our products may be viewed by some of our existing and potential customers as a lower priority and those local businesses could terminate their subscription to our products. To the extent that worldwide economic conditions materially deteriorate, our existing and potential customers (including those acquired through our resellers) may elect to reduce their advertising and marketing budgets or may not be able to sustain operations generally. As a result, local businesses may become unwilling or unable to subscribe to or purchase media through our platform. Because customer purchases of discretionary items generally decline during recessionary periods and other periods in which disposable income is adversely affected, and because our customers generally subscribe to our platform on a short-term basis, our business is especially susceptible to overall economic downturns.
20
Table of Contents
If our mobile solutions fail to achieve widespread acceptance or if we are unable to maintain functionality for our mobile products, our business and future prospects may be adversely affected.
Consumers are increasingly accessing the Internet through devices other than personal computers, including mobile phones, smart phones and tablets. This trend has increased dramatically in the past few years and is projected to continue to increase. In response to this market demand trend, we provide our Marketing Essentials customers with a mobile-optimized website and a mobile dashboard. The mobile device market is characterized by the frequent introduction of new products and solutions, short product life cycles, evolving industry standards, continuous improvement in performance characteristics and rapid adoption of technological and product advancements. We may incur additional costs and face technical challenges adapting our mobile products to different versions of already supported operating systems, such as Android variants offered by different mobile phone manufacturers. If we are unable to offer continual improvements to our mobile products or adapt their functionalities to new and different operating systems, our mobile products, and our platform as a whole, may fail to achieve widespread acceptance. As a result, our business and future prospects may be adversely affected.
Because a significant portion of our revenues are recognized from customer subscriptions over the term of an agreement, a significant downturn in our business may not be immediately reflected in our results of operations.
We recognize a significant portion of our revenues from sales of our products over the term of our contracts, which are generally one, three, six or 12 months in length. As a result, a portion of the revenues we report each quarter is generated from contracts entered into during previous quarters. Consequently, a shortfall in demand for our products or a decline in new or renewed contracts in any one quarter may not significantly reduce our revenues in that quarter but could negatively affect our revenues in future quarters. Accordingly, the effect of a significant downturn in our business may not be reflected in our results of operations until future periods.
If local businesses increasingly opt to perform advertising tasks on their own, their demand for our products would decrease, thereby negatively affecting our revenue.
Large Internet marketing providers such as Google, Yahoo! and Microsoft offer online advertising products through self-service platforms. As local businesses become more familiar with and experienced in interacting online, they may prefer to actively manage their own Internet presence and their demand for our products may decrease. We cannot predict the evolving experiences and preferences of local businesses and cannot assure you that we can develop our products in a manner that will suit their needs and expectations faster or more effectively than our competitors, or at all. If we are not able to do so, our results of operations would suffer.
We rely on third-party technologies and software, and if we are unable to use or integrate these technologies or software, our product development may be delayed and our operating results may be negatively impacted.
We rely on certain technologies and software that we license from third parties, including technology and software that is integrated with internally developed technology or software and used in our products. These third-party licenses may not continue to be available on commercially reasonable terms, and the technology or software may not be appropriately supported, maintained or enhanced by the licensors. The loss of licenses to, or inability to support, maintain and enhance any such technology or software could result in increased costs or in delays or reductions in product performance until equivalent technology or software can be developed, identified, licensed and integrated, which may harm our business.
21
Table of Contents
We have expanded our geographic reach through relationships with third parties. If these relationships are terminated for any reason, our business and results of operations may be harmed.
We are able to reach a greater number of potential customers over a larger geographical area by working with certain third-party resellers. For example, through our arrangement with Rogers Communications Inc., or Rogers, a number of local businesses in Canada use our platform offering. The number of customers we are able to add through these relationships is dependent on the marketing efforts of these third parties over which we have little or no control. Generally, a third-party reseller accounts for a significant number of customers, and because we recognize revenue from these resellers on a net basis, the loss of any third-party reseller relationship or a significant decrease in the number of new customers generated through any such relationship could materially and adversely affect the size of our customer base, revenues and results of operations. Furthermore, our agreement with Rogers expires in December of 2018. If we are unable to maintain or replace our contractual relationship with these third-party resellers, including Rogers, or establish new contractual relationships with other third parties, we may fail to retain customers or acquire potential new customers in new geographies, we may experience delays and increased costs in adding or replacing customers that were lost and we would suffer a loss of revenue, any of which could have a material adverse effect on our business and results of operations.
If we fail to enhance our brand or our reputation is harmed, our financial condition may suffer.
We believe that developing and maintaining awareness of the Yodle brand is critical to achieving widespread acceptance of our products. Furthermore, we believe that the importance of brand recognition will increase as competition in our market increases. Successful promotion of our brand will depend largely on the effectiveness of our marketing efforts and on our ability to deliver valuable products to our customers. Brand promotion activities may not yield increased revenue, and even if they do, any increased revenues may not be immediately observable. Additionally, errors, defects, disruptions or other performance problems with our products may harm our reputation and brand and adversely affect our ability to attract new customers or retain existing customers, especially if these errors occur when we introduce new products, features or modules. If we fail to successfully promote and maintain the Yodle brand and/or our reputation is harmed, we may fail to attract sufficient new customers to maintain our growth or to retain our existing customers, which could adversely affect our business, financial condition, results of operations and future prospects.
Customer dissatisfaction with our products, complaints or negative publicity about our customer service or other business practices could adversely affect our reputation and brand.
Customer dissatisfaction with our products, customer complaints or negative publicity, including third-party publications in news or other media outlets, about our products, technology, personnel or customer service could severely diminish confidence in and the use of our products. Our products, as well as those of our competitors, are regularly reviewed, and those reviews are regularly shared, by our customers. Negative reviews, or reviews in which our competitors’ products are rated more highly than ours, could negatively affect our brand and reputation. From time to time, our customers have expressed dissatisfaction, including dissatisfaction with our customer service, our sales and billing practices and the way our products perform. If we do not handle customer complaints effectively, or otherwise adequately address customers’ concerns, our brand and reputation may suffer, we may lose our customers’ confidence and they may choose not to renew their subscriptions. Moreover, managing effective customer relationships requires significant personnel expense, which, if not managed properly, could significantly impact our operating results. As a result, complaints or negative publicity about our products or our customer service could materially and adversely impact our reputation, our brand, our ability to attract and retain customers, our business, financial condition and results of operations, and ultimately frustrate our efforts to continue to be a trusted provider of digital marketing solutions for the local business market.
22
Table of Contents
Our sales cycle with respect to our Centermark product can be long and unpredictable and may require considerable efforts, which could cause our operating results to fluctuate.
The sales cycle for our Centermark product, from initial contact with a potential lead to contract execution and implementation, varies widely by customer, but typically takes approximately six months. Some of our customers undertake a significant evaluation process that frequently involves not only a review of our products but also those of our competitors, which has in the past resulted in extended sales cycles. Our sales efforts involve educating our customers about the use, technical capabilities and benefits of our platform. We have no assurance that the substantial time and money spent on our sales efforts will produce sales. If sales expected from a customer are not realized in the time period expected or not realized at all, our business, operating results and financial condition could be adversely affected.
We rely on the performance of our senior management and highly skilled personnel, and if we are unable to attract, retain and motivate well-qualified employees, our business and results of operations could be harmed.
We believe our success has depended, and continues to depend, on the efforts and talents of senior management and key personnel. Our future success depends on our continuing ability to attract, develop, motivate and retain highly qualified and skilled employees. Qualified individuals are in high demand, and we may incur significant costs to attract them. In addition, the loss of any of our senior management or key personnel could interrupt our ability to execute our business plan, as such individuals may be difficult to replace. If we do not succeed in attracting well-qualified employees or retaining and motivating existing employees, our business and results of operations could be harmed.
If we fail to manage our growth effectively, our business and results of operations could be harmed.
We have experienced rapid growth in our business and operations, which places substantial demands on our management and operational infrastructure. As our customer base grows and our product offerings expand, we will need to devote additional resources to improving our infrastructure and continuing to enhance its scalability in order to maintain the performance of our platform. Our need to effectively manage our operations and growth will also require that we continue to assess and improve our operational, financial and management controls, reporting systems and procedures. If we do not manage the growth of our business and operations effectively, our operations and the quality of our platform could suffer, which could harm our business and results of operations.
Our corporate culture has contributed to our success, and if we cannot maintain this culture as we grow, we could lose the innovation, creativity and teamwork fostered by our culture, and our business may be harmed.
We believe that an important contributor to our success has been our corporate culture, which we believe fosters innovation, teamwork, passion for our customers, and a focus on innovative and technologically advanced products. As we continue to grow, we must effectively integrate, develop and motivate a growing number of new employees. As a result, we may find it difficult to maintain important aspects of our corporate culture, which could limit our ability to innovate and operate effectively. Any failure to preserve our culture could also negatively affect our ability to retain and recruit personnel, continue to perform at current levels or execute our business strategy.
Recent and potential future acquisitions and investments could result in operating difficulties, divert attention of our management, dilute stockholder value and otherwise harm our financial results.
From time to time, we evaluate potential strategic acquisition or investment opportunities. We intend to selectively acquire businesses and technologies as we did with the acquisition of ProfitFuel, Inc., or ProfitFuel, in May 2011 and Lighthouse Practice Management Group, Inc., or Lighthouse Practice Management, in February
23
Table of Contents
2013. Any transactions that we enter into could be material to our financial condition and results of operations. The process of integrating an acquired company, business or technology could create unforeseen operating difficulties and expenditures. Acquisitions and investments carry with them a number of risks, including the following:
| • | diversion of management time and focus from operating our business to address integration challenges; |
| • | implementation or remediation of controls, procedures and policies of the acquired company; |
| • | coordination of product, engineering and selling and marketing functions; |
| • | retention of employees from the acquired company; |
| • | cultural challenges associated with integrating employees from the acquired company into our organization; |
| • | integrating technologies of the acquired company into our existing systems; |
| • | challenges with integrating new products or technologies into our customers’ practice or business management systems; |
| • | unforeseen liabilities; |
| • | additional regulatory and compliance requirements; |
| • | litigation or other claims arising in connection with the acquired company; and |
| • | potential negative impact on our financial results because such acquisitions may require us to incur charges and substantial debt or liabilities, may require us to amortize, write down or record impairment of amounts related to deferred compensation, goodwill and other intangible assets, or may cause adverse tax consequences, substantial depreciation or deferred compensation charges. |
Our failure to address these risks or other problems encountered in connection with acquisitions and investments could cause us to fail to realize the anticipated benefits of such acquisitions or investments, incur unanticipated liabilities and harm our business, results of operations and financial condition.
If our products contain serious errors or defects, then we may lose revenue and market acceptance, experience increased costs, suffer reputational harm and incur costs to defend or settle claims.
Sophisticated technology platforms such as ours often contain errors or defects, such as errors in computer code or other systems errors, particularly when first introduced or when new versions or enhancements are released. Because we also rely on third parties to provide certain aspects of our products, our products may contain additional errors or defects. Our solutions operate on a cloud-based architecture and we update our products regularly while our solutions are in operation. If our upgrades are not properly implemented, the availability and functioning of our products could be impaired. Despite quality assurance measures, internal testing and beta testing by our customers, we cannot guarantee that our current and future products, including upgrades to those products, will be free of serious defects, which could result in lost revenue, refunds without a commensurate decrease in costs, delays in market acceptance, increase in costs, reputational harm and costs associated with defending or settling claims.
Because local businesses use our platform to maintain contact with their clients, customers or patients, errors, defects or other performance problems could result in damage to our customers and their businesses. They could elect not to renew, delay or withhold payments to us, or seek significant compensation from us for the losses they suffer. Although our customer agreements typically contain provisions designed to limit our exposure to certain claims, not all of our customers execute a standard customer agreement and existing or future laws or unfavorable judicial decisions could negate or diminish these limitations. Even if not successful, a claim brought against us could be time-consuming and costly and could seriously damage our reputation in the marketplace, making it harder for us to acquire and retain customers.
24
Table of Contents
If our security measures are breached, our platform may be perceived as not being secure, and our business and reputation could suffer.
The use of our products involves the storage and transmission of our customers’ proprietary information, as well as payment information and personal data of the clients, customers or patients of our customers. Although we employ data encryption processes, an intrusion detection system and other internal control procedures to protect such sensitive data, we cannot guarantee that these measures will be sufficient for this purpose. If our security measures are breached as a result of third-party action, employee error or otherwise, and as a result such sensitive data becomes available to unauthorized parties, we could incur liability. In addition, most states have enacted laws requiring companies to notify individuals of data security breaches involving certain types of personal data, which may lead to negative publicity and the loss of current and potential customers. If we experience any breaches of our network security or sabotage, we may be required to expend significant capital and other resources to remedy, protect against or alleviate these and related problems, and we may not be able to remedy these problems in a timely manner, or at all. Because techniques used by outsiders to obtain unauthorized network access or to sabotage systems change frequently and generally are not recognized until launched against a target, we may be unable to anticipate these techniques or implement adequate preventative measures.
We expect a number of factors may cause our operating results to fluctuate on a quarterly and annual basis, which may make it difficult to predict our future performance.
Our operating results could vary significantly from quarter to quarter and year to year because of a variety of factors, many of which are outside of our control. As a result, comparing our operating results on a period-to-period basis may not be meaningful. In addition to other risk factors discussed in this section, factors that may contribute to the variability of our quarterly and annual results include:
| • | our ability to attract new customers and retain existing customers; |
| • | our ability to accurately forecast revenues and appropriately plan our expenses; |
| • | the effects of changes in search engine algorithms and the effectiveness of our marketing efforts on behalf of customers; |
| • | the relative contributions of our media and platform products to total revenues and the contributions of sales through our Centermark platform in particular; |
| • | the effects of increased competition in our business; |
| • | our ability to successfully expand into new verticals; |
| • | our ability to sell new products to our existing customer base; |
| • | variations in our customers’ media budgets; |
| • | the amount of revenue recognized by us in any period through our media product; |
| • | the success of our sales and marketing efforts; |
| • | our ability to keep pace with changes in technology; |
| • | the impact of worldwide economic conditions, including the resulting effect on consumer spending at local businesses and the spending of local businesses on marketing and advertising generally; |
| • | our relationships with third-party providers and resellers of our products; |
| • | our ability to successfully manage any acquisitions of businesses, solutions or technologies; |
| • | our ability to reach broader geographic markets; |
| • | our ability to protect our intellectual property; |
25
Table of Contents
| • | changes in government and other regulation affecting our business, as well as our customers’ businesses; |
| • | chargebacks associated with refund requests by customers due to any disagreement with terms of our arrangements with them; |
| • | costs associated with defending intellectual property infringement and other claims and related judgments or settlements; |
| • | our ability to attract and retain highly qualified employees and key personnel; |
| • | fluctuations in foreign exchange rates; |
| • | the effects of natural or man-made catastrophic events; |
| • | the effectiveness of our internal controls; and |
| • | changes in our tax rates or exposure to additional tax liabilities. |
Since revenue generated by our media product is recognized as local online advertising is purchased for a customer, if the entirety of that customer’s media budget is not used during a period, that remaining amount will be recorded as deferred revenue and only recognized when used. Therefore, our ability to recognize revenue for our media product will depend on our ability to use a customer’s media budget, which we may not be able to do in a consistent manner for various reasons, including seasonal trends. We believe that quarter-to-quarter comparisons of our results should not be relied upon as an indicator of future performance. As a result of such fluctuations, the price of our common stock may experience volatility.
We rely on bandwidth providers, data centers and other third parties for key aspects of the process of providing digital marketing solutions to our customers, and any failure or interruption in the services provided by these third parties could harm our ability to operate our business and damage our reputation.
We rely on third-party vendors, including data center, software-as-a-service, bandwidth and cloud computing Internet infrastructure providers to operate certain aspects of our business. Our reliance on these vendors makes us vulnerable to any disruption in the services they provide, any failure to handle current or higher volumes of use or increases in costs from these vendors. Any financial or other difficulties our providers face may have negative effects on our business, the nature and extent of which we cannot predict. We exercise little control over these third-party vendors, which increases our vulnerability to problems with the services they provide. We have experienced and expect to continue to experience interruptions and delays in service and availability for such elements. Any unexpected and material cost increases, breaches in their security affecting our data, errors, failures, interruptions or delays experienced in connection with these third-party technologies and information services could negatively impact our relationship with our customers and adversely affect our business and results of operations, result in substantial recovery costs, expose us to liabilities to third parties and distract management from operating our business.
We increasingly rely on certain third-party vendors to perform certain aspects of our business, which could adversely affect our business.
We outsource certain functions, including portions of our sales and customer service functions to business process service providers in order to achieve cost savings and efficiencies. The failure of our third-party vendors to fulfill their obligations, and any changes we may make to the services we obtain from these vendors, may disrupt our operations and result in the loss of some or all of the cost savings and efficiencies we may have achieved through these vendors. We have recently renewed our contract with our third-party vendor in St. Lucia, which supplements our U.S.-based sales and customer service teams, for a period of three years. Our inability to renew this contract in the future, or to renew any future contract with other third-party vendors, on terms that are favorable to us may materially and adversely affect our business, financial condition and results of operations.
26
Table of Contents
We depend on the reliability, security, and performance of our internally developed systems and support operations, and any difficulties in maintaining these may result in interruptions in access to our products, decreased customer satisfaction, reduced revenue and increased expenditures.
Our employees are primarily responsible for developing the software and workflow processes that underlie our ability to deliver and support our products. The reliability and continuous availability of these internal systems are critical to our business, and any interruptions that impair the performance of our platform or our ability to timely deliver our products or that materially impact the efficiency or cost with which we provide our products would harm our reputation, profitability and ability to conduct business. In addition, many of the software systems we currently use will need to be enhanced over time or replaced with equivalent commercial products, either of which could entail considerable effort and expense. If we fail to develop and execute reliable policies, procedures and tools to operate our infrastructure, we could face a substantial decrease in workflow efficiency and increased costs, as well as a decline in our revenue. In addition, if we are unable to maintain adequate levels of access to our products or customer service, we may lose existing customers, our revenue may decrease and our results of operations may be adversely impacted.
Moreover, our failure to appropriately support our systems and operations over time could result in inefficiencies or operational failures and increased vulnerability to cyber-attacks. Cyber-attacks could include attacks impacting product availability and reliability; the exploitation of software vulnerabilities in Internet facing applications; social engineering of system administrators (tricking company employees into releasing control of their systems to a hacker); or the introduction of computer viruses or malware into our systems with a view to steal confidential or proprietary data. Cyber-attacks of increasing sophistication may be difficult to detect and could result in the theft of our intellectual property and our data or our customers’ data. In addition, we are vulnerable to unintentional errors as well as malicious actions by persons with authorized access to our systems that exceed the scope of their access rights, or unintentionally or intentionally alter parameters or otherwise interfere with the intended operations of our platform. Operational errors or failures or successful cyber-attacks would likely result in interruptions in access to our products, decreased customer satisfaction, harm to our reputation, loss of customers and increased expenditures.
We may face potential liability and expense for legal claims or proceedings related to the content stored on our platform by our customers or activities of customers on their websites.
Our platform allows our customers to create web and mobile presences for their businesses. In addition, we provide our customers with the ability to upload images to their website and syndicate them across numerous online directories. At present, we do not require that our customers post on their websites, or require their visitors to agree to, any terms of service, privacy policy, disclaimer or any other contractual documentation or policy. If our customers do not post or require agreement to the appropriate documentation and policies on their websites, or should our customers fail to take steps necessary to enjoy the benefits of certain statutory safe harbors, such as those set forth in Section 512 of the United States Copyright Act, then they may be more likely to expose themselves to liability under applicable law. It is possible that we could also be subject to liability as the host/platform for content that is posted by our customers or users of our customers’ websites. United States and international laws relating to the liability of hosts for content posted by their customers and other third parties are currently being tested and are subject to subjective interpretation by courts and regulators. Any court ruling or other governmental action that imposes liability on providers of online services for the activities of their customers and other third parties could harm our business. In the event we are required to defend against such claims, we will incur legal fees and costs which could be significant. Any liability attributed to us could adversely affect our brand, reputation, our ability to expand our customer base and our financial position. Further, not all of our customers have agreed to our standard terms and conditions, and for those that have, our indemnity from these customers may also not be fully effective as a matter of practice if any customer does not have sufficient assets, insurance or other means to fulfill that indemnity.
27
Table of Contents
Furthermore, our reputation and brand may be negatively affected by the actions of customers that are deemed to be hostile, offensive or inappropriate, or by customers acting under false or inauthentic identities. We do not monitor or review the appropriateness of the content of our customers’ websites, and we have little control over the activities in which our customers engage. While we retain authority to take down websites, customers could nonetheless engage in these activities. The safeguards we have in place may not be sufficient to avoid harm to our reputation and brand, especially if such hostile, offensive or inappropriate use was high profile, which could adversely affect our ability to expand our customer base, and our business and financial results.
Some of our products contain open source software, which may pose particular risks to our business.
We use open source software in our products and will use open source software in the future. From time to time, we may face claims from third parties claiming ownership of, or demanding release of, the open source software and/or derivative works that we developed using such software (which could include our proprietary source code), or otherwise seeking to enforce the terms of the applicable open source license. These claims could result in litigation and could require us to purchase a costly license or cease offering the implicated product unless and until we can re-engineer it to avoid infringement. This re-engineering process could require significant additional research and development resources. In addition to risks related to license requirements, use of certain open source software can lead to greater risks than use of third-party commercial software, as open source licensors generally do not provide warranties or controls on the origin of software. Any of these risks could be difficult to eliminate or manage, and, if not addressed, could have a negative effect on our business and operating results.
Our business is subject to the risks of earthquakes, fires, floods and other natural catastrophic events and to interruption by man-made problems such as computer viruses or terrorism.
Our business and operations are vulnerable to damage or interruption from earthquakes, fires, floods, power losses, telecommunications failures, terrorist attacks, acts of war, human errors, break-ins and similar events affecting us or third-party vendors we rely on. For example, a significant natural disaster, such as an earthquake, fire or flood, could have a material adverse impact on our business, operating results and financial condition. Acts of terrorism, which may be targeted at metropolitan areas that have higher population density than rural areas, could cause disruptions in our or our customers’ businesses or the economy as a whole. Our servers and those of our third-party vendors may also be vulnerable to computer viruses, break-ins and similar disruptions from unauthorized tampering with our computer systems, which could lead to interruptions, delays, loss of critical data or the unauthorized disclosure of confidential customer data. We or our third-party vendors may not have sufficient protection or recovery plans in place, and our business interruption insurance may be insufficient to compensate us for losses that may occur. As we rely heavily on our servers, computer and communications systems, that of third parties and the Internet to conduct our business and provide high quality customer service, such disruptions could have an adverse effect on our business, operating results and financial condition.
We could lose customers if we or our media partners fail to detect click-through or other fraud on advertisements in a manner that is acceptable to our customers.
One of the products that we offer is the purchase of local online advertising for our customers. As a result, we are exposed to the risk of fraudulent clicks or actions on our third-party publishers’ websites over which we have no control. We may lose customers or have to refund revenue that our customers have paid to us that was later attributed to, or suspected to be caused by, click-through fraud and that refund may not be recoverable. Click-through fraud occurs when an individual clicks on an ad displayed on a website or an automated system is used to create such clicks with little to no intent of viewing the underlying content. If fraudulent clicks are not detected, the affected customers may become dissatisfied with our campaigns, which in turn may lead to loss of customers and the related revenue.
28
Table of Contents
We may require additional capital to support business growth, and this capital might not be available on acceptable terms, if at all.
We intend to continue to make investments to support our business growth and may require additional capital to respond to business challenges, including the need to develop new products, enhance our existing platform, improve our operating infrastructure or acquire complementary businesses and technologies. Accordingly, we may need to raise additional funds through bank credit arrangements or public or private equity, equity-linked or debt financings. Any additional equity or convertible debt financing may be dilutive to our stockholders, and any new equity securities we issue could have rights, preferences and privileges superior to those of holders of our common stock. Moreover, if we raise additional funds through the incurrence of indebtedness, such indebtedness will likely require current payment of interest and contain covenants that restrict our operations, such as limitations on our ability to incur additional debt, and other operating restrictions that could adversely impact our ability to conduct our business. We may not be able to obtain additional financing on terms favorable to us, or at all. If we are unable to obtain adequate financing or financing on terms satisfactory to us when we require it, our ability to continue to support our business growth and to respond to business challenges could be significantly impaired, and our business may be harmed.
Impairment of goodwill and other intangible assets would result in a decrease in our earnings.
Current accounting rules provide that goodwill and other intangible assets with indefinite useful lives may not be amortized but instead must be tested for impairment at least annually. These rules also require that intangible assets with definite useful lives be amortized over their respective estimated useful lives to their estimated residual values, and reviewed for impairment whenever events or changes in circumstances indicate that the carrying amount of such assets may not be recoverable. We have substantial goodwill and other intangible assets, and we would be required to record a significant charge to earnings in our consolidated financial statements during the period in which any impairment of our goodwill or intangible assets is determined. Any impairment charges or changes to the estimated amortization periods would result in a decrease in our earnings.
When we further expand our sales to customers outside the United States, our business will be susceptible to risks associated with international operations.
While we have not historically directly marketed our products to customers in countries outside the United States, a component of our growth strategy in the long term will likely entail the further expansion of our operations and customer base internationally. Our future initiatives will involve a variety of risks, including:
| • | changes in a specific country’s or region’s political or economic conditions; |
| • | regulatory requirements, taxes or trade laws that differ from those in the United States; |
| • | more stringent regulations relating to communication via email, telephone or text messages, data security and the unauthorized use of, or access to, commercial and personal information; |
| • | differing labor regulations, where labor laws are generally more advantageous to employees as compared to the United States, including deemed hourly wage and overtime regulations in these locations; |
| • | challenges inherent in efficiently managing an increased number of employees over large geographic distances, including the need to implement appropriate systems, policies, benefits and compliance programs; |
| • | difficulties in managing a business in new markets with diverse cultures, languages, customs, legal systems, alternative dispute systems and regulatory systems; |
| • | increased travel, real estate, infrastructure and legal compliance costs associated with international operations; |
29
Table of Contents
| • | currency exchange rate fluctuations and the resulting effect on our revenues and expenses, and the cost and risk of entering into hedging transactions if we choose to do so in the future; |
| • | limitations on our ability to reinvest earnings from operations in one country to fund the capital needs of our operations in other countries; |
| • | laws and business practices favoring local competitors or general preferences for local vendors; |
| • | limited or insufficient intellectual property protection; |
| • | political instability or terrorist activities; |
| • | exposure to liabilities under anti-corruption and anti-money laundering laws, including the U.S. Foreign Corrupt Practices Act and similar laws and regulations in other jurisdictions; and |
| • | adverse tax burdens and foreign exchange controls that could make it difficult to repatriate earnings and cash. |
Our lack of experience in operating our business internationally increases the risk that any potential future expansion efforts that we may undertake will not be successful. If we invest substantial time and resources to expand our international operations and are unable to do so successfully and in a timely manner, our business and operating results could suffer.
Risk Related to the Regulation of Our Business and Other Compliance Matters
Our business is subject to a variety of U.S. laws, many of which are unsettled and still developing and which could subject us to claims or otherwise harm our business or results of operations.
We are subject to a variety of laws in the United States, including laws, contractual obligations and standards regarding communications, telemarketing, data retention, online and credit card payments, privacy, data security, marketing, advertising, consumer protection and tax as well as anti-kickback laws, which, in each case, are frequently evolving and developing. The scope and interpretation of the laws and standards that are, or may be, applicable to us are often uncertain and may be conflicting. For example, laws relating to the liability of providers of online services for activities of their users and other third parties are currently being tested by a number of claims, including actions based on invasion of privacy and other torts, unfair competition, copyright and trademark infringement and other theories based on the nature and content of the materials searched, the ads posted or the content provided by users. In addition, regulatory authorities and governmental bodies in the United States are considering a number of legislative and regulatory proposals concerning privacy, data protection and other matters that may be applicable to our business. It is also likely that if our business grows and evolves and our products are used in a greater number of geographies, we will become subject to laws and regulations in additional jurisdictions. It is difficult to predict how existing laws will be applied to our business and the new laws to which we may become subject.
In addition, while our customer agreements typically contain obligations requiring our customers to comply with applicable laws, not all of our customers execute a standard customer agreement or if our customers fail to adhere to these obligations, we may be subject to adverse publicity, and related possible inquiries, investigations, or other regulatory activities in connection with our practices or those of our customers. Therefore if we or our customers are not able to comply with these laws or regulations or if we become liable under these laws or regulations, we could be harmed, and we may be forced to implement new measures to reduce our exposure to this liability. This may require us to expend substantial resources or to change or discontinue certain products or
30
Table of Contents
features, which would negatively affect our business. In addition, the increased attention focused upon liability issues as a result of lawsuits and legislative proposals could harm our reputation or otherwise impact the growth of our business. Any costs incurred to prevent or mitigate this potential liability could also harm our business and results of operations.
Government regulation of the Internet is evolving, and unfavorable changes could substantially harm our business and results of operations.
We are subject to general business regulations and laws as well as federal and state regulations and laws specifically governing the Internet. Existing and future laws and regulations may impede the growth of the Internet or online services and increase the cost of providing online services. These regulations and laws may cover user privacy, data protection and security, spyware, “do not email” lists, text message marketing, access to high speed and broadband service, mobile applications, pricing, taxation, tariffs, patents, copyrights, trademarks, trade secrets, export of encryption technology, electronic contracting, click-through fraud, acceptable content, search terms, lead generation, behavioral targeting, consumer protection and quality of products. It is not clear how existing laws governing issues such as property ownership, sales, use and other taxes, libel and personal privacy apply to the Internet and online services. Unfavorable resolution of these issues may harm our business and results of operations.
Failure to comply with communications and telemarketing laws could result in significant fines or place significant restrictions on our business.
We rely on a variety of marketing techniques, including telemarketing and email marketing for our own business and text messaging, automatic telephone dialing and email marketing as part of the communication automation and business practice automation modules of our Marketing Essentials and Lighthouse products. We also record certain telephone calls of our sales and service representatives for the purpose of service observing and of our customers as part of our marketing platform. These activities are subject to a variety of state and federal laws such as the Telephone Consumer Protection Act of 1991 (also known as the Federal Do-Not-Call law, or the TCPA), the Telemarketing Sales Rule, the Controlling the Assault of Non-Solicited Pornography and Marketing Act of 2003 (also known as the CAN-SPAM Act) and various U.S. state laws, including regarding telemarketing and telephone call recording. These laws are subject to varying interpretations by courts and governmental authorities and often require subjective interpretation. Further, over the past several years, class action lawsuits involving many of these laws have increased significantly. We cannot be certain that our or our customers’ efforts to comply with these laws will be deemed sufficient by the relevant courts and governmental authorities. Changes in these laws or the application or interpretation of these laws, or the enactment of any new state or federal laws regarding communications, marketing, solicitation, data protection or telephone call recording that may govern these activities, could adversely affect our business.
For example, the CAN-SPAM Act, among other things, obligates the sender of commercial emails to provide recipients with the ability to opt out of receiving future emails from the sender. The TCPA broadly regulates outbound calls, including live operator calls. Among other things, the TCPA limits the hours during which telemarketers may call consumers, restricts the use of automated telephone dialing equipment to call certain telephone numbers or send text messages unless consent has been obtained, and prohibits calling consumers at numbers that have been included on the National Do-Not-Call list. Numerous states also have state specific Do-Not-Call lists, as wells as laws regulating telemarketing and text message marketing. Further, the laws of several states prohibit the recording of any telephone call absent the consent of all parties to that call. In addition, certain of these laws include a private right of action and have been the subject of class action lawsuits, including one that we were a party to. If any of the foregoing laws or regulations significantly restricts our business, we may not be able to develop adequate alternative marketing strategies. Further, non-compliance with these laws and regulations carries significant financial penalties and the risk of class action litigation, which would adversely affect our financial performance and significantly harm our reputation and our business.
31
Table of Contents
We face potential liability related to the privacy and security of health-related information we receive from and/or create for our customers.
We have developed products that cater to dental and other health professionals. The privacy and security of information about the past, present, or future physical or mental health or condition of an individual is an area of significant focus in the United States because of heightened privacy concerns and the potential for significant consumer harm from the misuse of such sensitive data. We have procedures and technology in place intended to safeguard individually identifiable health information we receive from and/or create for our customers from unauthorized access or use.
The Privacy Standards and Security Standards under the Health Insurance Portability and Accountability Act of 1996, or HIPAA, establish a set of basic national privacy and security standards for the protection of individually identifiable health information by health plans, healthcare clearinghouses and certain healthcare providers, referred to as covered entities, and the business associates with whom such covered entities contract for services. Notably, whereas HIPAA previously directly regulated only these covered entities, the Health Information for Economic and Clinical Health Act of 2009, or HITECH, which was signed into law as part of the stimulus package in February 2009, and the Final HIPAA Omnibus Rule adopted in 2013, or Omnibus Rule, make certain of HIPAA’s Privacy and Security Standards also directly applicable to covered entities’ business associates. As a result, business associates are now subject to significant civil and criminal penalties for failure to comply with applicable Privacy and Security Standards. Moreover, HITECH created a new requirement that covered entities report certain breaches of unsecured, individually identifiable health information and imposes penalties on covered entities that fail to do so.
Our dental and other health professional customers may qualify as covered entities under HIPAA and provide us with, or ask us to create, individually identifiable health information in order for us to deliver our products, meaning that we qualify as a Business Associate. We have adopted a privacy policy and security policy to ensure compliance with HIPAA requirements and are working on completing the implementation of all of the requirements set forth in those policies, including entering into Business Associate Agreements, or BAAs, with our covered entity customers and conducting required training of our employees. If our practices to protect individually identifiable health information do not comply with the requirements of HIPAA and HITECH, we may be directly subject to liability. In addition, if our privacy and security practices do not comply with our contractual obligations stemming from our BAAs, we may be subject to contractual liability.
The Omnibus Rule modified the breach reporting standard in a manner that will likely make more data security incidents qualify as reportable breaches. Thus, to the extent that we endure improper uses or disclosures of individually identifiable health information, it is more likely that such an incident will rise to the level of a reportable breach. Additionally, the Omnibus Rule changed certain requirements relating to BAAs, and thus BAAs to which we are a party may need to be updated to ensure compliance. Any liability arising from a failure to comply with the requirements of HIPAA or HITECH, to the extent such requirements are deemed to apply to our operations, or contractual obligations, could adversely affect our financial condition.
The costs of complying with privacy and security related legal and regulatory requirements are burdensome and could have a material adverse effect on our results of operations. The Omnibus Rule may also be subject to interpretation by various courts and other governmental authorities, thus creating potentially complex compliance issues for us, as well as our customers and resellers. In addition, we are unable to predict what changes to the HIPAA Privacy Standards and Security Standards might be made in the future or how those changes could affect our business. Any new legislation or regulation in the area of privacy and security of personal information, including personal health information, could also adversely affect our business operations.
32
Table of Contents
Privacy concerns could limit our ability to leverage data about our customers and their clients, customers and patients.
In the ordinary course of business, we collect and utilize data, including personal information. We currently face certain legal obligations regarding the manner in which we treat such information. Increased regulation of data utilization practices, including self-regulation or findings under existing laws, that limit our ability to use collected data, could have an adverse effect on our business. As our business evolves, we may become subject to additional and/or more stringent legal obligations concerning our treatment of customer information. Failure to comply with these obligations could subject us to liability, and to the extent that we need to alter our business model or practices to adapt to these obligations, we could incur additional expenses.
We are exposed to risks associated with credit and debit card payment processing.
We accept payments primarily through credit and debit card transactions. We are subject to a number of risks related to credit and debit card payments, including:
| • | we pay interchange and other fees, which may increase over time and could require us to either increase the prices we charge for our products or experience an increase in our costs and expenses; |
| • | we rely on a third party to provide credit and debit card payment processing services, and it could disrupt our business if this vendor became unwilling or unable to provide these services to us; |
| • | if we are unable to maintain our chargeback rate at acceptable levels, our credit card fees for chargeback transactions, or our fees for other credit and debit card transactions or issuers, may increase, or issuers may terminate their relationship with us; and |
| • | security breaches of confidential customer information in connection with our receipt of credit and debit card information. |
We store our customers’ credit and debit card information as part of the telephonic closing script for short periods of time and transmit it to our third-party payment processor. As a result, we may in the future become subject to lawsuits or other proceedings for purportedly fraudulent transactions arising out of the actual or alleged theft of our customers’ credit or debit card information if our security or if the security of our third-party credit card payment processor is breached. We and our third-party credit card payment processor are also subject to payment card association operating rules, certification requirements and rules governing electronic funds transfers, which could change or be reinterpreted to make it difficult or impossible for us to comply. If we or our third-party credit card payment processor fail to comply with these rules or requirements, we may be subject to fines and higher transaction fees and lose our ability to accept credit and debit card payments from our customers, and our business and operating results could be adversely affected.
Risks Related to Our Intellectual Property
We may be subject to intellectual property rights claims by third parties, which are extremely costly to defend, could require us to pay significant damages and could limit our ability to use certain technologies.
Third parties may assert claims of infringement of intellectual property rights in proprietary technology against us or against our customers or partners for which we may be liable or have an indemnification obligation. Any claim of infringement by a third party, even those without merit, could cause us to incur substantial costs defending against the claim and could distract our management from operating our business. In any patent infringement suit brought against us, we may assert, as a defense, that we do not infringe the relevant patent claims, that the patent is invalid or both. The strength of our defenses will depend on the patents asserted, the interpretation of these patents, and our ability to invalidate the asserted patents. However, we could be unsuccessful in advancing non-infringement and/or invalidity arguments in our defense. In the United States,
33
Table of Contents
issued patents enjoy a presumption of validity, and the party challenging the validity of a patent claim must present clear and convincing evidence of invalidity, which is a high burden of proof. Conversely, the patent owner need only prove infringement by a preponderance of the evidence, which is a lower burden of proof.
Although third parties may offer a license to their technology, the terms of any offered license may not be acceptable and the failure to obtain a license or the costs associated with any license could cause our business, financial condition and results of operations to be materially and adversely affected. In addition, some licenses may be non-exclusive, and therefore our competitors may have access to the same technology licensed to us. Alternatively, we may be required to develop non-infringing technology, which could necessitate significant effort and expense and ultimately may not be successful. Furthermore, a successful claimant could secure a judgment or we may agree to a settlement that prevents us from distributing certain products or that requires us to pay substantial damages, including treble damages, if we are found to have willfully infringed such claimant’s patents or copyrights, royalties or other fees. Any of these events could seriously harm our business, financial condition and results of operations.
Failure to protect or enforce our intellectual property rights could harm our business and results of operations.
Our success depends, in part, on our ability to protect proprietary methods and technologies that we develop under the intellectual property laws of the United States, so that we can prevent others from using our inventions and proprietary information. If we fail to protect our intellectual property rights adequately, our competitors might gain access to our technology, and our business could be adversely affected. We rely on trademark, copyright, trade secret and patent laws, confidentiality procedures and contractual provisions to protect our proprietary methods and technologies. Our patent strategy is still in its early stages. We own one registered patent and have another patent application on file with the U.S. Patent and Trademark Office. In each case, the claims eventually allowed on these or any other patent we apply for may not be sufficiently broad to protect our technology or products. Any issued patents may be challenged, invalidated or circumvented, and any rights granted under these patents may not actually provide adequate defensive protection or competitive advantages to us. Additionally, the process of obtaining patent protection is expensive and time-consuming, and we may not be able to prosecute all necessary or desirable patent applications at a reasonable cost or in a timely manner. Additional uncertainty may result from changes to intellectual property legislation enacted in the United States, including the recent America Invents Act, and other national governments and from interpretations of the intellectual property laws of the United States and other countries by applicable courts and agencies. Accordingly, despite our efforts, we may be unable to obtain adequate patent protection, or to prevent third parties from infringing upon or misappropriating our intellectual property.
In addition to patents, our trade secrets, general know-how and experience regarding our technology are a significant part of our intellectual property. We make assessments with respect to new technology and decide whether to apply for patents or retain and protect them as trade secrets. Unauthorized parties may attempt to copy aspects of our technology or obtain and use information that we regard as proprietary. We generally enter into confidentiality and/or license agreements with our employees, consultants and vendors and generally limit access to and distribution of our proprietary information. However, we cannot provide assurance that any steps taken by us will prevent misappropriation of our technology and proprietary information. Policing unauthorized use of our technology is difficult. In addition, the laws of some foreign countries may not be as protective of intellectual property rights as those of the United States, and mechanisms for enforcement of our proprietary rights in such countries may be inadequate. From time to time, legal action by us has been and may continue to be necessary to enforce our intellectual property rights, to protect our trade secrets and proprietary information, to determine the validity and scope of the proprietary rights of others, or to defend against claims of infringement. Such litigation could result in substantial costs and the diversion of limited resources and could negatively affect our business, financial condition and results of operations. If we are unable to protect our proprietary rights (including aspects of our technology platform), we may find ourselves at a competitive disadvantage to others who have not incurred the same level of expense, time and effort to create and protect their intellectual property.
34
Table of Contents
Risks Related to this Offering and Shares of Our Common Stock
Our share price may be volatile, and you may lose some or all of your investment.
The initial public offering price for the shares of our common stock will be determined by negotiations between us and the representatives of the underwriters and may not be indicative of the market price of our common stock following this offering. The market price of our common stock may be highly volatile and may fluctuate substantially as a result of a variety of factors, some of which are related in complex ways, including:
| • | actual or anticipated fluctuations in our financial condition and operating results; |
| • | variance in our financial performance from expectations of securities analysts; |
| • | changes in the prices of our products; |
| • | changes in our projected operating and financial results; |
| • | changes in laws or regulations applicable to our products or marketing techniques; |
| • | announcements by us or our competitors of significant business developments, acquisitions or new solutions; |
| • | our involvement in any litigation; |
| • | our sale of our common stock or other securities in the future; |
| • | changes in senior management or key personnel; |
| • | trading volume of our common stock; |
| • | changes in the anticipated future size and growth rate of our market; and |
| • | general economic, regulatory and market conditions. |
Recently, the stock markets have experienced extreme price and volume fluctuations that have affected and continue to affect the market prices of equity securities of many companies. These fluctuations have often been unrelated or disproportionate to the operating performance of those companies. Broad market and industry fluctuations, as well as general economic, political, regulatory and market conditions, may negatively impact the market price of our common stock. If the market price of our common stock after this offering does not exceed the initial public offering price, you may lose some or all of your investment. In the past, companies that have experienced volatility in the market price of their securities have been subject to securities class action litigation. We may be the target of this type of litigation in the future, which could result in substantial costs and divert our management’s attention.
No public market for our common stock currently exists, and an active public trading market may not develop or be sustained following this offering.
No public market for our common stock currently exists. An active public trading market may not develop following the completion of this offering or, if developed, may not be sustained. The lack of an active market may impair your ability to sell your shares at the time you wish to sell them or at a price that you consider reasonable. The lack of an active market may also reduce the fair value of your shares. An inactive market may also impair our ability to raise capital to continue to fund operations by selling shares and may impair our ability to acquire other companies or technologies by using our shares as consideration.
If securities or industry analysts do not publish research or reports about our business, or publish negative reports about our business, our share price and trading volume could decline.
The trading market for our common stock will depend, in part, on the research and reports that securities or industry analysts publish about us or our business. We do not have any control over these analysts. If our
35
Table of Contents
financial performance fails to meet analyst estimates or one or more of the analysts who cover us downgrade our shares or change their opinion of our shares, our share price would likely decline. If one or more of these analysts cease coverage of our company or fail to regularly publish reports on us, we could lose visibility in the financial markets, which could cause our share price or trading volume to decline.
We do not intend to pay dividends for the foreseeable future and, as a result, your ability to achieve a return on your investment will depend on appreciation in the price of our common stock.
We have never declared or paid any cash dividends on our common stock and do not intend to pay any cash dividends in the foreseeable future. We anticipate that we will retain all of our future earnings for use in the development of our business and for general corporate purposes. Any determination to pay dividends in the future will be at the discretion of our board of directors. Accordingly, investors must rely on sales of their common stock after price appreciation, which may never occur, as the only way to realize any future gains on their investments.
Our future depends in part on the interests and influence of key stockholders.
Following this offering, our directors, executive officers and holders of more than 5% of our common stock, some of whom are represented on our board of directors, together with their affiliates will beneficially own % of the voting power of our outstanding capital stock. As a result, these stockholders will, immediately following this offering, be able to determine the outcome of matters submitted to our stockholders for approval. Some of these persons or entities may have interests that are different from yours, and this ownership could affect the value of your shares of common stock if, for example, these stockholders elect to delay, defer or prevent a change in corporate control, merger, consolidation, takeover or other business combination. This concentration of ownership may also adversely affect the market price of our common stock.
We may invest or spend the proceeds of this offering in ways with which you may not agree or in ways which may not yield a return.
A portion of the net proceeds from this offering will be used to repay our outstanding indebtedness, and the remaining net proceeds may be used for general corporate purposes, including working capital. We may also use a portion of the net proceeds to acquire complementary businesses, products or technologies. However, we do not have any agreements or commitments for any acquisitions at this time. Our management will have considerable discretion in the application of the net proceeds, and you will not have the opportunity, as part of your investment decision, to assess whether the proceeds are being used effectively. The net proceeds may be invested with a view towards long-term benefits for our stockholders and this may not increase our operating results or market value. The failure by our management to apply these funds effectively may adversely affect the return on your investment.
Future sales of our common stock in the public market could cause our share price to decline.
After this offering, there will be shares of our common stock outstanding, assuming no exercise of the underwriters’ over-allotment option. Sales of a substantial number of shares of our common stock in the public market after this offering, or the perception that these sales might occur, could depress the market price of our common stock and could impair our ability to raise capital through the sale of additional equity securities. Of our issued and outstanding shares of our common stock, all of the shares sold in this offering will be freely transferable without restrictions or further registration under the Securities Act of 1933, as amended, except for any shares acquired by our affiliates, as defined in Rule 144 under the Securities Act. The remaining shares outstanding after this offering will be restricted as a result of securities laws, lock-up agreements or other contractual restrictions that restrict transfers for 180 days after the date of this prospectus.
36
Table of Contents
Additionally, following the completion of this offering, stockholders holding approximately % of our common stock outstanding, will, after the expiration of the lock-up periods specified above, have the right, subject to various conditions and limitations, to include their shares of our common stock in registration statements relating to our securities. If the offer and sale of these shares are registered, they will be freely tradable without restriction under the Securities Act. Shares of common stock sold under such registration statements can be freely sold in the public market. In the event such registration rights are exercised and a large number of shares of common stock are sold in the public market, such sales could reduce the trading price of our common stock. See “Description of Capital Stock—Registration Rights” and “Shares Eligible for Future Sale—Lock-Up Agreements” for a more detailed description of these registration rights and the lock-up period.
We intend to file a registration statement on Form S-8 under the Securities Act to register the total number of shares of our common stock that may be issued under our equity incentive plans. See the information under the heading “Shares Eligible for Future Sale—Form S-8 Registration Statements” for a more detailed description of the shares of common stock that will be available for future sale upon the registration and issuance of such shares, subject to any applicable vesting or lock-up period or other restrictions provided under the terms of the applicable plan and/or the option agreements entered into with the option holders. In addition, in the future we may issue common stock or other securities if we need to raise additional capital. The number of new shares of our common stock issued in connection with raising additional capital could constitute a material portion of the then outstanding shares of our common stock.
You will experience immediate and substantial dilution in the net tangible book value of the shares of common stock you purchase in this offering.
The initial public offering price of our common stock will be substantially higher than the pro forma net tangible book value per share of our common stock, as of March 31, 2014, immediately after this offering. Therefore, if you purchase shares of our common stock in this offering, you will suffer immediate dilution of $ per share, or $ per share if the underwriters exercise their option in full, in net tangible book value after giving effect to the sale of common stock in this offering at an assumed public offering price of $ per share, the midpoint of the estimated initial public offering price range set forth on the cover page of this prospectus. See “Dilution.” If outstanding options to purchase our common stock are exercised in the future, you will experience additional dilution.
We are an “emerging growth company,” and the reduced disclosure requirements applicable to emerging growth companies may make our common stock less attractive to investors.
We are an “emerging growth company,” as defined in the Jumpstart Our Business Startups Act of 2012, or the JOBS Act. We will remain an emerging growth company until the earlier to occur of (1) the last day of the fiscal year (a) following the fifth anniversary of the completion of this offering, (b) in which we have total annual gross revenues of at least $1.0 billion or (c) in which we are deemed to be a large accelerated filer, which means the market value of our common stock that is held by non-affiliates exceeds $700 million as of the prior June 30th, and (2) the date on which we have issued more than $1.0 billion in non-convertible debt during the prior three-year period. For so long as we remain an emerging growth company, we intend to rely on exemptions from certain disclosure requirements that are applicable to other public companies that are not emerging growth companies including, but not limited to, not being required to comply with the auditor attestation requirements of Section 404 of the Sarbanes-Oxley Act, not being required to comply with any requirement that may be adopted by the Public Company Accounting Oversight Board regarding mandatory audit firm rotation or a supplement to the auditor’s report providing additional information about the audit and the financial statements, reduced disclosure obligations regarding executive compensation and exemptions from the requirements of holding a non-binding advisory vote on executive compensation and stockholder approval of any golden parachute payments not previously approved. We cannot predict whether investors will find our common stock less attractive if we rely on these exemptions. If some investors find our common stock less attractive as a result,
37
Table of Contents
there may be a less active trading market for our common stock and the market price of our common stock may be more volatile.
In addition, the JOBS Act permits emerging growth companies to take advantage of an extended transition period to comply with new or revised accounting standards applicable to public companies. We are choosing to “opt out” of this provision and, as a result, we will comply with new or revised accounting standards as required when they are adopted. This decision to opt out of the extended transition period is irrevocable.
We will incur increased costs as a result of operating as a public company, and our management will be required to devote substantial time to compliance with our public company responsibilities and corporate governance practices.
As a public company, and particularly after we are no longer an “emerging growth company,” we will incur significant legal, accounting and other expenses that we did not incur as a private company. The Sarbanes-Oxley Act, the Dodd-Frank Wall Street Reform and Consumer Protection Act, the listing requirements of and other applicable securities rules and regulations impose various requirements on public companies. Our management and other personnel will need to devote a substantial amount of time to compliance with these requirements. Moreover, these rules and regulations will increase our legal and financial compliance costs and will make some activities more time-consuming and costly. For example, we expect that these rules and regulations may make it more difficult and more expensive for us to obtain directors’ and officers’ liability insurance, which could make it more difficult for us to attract and retain qualified members of our board of directors. We cannot predict or estimate the amount of additional costs we will incur as a public company or the timing of such costs.
As a result of becoming a public company, we will be obligated to develop and maintain proper and effective internal controls over financial reporting and any failure to maintain the adequacy of these internal controls may adversely affect investor confidence in our company and, as a result, the value of our common stock.
We will be required, pursuant to Section 404 of the Sarbanes-Oxley Act, or Section 404, to furnish a report by management on, among other things, the effectiveness of our internal control over financial reporting for the first fiscal year beginning after the effective date of this offering. This assessment will need to include disclosure of any material weaknesses identified by our management in our internal control over financial reporting. Our independent registered public accounting firm will not be required to attest to the effectiveness of our internal control over financial reporting until our first annual report required to be filed with the SEC following the date we are no longer an “emerging growth company,” as defined in the JOBS Act. We will be required to disclose significant changes made in our internal control procedures on a quarterly basis.
We are beginning the costly and challenging process of compiling the system and processing documentation necessary to perform the evaluation needed to comply with Section 404, and we may not be able to complete our evaluation, testing and any required remediation in a timely fashion. Our compliance with Section 404 will require that we incur substantial accounting expense and expend significant management efforts. We currently do not have an internal audit group, and we will need to hire additional accounting and financial staff with appropriate public company experience and technical accounting knowledge and compile the system and process documentation necessary to perform the evaluation needed to comply with Section 404.
During the evaluation and testing process of our internal controls, if we identify one or more material weaknesses in our internal control over financial reporting, we will be unable to assert that our internal control over financial reporting is effective. We cannot assure you that there will not be material weaknesses or significant deficiencies in our internal control over financial reporting in the future. Any failure to maintain internal control over financial reporting could severely inhibit our ability to accurately report our financial condition or results of operations. If we are unable to conclude that our internal control over financial reporting is
38
Table of Contents
effective, or if our independent registered public accounting firm determines we have a material weakness or significant deficiency in our internal control over financial reporting, we could lose investor confidence in the accuracy and completeness of our financial reports, the market price of our common stock could decline, and we could be subject to sanctions or investigations by , the SEC or other regulatory authorities. Failure to remedy any material weakness in our internal control over financial reporting, or to implement or maintain other effective control systems required of public companies, could also restrict our future access to the capital markets.
Anti-takeover provisions in our charter documents and under Delaware law could make an acquisition of us more difficult, limit attempts by our stockholders to replace or remove our current management and limit the market price of our common stock.
Provisions in our amended and restated certificate of incorporation and bylaws, as will be in effect upon the completion of this offering, may have the effect of delaying or preventing a change in control or changes in our management. Our amended and restated certificate of incorporation and amended and restated bylaws will include provisions that:
| • | authorize our board of directors to issue preferred stock, without further stockholder action and with voting liquidation, dividend and other rights superior to our common stock; |
| • | require that any action to be taken by our stockholders be effected at a duly called annual or special meeting and not by written consent, and limit the ability of our stockholders to call special meetings; |
| • | establish an advance notice procedure for stockholder proposals to be brought before an annual meeting, including proposed nominations of persons for director nominees; |
| • | establish that our board of directors is divided into three classes, with directors in each class serving three-year staggered terms; |
| • | require the approval of holders of two-thirds of the shares entitled to vote at an election of directors to adopt, amend or repeal our bylaws or amend or repeal the provisions of our certificate of incorporation regarding the election and removal of directors and the ability of stockholders to take action by written consent or call a special meeting; |
| • | prohibit cumulative voting in the election of directors; and |
| • | provide that vacancies on our board of directors may be filled only by a majority of directors then in office, even though less than a quorum. |
These provisions may frustrate or prevent any attempts by our stockholders to replace or remove our current management by making it more difficult for stockholders to replace members of our board of directors, which is responsible for appointing the members of our management. In addition, because we are incorporated in Delaware, we are governed by the provisions of Section 203 of the Delaware General Corporation Law, which generally prohibits a Delaware corporation from engaging in any of a broad range of business combinations with any “interested” stockholder for a period of three years following the date on which the stockholder became an “interested” stockholder. Any of the foregoing provisions could limit the price that investors might be willing to pay in the future for shares of our common stock, and they could deter potential acquirers of our company, thereby reducing the likelihood that you would receive a premium for your common stock in an acquisition.
39
Table of Contents
Our amended and restated certificate of incorporation will designate the Court of Chancery of the State of Delaware as the exclusive forum for certain litigation that may be initiated by our stockholders, which could limit our stockholders’ ability to obtain a favorable judicial forum for disputes with us.
Pursuant to our amended and restated certificate of incorporation, as will be in effect upon the completion of this offering, unless we consent in writing to the selection of an alternative forum, the Court of Chancery of the State of Delaware will be the sole and exclusive forum for (1) any derivative action or proceeding brought on our behalf, (2) any action asserting a claim of breach of a fiduciary duty owed by any of our directors, officers or other employees to us or our stockholders, (3) any action asserting a claim arising pursuant to any provision of the Delaware General Corporation Law, our amended and restated certificate of incorporation or our amended and restated bylaws or (4) any action asserting a claim governed by the internal affairs doctrine. Our amended and restated certificate of incorporation will further provide that any person or entity purchasing or otherwise acquiring any interest in shares of our common stock is deemed to have notice of and consented to the foregoing provision. The forum selection clause in our amended and restated certificate of incorporation may limit our stockholders’ ability to obtain a favorable judicial forum for disputes with us.
40
Table of Contents
SPECIAL NOTE REGARDING FORWARD-LOOKING STATEMENTS
This prospectus contains forward-looking statements that involve substantial risks and uncertainties. The forward-looking statements are contained principally in the sections of this prospectus titled “Prospectus Summary,” “Risk Factors,” “Management’s Discussion and Analysis of Financial Condition and Results of Operations” and “Business,” but are also contained elsewhere in this prospectus. In some cases, you can identify forward-looking statements by the words “anticipate,” “believe,” “continue,” “could,” “estimate,” “expect,” “intend,” “may,” “might,” “objective,” “ongoing,” “plan,” “predict,” “project,” “potential,” “should,” “will,” or “would,” and or the negative of these terms, or other comparable terminology intended to identify statements about the future. These statements involve known and unknown risks, uncertainties and other factors that may cause our actual results, levels of activity, performance or achievements to be materially different from the information expressed or implied by these forward-looking statements. Although we believe that we have a reasonable basis for each forward-looking statement contained in this prospectus, we caution you that these statements are based on a combination of facts and factors currently known by us and our expectations of the future, about which we cannot be certain. Forward-looking statements include statements about:
| • | our ability to retain and increase sales to existing customers and attract new customers on a cost-effective basis; |
| • | our ability to market our products to local businesses and brand networks; |
| • | our ability to manage, measure and demonstrate the effectiveness of our platform and to continue to develop or acquire new products and technologies that are appealing to our customers; |
| • | our ability to develop or offer new or additional products in a timely manner that keeps pace with new technologies; |
| • | our ability to attract, motivate and retain qualified sales personnel; |
| • | the rate of growth of the local business market for our solutions; |
| • | increased competition and the offering of new solutions by our competitors; |
| • | our ability to effectively manage our growth; |
| • | potential acquisition and integration of complementary businesses and technologies; |
| • | our ability to monitor and comply with evolving regulations affecting out businesses; |
| • | the overall economic environment in the United States and its impact on local businesses; |
| • | our ability to maintain, or strengthen awareness of, our brand; |
| • | perceived or actual security, integrity, reliability, quality or compatibility problems with our solutions; |
| • | our expected use of proceeds; and |
| • | statements regarding future revenues, hiring plans, expenses, capital requirements and stock performance. |
You should refer to the “Risk Factors” section of this prospectus for a discussion of important factors that may cause our actual results to differ materially from those expressed or implied by our forward-looking statements. As a result of these factors, we cannot assure you that the forward-looking statements in this prospectus will prove to be accurate. Furthermore, if our forward-looking statements prove to be inaccurate, the inaccuracy may be material. In light of the significant uncertainties in these forward-looking statements, you should not regard these statements as a representation or warranty by us or any other person that we will achieve our objectives and plans in any specified time frame or at all. We undertake no obligation to publicly update any forward-looking statements, whether as a result of new information, future events or otherwise, except as required by law. The Private Securities Litigation Reform Act of 1995 and Section 27A of the Securities Act of 1933, as amended, or the Securities Act, do not protect any forward-looking statements that we make in connection with this offering.
41
Table of Contents
You should read this prospectus and the documents that we reference in this prospectus and have filed as exhibits to the registration statement, of which this prospectus is a part, completely and with the understanding that our actual future results may be materially different from what we expect. We qualify all of our forward-looking statements by these cautionary statements.
This prospectus contains market data and industry forecasts that were obtained from industry publications. These data involve a number of assumptions and limitations, and you are cautioned not to give undue weight to such estimates. We have not independently verified any third-party information. While we believe the market position, market opportunity and market size information included in this prospectus is generally reliable, such information is inherently imprecise.
42
Table of Contents
We estimate that the net proceeds from our issuance and sale of shares of our common stock in this offering will be approximately $ million, or approximately $ million if the underwriters exercise their over-allotment option in full, based upon an assumed initial public offering price of $ per share, which is the midpoint of the range set forth on the cover page of this prospectus, and after deducting estimated underwriting discounts and commissions and estimated offering expenses payable by us. We will not receive any of the proceeds from the sale of shares by the selling stockholders, although we will bear the costs, other than underwriting discounts and commissions, associated with those sales.
Each $1.00 increase or decrease in the assumed initial public offering price of $ per share, which is the midpoint of the range set forth on the cover page of this prospectus, would increase or decrease the net proceeds to us from this offering by approximately $ million, assuming that the number of shares offered by us, as set forth on the cover page of this prospectus, remains the same, after deducting estimated underwriting discounts and commissions. We may also increase or decrease the number of shares we are offering. Each 1,000,000 share increase or decrease in the number of shares offered by us would increase or decrease the net proceeds to us from this offering by approximately $ million, assuming that the assumed initial public offering price of $ per share, which is the midpoint of the range set forth on the cover page of this prospectus, remains the same, and after deducting the estimated underwriting discounts and commissions. We do not expect that a change in the initial offering price or the number of shares by these amounts would have a material effect on uses of the proceeds from this offering, although it may accelerate the time at which we will need to seek additional capital.
The principal purposes of this offering are to create a public market for our common stock and to facilitate our future access to the public equity markets, as well as to obtain additional capital. We intend to use a portion of the net proceeds from this offering to repay the following borrowings and obligations:
| • | $ of indebtedness outstanding under the term loan portion of our existing credit facility with Silicon Valley Bank, which currently accrues interest at a floating per annum rate equal to 0.75% plus the “prime rate” then in effect and matures June 1, 2017. The proceeds of this term loan were used to repay in full our outstanding obligations under our 2010 term loan with Silicon Valley Bank and the cash portion of the earn-out consideration paid to shareholders of Lighthouse Practice Management. |
| • | $ of indebtedness outstanding under our term loan with Rogers Communications Inc., which currently accrues interest at a rate of 5.0% per annum and matures September 9, 2017. The proceeds from this loan were used to repay in full our outstanding obligations under our 2011 term loan with Silicon Valley Bank and for general corporate purposes. |
| • | $6.2 million deferred payment obligation pursuant to the Agreement and Plan of Merger entered into in connection with our acquisition of Lighthouse Practice Management in February 2013, which currently accrues interest at a rate of 8.0% per annum and becomes due upon the earlier to occur of February 28, 2015 and the closing of this offering. |
We intend to use the remainder of the net proceeds for general corporate purposes. In addition, we may use a portion of the proceeds from this offering for acquisitions of complementary businesses, technologies or other assets, although we do not currently have any plans for any acquisitions. We may allocate funds from other sources to fund some or all of these activities. See “Management’s Discussion and Analysis of Financial Condition and Results of Operations—Liquidity and Capital Resources—Sources of Liquidity” for more information regarding our existing and former credit facilities.
The expected use of net proceeds from this offering represents our intentions based upon our present plans and business conditions. We cannot predict with certainty all of the particular uses for the proceeds of this offering or the amounts that we will actually spend on the uses set forth above. Accordingly, our management will have significant flexibility in applying the net proceeds of this offering.
43
Table of Contents
The timing and amount of our actual expenditures will be based on many factors, including cash flows from operations and the anticipated growth of our business. Pending the uses set forth above, we intend to invest the net proceeds of this offering in a variety of capital-preservation investments, including short- and intermediate-term, interest-bearing, investment-grade securities.
44
Table of Contents
We have never declared or paid any dividends on our common stock or any other securities. We anticipate that we will retain all of our future earnings, if any, for use in the operation and expansion of our business and do not anticipate paying cash dividends in the foreseeable future. Additionally, our ability to pay dividends on our common stock is limited by restrictions under the terms of the agreements governing our credit facilities, and will continue to be limited by such restrictions to the extent any such facilities remain outstanding after this offering. Payment of future cash dividends, if any, will be at the discretion of our board of directors after taking into account various factors, including our financial condition, operating results, current and anticipated cash needs, the requirements of current or then-existing debt instruments and other factors our board of directors deems relevant.
45
Table of Contents
The following table sets forth our cash and cash equivalents and our capitalization as of March 31, 2014:
| • | on an actual basis; and |
| • | on a pro forma as adjusted basis to reflect (1) the conversion of the outstanding shares of our preferred stock into common stock, which will occur automatically immediately prior to the completion of this offering, (2) the reclassification of our preferred stock warrant liabilities to additional paid-in capital upon the automatic conversion of certain of our preferred stock warrants into warrants exercisable for our common stock, which will occur automatically immediately prior to the completion of this offering, (3) the automatic preferred stock warrant exercise, (4) our sale of shares of common stock in this offering at an assumed initial public offering price of $ per share, which is the midpoint of the range set forth on the cover page of this prospectus, after deducting estimated underwriting discounts and commissions and estimated offering expenses payable by us, (5) a $ million deemed dividend on our Series F preferred stock, as described below, (6) the application of $ million of the net proceeds of this offering to repay indebtedness outstanding under our existing credit facilities and $6.2 million of the net proceeds of this offering to satisfy certain of our deferred payment obligations, as described in “Use of Proceeds,” and (7) the filing of our amended and restated certificate of incorporation, which will become effective immediately prior to the completion of this offering. |
You should read this table together with the sections of this prospectus titled “Use of Proceeds,” “Selected Consolidated Financial and Other Data,” “Management’s Discussion and Analysis of Financial Condition and Results of Operations” and our consolidated financial statements and the related notes appearing elsewhere in this prospectus.
| As of March 31, 2014 | ||||||
| Actual | Pro Forma as Adjusted(1) | |||||
| (in thousands, except share and per share data) | ||||||
| (unaudited) | ||||||
| Cash and cash equivalents |
$ | 10,274 | ||||
|
|
|
| ||||
| Long-term debt, including current portion(2) |
30,228 | |||||
| Preferred stock warrant liabilities |
5,846 | |||||
| Convertible preferred stock, $0.001 par value; 85,431,561 shares authorized, 81,781,250 shares issued and outstanding, actual(3); no shares authorized, issued or outstanding, pro forma as adjusted |
65,159 | |||||
| Stockholders’ (deficit) equity: |
||||||
| Preferred stock, $0.001 per share; no shares authorized, issued or outstanding, actual; 10,000,000 shares authorized, no shares issued or outstanding, pro forma as adjusted |
— | |||||
| Common stock, $0.0002 par value; 155,000,000 shares authorized, 42,812,887 shares issued and outstanding, actual; shares authorized, shares issued and outstanding, pro forma as adjusted(3) |
9 | |||||
| Additional paid-in capital(3) |
37,137 | |||||
| Accumulated deficit |
(84,467 | ) | ||||
|
|
|
| ||||
| Total stockholders’ (deficit) equity |
(47,321 | ) | ||||
|
|
|
| ||||
| Total capitalization |
$ | 53,912 | ||||
|
|
|
| ||||
| (1) | Each $1.00 increase or decrease in the assumed initial public offering price of $ per share, which is the midpoint of the range set forth on the cover page of this prospectus, would increase or decrease pro forma as adjusted cash and cash equivalents, additional paid-in capital, total stockholders’ (deficit) equity and total capitalization by approximately $ million, assuming that the number of shares |
46
Table of Contents
| offered by us, as set forth on the cover page of this prospectus, remains the same and after deducting the estimated underwriting discounts and commissions. We may also increase or decrease the number of shares we are offering. Each 1,000,000 share increase or decrease in the number of shares offered by us would increase or decrease pro forma as adjusted cash and cash equivalents, additional paid-in capital, total stockholders’ (deficit) equity and total capitalization by approximately $ million, assuming that the assumed initial public offering price of $ per share, which is the midpoint of the range set forth on the cover page of this prospectus, remains the same, and after deducting the estimated underwriting discounts and commissions. The pro forma as adjusted information discussed above is illustrative only and will adjust based on the actual initial offering price and other terms of this offering determined at pricing. |
| (2) | Includes current and long-term portions of bank loan, current and long-term portions of subordinated debt, deferred consideration, $4.8 million in accrued expenses and other current liabilities and $0.3 million in other liabilities, long-term portion, which includes deferred payments of $4.5 million related to our acquisition of Lighthouse Practice Management classified as accrued compensation expense and $0.6 million related to our asset acquisition from New Service, LLC. Amounts are disclosed at full payment value and do not reflect reductions for fair value adjustments that are reflected on the condensed consolidated balance sheet. |
| (3) | The number of shares of our common stock to be issued upon the automatic conversion of all outstanding shares of our Series F preferred stock depends on the initial public offering price of our common stock. The terms of our Series F preferred stock provide that the ratio at which each share of this series of preferred stock automatically converts into shares of our common stock in connection with this offering will increase if the initial public offering price is below $ per share, which would result in additional shares of our common stock being issued upon conversion of our Series F preferred stock immediately prior to the closing of this offering. Based upon the assumed initial public offering price of $ per share, the midpoint of the price range set forth on the cover page of this prospectus, the outstanding shares of our Series F preferred stock will convert into an aggregate of approximately shares of our common stock immediately prior to the closing of this offering. See “Prospectus Summary—The Offering” for a description of the number of shares issuable upon conversion of our Series F preferred stock, which depends on the initial public offering price of our common stock. |
The pro forma as adjusted additional paid-in capital and accumulated deficit amounts in the table above include the effects of a $ million deemed dividend for the assumed fair value of additional shares of common stock issued upon the conversion of our Series F preferred stock at the assumed initial public offering price of $ per share, which is the midpoint of the range set forth on the cover page of this prospectus. See “Unaudited Pro Forma Presentation” in note 1 to our unaudited interim condensed consolidated financial statements. The deemed dividend will increase the net loss allocable to common stockholders in the calculation of pro forma basic and diluted net loss per share.
The number of shares of our common stock shown as issued and outstanding on a pro forma as adjusted basis in the table above is based on the number of shares of our common stock outstanding as of March 31, 2014 and excludes:
| • | 17,574,484 shares of common stock issuable upon the exercise of options outstanding as of March 31, 2014, at a weighted-average exercise price of $1.1611 per share; |
| • | shares of our common stock reserved for future issuance pursuant to our equity incentive plans, including (1) shares pursuant to our 2014 Plan, (2) shares pursuant to our 2014 ESPP, each of which will become effective prior to the completion of this offering and will include provisions that automatically increase the number of shares of common stock reserved for issuance thereunder each year and (3) 3,419,224 shares of our common stock reserved for issuance under our 2007 Plan, which shares will be added to the shares reserved under the 2014 Plan upon its effectiveness; |
| • | 1,242,829 shares of common stock issuable upon the exercise of certain preferred stock warrants that were outstanding as of March 31, 2014, at a weighted-average exercise price of $0.9937 per share; and |
| • | 200,553 shares of common stock issuable upon the exercise of certain common stock warrants that were outstanding as of March 31, 2014, at a weighted-average exercise price of $1.1676 per share. |
47
Table of Contents
If you invest in our common stock, your interest will be diluted to the extent of the difference between the initial public offering price per share of our common stock and the pro forma as adjusted net tangible book value per share of our common stock immediately after the closing of this offering.
The pro forma net tangible book value of our common stock as of March 31, 2014 was $ million, or $ per share, based on shares of common stock outstanding. Pro forma net tangible book value per share represents our total tangible assets (total assets less intangible assets) less our total liabilities, divided by the total number of shares of our outstanding common stock, after giving effect to (1) the conversion of all outstanding shares of our preferred stock into shares of common stock immediately prior to the closing of this offering, (2) the automatic net exercise of preferred stock warrants into shares of our common stock and (3) the reclassification of our preferred stock warrant liabilities to additional paid-in capital immediately prior to the closing of this offering.
After giving effect to the receipt of the net proceeds from our sale of shares of common stock in this offering at an assumed initial public offering price of $ per share, which is the midpoint of the range set forth on the cover page of this prospectus, after deducting estimated underwriting discounts and commissions and estimated offering expenses payable by us, our pro forma as adjusted net tangible book value as of March 31, 2014 would have been $ million, or $ per share. This represents an immediate increase in pro forma as adjusted net tangible book value of $ per share to our existing stockholders and an immediate dilution of $ per share to investors purchasing common stock in this offering.
The following table illustrates this per share dilution:
| Assumed initial public offering price per share |
$ | |||||||
| Pro forma net tangible book value per share as of March 31, 2014 |
$ | |||||||
| Increase in pro forma net tangible book value per share attributable to new investors in this offering |
||||||||
|
|
|
|||||||
| Pro forma as adjusted net tangible book value per share after giving effect to this offering |
||||||||
|
|
|
|||||||
| Dilution in pro forma as adjusted net tangible book value per share to new investors in this offering |
$ | |||||||
|
|
|
Each $1.00 increase or decrease in the assumed initial public offering price of $ per share, which is the midpoint of the range set forth on the cover page of this prospectus, would increase or decrease the pro forma net tangible book value, as adjusted to give effect to this offering, by $ per share and the dilution to new investors by $ per share, assuming that the number of shares offered by us, as set forth on the cover page of this prospectus, remains the same, and after deducting underwriting discounts and commissions. Similarly, each increase or decrease of 1,000,000 shares in the number of shares of common stock offered by us would increase or decrease the pro forma net tangible book value, as adjusted to give effect to this offering, by approximately $ per share and the dilution to new investors by $ per share, assuming the assumed initial public offering price of $ per share, which is the midpoint of the range set forth on the cover page of this prospectus, remains the same and after deducting the estimated underwriting discounts and commissions.
The pro forma information discussed above is illustrative only and will adjust based on the actual initial offering price and other terms of this offering determined at pricing. See “Prospectus Summary—The Offering” for a description of the number of shares issuable upon conversion of our Series F preferred stock, which depends on the initial public offering price of our common stock.
48
Table of Contents
If the underwriters exercise their option to purchase additional shares in full, the pro forma as adjusted net tangible book value per share after giving effect to this offering would be $ per share, and the dilution in pro forma as adjusted net tangible book value per share to new investors in this offering would be $ per share of common stock.
The following table summarizes as of March 31, 2014, on the pro forma as adjusted basis described above, the number of shares of our common stock, the total consideration and the average price per share (1) paid to us by our existing stockholders and (2) to be paid by new investors purchasing our common stock in this offering at an assumed initial public offering price of $ per share, which is the midpoint of the range set forth on the cover page of this prospectus, before deducting estimated underwriting discounts and commissions and estimated offering expenses payable by us:
| Shares Purchased | Weighted- average price per share |
|||||||||||||||||
| Total Consideration | ||||||||||||||||||
| Number | Percent | Amount | Percent | |||||||||||||||
| Existing stockholders |
% | $ | % | $ | ||||||||||||||
| New investors |
||||||||||||||||||
|
|
|
|
|
|
|
|
|
|
||||||||||
| Total |
100 | % | $ | 100 | % | |||||||||||||
|
|
|
|
|
|
|
|
|
|
||||||||||
The foregoing table does not reflect the sales by existing stockholders in connection with sales made by them in this offering. Sales by the selling stockholders in this offering will reduce the number of shares held by existing stockholders to shares, or % of the total number of shares of our common stock outstanding after this offering, and will increase the number of shares held by new investors to shares, or % of the total number of shares of our common stock outstanding after this offering.
The foregoing table and calculations are based on shares of common stock outstanding as of March 31, 2014, after giving effect to the automatic preferred stock warrant exercise and the conversion of all outstanding shares of preferred stock into an aggregate of shares of common stock upon the closing of this offering, and excludes:
| • | 17,574,484 shares of common stock issuable upon the exercise of options outstanding as of March 31, 2014, at a weighted-average exercise price of $1.1611 per share; |
| • | shares of our common stock reserved for future issuance pursuant to our equity incentive plans, including (1) shares pursuant to our 2014 Plan, (2) shares pursuant to our 2014 ESPP, each of which will become effective prior to the completion of this offering and will include provisions that automatically increase the number of shares of common stock reserved for issuance thereunder each year and (2) 3,419,224 shares of our common stock reserved for issuance under our 2007 Plan, which shares will be added to the shares reserved under the 2014 Plan upon its effectiveness; |
| • | 1,242,829 shares of common stock issuable upon the exercise of certain preferred stock warrants that were outstanding as of March 31, 2014, at a weighted-average exercise price of $0.9937 per share; and |
| • | 200,553 shares of common stock issuable upon the exercise of certain common stock warrants that were outstanding as of March 31, 2014, at a weighted-average exercise price of $1.1676 per share. |
To the extent that options or warrants are exercised, new options or other securities are issued under our equity incentive plans, or we issue additional shares of common stock in the future, there will be further dilution to investors participating in this offering. In addition, we may choose to raise additional capital because of market conditions or strategic considerations, even if we believe that we have sufficient funds for our current or future operating plans. If we raise additional capital through the sale of equity or convertible debt securities, the issuance of these securities could result in further dilution to our stockholders.
49
Table of Contents
SELECTED CONSOLIDATED FINANCIAL AND OTHER DATA
The following tables set forth our selected consolidated financial and other data for, and as of the periods ended on, the dates indicated. The consolidated statements of operations and comprehensive loss data for the years ended December 31, 2011, 2012 and 2013 and the selected consolidated balance sheet data for the years ended December 31, 2012 and 2013 are derived from our audited consolidated financial statements included elsewhere in this prospectus. The selected consolidated balance sheet data as of December 31, 2011 are derived from our audited financial consolidated financial statements, which are not included in this prospectus. The selected condensed consolidated statements of operations and comprehensive income (loss) data for the three months ended March 31, 2013 and 2014 and the selected condensed consolidated balance sheet data as of March 31, 2014 are derived from our unaudited interim condensed consolidated financial statements appearing elsewhere in this prospectus. Our unaudited interim condensed consolidated financial statements were prepared on a basis consistent with our audited consolidated financial statements and include, in management’s opinion, all normal recurring adjustments necessary for the fair presentation of the financial information set forth in those statements including elsewhere in this prospectus. The data should be read together with “Management’s Discussion and Analysis of Financial Condition and Results of Operations” and in conjunction with the consolidated financial statements, related notes, and other financial information included elsewhere in this prospectus. Our historical results are not necessarily indicative of the results that may be expected for any future period.
| Year Ended December 31, | Three Months Ended March 31, |
|||||||||||||||||||
| 2011 | 2012 | 2013 | 2013 | 2014 | ||||||||||||||||
| (in thousands, except per share and customer data) | ||||||||||||||||||||
| (unaudited) | ||||||||||||||||||||
| Consolidated Statements of Operations Data: |
||||||||||||||||||||
| Revenues |
$ | 87,584 | $ | 132,321 | $ | 161,863 | $ | 35,202 | $ | 45,746 | ||||||||||
|
|
|
|
|
|
|
|
|
|
|
|||||||||||
| Costs and expenses: |
||||||||||||||||||||
| Cost of revenues (exclusive of depreciation and amortization shown separately below)(1) |
33,876 | 42,760 | 53,843 | 11,925 | 14,446 | |||||||||||||||
| Selling and marketing(1) |
36,318 | 51,623 | 64,605 | 14,076 | 18,628 | |||||||||||||||
| Technology and product development(1) |
10,157 | 14,977 | 20,346 | 4,568 | 5,660 | |||||||||||||||
| General and administrative(1) |
15,305 | 19,591 | 29,271 | 6,085 | 8,349 | |||||||||||||||
| Depreciation and amortization |
2,328 | 3,721 | 6,419 | 1,248 | 1,845 | |||||||||||||||
|
|
|
|
|
|
|
|
|
|
|
|||||||||||
| Total costs and expenses |
97,984 | 132,672 | 174,484 | 37,902 | 48,928 | |||||||||||||||
|
|
|
|
|
|
|
|
|
|
|
|||||||||||
| Loss from operations |
(10,400 | ) | (351 | ) | (12,621 | ) | (2,700 | ) | (3,182 | ) | ||||||||||
| Interest expense and other |
(7,074 | ) | (4,690 | ) | (2,912 | ) | (440 | ) | (2,660 | ) | ||||||||||
|
|
|
|
|
|
|
|
|
|
|
|||||||||||
| Loss before income taxes |
(17,474 | ) | (5,041 | ) | (15,533 | ) | (3,140 | ) | (5,842 | ) | ||||||||||
| (Benefit) provision for income taxes |
(2,035 | ) | 387 | (5,131 | ) | (5,327 | ) | 103 | ||||||||||||
|
|
|
|
|
|
|
|
|
|
|
|||||||||||
| Net (loss) income and comprehensive (loss) income |
$ | (15,439 | ) | $ | (5,428 | ) | $ | (10,402 | ) | $ | 2,187 | $ | (5,945 | ) | ||||||
|
|
|
|
|
|
|
|
|
|
|
|||||||||||
| Net (loss) income per share attributable to common stockholders(2) |
||||||||||||||||||||
| Basic |
$ | (0.48 | ) | $ | (0.17 | ) | $ | (0.29 | ) | $ | — | $ | (0.14 | ) | ||||||
|
|
|
|
|
|
|
|
|
|
|
|||||||||||
| Diluted |
$ | (0.48 | ) | $ | (0.17 | ) | $ | (0.29 | ) | $ | — | $ | (0.14 | ) | ||||||
|
|
|
|
|
|
|
|
|
|
|
|||||||||||
| Weighted-average shares used to compute net (loss) income per share attributable to common stockholders(2) |
||||||||||||||||||||
| Basic |
31,955 | 32,573 | 35,743 | 34,279 | 41,243 | |||||||||||||||
|
|
|
|
|
|
|
|
|
|
|
|||||||||||
| Diluted |
31,955 | 32,573 | 35,743 | 46,876 | 41,243 | |||||||||||||||
|
|
|
|
|
|
|
|
|
|
|
|||||||||||
| Pro forma net (loss) income per share attributable to common stockholders—basic and diluted(3) |
||||||||||||||||||||
|
|
|
|||||||||||||||||||
| Pro forma weighted-average shares used to compute pro forma net (loss) income per share attributable to common stockholders—basic and diluted(3) |
||||||||||||||||||||
|
|
|
|||||||||||||||||||
| Other Financial and Other Data (unaudited): |
||||||||||||||||||||
| Number of Customers(4) |
27,200 | 29,300 | 42,000 | 33,800 | 44,800 | |||||||||||||||
| Adjusted EBITDA(5) |
$ | (5,899 | ) | $ | 6,236 | $ | 1,819 | $ | 286 | $ | 378 | |||||||||
50
Table of Contents
| As of December 31, | As of March 31, |
|||||||||||||||
| 2011 | 2012 | 2013 | 2014 | |||||||||||||
| (in thousands) |
||||||||||||||||
| (unaudited) | ||||||||||||||||
| Consolidated Balance Sheet Data: |
||||||||||||||||
| Cash and cash equivalents |
$ | 14,606 | $ | 9,166 | $ | 12,345 | $ | 10,274 | ||||||||
| Working capital (deficit)(6) |
(7,136 | ) | (20,729 | ) | (27,325 | ) | (32,721 | ) | ||||||||
| Total assets |
67,916 | 66,482 | 93,729 | 93,663 | ||||||||||||
| Long-term debt, including current portion(7) |
32,930 | 18,034 | 29,609 | 30,228 | ||||||||||||
| Total liabilities |
64,070 | 54,513 | 74,456 | 75,825 | ||||||||||||
| Convertible preferred stock |
38,515 | 48,733 | 62,411 | 65,159 | ||||||||||||
| Total stockholders’ deficit |
(34,669 | ) | (36,764 | ) | (43,138 | ) | (47,321 | ) | ||||||||
| (1) | Includes stock-based compensation expense as follows: |
| Year Ended December 31, | Three Months Ended March 31, |
|||||||||||||||||||
| 2011 | 2012 | 2013 | 2013 | 2014 | ||||||||||||||||
| (in thousands) |
||||||||||||||||||||
| (unaudited) | ||||||||||||||||||||
| Cost of revenues |
$ | 15 | $ | 17 | $ | 15 | $ | 4 | $ | 10 | ||||||||||
| Selling and marketing |
422 | 577 | 780 | 241 | 237 | |||||||||||||||
| Technology and product development |
235 | 445 | 675 | 159 | 218 | |||||||||||||||
| General and administrative |
1,160 | 1,827 | 1,161 | 521 | 214 | |||||||||||||||
|
|
|
|
|
|
|
|
|
|
|
|||||||||||
| Total stock-based compensation expense |
$ | 1,832 | $ | 2,866 | $ | 2,631 | $ | 925 | $ | 679 | ||||||||||
|
|
|
|
|
|
|
|
|
|
|
|||||||||||
| (2) | See note 15 to our unaudited interim condensed consolidated financial statements and note 21 to our consolidated financial statements for an explanation of the calculations of our actual basic and diluted net (loss) income per share attributable to common stockholders. |
| (3) | Pro forma basic and diluted net (loss) income per share attributable to common stockholders represents net (loss) income and comprehensive (loss) income divided by the pro forma weighted-average shares of common stock outstanding. Pro forma weighted-average shares of common stock outstanding reflects (a) the automatic preferred stock warrant exercise and (b) the conversion of preferred stock (using the if-converted method) into common stock as though the conversion had occurred on the later of the issuance date or the first day of the relevant period (assuming a conversion ratio equal to common shares for each Series F preferred share based on an assumed initial public offering price of $ per share, which is the midpoint of the range set forth on the cover page of this prospectus), and also reflect the issuance of shares of common stock pursuant to the automatic preferred stock warrant exercise. See the section “Prospectus Summary—The Offering” for a description of the number of shares issuable upon conversion of our Series F preferred stock, which depends on the initial public offering price of our common stock. |
| (4) | We calculate the number of customers at the end of each fiscal year as the number of unique customers with a subscription to one or more of our platform products and customers of our Yodle Ads product, rounded down to the nearest hundred. We consider as separate customers each location of a brand network that uses one of our more of our products. In cases where our customers have subscriptions to our platform obtained through resellers, we include those customers in our customer count. |
| (5) | We define Adjusted EBITDA as our net (loss) income and comprehensive (loss) income plus (minus): interest expense and other, (benefit) provision for income taxes and depreciation and amortization expense, adjusted to eliminate the impact of stock-based compensation expense, which is a non-cash item, and the effect of charges related to business combination and asset acquisition. We have included Adjusted EBITDA in this prospectus because it is a key measure used by our management and board of directors to understand and evaluate our core operating performance and trends, to prepare and approve our annual budget and to develop short- and long-term operational plans. In particular, we believe that the exclusion of the expenses eliminated in calculating Adjusted EBITDA can provide a useful measure for period-to-period comparisons of our core business. Accordingly, we believe that Adjusted EBITDA provides useful information to investors and others in understanding and evaluating our operating results in the same manner as our management and board of directors. |
| Our use of Adjusted EBITDA has limitations as an analytical tool, and you should not consider it in isolation or as a substitute for analysis of our financial results as reported under GAAP. Some of these limitations are: (a) although depreciation and amortization are non-cash charges, the assets being depreciated and amortized may have to be replaced in the future, and Adjusted EBITDA does not reflect cash capital expenditure requirements for such replacements or for new capital expenditure requirements; (b) Adjusted EBITDA does not reflect changes in, or cash requirements for, our working capital needs; (c) Adjusted EBITDA does not reflect the potentially dilutive impact of equity-based compensation; (d) Adjusted EBITDA does not reflect tax payments that may represent a reduction in cash available to us; and (e) other companies, including companies in our industry, may calculate Adjusted EBITDA or similarly titled measures differently, which reduces its usefulness as a comparative measure. |
51
Table of Contents
| Because of these and other limitations, you should consider Adjusted EBITDA alongside our other GAAP-based financial performance measures, net loss and our other GAAP financial results. The following table presents a reconciliation of Adjusted EBITDA to net (loss) income and comprehensive (loss) income the most directly comparable GAAP measure, for each of the periods indicated. |
| Year Ended December 31, | Three Months Ended March 31, |
|||||||||||||||||||
| 2011 | 2012 | 2013 | 2013 | 2014 | ||||||||||||||||
| (in thousands) | ||||||||||||||||||||
| Net (loss) income and comprehensive (loss) income |
$ | (15,439 | ) | $ | (5,428 | ) | $ | (10,402 | ) | $ | 2,187 | $ | (5,945 | ) | ||||||
| Adjustments: |
||||||||||||||||||||
| Interest expense and other |
7,074 | 4,690 | 2,912 | 440 | 2,660 | |||||||||||||||
| (Benefit) provision for income taxes |
(2,035 | ) | 387 | (5,131 | ) | (5,327 | ) | 103 | ||||||||||||
| Depreciation and amortization expense |
2,328 | 3,721 | 6,419 | 1,248 | 1,845 | |||||||||||||||
| Charges related to business combination and asset acquisition* |
341 | — | 5,390 | 813 | 1,036 | |||||||||||||||
| Stock-based compensation expense |
1,832 | 2,866 | 2,631 | 925 | 679 | |||||||||||||||
|
|
|
|
|
|
|
|
|
|
|
|||||||||||
| Total net adjustments |
9,540 | 11,664 | 12,221 | (1,901 | ) | 6,323 | ||||||||||||||
|
|
|
|
|
|
|
|
|
|
|
|||||||||||
| Adjusted EBITDA |
$ | (5,899 | ) | $ | 6,236 | $ | 1,819 | $ | 286 | $ | 378 | |||||||||
|
|
|
|
|
|
|
|
|
|
|
|||||||||||
| * | Charges related to business combination and asset acquisition consists of costs (including any related transaction costs) incurred in connection with our (a) acquisition of ProfitFuel in May 2011; (b) our acquisition of Lighthouse Practice Management in February 2013, including $4.0 million and $0.5 million of a deferred payment which was classified as compensation expense under ASC 718 for the year ended December 31, 2013 and the three months ended March 31, 2014, respectively; and (c) our asset acquisition from New Service, LLC in February 2014. |
| (6) | Working capital (deficit) includes all current assets less all current liabilities. |
| (7) | Includes current and long-term portions of bank loan, current and long-term portions of subordinated debt and deferred consideration. As of March 31, 2014, it also included $4.8 million in accrued expenses and other current liabilities and $0.3 million in other liabilities, long-term portion, which includes deferred payments of $4.5 million related to our acquisition of Lighthouse Practice Management classified as accrued compensation expense and $0.6 million related to our asset acquisition from New Service, LLC. As of December 31, 2013, it also included the cash portion of contingent consideration in business combination and $4.0 million in long-term portion of other liabilities, but excluded the fair value attributable to 869,565 shares of Series E preferred stock payable as non-cash earn-out consideration. Amounts are disclosed at full payment value and do not reflect reductions for fair value adjustments that are reflected on the balance sheet. |
52
Table of Contents
MANAGEMENT’S DISCUSSION AND ANALYSIS OF FINANCIAL CONDITION
AND RESULTS OF OPERATIONS
You should read the following discussion and analysis of our financial condition and results of operations in conjunction with our consolidated financial statements and related notes beginning on page F-1. In addition to historical information, this discussion contains forward-looking statements reflecting current expectations that involve risks and uncertainties. You should read the sections titled “Risk Factors” and “Special Note Regarding Forward-Looking Statements” for a discussion of the factors that could cause our actual results to differ materially from our expectations. Many of the amounts and percentages in this discussion have been rounded for convenience of presentation.
Overview
Yodle is a leading provider of cloud-based marketing automation solutions for local businesses that makes digital marketing easy, affordable and transparent. Our platform provides our customers with an online, mobile and social presence, as well as automates, manages and optimizes their marketing activities and other consumer interactions. We utilize our proprietary data assets and algorithms to increase the likelihood that consumers will find our customers and become their paying consumers. Our platform provides our customers with transparency into their marketing activities and business operations, thereby enabling them to evaluate their return on investment, or ROI. Our solutions are highly integrated and designed to be easy-to-use, helping local businesses navigate the rapidly evolving, technologically challenging and highly fragmented digital marketing landscape without having to invest a significant amount of time and money or needing any in-house marketing or IT expertise.
We believe the market for our local marketing automation platform is large and underserved. According to the most recent U.S. Census Bureau data, there are more than 28 million local businesses in the United States. We currently target industry verticals that include approximately 7 million local businesses, which we define as non-employer firms and businesses with up to 99 employees. We served approximately 44,800 local businesses as of March 31, 2014.
We began operations in 2005. Over nine years of focusing on the unique and constantly evolving digital marketing needs of local businesses, we have developed a differentiated approach to addressing this large and fragmented market. We use our sophisticated technology, rigorous data collection and analytics and scalable process automation in all key aspects of our business.
Our investment in technology, automation and our process-driven approach has resulted in significant reductions in our customer acquisition and onboarding costs, which helps minimize our initial investment to bring on new customers and allows us to achieve rapid payback. We define payback as occurring when the costs associated with acquiring and launching a cohort of new customers in any given quarter is offset by the ongoing cash flow from those customers, less our ongoing costs. We are typically able to generate positive cash flows within the first year after acquiring and launching a cohort of new customers, including the impact from customers who do not renew their subscriptions or service during the first year and excluding overhead costs. As a result, we believe our business model benefits from rapid payback. We refer to customers who we acquired directly (i.e., not through resellers) and who remain as customers after their initial year as our tenured customers. For the 12 months ended March 31, 2014, we experienced a monthly average revenue retention rate of 97.5% for our tenured customers. We calculate monthly average revenue retention as the revenue derived from tenured customers in the current month relative to the revenue derived from those same tenured customers in the prior month. We expect the revenue retention rate for our tenured customers to continue to improve as our mix of revenues shifts toward revenues from platform products, as revenue derived from customers who subscribe to our platform products generally exhibits a higher retention rate than revenue derived from customers who purchase our media product. We believe we have a compelling business model which is characterized by low customer acquisition and onboarding costs, rapid payback and high monthly revenue retention of tenured customers, resulting in attractive customer economics and high returns on our initial investment.
53
Table of Contents
We generate revenues from subscriptions to our platform and sales of our media offering. Our platform revenue is attributable to direct sales of subscriptions to our platform products, which currently include our Marketing Essentials, Centermark and Lighthouse products. Marketing Essentials is our flagship product that currently includes three modules: presence, conversion optimization and communication automation. Centermark leverages certain core capabilities of Marketing Essentials by providing a standardized source of shared data, communication and reporting to address the needs of national franchisors and other similar businesses. Lighthouse is our business practice automation product, which automates many of our customers’ daily consumer interactions or office routines. We also derive additional platform revenues from sales of our products sold through resellers. Our media revenue is attributable to direct sales of our Yodle Ads media product, which automates, manages and optimizes our customers’ media spend across mobile and desktop search engines. We refer to our offerings and the packages in which we sell them as products.
Our Product History and Business Evolution
We launched our automated SEM optimization bidding engine, now called Yodle Ads, in 2007. From 2007 through 2009, we primarily grew our customer base and increased our revenues through increasing sales of our media product and the recurring revenue generated from existing customers. Starting in 2010, we began expanding our product offerings to address a broad range of digital marketing needs for local businesses. We introduced our first platform product, Yodle Organic, in 2010. Yodle Organic provided local businesses with a digital presence that was optimized for organic traffic and formed the basis of our current conversion optimization module within Marketing Essentials. We increased our platform revenues as we increased the number of sales personnel selling Yodle Organic and by generating recurring revenue from our existing platform customers. We further increased our platform revenues as a result of our acquisition of ProfitFuel in May 2011. Starting in late 2012, we increased our investment in technology and product development with the goal of increasing the pace of our innovation and product introductions.
Our current suite of products and modules is the result of ongoing, internal product development and innovation that have been supplemented by select strategic business acquisitions. In late 2012, we converted the digital presence module included in Yodle Organic into Yodle Web. We further augmented our platform offerings in February 2013 with the acquisition of Lighthouse Practice Management. This acquisition helped expand our platform offering and enabled us to offer our customers a business practice automation product, which we call Lighthouse. In December 2013, we introduced our Centermark product for brand networks. Centermark leverages modules of our Marketing Essentials product by providing a standardized source of shared data, communication and reporting to address the unique needs of brand network owners. Prior to the introduction of Centermark, we offered brand network customers products that were primarily comprised of Yodle Organic, Yodle Web and Yodle Ads.
In the first quarter of 2014, we introduced Marketing Essentials, our flagship product, which is based on our predecessor products, including Yodle Organic and Yodle Web. Marketing Essentials currently includes three modules: presence, conversion optimization and communication automation. In March 2014, we began selling our Marketing Essentials product, with its three current modules, to new customers. In April 2014, we began providing our existing Yodle Organic customers with the features or modules of our current Marketing Essentials product that were not part of their previous offering.
We intend to continue to expand the capabilities of our platform and evolve our product offerings to address the challenges local businesses face, with an emphasis on continuing to grow our platform revenue.
In 2012, we achieved positive Adjusted EBITDA and generated cash flow from operations. After attaining these business and financial milestones, we made a strategic decision to prioritize accelerating the adoption of our platform products in the marketplace with the goal of increasing our long-term revenue and customer base. As a result, in 2013, we increased our investments in technology and product development and selling and marketing, and implemented certain pricing adjustments for our products. We increased our technology and product
54
Table of Contents
development expenditures by 36% and increased the number of our selling and marketing personnel by 29%. Additionally, for new customers that purchased both our platform and media product, we reduced the overall subscription price for our platform product and correspondingly increased our customers’ media budgets, with the goal of increasing their ROI and our customer retention. The primary financial effects of these changes on our 2013 results were to decrease our overall and platform revenue growth rate, increase our revenue growth rate from our media product and increase our cost of revenues, which negatively impacted our Adjusted EBITDA. Given that we did not experience increases in our customer retention at levels that would make this an attractive long-term pricing strategy, we increased the price of these platform products in the second half of 2013.
Key Metrics
We review two key business metrics to help us monitor the performance of our business and that we believe are useful to understanding the underlying trends affecting our business. These key metrics are the number of our customers and Adjusted EBITDA. The following table summarizes our key business metrics for the periods set forth below.
| Year Ended December 31, | Three Months Ended March 31, |
|||||||||||||||||||
| 2011 | 2012 | 2013 | 2013 | 2014 | ||||||||||||||||
| (unaudited) | ||||||||||||||||||||
| Number of Customers |
27,200 | 29,300 | 42,000 | 33,800 | 44,800 | |||||||||||||||
| Adjusted EBITDA (in thousands) |
$ | (5,899 | ) | $ | 6,236 | $ | 1,819 | $ | 286 | $ | 378 | |||||||||
Number of Customers
We calculate the number of customers at the end of any particular period as the number of unique customers with a subscription to one or more of our platform products and customers of our Yodle Ads product, rounded down to the nearest hundred. With limited exception, as of March 31, 2014, all of our customers subscribed to one or more of our platform products. We consider as separate customers each location of a brand network that uses one of our more of our products. In cases where businesses have subscriptions to our platform obtained through resellers, we include those businesses in our customer count. As of March 31, 2014, our customers were primarily located in the United States and Canada.
Adjusted EBITDA
Adjusted EBITDA represents our net (loss) income and comprehensive (loss) income plus (minus): interest expense and other, (benefit) provision for income taxes and depreciation and amortization expense, adjusted to eliminate the impact of stock-based compensation expense, which is a non-cash item. In addition, we exclude the effect of charges related to our acquisition of ProfitFuel in May 2011, Lighthouse Practice Management in February 2013 and our asset acquisition from New Service, LLC in February 2014. Adjusted EBITDA is a key measure used by our management to understand and evaluate our core operating performance and trends, to prepare and approve our annual budget and to develop short- and long-term operational plans. In particular, we believe the exclusion of the expenses eliminated in calculating Adjusted EBITDA can provide a useful measure for period-to-period comparisons of our core business. Accordingly, we believe that Adjusted EBITDA provides useful information to investors and others in understanding and evaluating our operating results in the same manner as our management and board of directors. Adjusted EBITDA is not a measure calculated in accordance with GAAP and has limitations as an analytical tool, and you should not consider it in isolation or as a substitute for analysis of our financial results as reported under GAAP. Please see footnote (5) to the table in the section titled “Selected Consolidated Financial and Other Data” in this prospectus for a discussion of the limitations of Adjusted EBITDA and a reconciliation of Adjusted EBITDA to net (loss) income and comprehensive (loss) income, the most comparable GAAP measurement, for the years ended December 31, 2011, 2012 and 2013 and for the three months ended March 31, 2013 and 2014.
55
Table of Contents
Basis of Presentation
The key elements of our operating results include:
Revenues
We generate revenues from subscriptions to our platform and sales of our media offering. Our platform revenue is attributable to direct sales of subscriptions to our platform products, which currently include our Marketing Essentials, Centermark and Lighthouse products, as well as other products and modules of our local marketing automation platform that we historically sold under different product names, both on a standalone basis and packaged in combinations. We also derive additional platform revenues from sales of our products sold through resellers. Our media revenue is attributable to direct sales of Yodle Ads.
We sell Yodle Ads and subscriptions to our platform products primarily through our direct sales force and, to a lesser extent, through resellers. Subscriptions to Marketing Essentials and its predecessor products typically range from three- to 12-month initial subscription terms. Historically, these contracts have generally been extended on a month-to-month basis after the initial subscription term. Subscriptions to our Centermark product typically have 12-month initial subscription terms or longer. Subscriptions to our Lighthouse product are typically for month-to-month subscription terms.
Our customers typically pay a recurring monthly fixed fee for subscriptions to our platform products. For platform customers who also subscribe to our Yodle Ads media product, a portion of their monthly fee represents a monthly media budget that we establish with them at the time of their initial subscription. Our customers may adjust their monthly media budget in accordance with their needs but may not decrease their budget during the initial subscription term. Our customers typically pay their subscription fee and their media budget in advance. We record these prepayments as deferred revenue and recognize this revenue at the time our products are delivered. Revenues generated by our platform products are recognized ratably over the term during which the products are delivered. Revenues generated by our media product are recognized as local online advertising is purchased on behalf of that customer. If the entirety of the customer’s media budget is not used during the relevant period, that remaining amount will be recorded as deferred revenue and recognized when used.
We charge our resellers a fee on a per customer basis for each platform product they sell. The fees we charge our resellers are typically lower than the fees we charge our direct customers given that we incur limited selling and marketing expenses with sales made through resellers. Additionally, we collect a share of the revenue that our resellers generate from the sale of our media product. We recognize revenue in the period that we deliver our products to our resellers. Additionally, certain of our resellers have guaranteed to provide us with minimum fees, regardless of the volume of sales. Revenues derived from our resellers are included in platform revenues and are recognized on a net basis.
We expect that, over time, revenues generated by our platform products will grow more rapidly than revenues generated by our media product. However, our quarterly financial results of operations may not consistently reflect this trend given that the contribution to our revenues from our media product will likely vary more from period-to-period than revenue from our platform products.
Costs and Expenses
Our costs and expenses consist of cost of revenues, selling and marketing, technology and product development, general and administrative and depreciation and amortization expenses. Salaries, bonuses, stock-based compensation and other personnel related costs are the most significant components of each of these expense categories. We grew from 417 employees at December 31, 2010 to 1,117 employees at March 31, 2014, and we expect to continue to hire new employees in order to support our anticipated revenue growth. We include stock-based compensation expense in connection with the grant of stock options in the applicable costs and expense category based on the award recipient’s department.
56
Table of Contents
Cost of Revenues. Cost of revenues consists of traffic acquisition costs, net of any publisher rebates, client service account setup personnel costs including salaries, bonuses, stock-based compensation and other personnel costs, third-party costs associated with service delivery, colocation, hosting and designing websites, and credit card processing fees. No allocation of depreciation and amortization expense was made to cost of revenues.
The largest component of our cost of revenues is net traffic acquisition costs, which is only associated with our media product. Net traffic acquisition costs are the costs associated with acquiring online media for our customers from third-party publishers, primarily consisting of Google, Microsoft and Yahoo!, net of any publisher rebates. Typically, we become obligated to make payments for traffic acquisition costs in the period the advertising is delivered. Traffic acquisition costs are recognized as cost of revenues in the period in which they are incurred. From time to time, publishers may offer us rebates based on various factors, including specified advertiser count and other requirements. We record these rebates in the period in which they are earned as a reduction to the cost of revenues.
Generally, we expect our cost of revenues to increase in absolute dollars, but to remain relatively consistent as a percentage of revenues in the near term. Historically, we have experienced higher margins on our platform products as compared to our media product. In the long term, as the percentage of our total revenues attributable to our platform products increases, we expect our cost of revenues to decrease as a percentage of our total revenues.
Selling and Marketing Expense. Selling and marketing expense consists primarily of personnel costs, including salaries, bonuses, variable incentive-based compensation, stock-based compensation and other personnel costs related to sales, customer loyalty and retention, public relations, marketing, training and operations. Additional expenses in this category include travel and entertainment, advertising costs, marketing and promotional events, marketing activities, subcontracting fees and allocated overhead.
In order to grow our customer base, we expect to continue investing our resources in selling and marketing by increasing the number of sales and marketing and customer loyalty and retention personnel and expanding our marketing activities. As a result, we expect selling and marketing expense to increase in absolute dollars. However, we believe that our selling and marketing expense will decrease as a percentage of total revenues as our base of tenured customers continues to grow and represents a larger portion of our revenues.
Technology and Product Development Expense. Technology and product development expense consists primarily of personnel costs for our employees working in the development and infrastructure, information technology and product and product performance teams, including salaries, bonuses, stock-based compensation and other personnel costs. Also included are non-personnel costs such as consulting and professional fees to third-party development resources, software licensing fees and technology maintenance and other product development costs. We capitalize a portion of our technology development costs and, accordingly, include only a portion of those costs as technology and product development expense.
Our technology and product development efforts are focused on enhancing our platform and the products we offer and improving the performance of those products for our customers. We believe this investment is critical to maintaining the quality of our products and innovating to enhance our competitive position. We expect technology and product development expense to continue to increase on an absolute dollar basis and decrease as a percentage of revenue over time.
General and Administrative Expense. General and administrative expense consists primarily of personnel costs, including salaries, bonuses, stock-based compensation and other personnel costs for our administrative, legal, business development, human resources, finance and accounting employees. Additional expenses included in this category are non-personnel costs, such as real estate related expenses, building and maintenance expenses, travel related expenses, subcontracting and professional fees, audit fees, tax services and legal fees, as well as insurance and other corporate expenses. In addition, general and administrative expense includes compensation expenses related to our February 2013 acquisition of Lighthouse Practice Management. We expect our general and administrative expense to increase on an absolute dollar basis as we continue to support our growth and decrease as a percentage of revenue over time.
57
Table of Contents
We also anticipate that we will incur additional costs for personnel and professional services related to our preparation to become and operate as a public company. Such costs include increases in our finance and legal personnel, additional external legal and audit fees and expenses and costs associated with compliance with the Sarbanes-Oxley Act and other regulations governing public companies. We also expect to incur increased costs for directors’ and officers’ liability insurance and an enhanced investor relations function. Additionally, we intend to relocate our corporate headquarters in New York as our existing office space will not accommodate our anticipated growth in headcount and our current lease expires in April 2015. We expect that our real estate and building and maintenance expenses will increase in the near term as we expand the amount of square footage under lease. We may also incur additional expenses if we move our headquarters to a commercial space with a higher rental rate.
Depreciation and Amortization Expense. Depreciation and amortization expense primarily consists of our depreciation expense related to investments in property and equipment, amortization expense related to technology development costs and software, as well as the amortization of intangible assets originating from our acquisitions of ProfitFuel in 2011 and Lighthouse Practice Management in 2013. These acquired intangible assets included developed technology, customer relationships, domain names, non-competition agreements and trademarks and trade names.
Interest Expense and Other
Interest expense and other includes interest expense primarily consisting of interest incurred on outstanding borrowings under our debt obligations, changes in the fair value of our preferred stock warrant liabilities and interest received on our cash and cash equivalents. The fair value of our preferred stock warrant liabilities is re-measured at the end of each reporting period and any changes in fair value are recognized on our statements of operations as interest expense and other. Upon completion of this offering, other than preferred stock warrants that are subject to the automatic preferred stock warrant exercise, our preferred stock warrants will automatically, in accordance with their terms, become warrants to purchase our common stock, which will result in the reclassification of the preferred stock warrant liabilities related to these warrants to additional paid-in capital, and no further changes in fair value will be recognized in interest expense and other.
(Benefit) Provision for Income Taxes
(Benefit) provision for income taxes consists of federal and state income taxes in the United States and income taxes in a foreign jurisdiction, deferred income taxes reflecting the net tax effects of temporary differences between the carrying amounts of assets and liabilities for financial reporting purposes and the amounts used for income tax purposes, and the realization of net operating loss carryforwards.
58
Table of Contents
Results of Operations
The following table sets forth our selected consolidated statements of operations data:
| Year Ended December 31, | Three Months Ended March 31, |
|||||||||||||||||||
| 2011 | 2012 | 2013 | 2013 | 2014 | ||||||||||||||||
| (in thousands) | ||||||||||||||||||||
| (unaudited) | ||||||||||||||||||||
| Consolidated Statements of Operations Data: |
||||||||||||||||||||
| Revenues |
$ | 87,584 | $ | 132,321 | $ | 161,863 | $ | 35,202 | $ | 45,746 | ||||||||||
|
|
|
|
|
|
|
|
|
|
|
|||||||||||
| Costs and expenses: |
||||||||||||||||||||
| Cost of revenues (exclusive of depreciation and amortization shown separately below)(1) |
33,876 | 42,760 | 53,843 | 11,925 | 14,446 | |||||||||||||||
| Selling and marketing(1) |
36,318 | 51,623 | 64,605 | 14,076 | 18,628 | |||||||||||||||
| Technology and product development(1) |
10,157 | 14,977 | 20,346 | 4,568 | 5,660 | |||||||||||||||
| General and administrative(1) |
15,305 | 19,591 | 29,271 | 6,085 | 8,349 | |||||||||||||||
| Depreciation and amortization |
2,328 | 3,721 | 6,419 | 1,248 | 1,845 | |||||||||||||||
|
|
|
|
|
|
|
|
|
|
|
|||||||||||
| Total costs and expenses |
97,984 | 132,672 | 174,484 | 37,902 | 48,928 | |||||||||||||||
|
|
|
|
|
|
|
|
|
|
|
|||||||||||
| Loss from operations |
(10,400 | ) | (351 | ) | (12,621 | ) | (2,700 | ) | (3,182 | ) | ||||||||||
| Interest expense and other |
(7,074 | ) | (4,690 | ) | (2,912 | ) | (440 | ) | (2,660 | ) | ||||||||||
|
|
|
|
|
|
|
|
|
|
|
|||||||||||
| Loss before income taxes |
(17,474 | ) | (5,041 | ) | (15,533 | ) | (3,140 | ) | (5,842 | ) | ||||||||||
| (Benefit) provision for income taxes |
(2,035 | ) | 387 | (5,131 | ) | (5,327 | ) | 103 | ||||||||||||
|
|
|
|
|
|
|
|
|
|
|
|||||||||||
| Net (loss) income and comprehensive (loss) income |
$ | (15,439 | ) | $ | (5,428 | ) | $ | (10,402 | ) | $ | 2,187 | $ | (5,945 | ) | ||||||
|
|
|
|
|
|
|
|
|
|
|
|||||||||||
| (1) | Includes stock-based compensation expense as follows: |
| Cost of revenues |
$ | 15 | $ | 17 | $ | 15 | $ | 4 | $ | 10 | ||||||||||
| Selling and marketing |
422 | 577 | 780 | 241 | 237 | |||||||||||||||
| Technology and product development |
235 | 445 | 675 | 159 | 218 | |||||||||||||||
| General and administrative |
1,160 | 1,827 | 1,161 | 521 | 214 | |||||||||||||||
|
|
|
|
|
|
|
|
|
|
|
|||||||||||
| Total stock-based compensation expense |
$ | 1,832 | $ | 2,866 | $ | 2,631 | $ | 925 | $ | 679 | ||||||||||
|
|
|
|
|
|
|
|
|
|
|
59
Table of Contents
The following table sets forth our selected consolidated statements of operations data expressed as a percentage of revenues:
| Year Ended December 31, | Three Months Ended March 31, |
|||||||||||||||||||
| 2011 | 2012 | 2013 | 2013 | 2014 | ||||||||||||||||
| (as a percentage of revenues) |
||||||||||||||||||||
| (unaudited) | ||||||||||||||||||||
| Consolidated Statements of Operations Data: |
||||||||||||||||||||
| Revenues |
100 | % | 100 | % | 100 | % | 100 | % | 100 | % | ||||||||||
|
|
|
|
|
|
|
|
|
|
|
|||||||||||
| Costs and expenses: |
||||||||||||||||||||
| Cost of revenues (exclusive of depreciation and amortization shown separately below) |
39 | 32 | 33 | 34 | 32 | |||||||||||||||
| Selling and marketing |
41 | 39 | 40 | 40 | 41 | |||||||||||||||
| Technology and product development |
12 | 11 | 13 | 13 | 12 | |||||||||||||||
| General and administrative |
17 | 15 | 18 | 17 | 18 | |||||||||||||||
| Depreciation and amortization |
3 | 3 | 4 | 4 | 4 | |||||||||||||||
|
|
|
|
|
|
|
|
|
|
|
|||||||||||
| Total costs and expenses |
112 | 100 | 108 | 108 | 107 | |||||||||||||||
|
|
|
|
|
|
|
|
|
|
|
|||||||||||
| Loss from operations |
(12 | ) | — | (8 | ) | (8 | ) | (7 | ) | |||||||||||
| Interest expense and other |
(8 | ) | (4 | ) | (2 | ) | (1 | ) | (6 | ) | ||||||||||
|
|
|
|
|
|
|
|
|
|
|
|||||||||||
| Loss before income taxes |
(20 | ) | (4 | ) | (10 | ) | (9 | ) | (13 | ) | ||||||||||
| (Benefit) provision for income taxes |
(2 | ) | — | (3 | ) | (15 | ) | — | ||||||||||||
|
|
|
|
|
|
|
|
|
|
|
|||||||||||
| Net (loss) income and comprehensive (loss) income |
(18 | )% | (4 | )% | (6 | )% | 6 | % | (13 | )% | ||||||||||
|
|
|
|
|
|
|
|
|
|
|
|||||||||||
Comparison of Three Months Ended March 31, 2013 and 2014
Revenues
| Three Months Ended March 31, |
% Change 2014 vs. 2013 |
|||||||||||
| 2013 | 2014 | |||||||||||
| (in thousands) | ||||||||||||
| Platform revenues: |
$ | 15,142 | $ | 20,549 | 36% | |||||||
| Media revenues: |
$ | 20,060 | $ | 25,196 | 26% | |||||||
|
|
|
|
|
|||||||||
| Revenues |
$ | 35,202 | $ | 45,746 | 30% | |||||||
|
|
|
|
|
|||||||||
Revenues for the three months ended March 31, 2014 increased $10.5 million, or 30%, compared to the same period in 2013. Platform revenues grew by $5.4 million, or 36%, and media revenues grew by $5.1 million, or 26%, for the three months ended March 31, 2014 compared to the same period in 2013. The increase in platform revenues was primarily due to a $3.1 million increase in revenues from the acceleration of sales of our Lighthouse product that we acquired in February 2013 in addition to one full quarter of revenue generated from our Lighthouse product in the three months ended March 31, 2014 compared to one month of revenue in the same period in 2013. In addition, platform revenue increased by $2.4 million as a result of a 28% increase in the number of customers subscribing to our other platform products, partially offset by lower average monthly revenue per customer from these products in the three months ended March 31, 2014 compared to the same period in 2013. The increase in media revenues was primarily attributable to an increase in the average per customer media spend of new customers who purchased our media product in addition to our platform product. This increase was primarily the result of increases of the average per customer media budget from these customers in conjunction with a corresponding decrease in their subscription price of our platform product.
60
Table of Contents
Cost of Revenues
| Three Months Ended March 31, |
% Change 2014 vs. 2013 |
|||||||||||
| 2013 | 2014 | |||||||||||
| (in thousands) | ||||||||||||
| Cost of revenues |
$ | 11,925 | $ | 14,446 | 21% | |||||||
| % of revenues |
34% | 32% | ||||||||||
The $2.5 million increase in cost of revenues for the three months ended March 31, 2014 compared to the same period in 2013 was attributable to a $1.9 million, or 22%, increase in net traffic acquisition costs from $8.5 million in the three months ended March 31, 2013 to $10.4 million in the three months ended March 31, 2014, directly resulting from our increase in media revenues. Cost of revenues directly attributable to our platform products increased by $0.4 million primarily due to the acceleration of sales of our Lighthouse product that we acquired in February 2013 in addition to recognizing one quarter of cost of revenues from our Lighthouse product in the three months ended March 31, 2014 compared to one month of costs recognized during the three months ended March 31, 2013. Costs shared across our media and platform products increased $0.2 million, driven primarily by an increase in credit card processing fees and colocation and hosting fees. Despite an increase in the number of accounts onboarded, personnel costs associated with customer service employees, which are shared across our media and platform products, remained consistent quarter over quarter as a result of our investments in technology and automation.
Selling and Marketing Expense
| Three Months Ended March 31, |
% Change 2014 vs. 2013 |
|||||||||||
| 2013 | 2014 | |||||||||||
| (in thousands) | ||||||||||||
| Selling and marketing |
$ | 14,076 | $ | 18,628 | 32% | |||||||
| % of revenues |
40% | 41% | ||||||||||
The $4.6 million increase in selling and marketing expense for the three months ended March 31, 2014 compared to the same period in 2013 was primarily attributable to a $3.8 million increase in salaries, variable incentive-based compensation, stock-based compensation and other personnel-related costs, as we increased the number of selling and marketing personnel to support our increased sales objectives and expanding customer base due, in part, to our acquisition of Lighthouse Practice Management. In addition, selling and marketing expense increased by $0.6 million as a result of increased third-party costs and increased marketing initiatives.
Technology and Product Development Expense
| Three Months Ended March 31, |
% Change 2014 vs. 2013 |
|||||||||||
| 2013 | 2014 | |||||||||||
| (in thousands) | ||||||||||||
| Technology and product development |
$ | 4,568 | $ | 5,660 | 24% | |||||||
| % of revenues |
13% | 12% | ||||||||||
The $1.1 million increase in technology and product development expense for the three months ended March 31, 2014 compared to the same period in 2013 was primarily attributable to a $1.0 million increase in salaries, bonuses, stock-based compensation and other personnel costs, which was largely driven by our increased investment in technology and product development personnel to support our continued efforts to develop new products and enhance our platform and existing product offerings.
General and Administrative Expense
| Three Months Ended March 31, |
% Change 2014 vs. 2013 |
|||||||||||
| 2013 | 2014 | |||||||||||
| (in thousands) | ||||||||||||
| General and administrative |
$ | 6,085 | $ | 8,349 | 37% | |||||||
| % of revenues |
17% | 18% | ||||||||||
61
Table of Contents
The $2.3 million increase in general and administrative expense for the three months ended March 31, 2014 compared to the same period in 2013 was primarily due to a $1.1 million increase in salaries, stock-based compensation costs and other personnel-related costs, which was largely driven by recognizing one quarter of personnel costs from general and administrative employees associated with our acquisition of Lighthouse Practice Management in the three months ended March 31, 2014 compared to one month of these costs recognized in the same period in 2013, as well as increases in accounting, finance, human resources, legal and business development personnel to support the growth of our business. In addition, we experienced a $0.4 million increase in audit fees in preparation for a potential initial public offering and a $0.3 million increase in real estate expense and building maintenance costs as we expanded our operations in New York City and Charlotte.
Depreciation and Amortization
| Three Months Ended March 31, |
% Change 2014 vs. 2013 |
|||||||||||
| 2013 | 2014 | |||||||||||
| (in thousands) | ||||||||||||
| Depreciation and amortization |
$ | 1,248 | $ | 1,845 | 48% | |||||||
| % of revenues |
4% | 4% | ||||||||||
The $0.6 million increase in depreciation and amortization expense for the three months ended March 31, 2014 as compared to the same period in 2013 was primarily due to amortization of intangibles from the acquisition of Lighthouse Practice Management in February 2013.
Interest Expense and Other
| Three Months Ended March 31, |
% Change 2014 vs. 2013 |
|||||||||||
| 2013 | 2014 | |||||||||||
| (in thousands) | ||||||||||||
| Interest expense and other |
$ | (440 | ) | $ | (2,660 | ) | 505% | |||||
| % of revenues |
(1 | )% | (6 | )% | ||||||||
The $2.2 million increase in interest expense and other for the three months ended March 31, 2014 compared to the same period in 2013 was primarily driven by a $2.2 million expense related to the change in the fair value of our convertible preferred stock warrants. Interest expense related to indebtedness decreased $0.1 million from the three months ended March 31, 2013 to the same period in 2014 as a result of achieving lower interest rates on our outstanding debt, offset by higher levels of outstanding indebtedness.
(Benefit) Provision for Income Taxes
| Three Months Ended March 31, |
% Change 2014 vs. 2013 |
|||||||||||
| 2013 | 2014 | |||||||||||
| (in thousands) | ||||||||||||
| (Benefit) provision for income taxes |
$ | (5,327 | ) | $ | 103 | 102% | ||||||
| % of revenues |
(15 | )% | — | |||||||||
The $5.4 million increase in our provision for income taxes for the three months ended March 31, 2014 compared to the same period in 2013 was due to a $5.3 million deferred tax benefit realized in February 2013 resulting from purchase accounting related to the acquisition of Lighthouse Practice Management.
62
Table of Contents
Comparison of Years Ended December 31, 2011, 2012 and 2013
Revenues
| Year Ended December 31, | % Change 2012 vs. 2011 |
% Change 2013 vs. 2012 |
||||||||||||||||||
| 2011 | 2012 | 2013 | ||||||||||||||||||
| (in thousands) | ||||||||||||||||||||
| Platform revenues |
$ | 31,568 | $ | 58,976 | $ | 71,466 | 87 | % | 21 | % | ||||||||||
| Media revenues |
$ | 56,016 | $ | 73,345 | $ | 90,397 | 31 | % | 23 | % | ||||||||||
| Revenues |
$ | 87,584 | $ | 132,321 | $ | 161,863 | 51 | % | 22 | % | ||||||||||
2013 Compared to 2012
Revenues for 2013 increased $29.5 million, or 22%, compared to 2012. Platform revenues grew by $12.5 million, or 21%, from $59.0 million in 2012 to $71.5 million in 2013. Media revenues grew by $17.1 million, or 23%, from $73.3 million in 2012 to $90.4 million in 2013. The increase in platform revenues was driven by a $8.3 million increase in revenues from sales of our Lighthouse product that we acquired in February 2013 and the allocation of additional sales personnel to accelerate revenue growth from our Lighthouse product subsequent to the acquisition. We also experienced a $4.2 million increase in revenues from sales of our other platform products due to a 24% increase in the number of customers subscribing to our other platform products, partially offset by lower average monthly revenue per customer in 2013 for the predecessor to our Marketing Essentials product as a result of changes in our pricing strategy. The increase in media revenues was primarily attributable to an increase in the number of customers purchasing both our platform and media products as well as an increase in the average per customer media spend of new customers and, to a lesser extent, to large seasonal campaigns in 2013 from a franchise network and its locations.
2012 Compared to 2011
Revenues for 2012 increased $44.7 million, or 51%, compared to 2011. Platform revenues grew by $27.4 million, or 87%, from $31.6 million in 2011 to $59.0 million in 2012. Media revenues grew by $17.3 million, or 31%, from $56.0 million in 2011 to $73.3 million in 2012. The increase in platform revenues was primarily driven by a 41% increase in the number of customers subscribing to our platform, resulting primarily from the additional direct sales of our platform products. In addition, this increase in platform revenue was driven by sales of platform products that we acquired in our May 2011 acquisition of ProfitFuel and the subsequent growth in sales of subscriptions to these products following the acquisition and, to a lesser extent, the increase in platform revenue driven by the commencement of our reseller relationship with Rogers in Canada. The increase in media revenues was primarily attributable to an increase in the number of customers of our media product, resulting in part from new customers purchasing our media product alongside a subscription to our platform product and sales personnel acquired as part of our acquisition of ProfitFuel transitioning from selling exclusively platform products to selling both platform and media products over the course of 2012 and, to a lesser extent, the addition of a franchise relationship with a large network of customers.
Cost of Revenues
| Year Ended December 31, | % Change 2012 vs. 2011 |
% Change 2013 vs. 2012 |
||||||||||||||||||
| 2011 | 2012 | 2013 | ||||||||||||||||||
| (in thousands) | ||||||||||||||||||||
| Cost of revenues |
$ | 33,876 | $ | 42,760 | $ | 53,843 | 26 | % | 26 | % | ||||||||||
| % of revenues |
39 | % | 32 | % | 33 | % | ||||||||||||||
63
Table of Contents
2013 Compared to 2012
The $11.1 million increase in cost of revenues from 2012 to 2013 was attributable to a $5.7 million, or 17%, increase in net traffic acquisition costs from $32.7 million in 2012 to $38.5 million in 2013, directly resulting from our increase in media revenues in 2013. Costs directly attributable to our platform products increased by $4.4 million, including increased costs for listings management and content creation. Costs shared across our media and platform products increased $1.4 million, driven primarily by a $1.1 million increase in credit card processing fees and colocation and hosting fees. Our increase in cost of revenues was partially offset by a decrease of $0.4 million in personnel costs associated with customer service employees, which are shared across our media and platform products, as a result of our increased investment in automation.
2012 Compared to 2011
The $8.9 million increase in cost of revenues from 2011 to 2012 was primarily attributable to a $6.5 million, or 25%, increase in net traffic acquisition costs from $26.2 million in 2011 to $32.7 million in 2012, directly resulting from an increase in our media revenues in 2012. Costs directly attributable to our platform products increased by $0.5 million, including increased costs for content creation. Costs shared across both our media and platform products increased $1.6 million, including a $0.6 million increase in credit card processing fees and colocation and hosting fees. In addition, our cost of revenues increased by $0.3 million as a result of increases in personnel costs, which are shared across our media and platform products, associated with customer service employees.
Selling and Marketing Expense
| Year Ended December 31, | % Change 2012 vs. 2011 |
% Change 2013 vs. 2012 |
||||||||||||||||||
| 2011 | 2012 | 2013 | ||||||||||||||||||
| (in thousands) | ||||||||||||||||||||
| Selling and marketing |
$ | 36,318 | $ | 51,623 | $ | 64,605 | 42 | % | 25 | % | ||||||||||
| % of revenues |
41 | % | 39 | % | 40 | % | ||||||||||||||
2013 Compared to 2012
The $13.0 million increase in selling and marketing expense from 2012 to 2013 was primarily attributable to a $12.4 million increase in salaries, variable incentive-based compensation, stock-based compensation and other personnel-related costs, as we increased the number of direct local sales force personnel to support our increased sales objectives. Selling and marketing expense was also impacted by a $0.6 million increase in costs related to marketing initiatives.
2012 Compared to 2011
The $15.3 million increase in selling and marketing expense from 2011 to 2012 was primarily attributable to a $14.3 million increase in salaries, variable incentive-based compensation, stock-based compensation and other personnel-related costs, as we increased the number of selling and marketing personnel to support our increased sales objectives and expanding customer base due, in part, to our acquisition of ProfitFuel. Selling and marketing expense was also impacted by a $1.0 million increase in costs related to marketing initiatives, software licenses and other selling and marketing costs.
Technology and Product Development Expense
| Year Ended December 31, | % Change 2012 vs. 2011 |
% Change 2013 vs. 2012 |
||||||||||||||||||
| 2011 | 2012 | 2013 | ||||||||||||||||||
| (in thousands) | ||||||||||||||||||||
| Technology and product development |
$ | 10,157 | $ | 14,977 | $ | 20,346 | 47 | % | 36 | % | ||||||||||
| % of revenues |
12 | % | 11 | % | 13 | % | ||||||||||||||
64
Table of Contents
2013 Compared to 2012
The $5.4 million increase in technology and product development expense from 2012 to 2013 was primarily attributable to a $5.0 million increase in salaries, bonuses, stock-based compensation and other personnel costs, which was largely driven by our increased investment in technology and product development personnel to support our continued efforts to develop new products and enhance our platform and existing product offerings.
2012 Compared to 2011
The $4.8 million increase in technology and product development expense from 2011 to 2012 was primarily attributable to a $4.3 million increase in salaries, bonuses, stock-based compensation and other personnel costs, which was largely driven by our increased investment in technology and product development personnel to support our continued efforts to develop new products and enhance our platform and existing product offerings.
General and Administrative Expense
| Year Ended December 31, | % Change 2012 vs. 2011 |
% Change 2013 vs. 2012 |
||||||||||||||||||
| 2011 | 2012 | 2013 | ||||||||||||||||||
| (in thousands) | ||||||||||||||||||||
| General and administrative |
$ | 15,305 | $ | 19,591 | $ | 29,271 | 28 | % | 49 | % | ||||||||||
| % of revenues |
17 | % | 15 | % | 18 | % | ||||||||||||||
2013 Compared to 2012
The $9.7 million increase in general and administrative expense from 2012 to 2013 was primarily due to a one-time $4.3 million charge for compensation expense associated with the deferred cash payment and a $0.7 million charge associated with a change in fair value of the deferred consideration, in each case incurred in connection with our acquisition of Lighthouse Practice Management, a $3.1 million increase in salaries, stock-based compensation costs and other personnel-related costs, which was largely driven by an increase in the number of accounting, finance, human resources, legal and business development personnel to support the growth of our business and a $1.0 million increase in real estate expense and building maintenance costs as we expanded our existing operations in Charlotte and New York.
2012 Compared to 2011
The $4.3 million increase in general and administrative expense from 2011 to 2012 was primarily due to a $1.9 million increase in salaries, stock-based compensation costs and other personnel-related costs, which was largely driven by an increase in the number of accounting, finance, human resources and business development personnel to support the growth of our business, a $1.1 million increase in real estate expense and building maintenance costs as we expanded our operations in Austin and a $0.3 million one-time cost incurred in connection with abandoning our Boston lease.
Depreciation and Amortization Expense
| Year Ended December 31, | % Change 2012 vs. 2011 |
% Change 2013 vs. 2012 |
||||||||||||||||||
| 2011 | 2012 | 2013 | ||||||||||||||||||
| (in thousands) | ||||||||||||||||||||
| Depreciation and amortization |
$ | 2,328 | $ | 3,721 | $ | 6,419 | 60 | % | 73 | % | ||||||||||
| % of revenues |
3 | % | 3 | % | 4 | % | ||||||||||||||
65
Table of Contents
2013 Compared to 2012
The $2.7 million increase in depreciation and amortization expense from 2012 to 2013 was primarily due to amortization of intangibles from the Lighthouse Practice Management acquisition in February 2013, increased depreciation and amortization expense related to our expansion in Austin in late 2012, and investments in our technology infrastructure to support our growing personnel across our offices.
2012 Compared to 2011
The $1.4 million increase in depreciation and amortization expense from 2011 to 2012 was primarily due to expense related to a full year of amortization of intangibles acquired from ProfitFuel compared to seven months of amortization in 2011, and investments in our technology infrastructure to support our growing personnel across our offices.
Interest Expense and Other
| Year Ended December 31, | % Change 2012 vs. 2011 |
% Change 2013 vs. 2012 |
||||||||||||||||||
| 2011 | 2012 | 2013 | ||||||||||||||||||
| (in thousands) | ||||||||||||||||||||
| Interest expense and other |
$ | (7,074 | ) | $ | (4,690 | ) | $ | (2,912 | ) | 34 | % | 38 | % | |||||||
| % of revenues |
(8 | )% | (4 | )% | (2 | )% | ||||||||||||||
2013 Compared to 2012
The $1.8 million decrease in interest expense and other from 2012 to 2013 was primarily due to the repayment of the ProfitFuel deferred payment in late 2012, the conversion of convertible promissory notes into equity and reduced borrowing costs as a result of financing activity.
2012 Compared to 2011
The $2.4 million decrease in interest expense and other from 2011 to 2012 was primarily due to a $5.0 million reduction in interest expense due to amortization of the beneficial conversion feature of the convertible promissory notes issued pursuant to our bridge financing, partially offset by a $1.3 million increase in interest related to loans and a $1.2 million expense related to the change in the fair value of our convertible preferred stock warrants.
(Benefit) Provision for Income Taxes
| Year Ended December 31, | % Change 2012 vs. 2011 |
% Change 2013 vs. 2012 |
||||||||||||||||||
| 2011 | 2012 | 2013 | ||||||||||||||||||
| (in thousands) | ||||||||||||||||||||
| (Benefit) provision for income taxes |
$ | (2,035 | ) | $ | 387 | $ | (5,131 | ) | 119 | % | * | |||||||||
| % of revenues |
(2 | )% | — | (3 | )% | |||||||||||||||
| * | not meaningful |
2013 Compared to 2012
The $5.5 million decrease in our provision for income taxes from 2012 to 2013 was primarily due to a $5.4 million deferred tax benefit realized through the acquisition of intangible assets resulting from the acquisition of Lighthouse Practice Management in February 2013.
2012 Compared to 2011
The $2.4 million increase in our provision for income taxes from 2011 to 2012 was primarily due to a $2.1 million deferred tax benefit recorded in 2011 in connection with our acquisition of ProfitFuel in May 2011.
66
Table of Contents
Liquidity and Capital Resources
Working Capital, Operating and Capital Expenditure Requirements
As of March 31, 2014, we had cash and cash equivalents of $10.3 million. Cash and cash equivalents consist of cash and money market funds. We did not have any short-term or long-term investments. We use cash for working capital purposes, and we do not enter into investments for trading or speculative purposes. Our policy is to invest any cash in excess of our immediate capital requirements in investments designed to preserve the principal. Accordingly, our cash and cash equivalents are invested primarily in demand deposit accounts and money market funds that are currently providing only a minimal return. In 2014, we expect our capital expenditure requirements to be approximately $4.0 million to $6.0 million in the aggregate. Our future working capital, operating and capital expenditure requirements will depend on many factors, including the rate of our revenue growth, the amount and timing of our investments in personnel and capital equipment, and the timing and extent of our introduction of new products and product enhancements. We believe our existing cash and cash equivalents and our future cash flows from operating activities will be sufficient to meet our anticipated cash needs for at least the next 12 months. Thereafter, we may need to raise additional funds through bank credit arrangements or public or private equity, equity-linked or debt financings to meet our future cash requirements. We may also need to raise additional funds in the event we determine in the future to effect one or more acquisitions of businesses, technologies or products. Any additional equity financing may be dilutive to our stockholders. Moreover, if we raise additional funds through the incurrence of indebtedness, such indebtedness will likely require current payment of interest and contain covenants that restrict our operations, such as limitations on our ability to incur additional debt, and other operating restrictions that could adversely impact our ability to conduct our business. If additional funding is required, we may not be able to obtain bank credit arrangements or to effect an equity, equity-linked or debt financing on terms acceptable to us, or at all. If we are unable to raise additional funds when needed, our operations and ability to execute our business strategy could be adversely affected.
Sources of Liquidity
Since inception, we have funded our operations principally through private placements of our capital stock, issuance of debt and cash flows generated from our operations and to a lesser extent from the proceeds received from the exercise of options. We have received an aggregate of $53.7 million in net cash proceeds from the sale of our preferred stock.
In September 2013, we entered into a loan and security agreement with Rogers Communications Inc., or Rogers, to borrow $15.0 million. This facility is secured by substantially all of our assets. The security interest granted under this loan is fully subordinated to the security interest granted under our credit facility with Silicon Valley Bank, or SVB. A portion of the proceeds of this loan was used to repay in full our outstanding obligations under our 2011 term loan with SVB. This obligation has a fixed interest rate of 5.0%, which is payable monthly. Interest expense of $0.2 million related to this indebtedness was recorded in the year ending December 31, 2013. The principal and all accrued and unpaid interest under this agreement is payable at maturity, which will be September 9, 2017. We intend to use a portion of the net proceeds from this offering to repay $ million of indebtedness outstanding under our loan and security agreement with Rogers. See “Use of Proceeds.”
In December 2013, we amended and restated our existing loan and security agreement with SVB to provide for a $10.0 million term loan facility, as well as a $2.0 million revolving credit facility. As of December 31, 2013, we had approximately $3.0 million of aggregate outstanding borrowings under the term loan facility. A portion of the proceeds of our term loan facility were used to repay in full our outstanding obligations under our 2010 term loan with SVB. In March 2014, we utilized a portion of this term loan facility to repay in full the cash portion of the earn-out consideration due in connection with our acquisition of Lighthouse Practice Management, as described further in “—Contractual Obligations” below. As of March 31, 2014, we had $4.0 million of available borrowings under the term loan facility. The repayment period of our term loan facility will commence on January 2, 2015, with 30 equal monthly payments and bears interest at a per annum floating rate equal to 0.75% plus the prime rate then in effect. From January 1, 2014 to December 31, 2014, we are required to pay
67
Table of Contents
only interest on a monthly basis. Under the revolving credit facility, we may incur aggregate borrowings up to the lesser of $2.0 million and 80% of eligible accounts receivable. Any outstanding principal amount under the revolving credit facility and any accrued and unpaid interest must be paid at maturity in December 2015. Borrowings under our revolving credit facility accrue interest on a monthly basis at a per annum floating rate equal to 0.25% plus the prime rate then in effect. As of March 31, 2014, we had no outstanding borrowings and up to $2.0 million of available borrowing capacity under our revolving credit facility. Our SVB credit facility is secured by substantially all of our assets. We intend to use a portion of the net proceeds from this offering to repay $ of the outstanding indebtedness under the term loan facility. See “Use of Proceeds.”
Historical Cash Flows
The following table sets forth our consolidated cash flows for the periods indicated:
| Year Ended December 31, | Three Months Ended March 31, |
|||||||||||||||||||
| 2011 | 2012 | 2013 | 2013 | 2014 | ||||||||||||||||
| (in thousands) |
||||||||||||||||||||
| (unaudited) | ||||||||||||||||||||
| Net cash provided by (used in) operating activities |
$ | 6,503 | $ | 5,056 | $ | 4,129 | $ | 708 | $ | (1,624 | ) | |||||||||
| Net cash used in investing activities |
(19,192 | ) | (4,770 | ) | (8,958 | ) | (5,398 | ) | (1,278 | ) | ||||||||||
| Net cash provided by (used in) financing activities |
18,690 | (5,727 | ) | 8,008 | 4,166 | 831 | ||||||||||||||
Operating Activities
Net cash provided by operating activities decreased from the first three months of 2013 compared to the first three months of 2014.
For the three months ended March 31, 2014, operating activities used $1.6 million in cash, as compared to $0.7 million provided in cash for the three months ended March 31, 2013. Net cash used in operating activities in the three months ended March 31, 2014 was a result of a net loss of $5.9 million and $1.8 million of cash used as a result of changes in operating assets and liabilities (net of effect of business combinations), partially offset by $6.1 million in adjustments for non-cash items. Non-cash items included stock-based compensation expense, depreciation and amortization expense, preferred stock warrant liabilities mark-to-market loss (gain), compensation expense in connection with the acquisition of Lighthouse Practice Management, and deferred taxes. The net change in operating assets and liabilities (net of effect of business combinations) was primarily the result of a $1.4 million decrease in accounts payable and accrued expenses and a $0.4 million increase in accounts receivable due to quarter end timing of payments as well as a $0.8 million increase in prepaid expenses due to software licensing fees and insurance prepayments, partially offset by a $1.2 million increase in deferred revenue driven by an increase in prepaid franchise contracts, media budgets, and setup fees.
For the three months ended March 31, 2013, operating activities provided $0.7 million in cash as a result of net income of $2.2 million and $0.8 million of cash provided by changes in operating assets and liabilities (net of effect of business combinations), partially offset by $2.2 million in adjustments for non-cash items. The net change in operating assets and liabilities (net of effect of business combinations) was primarily the result of a $0.6 million increase in accounts payable and accrued expenses due to normal fluctuations in the timing of trade payables and a $0.7 million increase in deferred revenues due to an increase in media budgets, partially offset by a $0.5 million increase in current assets.
For the year ended December 31, 2013, operating activities provided $4.1 million in cash, as compared to $5.1 million in cash for the year ended December 31, 2012. Net cash provided by operating activities in the year ended December 31, 2013 was a result of $2.8 million of cash provided by changes in operating assets and liabilities (net of effect of business combinations) and $11.8 million in adjustments for non-cash items, partially offset by a net loss of $10.4 million. Non-cash items included stock-based compensation expense, depreciation and
68
Table of Contents
amortization expense, bad debt expense, accretion/amortization of warrant liabilities, debt discounts, deferred financing fees, loss on disposal of property and equipment, accrued interest on debt, deferred taxes, deferred rent and lease abandonment, and loss on early extinguishment of debt. The net change in operating assets and liabilities (net of effect of business combinations) was primarily the result of a $3.0 million increase in accounts payable and accrued expenses due to our increase in revenue generating activities and an increase in our headcount.
For the year ended December 31, 2012, operating activities provided $5.1 million in cash, as compared to $6.5 million in cash for the year ended December 31, 2011. Net cash provided by operating activities in the year ended December 31, 2012 was a result of $1.2 million of cash provided by changes in operating assets and liabilities (net of effect of business combinations) and $9.3 million in adjustments for non-cash items, partially offset by a net loss of $5.4 million. The net change in operating assets and liabilities (net of effect of business combinations) was primarily the result of a $5.7 million increase in accounts payable driven by increased revenue generating activities and accrued expenses, partially offset by a $2.2 million increase in accounts receivable due to year end timing of credit card receipts, and increased sales to resellers.
For the year ended December 31, 2011, operating activities provided $6.5 million in cash as a result of $11.8 million of cash provided by changes in operating assets and liabilities (net of effect of business combinations) and $10.1 million in adjustments for non-cash items, partially offset by a net loss of $15.4 million. The net change in operating assets and liabilities (net of effect of business combinations) was primarily the result of a $13.7 million increase in deferred revenue driven by a $10.0 million licensing fee paid by one of our resellers.
Investing Activities
Our investing activities have consisted primarily of business combinations and the purchases of property and equipment. We have invested in property and equipment to support our headcount growth.
For the three months ended March 31, 2014, our net cash used in investing activities consisted of $0.6 million used in the purchase of property and equipment, $0.2 million used in the capitalization of technology development costs and $0.5 million used in the acquisition of capitalized software. For the three months ended March 31, 2014, net cash used in investing activities was $4.1 million lower than in the three months ended March 31, 2013 because of the cash flows associated with our acquisition of Lighthouse Practice Management in February 2013.
For the three months ended March 31, 2013, our net cash used in investing activities consisted of $5.0 million paid as part of the acquisition of Lighthouse Practice Management (net of cash acquired), $0.4 million used in the purchase of property and equipment and $0.2 million used in the capitalization of technology development costs, partially offset by a $0.1 million reduction in restricted cash as a result of the expiration of a letter of credit associated with one of our real estate leases.
For the year ended December 31, 2013, our net cash used in investing activities consisted of $3.3 million used in the purchase of property and equipment, $0.8 million used in the capitalization of technology development costs and $5.0 million paid as part of the acquisition of Lighthouse Practice Management (net of cash acquired), partially offset by a $0.1 million reduction in restricted cash as a result of the expiration of a letter of credit. Net cash used in investing activities was $4.2 million higher than in the year ended December 31, 2012, primarily because of our acquisition of Lighthouse Practice Management in 2013.
For the year ended December 31, 2012, our net cash used by investing activities consisted of $2.9 million used in the purchase of property and equipment, $0.4 million used in the capitalization of technology development costs and a $1.5 million increase in restricted cash to collateralize a letter of credit issued in connection with our Austin lease. Net cash used in investing activities was $14.4 million lower than in the year ended December 31, 2011, primarily because of the effect of our acquisition of ProfitFuel in 2011.
69
Table of Contents
For the year ended December 31, 2011, our net cash used in investing activities consisted of $1.2 million used in the purchase of property and equipment, $0.7 million used in the capitalization of technology development costs and $17.3 million paid as part of the business combination with ProfitFuel (net of cash acquired).
Financing Activities
Our financing activities have primarily consisted of proceeds from the issuance of convertible preferred stock and proceeds from the exercise of stock options, as well as borrowings and repayments of debt facilities.
For the three months ended March 31, 2014, our net cash provided by financing activities was $0.8 million resulting from $3.0 million in borrowings under our loan and security agreement with SVB and $0.5 million as a result of net proceeds from the issuance of convertible preferred stock and the issuance of common stock in connection with option exercises, partially offset by $2.7 million used in the payment of contingent consideration related to the acquisition of Lighthouse Practice Management.
For the three months ended March 31, 2013, our net cash provided by financing activities was $4.2 million resulting from $5.1 million as a result of net proceeds from the issuance of convertible preferred stock and the issuance of common stock in connection with option exercises, partially offset by $0.9 million in repayments, net of borrowings, related to our loan and security agreement with SVB.
For the year ended December 31, 2013, our net cash provided by financing activities was $8.0 million resulting from $1.7 million in borrowings, net of repayments, under our loan and security agreements with SVB and Rogers and $6.3 million as a result of net proceeds from the issuance of convertible preferred stock and the issuance of common stock in connection with option exercises.
For the year ended December 31, 2012, our net cash used in financing activities was $5.7 million resulting from $6.0 million in repayments, net of borrowings, primarily due to $7.5 million used to pay the deferred payment obligation incurred in connection with the ProfitFuel acquisition, partially offset by $0.3 million as a result of net proceeds from the issuance of common stock in connection with option exercises.
For the year ended December 31, 2011, our net cash provided by financing activities was $18.7 million primarily attributable to $18.4 million in borrowings, net of repayments, under our convertible promissory notes issued in connection with our bridge financing for the ProfitFuel acquisition and our loan and security agreement with SVB, as well as $0.3 million as a result of net proceeds from the issuance of common stock in connection with option exercises.
Contractual Obligations
The following table discloses aggregate information about material contractual obligations and periods in which payments were due as of December 31, 2013. Future events could cause actual payments to differ from these estimates.
| Less than 1 Year |
1 to 3 Years |
3 to 5 Years |
More than 5 Years |
Total | ||||||||||||||||
| (in thousands) | ||||||||||||||||||||
| Long-term debt obligations(1) |
$ | 5,460 | $ | 8,555 | $ | 15,594 | — | $ | 29,609 | |||||||||||
| Operating leases |
5,016 | 6,575 | 4,184 | 7,485 | 23,261 | |||||||||||||||
|
|
|
|
|
|
|
|
|
|
|
|||||||||||
| Total |
$ | 10,476 | $ | 15,130 | $ | 19,778 | $ | 7,485 | $ | 52,870 | ||||||||||
|
|
|
|
|
|
|
|
|
|
|
|||||||||||
| (1) | We intend to use a portion of the net proceeds from this offering to repay $ million of our long-term debt outstanding as of December 31, 2013. See “Use of Proceeds.” |
70
Table of Contents
The commitment amounts in the table above are associated with contracts that are enforceable and legally binding and that specify all significant terms, including fixed or minimum services to be used, fixed, minimum or variable price provisions, and the approximate timing of the actions under the contracts. The table does not include obligations under agreements that we can cancel without a significant penalty. For a description of our financing arrangements, see “—Sources of Liquidity” above.
Long-Term Debt Obligations
Our long-term debt obligations set forth in the table above include our outstanding indebtedness to Rogers and SVB, as well as the following:
In connection with our acquisition of Lighthouse Practice Management in 2013, we incurred a deferred payment obligation of $6.2 million. This deferred payment obligation accrues interest at a rate equal to 8% per annum and will become due and payable upon the earlier of February 28, 2015 (subject to a subordination agreement with SVB) and the closing of this offering. We intend to use a portion of the net proceeds from this offering to repay this obligation in full. In connection with this acquisition, we also agreed to earn-out consideration of up to $5.0 million, based on achievement of revenue targets for the period of March 1, 2013 through February 28, 2014. On September 26, 2013, we deemed the earn-out consideration to be fully earned. The earn-out consideration, consisting of $3.0 million in cash and $2.0 million in our Series E preferred stock valued at $2.30 per share, was paid in March 2014. Upon issuance in March 2014, the Series E preferred stock had a fair value of $3.16 per share. Our long-term debt obligations exclude the portion of the earn-out consideration payable in our Series E preferred stock.
On November 18, 2011, we repurchased 3,000,000 shares of our common stock from one of our founders and issued a subordinated promissory note in the principal amount of approximately $2.5 million as payment in full for such repurchased shares. The promissory note accrues interest at a rate of 3.3% per annum and matures upon the earlier to occur of June 21, 2014 (subject to a subordination agreement with SVB) and the consummation of this offering.
On June 18, 2014, we borrowed an additional $3.0 million under our term loan facility with SVB. The proceeds of this term loan were used on June 20, 2014 to repay in full our outstanding obligations under the subordinated promissory note issued to one of our founders, as described above.
Off-Balance Sheet Arrangements
We do not have any relationships with unconsolidated entities or financial partnerships, including entities sometimes referred to as structured finance or special purpose entities that were established for the purpose of facilitating off-balance sheet arrangements or other contractually narrow or limited purposes. We do not engage in off-balance sheet financing arrangements. In addition, we do not engage in trading activities involving non-exchange traded contracts. We therefore believe that we are not materially exposed to any financing, liquidity, market or credit risk that could arise if we had engaged in these relationships.
Critical Accounting Policies
Our consolidated financial statements are prepared in accordance with GAAP. The preparation of our consolidated financial statements requires us to make estimates, assumptions and judgments that affect the reported amounts of assets, liabilities, revenue, costs and expenses. We base our estimates and assumptions on historical experience and other factors that we believe to be reasonable under the circumstances. We evaluate our estimates and assumptions on an ongoing basis. Our actual results may differ from these estimates. We believe our estimates, assumptions and judgments associated with revenue recognition, business combinations, goodwill and acquired intangible assets and stock-based compensation have the greatest potential impact on our consolidated financial statements. Therefore, we consider these to be our most critical accounting policies and have summarized them below. See note 2 to our consolidated financial statements included in this prospectus for a description of our other significant accounting policies.
71
Table of Contents
Revenue Recognition
We recognize revenue when (1) there is persuasive evidence of an agreement or arrangement, (2) services have been rendered, (3) the price to the buyer is fixed or determinable and (4) collectability is reasonably assured.
We apply ASC 605-25, Revenue Recognition—Multiple-Element Arrangements, to account for such arrangements. When an arrangement involves multiple elements and it is determined that the elements should be accounted for as separate units of accounting under ASC 605-25, the entire fee from the arrangement is allocated to each respective element based on its relative fair value and recognized when the revenue recognition criteria for each element are met. For all offerings provided, we determine the selling price using either vendor specific objective evidence (VSOE) or, if VSOE is not available, best estimated selling price, as there is no reliable third-party evidence available. The significant factors, inputs and assumptions included in our determination are: actual selling prices, established price lists and other company-specific considerations. We regularly review the factors, inputs and assumptions that we use to determine VSOE and estimated selling price. Changes in these factors, inputs and assumptions or changes to elements in the arrangements could cause a material increase or decrease in the amount of revenue we report in a particular period.
Our primary sources of revenue are from Yodle Ads, our media offering, and sales of our platform offerings, which have historically included our Lighthouse, Yodle Organic and Yodle Web products, and now also includes Marketing Essentials and Centermark as a result of their recent introduction. We charge a recurring monthly fee for our platform products, which is recognized over the relevant month of service. For Yodle Ads, if a customer’s entire media budget is not used during the relevant period, the outstanding amount remains recorded as deferred revenue and is recognized when used. We are the principal in these transactions because we are the primary obligor, perform a significant portion of the services, set the pricing, retain credit risk and have discretion in the supplier selection. As a result, we recognize this revenue on a gross basis. We also derive revenue from set up and web design fees which are recognized over the expected customer life.
We also sell our products through resellers. We earn a per customer fee for our resellers’ sales of our platform products. We also collect a share of the revenue our resellers generate from sales of Yodle Ads. We recognize this revenue in the period we deliver our products to our resellers. Additionally, certain of our resellers have a minimum fee structure with us, regardless of the volume of their sales. Historically, our resellers have exceeded the minimum guaranteed fee. We are not the principal in these transactions because we are not the primary obligor and do not retain credit risk. As a result, we recognize this revenue on a net basis.
We have entered into a licensing agreement with a reseller who paid a $10.0 million licensing fee, which is being recognized ratably over the estimated life of this relationship, estimated to be the term of the contract, which currently ends December 31, 2018. In addition to this licensing fee, we may earn milestone payments if certain revenue targets are met by this reseller. These milestone payments, if earned, would be recognized ratably over the estimated life of this reseller relationship with a cumulative catch up recognized for the elapsed portion of such estimated life. In 2012 and 2013, we attained the first and second milestones, respectively; one additional milestone remains unearned. We also earn per customer fee revenues from this reseller on sales of our products, as well as revenues from assisting this reseller in executing its operations.
Business Combinations
When we acquire businesses, we allocate the purchase price to tangible assets and liabilities and identifiable intangible assets acquired. Any residual purchase price is recorded as goodwill. The allocation of the purchase price requires management to make significant estimates in determining the fair values of assets acquired and liabilities assumed, especially with respect to intangible assets. These estimates are based on information obtained from management of the acquired companies and historical experience. These estimates can include, but are not limited to, the cash flows that an asset is expected to generate in the future. These estimates are inherently uncertain and unpredictable and, if different estimates were used, the purchase price for the acquisition could be allocated to the
72
Table of Contents
acquired assets and liabilities differently from the allocation that we have made. Furthermore, a change in the estimated fair value of an asset or liability often has a direct impact on the amount we recognize as goodwill, an asset that is not amortized. In addition, unanticipated events and circumstances may occur which may affect the accuracy or validity of such estimates and, if such events occur, we may be required to record a charge against the value ascribed to an acquired asset or an increase in the amounts recorded for assumed liabilities.
Impairment of Goodwill and Acquired Intangible Assets
We test goodwill for impairment at least annually as of October 1, or more frequently if events or changes in circumstances indicate that this asset may be impaired. The analysis is done at the reporting unit level, and we have determined that we have one reporting unit. This is consistent with our one operating segment value for all years presented (see note 14 to our unaudited interim condensed consolidated financial statements and note 19 to our audited consolidated financial statements). Therefore, we use our enterprise value as our fair value.
Impairment testing for goodwill is performed utilizing either a qualitative assessment or a two-step process. If we decide that it is appropriate to perform a qualitative assessment, management first assesses qualitative factors to determine whether it is more likely than not that the fair value of the reporting unit is less than its carrying amount. If we conclude that the fair value of the reporting unit more likely than not exceeds its carrying value, no further evaluation is necessary. If we conclude that it is not more likely than not that the fair value exceeds its carrying value, management is required to perform the two-step process. If management performs the two-step process, then we estimate the fair value of the reporting unit and compare that to the carrying value of the reporting unit. If the fair value of the reporting unit exceeds its carrying value, the goodwill is not considered impaired and no further evaluation is necessary. If the carrying value is higher than the estimated fair value, there is an indication that impairment may exist and the second step is required. In the second step, the implied fair value of goodwill is calculated as the excess of the fair value of the reporting unit over the fair values assigned to its assets and liabilities. If the implied fair value of goodwill is less than the carrying value of the reporting unit’s goodwill, the difference is recognized as an impairment charge.
Under the qualitative assessment, we consider a variety of qualitative factors, including general economic conditions, industry and market specific conditions, customer behavior, cost factors, our financial performance and trends, our strategies and business plans, capital requirements, management and personnel issues and stock price, among others. Under the two step process, we estimate the fair value based on a number of factors, including: (1) appropriate consideration of valuation approaches (income approach, comparable public company approach, and comparable transaction approach), (2) estimates of future growth rates, (3) estimates of our future cost structure, (4) discount rates for our estimated cash flows, (5) selection of peer group companies for the public company and the market transaction approaches, (6) required levels of working capital, (7) assumed terminal value and (8) time horizon of cash flow forecasts. Changes in these estimates and assumptions could materially affect the determination of fair value of the one reporting unit and cause an impairment of the recorded goodwill.
The determination of reporting units also requires judgment. We assess whether a reporting unit exists within a reportable segment by identifying the unit, determining whether the unit qualifies as a business under GAAP, and assessing the availability and regular review by segment management of discrete financial information for the unit. Our chief operating decision maker does not review discrete financial information below the consolidated results except for revenues, which are reviewed by media and platform. The review of revenues (and not complete operating results) is not considered to be discrete financial information and we have therefore concluded that we have one reporting unit.
We review acquired intangible assets that have finite useful lives when an event occurs indicating the potential for impairment. If any indicators are present, we perform a recoverability test by comparing the sum of the estimated undiscounted future cash flows attributable to the acquired intangibles in question to their carrying amounts. If the undiscounted cash flows used in the tests for recoverability are less than the carrying amount of
73
Table of Contents
the acquired intangibles, then we determine the fair value of the acquired intangibles and recognizes an impairment loss if the carrying amount of the acquired intangibles exceeds its fair value. The impairment loss recognized is the amount by which the carrying amount of the acquired intangibles exceeds its fair value.
For all of our goodwill and acquired intangible asset impairment reviews, the assumptions and estimates used in the process are complex and often subjective. They can be affected by a variety of factors, including external factors such as industry and economic trends, and internal factors such as changes in our business strategy or our internal forecasts. Although we believe the assumptions, judgments, and estimates we have used in our assessments are reasonable and appropriate, a material change in any of our assumptions or external factors could lead to future goodwill or acquired intangible asset impairment charges. Based upon our October 1, 2013 goodwill impairment review, we concluded that the estimated fair value of our reporting unit significantly exceeded its carrying value.
We did not record any impairments of goodwill for the years ended December 31, 2011, 2012 or 2013.
Stock-Based Compensation
We account for stock-based compensation awards issued to our employees and directors in accordance with authoritative guidance on stock compensation. We measure stock-based compensation expense at the grant date based on the estimated fair value of the award and recognize compensation expense, net of estimated forfeitures, on a straight-line basis over the requisite service period, which is generally the vesting period of the respective award.
Determining the fair value of stock-based awards at the grant date requires judgment. We use the Black-Scholes-Merton option-pricing model to estimate the fair value of stock option awards. The determination of the grant date fair value of options using an option-pricing model is affected by our estimated common stock fair value as well as assumptions regarding a number of other complex and subjective variables.
The Black-Scholes-Merton option-pricing model requires the use of highly subjective and complex assumptions, which determine the fair value of stock-based awards. Our assumptions are as follows:
| • | Fair Value of Our Common Stock. Because our common stock is not publicly traded, we must estimate the fair value of our common stock, as discussed under “—Common Stock Valuations” below. |
| • | Expected Term. The expected term represents the period that the stock-based awards are expected to be outstanding and is determined using the simplified method which is based on the average of the time-to-vesting and the contractual life of the options. |
| • | Expected Volatility. The expected volatility is derived from the historical stock volatilities of comparable publicly listed peers over a period approximately equal to the expected term of the awards because we have limited information on the volatility of our common stock since we have no trading history. When selecting the peers to be used in the volatility calculation, we considered the size, operational and economic similarities to our principal business operation. |
| • | Risk Free Interest Rate. The risk free interest rate is based on the U.S. Treasury yield curve in effect at the time of grant for zero-coupon U.S. Treasury notes with maturities equal to the option’s expected term. |
| • | Expected Dividend Yield. The expected dividend yield was assumed to be zero as we have not paid and do not anticipate paying dividends. |
In addition to the assumptions used in the Black-Scholes-Merton option-pricing model, we also estimate a forfeiture rate to calculate the stock-based compensation for our equity awards. We will continue to use judgment in evaluating the expected volatility, expected term and forfeiture rate utilized for our stock-based compensation calculations on a prospective basis. If any of the assumptions used in the Black-Scholes-Merton model changes significantly, stock-based compensation for future awards may differ materially compared with the awards granted previously.
74
Table of Contents
We recorded stock-based compensation expense of $1.8 million, $2.9 million, $2.6 million and $0.7 million in 2011, 2012, 2013 and the three months ended March 31, 2014, respectively. We expect to continue to grant stock options and other equity-based awards in the future, and to the extent that we do, our stock-based compensation expense recognized in future periods will likely increase.
As of March 31, 2014, we had approximately $5.1 million of total unrecognized compensation expense, net of related forfeiture estimates, which we expect to recognize over a weighted-average period of 3.61 years.
The following table presents the assumptions used to estimate the fair value of options granted during the periods presented:
| Year-Ended December 31, | Three Months Ended March 31, |
|||||||||||||||
| 2011 | 2012 | 2013 | 2014 | |||||||||||||
| Risk-free interest rate (%) |
1.05 - 2.40 | 0.88 -1.24 | 1.02 - 2.02 | 1.78 - 1.84 | ||||||||||||
| Expected term (in years) |
5.50 - 6.20 | 5.80 -6.30 | 5.55 - 6.32 | 6.03 - 6.08 | ||||||||||||
| Expected dividend yield (%) |
— | — | — | — | ||||||||||||
| Expected volatility (%) |
53.68 - 64.90 | 52.31 - 53.84 | 52.34 - 56.71 | 56.86 - 56.89 | ||||||||||||
Common Stock Valuations
The fair value of the common stock underlying our stock options was determined by our board of directors, which intended all options granted to be exercisable at a price per share not less than the per share fair value of our common stock underlying those options on the date of grant. The valuations of our common stock were determined in accordance with the guidelines outlined in the American Institute of Certified Public Accountants Practice Aid, Valuation of Privately-Held-Company Equity Securities Issued as Compensation. The assumptions we used in the valuation model are based on future expectations combined with management judgment. In the absence of a public trading market, our board of directors, with input from management, exercised significant judgment and considered numerous objective and subjective factors to determine the fair value of our common stock as of the date of each option grant, including the following factors:
| • | contemporaneous valuations performed by an independent third-party valuation firm as of February 28, 2013, June 30, 2013, September 30, 2013, December 31, 2013 and March 31, 2014; |
| • | the prices, rights, preferences and privileges of our convertible preferred stock relative to those of our common stock; |
| • | secondary sales of our common stock; |
| • | our operating and financial performance; |
| • | our business plans and financial forecasts; |
| • | the market performance of publicly traded companies in the same or similar industry; |
| • | the likelihood of achieving an exit event, such as an initial public offering or a strategic merger or acquisition of the company; |
| • | general U.S. market conditions; and |
| • | the illiquidity of the common stock underlying stock options. |
75
Table of Contents
The following table summarizes information for all stock awards since January 1, 2013:
| Grant Date |
Shares Underlying Options |
Exercise Price Per Share |
Estimated Common Stock Fair Value Per Share at Grant Date |
Option Fair Value Per Share at Grant Date |
||||||||||||
| May 14, 2013 |
2,708,500 | $ | 1.64 | $ | 1.64 | $ | 0.82 | |||||||||
| July 27, 2013 |
113,000 | $ | 1.64 | $ | 1.64 | $ | 0.84 | |||||||||
| August 30, 2013 |
400,000 | $ | 1.75 | $ | 1.75 | $ | 0.96 | |||||||||
| September 16, 2013 |
215,000 | $ | 1.75 | $ | 1.75 | $ | 0.94 | |||||||||
| October 4, 2013 |
78,000 | $ | 1.75 | $ | 1.75 | $ | 0.94 | |||||||||
| October 8, 2013 |
2,846,850 | $ | 1.75 | $ | 1.75 | $ | 0.95 | |||||||||
| November 14, 2013 |
180,000 | $ | 1.75 | $ | 1.75 | $ | 0.94 | |||||||||
| December 11, 2013 |
45,000 | $ | 2.01 | $ | 2.01 | $ | 1.05 | |||||||||
| December 16, 2013 |
44,000 | $ | 2.01 | $ | 2.01 | $ | 1.08 | |||||||||
| February 4, 2014 |
415,000 | $ | 2.01 | $ | 2.25 | $ | 1.29 | |||||||||
| February 5, 2014 |
997,000 | $ | 2.01 | $ | 2.25 | $ | 1.29 | |||||||||
| May 28, 2014 |
440,000 | $ | 2.96 | $ |
2.96 |
|
$ | 1.86 | ||||||||
| May 29, 2014 | 851,600 | $ | 2.96 | $ | 2.96 | $ | 1.85 | |||||||||
| May 30, 2014 | 3,580,000 | $ | 2.96 | $ | 2.96 | $ | 1.87 | |||||||||
In determining the estimated fair value of our common stock underlying our option grants, our board of directors, with the assistance of management and a third-party valuation firm, used various methods to estimate the enterprise value of our company including: (1) the probability weighted expected return method, or PWERM, (2) the company transaction method, (3) the multi-period discounting method and (4) the discounted cash flow method.
The PWERM is a scenario-based analysis that estimates the value per share based on the probability-weighted present value of expected future investment returns, considering each of the possible outcomes available to us, as well as the rights of each share class. PWERM estimates the common stock value to our stockholders under possible future scenarios. The value per share under each scenario is then probability weighted and the resulting weighted values per share are summed to determine the fair value per share of our common stock. Over time, as we achieve certain company-related milestones, the probability of each scenario is evaluated and adjusted accordingly.
The company transaction method seeks valuation guidance from actual transactions in the market. This methodology utilizes the most recent negotiated arm’s-length transactions involving the sale or transfer of our stock or equity interests.
The multi-period discounting approach values the business based on the future benefits that will accrue to it, with the value of future benefits discounted back to a present value at a discount rate equal to the company’s cost of capital.
76
Table of Contents
The discounted cash flow method is based on the premise that our enterprise value as of the respective valuation date is equal to the projected future free cash flows and expected terminal value of our business, discounted by a required rate of return that investors would demand given the risks of ownership and the risks associated with achieving the stream of projected future free cash flows. The following table outlines the enterprise value methodologies we utilized on the relevant valuation dates:
| Valuation Date |
Enterprise Value Method | |
|
February 28, 2013 |
PWERM and Company Transaction | |
|
June 30, 2013 |
PWERM and Multi-period Discounting | |
|
September 30, 2013 |
PWERM, Discounted Cash Flow and Company Transaction | |
| December 31, 2013 |
PWERM, Discounted Cash Flow and Company Transaction | |
| March 31, 2014 |
PWERM and Company Transaction |
In determining the estimated fair value of our common stock, our board of directors also considered the fact that our common stock is not freely tradable in the public market. The estimated fair value of our common stock at each grant date reflects a discount for lack of marketability partially based on the anticipated likelihood and timing of a future liquidity event. The increase in equity value of the company from the February 28, 2013 valuation to the June 30, 2013 valuation reflects the decrease in the estimated time to liquidity. The increase in the equity value of the company from the June 30, 2013 valuation to the September 30, 2013 valuation was primarily due to our continued performance to plan and the increased likelihood of an initial public offering transaction. The increase in equity value of the company from the September 30, 2013 valuation to the December 31, 2013 valuation and from the December 31, 2013 valuation to the March 31, 2014 valuation, was in each case primarily due to our continued progress toward a potential initial public offering transaction. Following the closing of this offering, the fair value of our common stock will be determined based on the closing price of our common stock on the . The difference between the estimated common stock fair value and exercise price per share on the February 2014 option grants is captured within the option fair value per share and has been recognized as a component of compensation expense.
Based upon an assumed initial public offering price of $ per share, the midpoint of the price range set forth on the cover of this prospectus, the intrinsic value of all outstanding options as of March 31, 2014 was $ million of which approximately $ million related to vested options and approximately $ million related to unvested options.
Qualitative and Quantitative Disclosures about Market Risk
Market risk represents the risk of loss that may impact our financial position due to adverse changes in financial market prices and rates. Our market risk exposure is primarily the result of fluctuations in interest rates, as well as, to a lesser extent, foreign exchange rates and inflation.
Interest Rate Risk
We are exposed to market risks in the ordinary course of our business. We are subject to interest rate risk in connection with potential borrowings available under our loan and security agreement with SVB. Borrowings under the revolving portion of our SVB facility bear interest at a floating rate equal to 0.25% plus the prime rate, and borrowings under the term loan portion of our SVB facility bear interest at a floating rate equal to 0.75% plus the prime rate. As of December 31, 2013, the interest rates applicable to the revolving and term loan portions of our SVB facility were 3.5% and 4.0%, respectively. Increases in the prime rate would increase the amount of interest payable on any borrowings outstanding under our SVB facility. Through the date of this prospectus, there are no outstanding borrowings under the revolving portion of our SVB facility. As of December 31, 2013, an increase or decrease in the interest rate on the term loan portion of our SVB facility by 100 basis points would increase or decrease our interest expense by $30,000, respectively.
77
Table of Contents
Foreign Currency Exchange Risk
Substantially all of our revenues and operating expenses are denominated in U.S. dollars. As a result, we do not believe that our exposure to foreign currency exchange risk is material to our business, financial condition or results of operations. In 2013, approximately 1.0% of our revenues were exposed to fluctuations in the exchange rate with respect to the Canadian dollar. If a significant portion of our revenues and operating expenses were to become denominated in currencies other than U.S. dollars, we may not be able to effectively manage this risk, and our business, financial condition and results of operations could be adversely affected.
Inflation Risk
We do not believe that inflation has had a material effect on our business, financial condition or results of operations. If our costs were to become subject to significant inflationary pressures, we may not be able to fully offset such higher costs through price increases. Our inability or failure to do so could harm our business, financial condition and results of operations.
Recently Issued Accounting Guidance
In 2012, the Financial Accounting Standards Board, or FASB, issued Accounting Standards Update, or ASU, No. 2012-02, which provides guidance and amendments related to testing indefinite-lived intangible assets for impairment. Under the amendments in this update, an entity has the option to first assess qualitative factors to determine whether the existence of events or circumstances indicates that it is more likely than not that the indefinite-lived intangible asset is impaired. If, after assessing the totality of events and circumstances, an entity concludes that it is not more likely than not that the indefinite-lived intangible asset is impaired, then the entity is not required to determine the fair value. However, if an entity concludes otherwise, then it is required to determine the fair value of the indefinite-lived intangible asset and perform the quantitative impairment test. An entity also has the option to bypass the qualitative assessment for any indefinite-lived intangible asset in any period and proceed directly to performing the quantitative impairment test. We adopted this standard on January 1, 2013, and the adoption did not have a material impact on our consolidated financial statements.
In July 2013, FASB issued ASU No. 2013-11, which requires entities to present an unrecognized tax benefit, or a portion of an unrecognized tax benefit, as a reduction to a deferred tax asset for a net operating loss carryforward, a similar tax loss, or a tax credit carryforward when settlement in this manner is available under the tax law. This ASU was effective for us beginning January 1, 2014. We are evaluating the potential impact of this adoption on our consolidated financial statements.
In May 2014, FASB issued ASU No. 2014-09, which supersedes the revenue recognition requirements in ASC 605. This guidance is based on the principle that revenue is recognized to depict the transfer of goods or services to customers in an amount that reflects the consideration to which the entity expects to be entitled in exchange for those goods or services. The guidance also requires additional disclosure about the nature, amount, timing and uncertainty of revenue and cash flows arising from customer contracts, including significant judgments and changes in judgments and assets recognized from costs incurred to obtain or fulfill a contract. This ASU is effective for us for reporting periods beginning after December 15, 2016. We are evaluating the potential impact of this adoption on our consolidated financial statements.
Emerging Growth Company Status
Section 107 of the Jumpstart Our Business Startups Act of 2012, or the JOBS Act, provides that an “emerging growth company” can take advantage of the extended transition period provided in Section 7(a)(2)(B) of the Securities Act for complying with new or revised accounting standards. In other words, an “emerging growth company” can delay the adoption of certain accounting standards until those standards would otherwise apply to private companies. However, we are choosing to “opt out” of such extended transition period, and as a result, we will comply with new or revised accounting standards on the relevant dates on which adoption of such standards is required for non-emerging growth companies. Section 107 of the JOBS Act provides that our decision to opt out of the extended transition period for complying with new or revised accounting standards is irrevocable.
78
Table of Contents
Overview
Yodle is a leading provider of cloud-based marketing automation solutions for local businesses that makes digital marketing easy, affordable and transparent. Our platform provides our customers with an online, mobile and social presence, as well as automates, manages and optimizes their marketing activities and other consumer interactions. We utilize our proprietary data assets and algorithms to increase the likelihood that consumers will find our customers and become their paying consumers. Our platform provides our customers with transparency into their marketing activities and business operations, thereby enabling them to evaluate their return on investment, or ROI. Our solutions are highly integrated and designed to be easy-to-use, helping local businesses navigate the rapidly evolving, technologically challenging and highly fragmented digital marketing landscape without having to invest a significant amount of time and money or needing any in-house marketing or IT expertise.
Consumers are increasingly changing the way they discover and interact with local businesses, shifting away from traditional media such as yellow pages directories, newspapers, radio and television, and interactions in person and over the telephone, to various digital resources, including desktop and mobile search, online directories, review sites, email and other mobile applications. As a result, businesses are challenged to navigate and manage an increasingly complex marketing landscape. Businesses need a comprehensive digital presence that includes a professional quality website that is easily discoverable and optimized for mobile devices, exposure on leading online directories and ratings and reviews sites, and tools to communicate with customers via email, text messages and social media. Large enterprises address this complexity by using sophisticated third-party software solutions that are expensive and require significant internal expertise to manage. However, local businesses generally lack the resources and expertise to access the benefits of enterprise-level solutions. Instead, they are left to choose from a number of disparate point solutions that only address a limited set of their challenges, are not integrated and require local businesses to pay for and manage multiple vendors.
We have built our company to serve the unique, complex and constantly evolving digital marketing needs of local businesses. We believe the market for our local marketing automation platform is large and underserved. According to the most recent U.S. Census Bureau data, there are more than 28 million local businesses in the United States. We currently target industry verticals with approximately 7 million local businesses, the largest categories of which include legal and professional, dental and medical and contractor and other home services. We served approximately 44,800 local businesses as of March 31, 2014. In addition, AMI-Partners, an independent market research firm, estimates that there are approximately 74 million local businesses globally. While we believe this provides us with further opportunities to grow over the long term, our focus in the near term is growing our business in the United States and Canada.
Over nine years of focusing on the unique and constantly evolving digital marketing needs of local businesses, we have developed a differentiated approach to addressing this large and fragmented market. We use our sophisticated technology, rigorous data collection and analytics and scalable process automation in all key aspects of our business. Our solutions are highly integrated and optimized using our proprietary algorithms and the data assets we have built by tracking billions of consumer interactions. We have also developed highly automated customer onboarding and service processes for all of our products that enable us to rapidly create and launch the digital presence of our customers. We also offer some customization for our brand network customers that enables them to tailor our products for their specific business objectives.
We generate revenues from subscriptions to our platform and sales of our media offering. Our platform revenue is attributable to direct sales of subscriptions to our platform products, which currently include our Marketing Essentials, Centermark and Lighthouse products. Marketing Essentials is our flagship product that includes three modules: presence, conversion optimization and communication automation. Centermark leverages certain core capabilities of Marketing Essentials by providing a standardized source of shared data, communication and reporting to address the needs of national franchisors and other similar businesses. Lighthouse is our business practice automation product, which automates many of our customers’ daily
79
Table of Contents
consumer interactions or office routines. We also derive additional platform revenues from sales of our products sold through resellers. Our media revenue is attributable to direct sales of our Yodle Ads media product, which automates, manages and optimizes our customers’ media spend across mobile and desktop search engines. We refer to our offerings and the packages in which we sell them as products.
Our ability to efficiently acquire local business customers and effectively address their needs by leveraging our technology platform and data assets has enabled us to grow rapidly. We generated revenue of $87.6 million, and $161.9 million, in 2011 and 2013, respectively, representing a compound annual growth rate of 36%. Over this same period, our cost of revenues as a percentage of revenues has decreased from 39% in 2011 to 33% in 2013 while our net loss has decreased from $15.4 million to $10.4 million. For the three months ended March 31, 2014, we had revenues of $45.7 million and net losses of $5.9 million. The number of customers subscribing to our platform offerings increased from approximately 6,000 as of December 31, 2009 to approximately 44,800 as of March 31, 2014.
Our Industry
The way consumers discover and interact with local businesses is changing rapidly
Consumers have historically discovered local businesses though traditional media—such as yellow pages directories, newspapers, radio and television—and interacted with businesses in person and over the telephone. Today, consumers rely on a wide array of digital resources, including desktop and mobile web search, online directories, ratings and reviews sites, email and other mobile applications, to discover, research and engage with local businesses. As a result, consumers increasingly expect local businesses to be readily discoverable and accessible online and to maintain a digital presence that includes:
| • | A professional-quality website that is easily discoverable. In order to attract and engage potential consumers, a local business must have a website that is optimized for discovery and that provides accurate and relevant information about the business and its products or services. Despite this growing expectation, according to a survey we commissioned and conducted by Research Now, as of June 2013, more than half of local businesses in the United States did not have a website. |
| • | Readily accessible information that is easy to use on mobile devices. Consumers are increasingly relying on their mobile devices to inform their decisions about what products and services to buy and where to buy them. According to BIA/Kelsey, a local media research and advisory service company, more than 50% of local search will occur on mobile devices by 2015. However, according to a survey we commissioned and conducted by Research Now, as of June 2013, approximately 90% of local businesses in the United States did not have a website that was optimized for use on mobile devices. |
| • | Online reviews and an active social media presence that inform purchase decisions. According to a survey conducted by the Ipsos Open Thinking Exchange, an independent research company, 78% of U.S. consumers’ purchasing decisions are impacted by online reviews. However, according to a survey we commissioned, conducted by Research Now, as of December 2013, approximately 87% of local business owners in the United States did not ask consumers for online reviews. In addition, according to a survey conducted by Market Force, a customer intelligence company, 78% of U.S. consumers’ purchasing decisions are impacted by the posts made by businesses they follow on social media. We have found that most local businesses do not maintain an active presence on widely-used social media platforms. |
| • | Tools that enable digital interaction with consumers. Consumers increasingly expect to interact with businesses digitally. For example, consumers expect to communicate with businesses through email and to be able to book and manage appointments and reservations electronically through the Internet and via email or text messages on mobile devices. Despite these changes in consumer behavior, most local businesses do not adequately address these demands for digital communications because they lack the requisite resources to do so. |
80
Table of Contents
Creating and managing a digital presence is increasingly complex
As consumers increasingly use online and mobile channels to discover and interact with businesses, and as new technologies and trends emerge, businesses need to keep pace. As their digital presence and activities expand, businesses are faced with the increasingly complicated and time-consuming task of managing information on their own sites, across dozens of online directories and numerous social media platforms, in order to:
| • | keep their content up-to-date and relevant; |
| • | maintain the consistency and accuracy of their business information and content; |
| • | optimize their discoverability in search results from leading search engines; and |
| • | optimize their website for ease of use on mobile devices. |
Additionally, businesses are increasingly seeking to communicate with consumers via email, text messages and social media and allow consumers to book appointments and make reservations electronically.
Local businesses generally lack the resources to create and manage a comprehensive digital presence
Large enterprises address these challenges by using sophisticated third-party software solutions that are expensive and require significant internal expertise to manage. However, local businesses generally lack the resources and expertise to employ enterprise-level software solutions to address their digital marketing needs. Instead, local businesses are left to choose from a number of vendors that have developed a disparate set of point solutions. These point solutions, while more affordable than the enterprise software alternatives, only address a limited set of the challenges faced by local businesses. As a result, we believe that most local business owners are seeking a comprehensive solution that addresses their unique challenges, which include:
| • | Lack of marketing sophistication and technical expertise. Local businesses typically do not have dedicated marketing resources or IT personnel. As a result, many local business owners are often not aware of the tools and technologies that exist in the marketplace and typically lack the expertise to effectively deploy and manage these tools and technologies themselves. Further, the digital landscape is dynamic and rapidly changing, making it even more difficult for local businesses to keep pace with the latest trends and technologies. |
| • | Lack of time. Local business owners typically do not have the time to seek out and assemble multiple point solutions to build, manage and optimize their digital presence, marketing activities and customer interactions. |
| • | Limited budget. Local businesses typically have a limited budget for marketing and technology solutions. They seek to spend these limited resources with partners that can provide them with significant and measurable value at an affordable price. |
| • | Limited visibility into performance. As local businesses embrace digital marketing, they seek clear evidence that their marketing expenditures are effective and validated by a demonstrable ROI. |
Brand networks face additional, unique challenges
Many national franchisors, manufacturers and multi-location businesses operate networks of individually-operated franchises, dealerships and offices that sell products or provide services at a local level. We refer to these businesses as brand networks. We believe that the challenges faced by individual locations within a brand network are very similar to those of independent local businesses. In addition, brand network owners have additional unique challenges that include ensuring that individual network locations have a robust local digital presence that is consistent with their brand identity and facilitating their individual locations to maximize their investments in local marketing solutions in order to increase sales across the network. To accomplish this, a brand network owner requires clear visibility and analytics into the performance of its marketing programs across its network and an ability to enable the individual locations within its network to achieve the brand network owner’s marketing objectives.
81
Table of Contents
Our market opportunity
According to the most recent U.S. Census Bureau data, there are more than 28 million local businesses in the United States. Moreover, AMI-Partners, an independent market research firm, estimates that there are approximately 74 million local businesses worldwide. Local businesses operate in many different industry verticals. We estimate that there are approximately 7 million local businesses in the United States operating in the industry verticals we currently address, the largest categories of which include legal and professional, dental and medical and contractor and other home services.
Local businesses are increasingly purchasing cloud-based technologies and services to operate and grow. According to a report by Parallels, a hosting and cloud services company, small- and medium-sized businesses, or SMBs, in the United States spent $8.5 billion in 2013 on cloud services related to web presence, web applications and business applications, and are expected to spend $15.1 billion in 2017. Moreover, despite the rapid shift of consumer behavior to digital channels, the majority of local marketing is still spent on traditional, offline channels. According to BIA/Kelsey, businesses spent approximately $105 billion on traditional local advertising in 2013. However, as consumer behavior continues to shift, local marketing is expected to shift to digital channels. BIA/Kelsey estimates that spending on local digital advertising will increase from $28 billion in 2013 to $53 billion in 2018.
Our Solution
We provide a comprehensive, cloud-based marketing automation platform for local businesses that makes marketing easy, affordable and transparent. We are seeking to transform the way that local businesses create and manage their online and mobile presence, and how they attract and engage with consumers. Our platform helps local businesses navigate the rapidly evolving, technically challenging and highly fragmented digital marketing landscape without having to invest a significant amount of time and money or needing in-house marketing or IT expertise. Because our platform is built to solve the marketing needs of a local business owner, we refer to it as their “CMO in a box.”
Our cloud-based marketing automation platform provides local businesses with the following key benefits:
| • | Comprehensive, intuitive and easy-to-use platform for attracting and engaging consumers. Our comprehensive, intuitive and easy-to-use local marketing automation platform provides the essential features that local businesses need to attract, manage and retain consumers. Through our platform, we provide a local business with a mobile, online and social digital presence that is algorithmically optimized to increase the likelihood that consumers will find and transact with them. We further automate the syndication of our customers’ business listings, description and photo content to approximately 50 online directories to ensure a consistent, professional and up-to-date presence across the Internet. We also provide our customers with the ability to easily communicate with their existing or prospective clients through social media platform management, email, text message and digital post cards. For customers who seek greater exposure for their business, we automate the buying of local online advertising. In addition, we integrate with some customers’ operational systems such as office management, scheduling or billing. For these customers, we are able to automate many of their daily client interactions or office routines. We have bundled these products into an integrated and easy-to-use platform, thereby liberating a local business from the confusion and complexity of deciding which point solutions to utilize and avoiding the expense and challenges of managing multiple vendors. Because our products are integrated into a common platform and are designed to work together, our solution provides a local business owner with an enhanced experience and better performance. |
| • | Increased revenues from new and existing consumers. Our platform is designed to help our customers to efficiently acquire and retain consumers, as well as improve the effectiveness of their marketing efforts and help them meet their marketing and business objectives. |
| • | Mobile solutions optimized for consumers and local business owners. We optimize our customers’ websites for use on mobile devices in order to make their websites easier for consumers to discover and use. In addition, our mobile dashboard allows our customers to monitor performance metrics and manage their |
82
Table of Contents
| content from their mobile devices, which enhances the local business owner’s ability to work remotely. For example, our customers can upload photos and collect online reviews from their mobile devices. |
| • | Transparency. Our platform allows our customers to easily monitor and manage their digital presence and marketing activities through a unified dashboard. We present relevant, real-time performance metrics, such as website visitor tracking and conversion, which enable our customers to better understand and evaluate their ROI. Moreover, when our platform is integrated into our customers’ operational systems, we also provide visibility into actual revenue generated through the use of our solution, thereby further validating our customers’ ROI. |
| • | Affordable pricing. Based on data from BIA/Kelsey, we believe the average SMB spends approximately $400 per month on marketing. We are focused on providing affordable solutions that deliver effective results to local businesses. We have generally priced our flagship product, Marketing Essentials, including all three of its current modules, at less than $300 per month since its introduction in March 2014. We believe, based on publicly available market pricing information, that re-creating the functionality of our Marketing Essentials product by purchasing multiple point solutions would cost a local business at least twice that amount. |
We also address the unique requirements of brand networks with our Centermark product, which leverages the core capabilities of our platform by providing a standardized source of shared data, communication and reporting to address the unique needs of brand network owners. Centermark enables brand network owners to extend many of the same benefits enjoyed by our local business customers to the individual locations in their network. Additionally, Centermark incorporates powerful communication, monitoring, analytics and call to action tools, which help brand network owners increase the value of their networks by:
| • | increasing the likelihood that individual locations are discovered by consumers; |
| • | encouraging individual locations to spend more on marketing with the goal of generating additional revenue across their network; |
| • | driving higher brand consistency across the network; and |
| • | providing access to actionable business intelligence by giving them visibility into the marketing performance of the network. |
Our Competitive Strengths
As a core part of our strategy, we have developed a differentiated business model for providing comprehensive, easy-to-use and affordable solutions to our customers and have also developed the capability to acquire, onboard and service our customers in a highly efficient manner. Sophisticated technology, rigorous data collection and analytics and scalable process automation are the foundation of our approach. They are key aspects of every part of our business and enable our competitive strengths. These competitive strengths include:
| • | Comprehensive, integrated and easy-to-use platform. Our local marketing automation platform provides local business owners with a comprehensive suite of digital marketing capabilities designed to meet all of their essential online and mobile marketing and engagement needs. The breadth, depth and highly integrated nature of our platform offer significant advantages to our customers who would otherwise be required to aggregate multiple point solutions at a higher cost, with greater complexity and without the performance benefits of being designed to work together. We have also designed our platform to be intuitive and easy-to-use, resulting in its rapid adoption and usage. We believe that these attributes provide our customers with superior value and performance. |
| • | Proprietary data assets. Over our nine-year operating history, we have built a large repository of data, based on tracking billions of consumer interactions, including online and mobile website visits, phone calls and emails and online search results. We utilize this data to algorithmically optimize our customers’ online and mobile content, email campaigns, website and ad copy templates, and keywords for SEO and |
83
Table of Contents
| SEM purposes. We believe our proprietary data assets allow us to more effectively measure and improve the marketing performance of websites, digital advertising and communications for our customers. For example, our customers’ website conversion rate, which we calculate on an aggregate basis as the number of phone calls or emails received by our customers divided by the number of visits to our customers’ websites, has increased by 84% over the four years ended December 31, 2013. |
| • | Powerful data-driven network effects. As we continue to add more local business customers to our platform, we are able to collect and analyze more data about our customers’ business operations and the performance of our digital marketing solutions. As the richness and depth of our data is enhanced, we are able to improve the performance of our platform and ultimately drive higher value to our current and future customers by further improving their marketing ROI. For example, from 2009 to 2013, we decreased our direct customers’ average price per lead, which we define as the aggregate amount of revenue derived from them divided by the aggregate number of leads we generated for them, by 48%. We believe this network effect provides a substantial competitive advantage over our existing and potential competitors. |
| • | Vertical expertise. The value we bring to our customers in specific verticals grows as we add more customers in those verticals and develop additional expertise in gathering data and optimizing marketing performance using that data. We currently target local businesses in the following key categories of industry verticals: legal and professional, dental and medical and contractor and other home services. As we grow our presence in these industry verticals and integrate and become operationally embedded with business management systems in these industry verticals, we are able to provide further benefits to our customers. For example, from 2009 to 2013, we decreased the average price per lead for new dental customers that we acquired directly by 50% in their first 90 days as our customers. We believe that our scale, data advantage and operational integration in specific verticals provide us with a competitive advantage in gathering data and optimizing marketing performance and business operations for our customers in those industry verticals. |
| • | Low customer acquisition costs. Our highly automated, technology- and data-driven approach to sales promotes efficiency and scalability in our business model and enables us to efficiently acquire customers. We have developed a proprietary prospect database of over 11 million unique business profiles. We have also developed proprietary analytics and sales force automation technology, which helps us determine the most effective sales strategy for each prospective customer, other than a prospective brand network customer. Between 2011 and 2013, we reduced our average cost to acquire a customer while at the same time more than doubling the headcount of our sales force. |
| • | Rapid and scalable customer onboarding and service driven by process automation. We have made technology investments in process automation that allows us to scale rapidly and onboard customers of all of our products without adding significant incremental costs or impacting the level of quality. For example, despite an increase in the number of customers onboarded in the first three months of 2014 compared to the same period in 2013, personnel costs associated with employees responsible for onboarding customers remained consistent as a result of our investments in technology and automation. Moreover, we launch the digital presence of 99% of our customers sold through our inside sales channel within one business day of sale with limited involvement from our personnel. We also offer some customization for our brand network customers that enables them to tailor our products for their specific business objectives. Although we have designed our products to be highly intuitive, we provide our customers access to our highly responsive, technology-enabled customer service team. |
| • | Track record of innovation. We believe that we have a strong track record of innovation in the local digital marketing industry, identifying and interpreting emerging technology and trends on behalf of our customers to enable them to benefit from our innovation. For example, we recognized the potential impact of mobile and social trends on local businesses early on and we integrated mobile-enabled solutions and social management tools seamlessly into our platform. For our innovative work in mobile, CIO Magazine named Yodle as one of the top 100 companies around the world exemplifying the highest level of operational and strategic excellence in information technology. In addition, we believe we were |
84
Table of Contents
| the first to directly address the unique marketing challenges of brand networks by creating our Centermark product. Our focus on innovation allows us to quickly adapt to the evolving landscape and provide our customers with valuable solutions, often before they identify a need for such solutions. |
Our competitive strengths result in what we believe is an attractive business model. Our low customer acquisition and onboarding costs minimize our initial investment to bring on new customers and allow us to achieve rapid payback. We define payback as occurring when the costs associated with acquiring and launching a cohort of new customers in any given quarter is offset by the ongoing cash flow from those customers, less our ongoing costs. We are typically able to generate positive cash flows within the first year after acquiring and launching a cohort of new customers, including the impact from customers who do not renew their subscriptions or service during the first year and excluding overhead costs. As a result, we believe our business model benefits from rapid payback. We refer to customers who we acquired directly (i.e., not through resellers) and who remain as customers after their initial year as our tenured customers. For the 12 months ended March 31, 2014, we experienced a monthly average revenue retention rate of 97.5% for our tenured customers. We expect the revenue retention rate for our tenured customers to continue to improve as our mix of revenues shifts toward revenues from platform products, as revenue derived from customers who subscribe to our platform products generally exhibits a higher retention rate than revenue derived from customers who purchase our media product. We believe that our low customer acquisition and onboarding costs, rapid payback and high monthly revenue retention of our tenured customers results in a business model that generates attractive customer economics and high returns on our initial investment.
Our Growth Strategy
We believe that we are in the very early stages of a large and long-term business opportunity. Our growth strategy for pursuing this opportunity includes the following key components:
| • | Further penetrate our existing industry verticals. We believe the market for our local marketing automation platform is large and underserved. Of the estimated 28 million local businesses in the United States, we currently target industry verticals that include approximately 7 million local businesses. We served approximately 44,800 customers as of March 31, 2014. We plan to further penetrate these verticals by leveraging our existing sales infrastructure, investing in our direct sales teams and expanding our sales through partnerships with resellers. |
| • | Increase the number of customers that are operationally integrated with our platform. We believe that Lighthouse, our business practice automation product, and Centermark provide us with a unique opportunity to become operationally integrated with our customers. We intend to expand the adoption of Lighthouse and Centermark by increasing the number of salespeople selling these products and increasing the number of industry verticals that we are targeting with our Lighthouse product. For example, we recently expanded our Lighthouse product to chiropractic practices as a newly supported industry vertical. By integrating into a customer’s systems, we are able to automate many daily consumer interactions or office routines, leading to improved operational efficiency and business results. As a result of this integration, we enjoy higher customer retention and are able to more accurately measure the benefits of our other products. |
| • | Expand our distribution channels. To accelerate our market penetration, we intend to pursue opportunities to sell our products through organizations that already have relationships with local businesses. Leveraging our Centermark product, we intend to increasingly pursue opportunities with brand network owners and to penetrate their networks of local businesses. In addition, we intend to selectively partner with resellers who sell our products to quickly and cost-efficiently reach a larger number of local businesses. For example, in Canada we work with Rogers, a leading Canadian communications and media company, which has enabled us to expand our addressable market. |
| • | Expand into new industry verticals and geographies. We intend to further penetrate the more than 28 million local businesses throughout the United States. We see significant opportunity in continuing to expand our footprint beyond our current industry verticals across a broad spectrum of local businesses. We recently began penetrating several new verticals, including mortgage brokers, accounting and tax professionals and chiropractor services. In addition, we believe that the global market of approximately |
85
Table of Contents
| 74 million local businesses provides us with further growth opportunities over the long term, however, our focus in the near term is growing our business in the United States and Canada. |
| • | Continue to introduce new products and enhance the functionality of our platform. We plan to continue to take advantage of our culture of innovation to introduce new products, continually develop new functionality for our platform and address the latest marketing opportunities and challenges facing local businesses. We will endeavor to sell these new products to both existing and new customers, which we expect will yield an increase in revenue and improved customer retention as the breadth and depth of our platform expands. |
| • | Pursue selective strategic acquisitions. We intend to selectively acquire businesses that can provide us with complementary technologies and products as we did in February 2013 with the acquisition of Lighthouse Practice Management. In addition, we plan to evaluate opportunities that will provide us with access to new customers, industry verticals or geographies. |
Our Products
The products we offer through our platform currently include: Marketing Essentials, Lighthouse, Yodle Ads and Centermark. Marketing Essentials, our flagship product, currently includes three modules: presence, conversion optimization and communication automation. Lighthouse provides business practice automation for those customers where we have integrated into their business management systems. Yodle Ads automates, manages and optimizes the buying of local online advertising for customers who seek greater exposure for their business. Centermark leverages certain core capabilities of Marketing Essentials by providing a standardized source of shared data, communication and reporting to address the unique needs of brand network owners. We refer to our offerings and the packages in which we sell them as products.
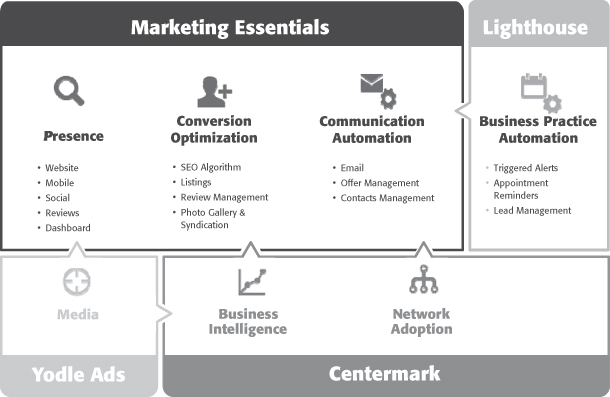
Over the last nine years, we have expanded our product offerings to address a broad range of digital marketing needs for local businesses. Our current suite of products and modules is the result of ongoing, internal
86
Table of Contents
product development and innovation that we have supplemented with strategic business acquisitions. Prior to introducing Marketing Essentials in the first quarter of 2014, we offered the presence and conversion optimization modules under different product names. In early 2014, we introduced the communication automation module. Our acquisition of Lighthouse Practice Management in February 2013 helped expand our platform through the addition of our business practice automation product, which we call Lighthouse. In December 2013, we introduced our Centermark product for brand networks owners. We intend to continue to expand the capabilities of our platform and evolve our product offerings to address the challenges local businesses face, with an emphasis on growing our platform revenue.
Marketing Essentials
Marketing Essentials provides local business owners with a comprehensive suite of easy-to-use products that includes establishing an online, mobile, desktop and social presence, as well as powerful tools to attract, manage and retain consumers. The three key modules currently included in our Marketing Essentials product are:
Presence Module. Our presence module includes a website, mobile-optimized website and business Facebook and Google+ pages. We develop this presence using algorithmically optimized and relevant content designed to increase the likelihood that visitors will find and transact with our customers. In addition, this module includes a mobile and desktop dashboard that allows our customers to monitor consumer interaction with their digital presence.
Conversion Optimization Module. In order to improve the discoverability of our customers’ digital presence and the conversion of website visitors into paying consumers, we optimize their digital presence through a number of strategies, including listings and photo syndication, review management and SEO automation. We automate the syndication of our customers’ business listings, description and photo content to approximately 50 online directories. This ensures a consistent, professional and up-to-date presence across the Internet to drive more visitors to our customers’ websites. We regularly test new content and format permutations in order to improve website conversion rates. Last year, for example, we tracked over 50 million visits to our customers’ websites and used that data to continually improve the layouts and features of our website templates to increase conversion rates. We also provide local businesses with the ability to easily collect, manage, respond to and syndicate consumer reviews to their website and Facebook pages through their desktops or mobile devices. Finally, we optimize the performance of our customers’ websites by using our proprietary SEO algorithms and automation tools to monitor our customers’ performance and adopt methodologies that are designed to yield better results consistent with search engine best practices.
Communication Automation Module. We provide our customers with the ability to easily communicate with and provide offers to their existing or prospective clients through social media platforms and email.
| • | Social Media Platform Management. To simplify social engagement for a local business, we provide social management tools with which a customer’s social media presence is consolidated into and managed from a single, simple interface. This feature is fully integrated into our other product features such as email automation, offer management, review management and photo syndication. Therefore, any relevant additions to a customer’s content repositories are automatically syndicated to social media platforms, enabling the customer to improve social engagement with its consumers. |
| • | Email Campaign Automation. We provide our customers with the ability to conduct highly customized email campaigns. Our platform leverages our proprietary algorithms, performance data and deep knowledge across our industry verticals to provide our customers with suggestions on email automation parameters such as message content, timing and frequency. |
| • | Offer Management. We provide our local business customers with the ability to use offers to attract new, and engage existing, clients via multiple channels such as websites, online directories, email, |
87
Table of Contents
| social outlets and postcards. Our scale and access to large volumes of offer performance data enables us to also provide our customers with specific and concrete offer suggestions to drive better results. |
Lighthouse
For local businesses that utilize business management systems with which we can integrate, we offer a business practice automation product called Lighthouse. This product automates many of our customers’ daily consumer interactions or office routines, leading to improved operational efficiency and business results. For example, one feature of the Lighthouse product is appointment automation, which improves appointment attendance rates by sending email, postcard, phone or text message reminders to the consumer about an upcoming appointment.
Yodle Ads
We complement our Marketing Essentials product with Yodle Ads, our online advertising product. Yodle Ads automates, manages and optimizes our customers’ media spend across mobile and desktop search engines such as Google, Yahoo! and Bing, as well as other relevant consumer sites. Yodle Ads is sold with Marketing Essentials in an integrated package called Yodle Max. We leverage our significant data assets, along with proprietary predictive modeling and machine-learning algorithms, to make optimal and automated media allocations and bidding decisions on behalf of our customers. In addition, if we are integrated with a customer’s business management system, we can access transaction data to further optimize their media spend and demonstrate their ROI.
Centermark
Our Centermark product is designed for brand networks and is intended to meet the unique challenges of brand network owners. Centermark leverages our Marketing Essentials product by providing functionality relevant to brand network owners, including:
Business Intelligence and Compliance. We provide brand network owners with real-time information about the marketing activity of their individual network locations. Centermark also allows the brand network owner to monitor and optimize marketing performance across the network. This includes the ability to take immediate action to prompt individual locations to adhere to the brand network owner’s marketing guidelines, visibility into the digital brand strength of the brand network in comparison to its competition and detailed information for each network location, including lead type and conversion information.
Network Adoption Portal. Through our network adoption portal, we enable the brand network owner to customize communications to each of its locations about the potential value of our solutions. In addition, the brand network owner can make digital marketing recommendations to the locations and facilitate the network location in executing on the recommended digital marketing strategy.
Customer Case Studies
Plumber, Indiana
This recently established family plumbing business quickly needed to grow awareness in its local community. The company wanted a better website and to be found online by potential consumers searching for local plumbers on their mobile devices. The business also wanted to build credibility by being able to easily collect and showcase customer reviews online.
Yodle has made marketing easy and effective for this customer in that we have:
| • | created a highly professional and effective digital presence; |
| • | built a robust reviews section on its website that highlighted five star ratings (out of a possible five stars) from 10 satisfied customers in less than three weeks; and |
88
Table of Contents
| • | generated approximately 20 quality phone calls and emails over just one month, with half of them resulting in jobs. |
As of March 31, 2014, we had approximately 4,500 plumbing, heating and air conditioning contractors as customers, of the approximately 226,500 local plumbing, heating and air-conditioning contractor businesses in the United States, according to the most recent U.S. Census Bureau data.
Landscaper, Kentucky
This local landscaping business was relying on word of mouth marketing, and was also doing its own marketing, to maintain and grow its customer base. The company found this approach was not generating a sufficient quantity or quality of jobs. It needed an affordable solution to increase awareness of the business. The company required a more impactful website and a fully optimized desktop and mobile digital presence.
Yodle has greatly enhanced the local presence and customer reach for this customer in that we have:
| • | obtained first page ranking for the business for more than 550 keywords on major search engines; |
| • | helped to dramatically increase sales over the last year—including a corporate contract worth over $35,000; and |
| • | helped secure more profitable accounts, like lakeside vacation homes that require year-round maintenance. |
As of March 31, 2014, we had approximately 1,200 landscapers as customers, of the approximately 459,600 local landscaping service businesses in the United States, according to the most recent U.S. Census Bureau data.
Lawyer, Virginia
This sole practitioner needed to grow his client base. He recognized the importance of being found on the Web and had tried numerous digital marketing companies. However, none of them delivered meaningful results. His practice needed an effective solution for establishing a strong digital presence and generating new clients.
Yodle has accomplished these objectives for this customer in that we have:
| • | generated an average of more than 90 phone calls and emails per month; |
| • | delivered high quality leads that have resulted in an attractive return on his marketing investment; and |
| • | achieved immediate results during the latter part of the calendar year—a previously difficult time for him to bring in new clients. |
As of March 31, 2014, we had approximately 3,400 lawyers as customers, of the approximately 165,000 local lawyers’ offices in the United States, according to the most recent U.S. Census Bureau data.
Dental Practice, Pennsylvania
This dental practice’s front desk staff was spending a significant amount of its time calling patients to remind them about their appointments and improve their appointment show rate. However, the majority of patients did not like to receive these phone calls. The dental practice needed a business practice automation solution to improve efficiencies and patient communications as well as improve their appointment show rate.
Yodle’s Lighthouse product automated our customer’s appointment management and reminder system and had a positive impact on the practice by:
| • | freeing up front desk employees to assist patients that are in the office and to spend time on other responsibilities; |
89
Table of Contents
| • | delivering an improved show rate for patients that had not canceled more than 24 hours prior to their scheduled appointment, typically attaining a rate of 95%; and |
| • | improving relationships with most patients who like receiving appointment reminders via text message or email. |
As of March 31, 2014, we had approximately 6,400 dentists as customers, of the approximately 166,500 local dentists’ offices in the United States, according to the most recent U.S. Census Bureau data.
Miracle-Ear
Miracle-Ear, the national hearing solutions brand network, had limited insight into the marketing performance across its independent franchise system of over 1,200 locations. The network also had a limited and inconsistent digital marketing presence consisting of just a corporate website and a handful of landing pages. The brand network owner wanted to develop a strong and cohesive digital marketing presence across all locations, which also needed to be optimized for mobile devices.
Yodle’s solutions have enabled Miracle-Ear to:
| • | develop a consistent, coordinated brand and marketing effort across all locations; |
| • | launch over 1,200 integrated desktop and mobile websites in 60 days, along with maps and directory listing optimization; |
| • | accurately measure the effectiveness of marketing campaigns across the network’s locations; and |
| • | help potential consumers more easily find locations, resulting in the network and its franchisees delivering hearing solutions to more people and increased sales. |
Sales and Marketing
We sell subscriptions to our platform products, and sell our Yodle Ads product, through three primary channels, including:
| • | Inside Sales: We have approximately 500 inside sales representatives who use our proprietary data, processes and technology to acquire customers throughout the U.S. cost effectively. |
| • | Enterprise Sales: We have an enterprise sales team that focuses on brand network owners and their corporate marketing departments. This team also works with brand network owners to promote the purchase of our products by individual network locations. |
| • | Resellers: We have entered into relationships with resellers for the sale and distribution of our marketing automation products. Our resellers distribute these products under their brand name, otherwise referred to as white-label resellers, as well as under the Yodle brand. Our strategy to partner with white-label resellers allows us to expedite our penetration of the market using the sales forces of large partners to help distribute our product under their brand. The largest of these partnerships is with Rogers, who distributes our products in Canada. |
Our inside sales are enabled by our proprietary and sophisticated customer prospecting system. It consists of a proprietary prospect database, a lead scoring algorithm and a sales representative lead distribution toolset. We generate leads by collecting information about local businesses from various sources. We enhance these records with a broad set of data inputs to evaluate a prospect’s lead score, which is our measure of the prospect’s likelihood of becoming a customer. We then apply statistical response modeling to predict the ideal time and the ideal sales representative to call a particular prospect, as well as the optimal suite of products. Once we score the leads, we distribute them to a specific sales representative at the correct time through our automated assignment tool.
Our compensation system for sales representatives is integrated into our system, which adjusts sales commissions in real time based on certain actions taken by the sales representative. With these variables, we are aligning the incentives for the sales representatives to maximize certain outcomes favorable to us, such as profit
90
Table of Contents
or penetration of certain markets. This sophisticated system enables a highly dynamic sales approach whereby each individual representative has the latitude to make an assessment of his or her skills and comparative advantage versus other representatives and puts their effort where they can maximize outcomes for themselves, while also driving favorable outcomes for us.
Competition
The local digital marketing landscape is highly fragmented, intensely competitive and constantly evolving. With the introduction of new technologies and market entrants, we expect the competitive environment to remain intense going forward. Our competitors include:
| • | traditional yellow pages directories, direct mail campaign providers, and advertising and listings services on local newspapers, magazines, television and radio, such as Dex Media, Gannett, Hearst and YP.com; |
| • | online search engines, such as, Google, Yahoo! and Bing and online business directories, such as, Yelp and Angie’s List; |
| • | providers of digital presence offerings, such as domain name registrars, shared hosting providers and website creation and reputation management companies, including Endurance, GoDaddy, Main Street Hub, Web.com and Wix; |
| • | providers of digital marketing solutions, such as search engine marketing companies and search engine optimization companies; and |
| • | productivity and office management tools, such as email, scheduling and practice management systems, including Constant Contact, Demandforce, MailChimp and Solutionreach. |
We compete on the basis of a number of factors, including:
| • | brand name, reputation and customer satisfaction; |
| • | cost-effective customer acquisition; |
| • | scope, scalability, flexibility and compatibility of offerings; |
| • | ease of implementation, use and maintenance; |
| • | pricing and effectiveness of solutions; |
| • | breadth of sales organization; and |
| • | reliability and security. |
We believe that we compete favorably with respect to all of these factors and that we are well positioned as a leading provider of cloud-based marketing automation solutions for local businesses.
Our Technology
Our development strategy is to leverage proprietary data and technology to empower our internal sales, customer service, marketing and financial teams to efficiently run our business. We aim to deliver value to our customers through rapid turnaround cycles, typically releasing new features at least once per week. Our methodology allows us to respond quickly to changing circumstances, as well as produce accurate delivery estimates for our software release dates.
We utilize a combination of hosted and cloud-based providers to maintain our service delivery infrastructure. Our hosted infrastructure is based in third-party colocation facilities in New York, New York and Phoenix, Arizona. The dual location design provides both load balancing capabilities as well as the ability to manage disaster recovery. The two locations are tied to all of our offices via dual telecommunications providers with redundant Internet Protocol backbones, local loop and network facilities. We also utilize Amazon Web Services for some aspects of our file storage and computational needs.
We have a technology and product development team that builds and maintains the technologies to support our business and is focused on product research, development, optimization and innovation. Our technology team is comprised of individuals with experience in web development, server development, system integration, system
91
Table of Contents
design, data management, statistical analysis and mathematical algorithms. Our technology personnel focus primarily on developing new applications, evolving our product and service offerings, maintenance, and quality assurance. Our research and development team includes a group dedicated to user experience and interface design.
Our technology and product development expense was $10.2 million in 2011, $15.0 million in 2012, $20.3 million in 2013 and $5.7 million in the three months ended March 31, 2014.
Intellectual Property
Our intellectual property rights are a key component of our success. We rely on a combination of patent, trademark, copyright and trade secret laws, as well as confidentiality procedures and contractual restrictions, to establish, maintain and protect our proprietary rights. We generally require employees, consultants, publishers, suppliers and partners to execute confidentiality agreements with us that restrict the disclosure of our intellectual property. We also generally require our employees and consultants to execute invention assignment agreements with us that protect our intellectual property rights.
Intellectual property laws, together with our efforts to protect our proprietary rights, provide only limited protection, and any of our intellectual property rights may be challenged, invalidated, circumvented, infringed or misappropriated. The laws of certain countries do not protect proprietary rights to the same extent as the laws of the United States and, therefore, in certain jurisdictions, we may be unable to protect our proprietary technology. Further, agreements with our employees and consultants may be breached, and we may not have adequate remedies to redress any breach. Further, to the extent that our employees or consultants use intellectual property owned by others in their work for us, disputes may arise as to the rights in related or resulting know-how and inventions. Finally, our trade secrets may otherwise become known or be independently discovered by competitors and unauthorized parties may attempt to copy aspects of our solution or obtain and use information that we regard as proprietary.
As of March 31, 2014, we held one issued U.S. patent, which expires in September 2030. We also own and use registered and unregistered trademarks on or in connection with our products and services. In addition, we have also registered numerous internet domain names.
Our industry is characterized by the existence of a large number of patents and frequent claims and related litigation regarding patent and other intellectual property rights. In particular, leading companies in the technology industry have extensive patent portfolios. From time to time, third parties have asserted copyright, trademark and other intellectual property rights against us or our customers. Litigation and associated expenses may be necessary to enforce our proprietary rights.
Government Regulation
This section describes the key laws, regulations and industry standards that affect our business. Some of the aspects described below affect us directly. Other aspects do not apply to us directly, but may have a significant effect on the way our resellers and customers can operate. The regulatory environment in which we or our customers operate, particularly in the areas of privacy, data security, marketing, advertising and healthcare, are often complex and relatively new. As such, they are subject to varying interpretations by courts and governmental authorities and often require subjective interpretation. We cannot be certain that our efforts, or our customers’ efforts, to comply with these laws and regulations will be deemed sufficient by the relevant governmental authorities. In addition, the use of consumer information and health information are areas on which the public, legislators and regulators are currently focused. It is possible that the laws, regulations and industry standards that affect our business will change in the future, and we are not able to predict the effect that future changes will have on our business. Although our customer agreements typically contain obligations requiring our
92
Table of Contents
customers to comply with applicable laws, not all of our customers execute a standard customer agreement or if our customers fail to adhere to these obligations, we may be subject to adverse publicity, and related possible inquiries, investigations, or other regulatory activities in connection with our practices or those of our customers.
Privacy. Our collection, storage and use of information regarding our customers’ clients, customers or patients is governed by various U.S. federal and state laws, regulations and standards, as well as comparable Canadian laws and regulations. Enforcement by regulators, including the FTC, State Attorneys General and comparable Canadian authorities, impose notice, choice, security and access requirements with respect to such information. The standards are subject to interpretation by courts and other governmental authorities. A determination by a governmental agency, court or other governmental authority that any of our practices do not meet local standards or regulations could result in liability and adversely affect our business. In addition, inquiries or proceedings involving data protection may be expensive or time consuming, and their outcome is uncertain.
Marketing and Advertising. Our and our customers’ marketing and advertising practices are governed by a variety of federal and state laws and regulations. In addition, a variety of industry groups have developed voluntary codes of conduct related to marketing and advertising, particularly online advertising, which have developed into best practices. The applicable laws and regulations include the United States Telephone Consumer Protection Act, or TCPA, which broadly regulates outbound calls, including live operator calls, and restricts the use of automated telephone dialing equipment to call certain telephone numbers unless prior express consent has been obtained. The TCPA also prohibits companies from initiating telephone solicitations to consumers on the national Do-Not-Call list, and restricts the hours when such messages may be sent. Violations of the TCPA can result in statutory damages of $500 per violation (i.e., for each individual text message). U.S. state laws impose additional regulations on telephone calls and text messages and many states also include their own Do-Not-Call lists. Failure to comply with the TCPA in our marketing efforts, or the failure or inability of our customers to obtain necessary consents for the messaging features of our products, may damage our reputation, subject us to liability and require us to change certain of our product offerings. In addition, our and our customers’ email marketing is governed by the CAN-SPAM Act, which regulates commercial e-mails. The CAN-SPAM Act provides a right on the part of the recipient to request the sender to stop sending messages, and establishes penalties for the sending of e-mail messages that are intended to deceive the recipient as to source or content. Recipients must be furnished with an electronic method of informing the sender of the recipient’s decision to not receive further commercial e-mails. In addition, we face the risk that an action could be brought against us under various state spam laws, which are not entirely preempted by CAN-SPAM. An action alleging our or our customers’ failure to comply with CAN-SPAM or a state spam law and the adverse publicity associated with any such action could result in loss of customers or failure to bring on new customers. The TCPA, CAN-SPAM Act, related laws and industry codes of conduct are subject to varying interpretations by courts, governmental authorities and the advertising and marketing industry and often require subjective interpretation. We cannot be certain that our and our customers’ efforts to comply with these laws will be deemed sufficient by the relevant parties.
HIPAA Privacy Standards and Security Standards. The Privacy Standards and Security Standards under the Health Insurance Portability and Accountability Act of 1996, or HIPAA, establish a set of basic national privacy and security standards for the protection of certain individually identifiable health information by health plans, healthcare clearinghouses and healthcare providers, referred to as covered entities, and the business associates with whom such covered entities contract for services. The Health Information for Economic and Clinical Health Act of 2009, or HITECH, makes certain of HIPAA’s privacy and security standards also directly applicable to covered entities’ business associates. As a result, business associates are now subject to significant civil and criminal penalties for failure to comply with applicable privacy and security rule requirements. Moreover, HITECH creates a new requirement to report certain breaches of unsecured, individually identifiable health information and imposes penalties on entities that fail to do so. Additionally, certain states have adopted comparable privacy and security laws and regulations, some of which may be more stringent than HIPAA. HIPAA and HITECH will be subject to interpretation by various courts and other governmental authorities, thus creating potentially complex compliance issues for us and our customers and resellers. If our data practices do
93
Table of Contents
not comply with the requirements of HIPAA or HITECH, we may be directly subject to liability under HIPAA or HITECH. Any liability from failure to comply with the requirements of HIPAA or HITECH, to the extent such requirements are deemed to apply to our operations, or contractual obligations, could adversely affect our financial condition. The costs of complying with privacy and security related legal and regulatory requirements are burdensome and could have a material adverse effect on our results of operations.
Data Protection Regulation. Many states have passed laws regulating the actions that a business must take if it experiences a data breach. A handful of other states have passed data security laws regulating the administrative, technical and physical safeguards that businesses must take in connection with the storage, transmission and disposal of consumer information. Congress has also contemplated federal legislation relating to data breaches and HITECH requires breaches of certain unsecured, individually identifiable health information to be reported. In the past, the FTC has prosecuted some data breach cases as unfair and deceptive acts or practices under the FTC Act and State Attorneys General are focused on data security. We intend to continue to protect all customer data and to comply with all applicable laws regarding the protection of customer data. If we have a data security breach and we don’t comply with applicable laws, it could create liability for us, damage our reputation and result in a loss of customers.
Credit Card Protections. We collect credit card data in processing the fees paid to us by our customers. Several major credit card companies have formed the Payment Card Industry Council, or PCI Council, in order to establish and implement security standards for companies that transmit, store or process credit card data. The PCI Council has created the Payment Card Industry Data Security Standard, or PCI DSS. Though the PCI DSS is not law, merchants using PCI Council members to process transactions are required to comply with the PCI DSS, with associated fines and penalties for non-compliance. Further, elements of the PCI DSS have begun to emerge as law in some states, and we expect the trend to continue as to additional laws and restrictions in collecting and using credit card information. We engage a third-party credit card processor to store our customers’ credit card data and process our customers’ credit card payments.
Telephone Call Recording Laws. We are subject to laws affecting telephone call recording. Under the federal Wiretap Act, and most state laws, at least one party taking part in a call must be notified if the call is being recorded; therefore, one of the parties to a telephone call may record the conversation. However, the law of twelve states (i.e., California, Connecticut, Florida, Illinois, Maryland, Massachusetts, Michigan, Montana, Nevada, New Hampshire, Pennsylvania and Washington) require that all parties consent when one party wants to record a telephone conversation. These laws are subject to varying interpretations by courts and governmental authorities and often require subjective interpretation. We cannot be certain that our efforts to comply with these laws will be deemed sufficient by the relevant courts and governmental authorities. Volitions of the Wiretap Act, as well as state telephone call recording laws, can result in significant fines and criminal sanctions, may damage our reputation and require us to change certain of our product offerings.
Anti-Kickback Laws. There are federal and state laws that govern patient referrals, physician financial relationships and inducements to healthcare providers and patients. The federal healthcare program’s anti-kickback law prohibits any person or entity from offering, paying, soliciting or receiving anything of value, directly or indirectly, for the referral of patients covered by Medicare, Medicaid and other federal healthcare programs. Many states also have similar fee splitting laws that are not necessarily limited to items or services for which payment is made by a federal healthcare program. The laws in this area are broad and we may not be able to determine how the laws will be applied to our business practices. Any determination by a state or federal regulatory agency that any of our practices violate any of these laws could subject us to liability and require us to change some portions of our business.
Employees
As of March 31, 2014, we had 1,117 employees. Substantially all of these employees are located in the United States. None of our employees are represented by a labor union or covered by a collective bargaining agreement. We consider our relationship with our employees to be good.
94
Table of Contents
Facilities
Our principal offices occupy approximately 47,000 square feet of leased office space in New York, New York pursuant to a lease agreement that expires in 2015. We also lease offices in Atlanta, Georgia; Austin, Texas; Charlotte, North Carolina and Scottsdale, Arizona.
Legal Proceedings
From time to time we are involved in legal proceedings or subject to claims arising in the ordinary course of our business. Although the results of litigation and claims cannot be predicted with certainty, we do not believe we are a party to any legal proceedings that, if determined adversely to us, would individually or taken together have a material adverse effect on our business, operating results, financial condition or cash flows. Regardless of the outcome, litigation can have an adverse impact on us because of defense and settlement costs, diversion of management resources and other factors.
95
Table of Contents
Directors and Executive Officers
The following table sets forth the names, ages and positions of our directors and executive officers as of June 15, 2014:
| Name |
Age | Position | ||||
| Executive Officers: |
||||||
| Court Cunningham |
45 | Chief Executive Officer, President and Director | ||||
| Michael Gordon |
44 | Chief Operating Officer, Chief Financial Officer, Treasurer and Secretary | ||||
| Erin Brockman |
39 | Chief Human Resources Officer | ||||
| Eric Raab |
53 | Chief Information Officer | ||||
| Fred Voccola |
39 | General Manager, Yodle for Brand Networks | ||||
| Paul Bascobert |
50 | President of Local | ||||
| Directors: |
||||||
| Michael Adler(1) |
50 | Director | ||||
| Rick Faulk(1) |
64 | Director | ||||
| Tom Mawhinney |
46 | Director | ||||
| David Rubin |
45 | Director | ||||
| Rob Stavis(2) |
51 | Director | ||||
| Andreas Stavropoulos(2) |
44 | Director | ||||
| (1) | Member of the audit committee. Mr. Adler serves as the chairman of the audit committee. |
| (2) | Member of the compensation committee. Mr. Stavis serves as the chairman of the compensation committee. |
Executive Officers
Court Cunningham joined Yodle in April 2007 and has served as our Chief Executive Officer and a member of our board of directors since May 2007. Prior to joining Yodle, Mr. Cunningham held the position of Chief Operating Officer at Community Connect, a niche social networking company, from April 2005 to April 2007. Prior to Community Connect, Mr. Cunningham served as Senior Vice President & General Manager of the Marketing Automation group at DoubleClick. Mr. Cunningham holds a B.A. in English from Princeton University and an M.B.A. from Harvard Business School. We believe that Mr. Cunningham’s extensive knowledge of our business and operations, as well as his consumer marketing, product development and business development experience, allow him to make valuable contributions to our board of directors.
Michael Gordon has served as our Chief Financial Officer since May 2009 and as our Chief Operating Officer since March 2014. Prior to joining Yodle, Mr. Gordon was a Managing Director in the Media and Telecom investment banking group at Merrill Lynch, Pierce, Fenner and Smith Incorporated where he worked from 1996 to 2009. Previously, Mr. Gordon worked in brand management at Procter & Gamble. Since March 2013, Mr. Gordon has served on the board of directors of Tracx Systems, Ltd., a privately-held company that focuses on social media management software. He also serves on the board of directors of Share Our Strength, a non-profit, anti-hunger organization. Mr. Gordon holds an A.B. from Harvard College and an M.B.A. from Harvard Business School.
Erin Brockman joined Yodle in June 2009 as Vice President of Client Services, served as our Senior Vice President of Client Services from February 2012 through May 2014 and, since June 2014, has served as our Chief Human Resources Officer. Prior to joining Yodle, Ms. Brockman worked at Yahoo! from February 2002 to May 2009, where she most recently served as the Vice President of Operations and Customer Service. Prior to Yahoo!, Ms. Brockman served in management positions at HotJobs, GotSchool Market and Kozmo.com. She started her career in Change Management consulting at Accenture. Ms. Brockman holds a B.S. in Industrial and Labor Relations from Cornell University.
96
Table of Contents
Eric Raab has served as our Chief Information Officer since April 2013. Prior to joining Yodle, he was Chief Technology Officer at M5 Networks from July 2010 to March 2013. Prior to M5 Networks, Mr. Raab served as Chief Technology Officer of Line2 for Toktumi, Inc. from November 2008 to July 2010. He was also Vice President of Engineering and Operations at Teleplace, Inc. in 2008 and Chief Technology Officer and Vice President of Engineering at Epana Networks, Inc. from April 2003 to January 2008. Mr. Raab has also served as Chief Executive Officer of AIG Telecom and in the capacity of Chief Technology Officer at IDT Corporation, a telecommunications carrier based in Newark, New Jersey. Earlier in his career, Mr. Raab developed atomic, optical and computer technologies for AT&T Bell Labs. Mr. Raab holds a B.A. in Physics and Mathematics from Columbia University and a Ph.D. in Atomic and Molecular Physics from MIT.
Fred Voccola has served as our General Manager, Yodle for Brand Networks since April 2013. Prior to joining Yodle, Mr. Voccola served as the President of Nolio, Inc., an enterprise software company, from 2012 to 2013, when Nolio was acquired by Computer Associates (NYSE: CA). Prior to Nolio, from 2008 to 2012, Mr. Voccola co-founded and served as the President and Chief Executive Officer of Trust Technology Corp. In 2012, Trust Technology Corp. was sold to FGI Finance. Earlier, Mr. Voccola co-founded and served as Chief Operating Officer of Identify Software from 2001 to 2006, when Identify Software was acquired by BMC Software. Mr. Voccola then served as Vice President of Worldwide Sales and Services at BMC Software until 2008. Prior to Identify Software, Mr. Voccola served in various management and executive roles at Intira, which was sold to Divine Systems, and Prism Solutions, which was sold to Ardent Software/Informix/IBM. Mr. Voccola holds a B.S. in Finance from the Carroll School of Management at Boston College.
Paul Bascobert has served as our President of Local since May 2014. Prior to joining Yodle, Mr. Bascobert worked at Bloomberg LP from 2009 to 2014, where he served as Chief Operating Officer of Bloomberg Media Group since 2011 and President of Bloomberg Businessweek since 2009. Prior to Bloomberg, Mr. Bascobert served as Chief Marketing Officer of Dow Jones & Co. from 2007 to 2009 and as Senior Vice President of Operations from 2006 to 2007. Earlier in his career, Mr. Bascobert served as Executive Vice President of Braun Consulting and as Co-Founder and Partner of Vertex Partners, which was acquired by Braun Consulting in 1998. Mr. Bascobert holds a B.S. in Electrical Engineering from Kettering University and an M.B.A. from The Wharton School of the University of Pennsylvania.
Directors
Michael Adler has served as a member of our board of directors since November 2012. He joined SquareTrade as their Chief Financial Officer in November 2012. Prior to joining SquareTrade, Mr. Adler was the Executive Vice President and Chief Financial Officer of Expedia Inc. from April 2006 to September 2011. Before that, he held several roles at IAC/InterActiveCorp from April 2001 to March 2006, including SVP of Financial Planning and Analysis. While at IAC/InterActiveCorp he also served as the Chief Executive Officer and Chairman of the third party e-commerce platform provider, Styleclick, Inc. Previously, Mr. Adler held senior positions at SchoolSports (now known as ESPN Rise) and Cheyenne Software, an enterprise storage software company. Earlier in his career, Mr. Adler practiced corporate law with Feldman, Waldman & Kline in San Francisco. Mr. Adler holds a B.S. in Economics from The Wharton School of the University of Pennsylvania and a J.D. from the University of Pennsylvania Law School. We believe that Mr. Adler’s extensive experience in accounting, financial management and operations management allows him to make valuable contributions to our board of directors.
Rick Faulk has served as a member of our board of directors since July 2008. Mr. Faulk has been the Chief Executive Officer of Intronis since March 2013. Prior to Intronis, Mr. Faulk was General Manager for the Campaigner® brand at j2 Global® from 2012 to 2013. Prior to j2 Global®, Mr. Faulk was President and Chief Executive Officer of Landslide Technologies from 2010 to 2012, and he was President and Chief Executive Officer of Mzinga from 2007 to 2009. He also served as Chief Marketing Officer for WebEx Communications and President of WebEx Small Business. Prior to WebEx, he was Chief Executive Officer of Intranets.com. Mr. Faulk holds a degree in Business Administration from Bowling Green State University. We believe that Mr. Faulk’s experience with executive management, sales and marketing at SaaS and technology companies allows him to make valuable contributions to our board of directors.
97
Table of Contents
Tom Mawhinney has served as a member of our board of directors since January 2010. Mr. Mawhinney joined Jafco Ventures as a general partner in 2003. Prior to joining Jafco, Mr. Mawhinney worked with Canaan Partners, an early-stage venture capital firm, from 2001 to 2003. Earlier in his career, Mr. Mawhinney co-founded and served as President and Chief Operating Officer of North Systems, a venture-backed software company, and worked at Summit Partners, a venture capital firm. Mr. Mawhinney holds a B.A. from Harvard College and an M.B.A. from the Stanford Graduate School of Business. We believe that Mr. Mawhinney’s deep roots in the technology industry as both a venture capitalist and an operating executive allow him to make valuable contributions to our board of directors.
David Rubin joined Yodle in May 2011, served as our Chief Revenue Officer from May 2012 through May 2014 and, since June 2014, has served as a strategic advisor and member of our board of directors. Mr. Rubin was previously Chief Executive Officer of ProfitFuel from November 2002 to May 2011, and joined Yodle as part of our acquisition of ProfitFuel in May 2011. Prior to ProfitFuel, Mr. Rubin was founder and Chief Executive Officer of HomeCity, an online real estate brokerage firm, from February 2000 to November 2002. Before founding HomeCity, Mr. Rubin served as Vice President of New Services Development at Intraware, and prior to its acquisition by Intraware, as founder and Chief Executive Officer of BITSource. We believe that Mr. Rubin’s strong background in operations management and his comprehensive understanding of our business will allow him to make valuable contributions to our board of directors.
Rob Stavis has served as a member of our board of directors since November 2011, and first served on our board of directors from November 2006 to November 2007. Mr. Stavis has been a partner at Bessemer Venture Partners, a venture capital firm, since 2000. Prior to joining Bessemer, Mr. Stavis was an independent private equity investor. Earlier in his career, he served in various positions at Salomon Smith Barney, including as co-head of global arbitrage trading. Mr. Stavis also serves on the board of directors of 2U, Inc., an education technology company. Mr. Stavis holds a B.A.S. in Engineering from the University of Pennsylvania’s School of Engineering and Applied Sciences and a B.S. in Economics from The Wharton School of the University of Pennsylvania. We believe Mr. Stavis’s experience, both investing in the emerging software technology industry and serving as a board member for numerous private companies, allows him to make valuable contributions to our board of directors.
Andreas Stavropoulos has served as a member of our board of directors since November 2007. Mr. Stavropoulos has been a partner at DFJ, a venture capital firm, since 2000. Prior to joining DFJ, he was at McKinsey & Company from 1997 to 1999. Earlier in his career, he worked at Cornerstone Research, a financial and economic consulting firm. Mr. Stavropoulos holds a B.A. in Computer Science, summa cum laude from Harvard College, an M.S. in Computer Science from Harvard University and an M.B.A. with high distinction from Harvard Business School. We believe Mr. Stavropoulos’s extensive experience in the fields of consulting and finance allows him to make valuable contributions to our board of directors.
Family Relationships
There are no family relationships among any of our directors or executive officers.
Board Composition
Our board of directors currently consists of six members. Each director is currently elected to the board of directors for a one-year term, to serve until the election and qualification of a successor director at our annual meeting of stockholders, or until the director’s earlier removal, resignation or death.
All of our directors currently serve on the board of directors pursuant to the voting provisions of an amended and restated voting agreement between us and several of our stockholders. This agreement will terminate upon the completion of this offering, after which there will be no further contractual obligations regarding the election of our directors. See the section titled “Related Party Transactions” for a description of this agreement.
98
Table of Contents
In accordance with our certificate of incorporation, which will become effective immediately prior to completion of this offering, our board of directors will be divided into three classes with staggered three-year terms. At each annual meeting of stockholders, the successors to directors whose terms then expire will be elected to serve from the time of election and qualification until the third annual meeting following election. Our directors will be divided among the three classes as follows:
| • | Class I, which will consist of Court Cunningham, Andreas Stavropoulos and Michael Adler, and whose term will expire at our first annual meeting of stockholders to be held after the completion of this offering; |
| • | Class II, which will consist of Rick Faulk and Rob Stavis, and whose term will expire at our second annual meeting of stockholders to be held after the completion of this offering; and |
| • | Class III, which will consist of Tom Mawhinney and David Rubin, and whose term will expire at our third annual meeting of stockholders to be held after the completion of this offering. |
Our bylaws, which will become effective upon completion of this offering, will provide that the authorized number of directors may be changed only by resolution approved by a majority of our board of directors. Any additional directorships resulting from an increase in the number of directors will be distributed among the three classes so that, as nearly as possible, each class will consist of one-third of the directors.
The division of our board of directors into three classes with staggered three-year terms may delay or prevent a change of our management or a change in control.
Director Independence
Our board of directors has undertaken a review of the independence of the directors and considered whether any director has a material relationship with us that could compromise his or her ability to exercise independent judgment in carrying out his or her responsibilities. Based upon information requested from and provided by each director concerning such director’s background, employment and affiliations, including family relationships, our board of directors determined that Messrs. Adler, Faulk, Mawhinney, Stavis and Stavropoulos, representing five of our six directors, are “independent directors” as defined under applicable stock exchange rules and Messrs. Adler, Faulk and Mawhinney meet the independence requirements contemplated by Rule 10A-3 under the Securities Exchange Act of 1934, as amended, or the Exchange Act. In making these determinations, our board of directors considered the current and prior relationships that each non-employee director has with our company and all other facts and circumstances that our board of directors deemed relevant in determining their independence, including the beneficial ownership of our capital stock by each non-employee director and the transactions involving them described in the section of this prospectus titled “Certain Relationships and Related Party Transactions.”
Board Committees
Our board of directors has established an audit committee and a compensation committee and intends to form a nominating and corporate governance committee in connection with this offering, each of which has the composition and responsibilities described below. From time to time, the board may establish other committees to facilitate the management of our business.
Audit Committee
Our audit committee consists of three directors, Messrs. Adler, Faulk and Mawhinney. The composition of our audit committee meets the requirements for independence under current listing standards and SEC rules and regulations. Each member of our audit committee meets the financial literacy requirements of the listing standards. Mr. Adler is the chairman of the audit committee and our board of directors has determined that
99
Table of Contents
Mr. Adler is an audit committee “financial expert” as defined by Item 407(d) of Regulation S-K under the Securities Act. The principal duties and responsibilities of our audit committee include, among other things:
| • | selecting a qualified firm to serve as the independent registered public accounting firm to audit our consolidated financial statements; |
| • | helping to ensure the independence and performance of the independent registered public accounting firm; |
| • | discussing the scope and results of the audit with the independent registered public accounting firm, and reviewing, with management and the independent accountants, our interim and year-end operating results; |
| • | developing procedures for employees to submit concerns anonymously about questionable accounting or audit matters; |
| • | reviewing our policies on risk assessment and risk management; |
| • | reviewing related party transactions; |
| • | reviewing and monitoring accounting principles, accounting policies, financial and accounting controls and compliance with legal and regulatory requirements; |
| • | obtaining and reviewing a report by the independent registered public accounting firm at least annually, that describes our internal control procedures, any material issues with such procedures, and any steps taken to deal with such issues when required by applicable law; and |
| • | approving (or, as permitted, pre-approving) all audit and all permissible non-audit services, other than de minimis non-audit services, to be performed by the independent registered public accounting firm. |
Our audit committee will operate under a written charter, to be effective immediately prior to the completion of this offering that satisfies the applicable rules of the SEC and the listing standards of .
Compensation Committee
Our compensation committee consists of two directors, Messrs. Stavis and Stavropoulos, each of whom is a non-employee member of our board of directors as defined in Rule 16b-3 under the Exchange Act and an outside director as that term is defined in Section 162(m) of the Internal Revenue Code of 1986, or the Code. Mr. Stavis is the chairman of the compensation committee. The composition of our compensation committee meets the requirements for independence under current listing standards and SEC rules and regulations. The principal duties and responsibilities of our compensation committee include, among other things:
| • | reviewing and approving, or recommending that our board of directors approve, the compensation of our executive officers; |
| • | reviewing and recommending to our board of directors the compensation of our directors; |
| • | reviewing and approving, or recommending that our board of directors approve, the terms of compensatory arrangements with our executive officers; |
| • | administering our stock and equity incentive plans; |
| • | reviewing and approving, or recommending that our board of directors approve, incentive compensation and equity plans; and |
| • | reviewing and establishing general policies relating to compensation and benefits of our employees and reviewing our overall compensation philosophy. |
Our compensation committee will operate under a written charter, to be effective immediately prior to the completion of this offering, that satisfies the applicable rules of the SEC and the listing standards of the .
100
Table of Contents
Nominating and Corporate Governance Committee
The nominating and corporate governance committee, which will be established prior to the completion of this offering, will consist of two directors, Messrs. Stavis and Stavropoulos. Mr. Stavis is the chairman of the nominating and corporate governance committee. The composition of our nominating and governance committee meets the requirements for independence under current listing standards and SEC rules and regulations. The nominating and corporate governance committee’s responsibilities include, among other things:
| • | identifying, evaluating and selecting, or recommending that our board of directors approve, nominees for election to our board of directors and its committees; |
| • | evaluating the performance of our board of directors and of individual directors; |
| • | considering and making recommendations to our board of directors regarding the composition of our board of directors and its committees; |
| • | reviewing developments in corporate governance practices; |
| • | evaluating the adequacy of our corporate governance practices and reporting; |
| • | developing and making recommendations to our board of directors regarding corporate governance guidelines and matters; and |
| • | overseeing an annual evaluation of the board’s performance. |
Our nominating and governance committee will operate under a written charter, to be effective immediately prior to the completion of this offering, that satisfies the applicable rules of the SEC and the listing standards of the .
Code of Business Conduct and Ethics
In connection with this offering, we intend to adopt a Code of Business Conduct and Ethics, or the Code of Conduct, applicable to all of our employees, executive officers and directors. Following the completion of this offering, the Code of Conduct will be available on our website at www.yodle.com. The nominating and corporate governance committee of our board of directors will be responsible for overseeing the Code of Conduct and must approve any waivers of the Code of Conduct for employees, executive officers and directors. We expect that any amendments to the Code of Conduct, or any waivers of its requirements, will be disclosed on our website. Information contained in or accessible through our website does not constitute a part of, and is not incorporated into, this prospectus.
Compensation Committee Interlocks and Insider Participation
Our compensation committee currently consists of Messrs. Stavis and Stavropoulos, each of whom has served on the compensation committee during the last year. Neither of these committee members has at any time been one of our officers or employees. None of our executive officers currently serves, or in the past year has served, as a member of the board of directors or compensation committee of any entity that has one or more executive officers serving on our board of directors or compensation committee. We are a party to certain transactions with entities affiliated with Bessemer Venture Partners and Draper Fisher Jurvetson, as described in the section titled “Certain Relationships and Related Party Transactions.”
Non-Employee Director Compensation
Historically, we have provided a combination of cash and equity-based compensation to our independent directors who are not employees or affiliated with our venture capital investors for the time and effort necessary to serve as a member of our board of directors. Accordingly, Messrs. Adler and Faulk have been granted equity-
101
Table of Contents
based compensation in connection with their service. We granted options to each upon joining our board of directors and to Mr. Faulk from time to time thereafter, subject in each case to monthly vesting over two years.
Other than the cash compensation and option grants referenced above, our directors are not currently entitled to receive any compensation in connection with their service on our board of directors, except for reimbursement of direct expenses incurred in connection with attending meetings of the board or committees thereof.
We expect that our board of directors will adopt a director compensation policy for non-employee directors to be effective upon the closing of this offering.
2013 Director Compensation Table
The following table sets forth information regarding the compensation earned for service on our board of directors during the year ended December 31, 2013 by our directors who were not also our employees. Court Cunningham, our Chief Executive Officer, is also a director, but does not receive any additional compensation for his service as a director. Mr. Cunningham’s compensation as an executive officer is set forth in the section of this prospectus titled “Executive and Director Compensation—2013 Summary Compensation Table.”
| Name |
Fees Earned or Paid in Cash ($) |
Option Awards ($)(1)(2) |
All Other Compensation ($)(3) |
Total ($) |
||||||||||||
| Michael Adler |
16,000 | — | 2,488 | 18,488 | ||||||||||||
| Rick Faulk |
8,000 | 41,525 | 3,044 | 52,569 | ||||||||||||
| Tom Mawhinney |
— | — | 23,942 | 23,942 | ||||||||||||
| Rob Stavis |
— | — | — | — | ||||||||||||
| Andreas Stavropoulos |
— | — | 4,256 | 4,256 | ||||||||||||
| (1) | This column reflects the full grant date fair value for options granted during the year as measured pursuant to Accounting Standards Codification, or ASC, Topic 718 as stock-based compensation in our financial statements. Unlike the calculations contained in our financial statements, this calculation does not give effect to any estimate of forfeitures related to service-based vesting, but assumes that the director will perform the requisite service for the award to vest in full. The assumptions we used in valuing options are described in note 15 to our consolidated financial statements included in this prospectus. |
| (2) | The table below shows the aggregate number of option awards outstanding for each of our non-employee directors as of December 31, 2013: |
| Name | Options Awards (#) |
|||
| Michael Adler |
40,000 | (a) | ||
| Rick Faulk |
120,000 | (b) | ||
| Tom Mawhinney |
— | |||
| Rob Stavis |
— | |||
| Andreas Stavropoulos |
— | |||
| (a) | Includes 21,671 shares underlying options exercisable as of December 31, 2013. The remainder of the shares underlying Mr. Adler’s options vest in equal monthly installments over the next 11 months. |
| (b) | Includes 80,000 shares underlying options exercisable as of December 31, 2013. The remainder of the shares underlying Mr. Faulk’s options vest in equal monthly installments over the next 24 months. |
| (3) | Includes airfare, hotel and transportation expenses to attend meetings of our board of directors and, with respect to Mr. Mawhinney, includes $20,735 of airfare, $2,331 of hotel and $876 of transportation expenses. |
102
Table of Contents
EXECUTIVE AND DIRECTOR COMPENSATION
2013 Summary Compensation Table
The following table sets forth information regarding compensation earned during the year ended December 31, 2013 by our named executive officers, which include our principal executive officer and the next two most highly compensated executive officers for 2013.
| Name and Principal Position |
Salary ($) | Option Awards ($)(1) |
Non-Equity Incentive Plan Compensation ($)(2) |
Total ($) | ||||||||||||
| Court Cunningham Chief Executive Officer |
388,550 | 913,437 | 236,455 | 1,538,442 | ||||||||||||
| Eric Raab Chief Information Officer |
177,273 | 626,826 | 52,400 | 856,498 | ||||||||||||
| Fred Voccola General Manager, Yodle for Brand Networks |
164,489 | 530,631 | 133,497 | 828,616 | ||||||||||||
| (1) | This column reflects the full grant date fair value for options granted during the year as measured pursuant to ASC Topic 718 as stock-based compensation in our consolidated financial statements. Unlike the calculations contained in our financial statements, this calculation does not give effect to any estimate of forfeitures related to service-based vesting, but assumes that the named executive officer will perform the requisite service for the award to vest in full. The assumptions we used in valuing options are described in note 15 to our consolidated financial statements included in this prospectus. |
| (2) | See “—Employment Arrangements—Bonus Plans” below for a description of the material terms of the plan pursuant to which this compensation was awarded. |
Outstanding Equity Awards at December 31, 2013
The following table provides information about outstanding stock options held by each of our named executive officers at December 31, 2013. Our named executive officers did not hold any restricted stock or other stock awards as of December 31, 2013.
| Number of Securities Underlying Unexercised Options (#) |
||||||||||||||||||||
| Name |
Option Grant Date |
Exercisable(1) | Unexercisable | Option Exercise Price ($) |
Option Expiration Date |
|||||||||||||||
| Court Cunningham |
|
06/06/07 07/24/09 03/12/12 10/08/13 |
|
|
45,342 500,000 208,333 — |
|
|
— — 291,667 950,000 |
(2) (2) |
|
0.06 0.38 0.95 1.75 |
|
|
06/05/17 07/23/19 03/11/22 10/07/23 |
| |||||
| Eric Raab |
|
05/14/13 10/08/13 |
|
|
— — |
|
|
600,000 100,000 |
(2) (2) |
|
1.64 1.75 |
|
|
05/13/23 10/07/23 |
| |||||
| Fred Voccola |
05/14/13 | — | 600,000 | (2) | 1.64 | 05/13/23 | ||||||||||||||
| (1) | These stock options were fully vested as of March 31, 2014. |
| (2) | These stock options vest over a five-year period: 20% of the shares underlying the options vest on the first anniversary of the option grant date, and the remainder of the shares underlying the option vest in equal monthly installments over the next 48 months. |
Employment Arrangements
The initial terms and conditions of employment for each of our named executive officers are set forth in employee offer letters. These offer letters provide for accelerated vesting of specified equity awards following an acquisition and following termination within a specified period of time following an acquisition. Each letter also provides for 90 days’ notice of termination without cause or severance equal to 90 days’ of the employee’s base salary in lieu thereof. Each of our named executive officers is an at-will employee.
103
Table of Contents
The amount and terms of these benefits reflect the negotiations of each of our named executive officers with us. We consider these severance and change in control benefits critical to attracting and retaining high caliber executives. We believe that appropriately structured severance benefits, including accelerated vesting provisions, minimize the distractions and reduce the risk that an executive voluntarily terminates his or her employment with us during times of uncertainty, such as before an acquisition is completed. We believe that our existing arrangements allow each named executive officer to focus on continuing normal business operations and, for change in control benefits, on the success of a potential business combination, rather than on how business decisions that may be in the best interest of our stockholders will impact his or her own financial security.
The following table sets forth the current base salaries and fiscal year 2014 bonus targets of, and a summary of the material severance and acquisition arrangements with, our named executive officers:
| Named Executive Officer |
Fiscal Year 2014 Salary and |
Severance and Acquisition Benefits | ||
| Court Cunningham |
Salary: $391,400; 2014 Bonus Plan Target: $313,120 |
Severance: If we terminate Mr. Cunningham’s employment for any reason other than for cause, then in lieu of three months’ notice, we may pay him three months of his base salary. | ||
| Acquisition: If Mr. Cunningham is employed by Yodle immediately prior to the closing of a change of control transaction and, within one year, Mr. Cunningham’s employment is terminated without cause or Mr. Cunningham terminates his employment for good reason, then all unvested shares underlying his options will vest. | ||||
| Eric Raab |
Salary: $240,000; 2014 Bonus Plan Target: $72,000 |
Severance: If we terminate Mr. Raab’s employment for any reason other than for cause, then in lieu of three months’ notice, we may pay him three months of his base salary. | ||
| Acquisition: If Mr. Raab is employed by Yodle immediately prior to the closing of a change of control transaction and, within one year, Mr. Raab’s employment is terminated without cause or Mr. Raab terminates his employment for good reason, then all unvested shares underlying his options will vest. | ||||
| Fred Voccola |
Salary: $225,000; Brand Network Bonus Plan Target: $100,000 |
Severance: If we terminate Mr. Voccola’s employment for any reason other than for cause, then in lieu of three months’ notice, we may pay him three months of his base salary. | ||
| Acquisition: If Mr. Voccola is employed by Yodle immediately prior to the closing of a change of control transaction and, within one year, Mr. Voccola’s employment is terminated without cause or Mr. Voccola terminates his employment for good reason, then all unvested shares underlying his options will vest. | ||||
The definitions of “cause,” “good reason” and “change of control transaction” referenced above are defined in the individual offer letters with each of the named executive officers, respectively, or the applicable equity incentive plan under which the stock option was granted.
104
Table of Contents
Bonus Plans
Each of our named executive officers was or is, as the case may be, eligible to participate in our 2013 and 2014 bonus plans. The bonus plans are designed to incentivize and reward outstanding individual achievement, subject to the performance of Yodle. Bonuses under the 2013 bonus plan were measured semi-annually on June 30, 2013 and December 31, 2013 and paid on August 15, 2013 and February 15, 2014. Bonuses under the 2014 bonus plan will be measured annually on December 31, 2014 and paid on February 15, 2015, with a portion to be paid on August 15, 2014 based on performance through June 30, 2014. The annual target for the 2014 bonus plan is a percentage of each eligible employee’s base salary (prorated for any portion of a bonus period if the employee joined Yodle during the bonus period), 100% of which, in the case of our named executive officers, is subject to the achievement of certain corporate objectives, including revenue growth and Adjusted EBITDA targets.
Mr. Voccola is also eligible to earn an additional bonus under our General Manager, Yodle for Brand Networks Bonus Plan. This plan is designed to incentivize and reward achievement of revenue and contribution margin targets. Bonuses under this plan are measured semi-annually on June 30 and December 31 and paid 45 days thereafter. The semi-annual target is $50,000, subject to manager discretion.
Equity Incentive Plans
2014 Equity Incentive Plan
We expect that our board of directors will adopt and our stockholders will approve prior to the closing of this offering our 2014 Equity Incentive Plan, or our 2014 Plan. We do not expect to utilize our 2014 Plan until after the closing of this offering, at which point no further grants will be made under our 2007 Plan, as described below in the section of this prospectus titled “2007 Equity Incentive Plan.” No awards have been granted and no shares of our common stock have been issued under our 2014 Plan.
Stock Awards. The 2014 Plan will provide for the grant of incentive stock options within the meaning of Section 422 of the Internal Revenue Code of 1986, as amended, or the Code, nonstatutory stock options, stock appreciation rights, restricted stock awards, restricted stock unit awards, performance-based stock awards, and other forms of equity compensation (collectively, stock awards). Additionally, the 2014 Plan provides for the grant of performance cash awards. Incentive stock options may be granted only to employees. All other awards may be granted to employees, including officers, and to non-employee directors and consultants.
Share Reserve. Initially, the aggregate number of shares of our common stock that may be issued pursuant to stock awards under the 2014 Plan after the 2014 Plan becomes effective is the sum of (1) shares, (2) the number of shares reserved for issuance under our 2007 Plan at the time our 2014 Plan becomes effective, and (3) any shares subject to stock options or other stock awards granted under our 2007 Plan that would have otherwise returned to our 2007 Plan (such as upon the expiration or termination of a stock award prior to vesting). Additionally, the number of shares of our common stock reserved for issuance under our 2014 Plan will automatically increase on January 1 of each year, beginning on January 1, 2015 (assuming the 2014 Plan becomes effective before such date) and continuing through and including January 1, 2023, by % of the total number of shares of our capital stock outstanding on December 31 of the preceding calendar year, or a lesser number of shares determined by our board of directors. The maximum number of shares that may be issued upon the exercise of incentive stock options under our 2014 Plan is shares.
No person may be granted stock awards covering more than shares of our common stock under our 2014 Plan during any calendar year pursuant to stock options, stock appreciation rights and other stock awards whose value is determined by reference to an increase over an exercise or strike price of at least 100% of the fair market value on the date the stock award is granted. Additionally, no person may be granted in a calendar year a performance stock award covering more than shares or a performance cash award having a maximum value in excess of $ . Such limitations are designed to help assure that any deductions to which
105
Table of Contents
we would otherwise be entitled with respect to such awards will not be subject to the $1.0 million limitation on the income tax deductibility of compensation paid to any covered executive officer imposed by Section 162(m) of the Code.
If a stock award granted under the 2014 Plan expires or otherwise terminates without being exercised in full, or is settled in cash, the shares of our common stock not acquired pursuant to the stock award again will become available for subsequent issuance under the 2014 Plan. In addition, the following types of shares under the 2014 Plan may become available for the grant of new stock awards under the 2014 Plan: (1) shares that are forfeited to or repurchased by us prior to becoming fully vested; (2) shares withheld to satisfy income or employment withholding taxes; or (3) shares used to pay the exercise or purchase price of a stock award. Shares issued under the 2014 Plan may be previously unissued shares or reacquired shares bought by us on the open market. As of the date hereof, no awards have been granted and no shares of our common stock have been issued under the 2014 Plan.
Administration. Our board of directors, or a duly authorized committee thereof, has the authority to administer the 2014 Plan. Our board of directors may also delegate to one or more of our officers the authority to (1) designate employees (other than other officers) to be recipients of certain stock awards, and (2) determine the number of shares of common stock to be subject to such stock awards. Subject to the terms of the 2014 Plan, our board of directors or the authorized committee, referred to herein as the plan administrator, determines recipients, dates of grant, the numbers and types of stock awards to be granted and the terms and conditions of the stock awards, including the period of their exercisability and vesting schedule applicable to a stock award. Subject to the limitations set forth below, the plan administrator will also determine the exercise price, strike price or purchase price of awards granted and the types of consideration to be paid for the award.
The plan administrator has the authority to modify outstanding awards under our 2014 Plan. Subject to the terms of our 2014 Plan, the plan administrator has the authority to reduce the exercise, purchase or strike price of any outstanding stock award, cancel any outstanding stock award in exchange for new stock awards, cash or other consideration, or take any other action that is treated as a repricing under generally accepted accounting principles, with the consent of any adversely affected participant.
Stock Options. Incentive and nonstatutory stock options are granted pursuant to stock option agreements adopted by the plan administrator. The plan administrator determines the exercise price for a stock option, within the terms and conditions of the 2014 Plan, provided that the exercise price of a stock option generally cannot be less than 100% of the fair market value of our common stock on the date of grant. Options granted under the 2014 Plan vest at the rate specified by the plan administrator.
The plan administrator determines the term of stock options granted under the 2014 Plan, up to a maximum of 10 years. Unless the terms of an option holder’s stock option agreement provide otherwise, if an option holder’s service relationship with us, or any of our affiliates, ceases for any reason other than disability, death or cause, the option holder may generally exercise any vested options for a period of three months following the cessation of service. The option term may be extended in the event that exercise of the option following such a termination of service is prohibited by applicable securities laws or our insider trading policy. If an option holder’s service relationship with us or any of our affiliates ceases due to disability or death, or an option holder dies within a certain period following cessation of service, the option holder or a beneficiary may generally exercise any vested options for a period of 12 months in the event of disability and 18 months in the event of death. In the event of a termination for cause, options generally terminate immediately. In no event may an option be exercised beyond the expiration of its term.
Acceptable consideration for the purchase of common stock issued upon the exercise of a stock option will be determined by the plan administrator and may include (1) cash, check, bank draft or money order, (2) proceeds from a broker-assisted exercise, (3) the tender of shares of our common stock previously owned by the option holder, (4) a net exercise of the option if it is an nonqualified stock option, and (5) other legal consideration approved by the plan administrator.
106
Table of Contents
Unless the plan administrator provides otherwise, options generally are not transferable except by will, the laws of descent and distribution, or pursuant to a domestic relations order. An option holder may designate a beneficiary, however, who may exercise the option following the option holder’s death.
Tax Limitations on Incentive Stock Options. The aggregate fair market value, determined at the time of grant, of our common stock with respect to incentive stock options that are exercisable for the first time by an option holder during any calendar year under all of our stock plans may not exceed $100,000. Options or portions thereof that exceed such limit will generally be treated as nonqualified stock options. No incentive stock option may be granted to any person who, at the time of the grant, owns or is deemed to own stock possessing more than 10% of our total combined voting power or that of any of our affiliates unless (1) the option exercise price is at least 110% of the fair market value of the stock subject to the option on the date of grant, and (2) the term of the incentive stock option does not exceed five years from the date of grant.
Restricted Stock Awards. Restricted stock awards are granted pursuant to restricted stock award agreements adopted by the plan administrator. Restricted stock awards may be granted in consideration for (1) cash, check, bank draft or money order, (2) services rendered to us or our affiliates, or (3) any other form of legal consideration. Common stock acquired under a restricted stock award may, but need not, be subject to a share repurchase option in our favor in accordance with a vesting schedule to be determined by the plan administrator. Rights to acquire shares under a restricted stock award may be transferred only upon such terms and conditions as set by the plan administrator. Except as otherwise provided in the applicable award agreement, restricted stock unit awards that have not vested will be forfeited upon the participant’s cessation of continuous service for any reason.
Restricted Stock Unit Awards. Restricted stock unit awards are granted pursuant to restricted stock unit award agreements adopted by the plan administrator. Restricted stock unit awards may be granted in consideration for any form of legal consideration. A restricted stock unit award may be settled by cash, delivery of stock, a combination of cash and stock as deemed appropriate by the plan administrator, or in any other form of consideration set forth in the restricted stock unit award agreement. Additionally, dividend equivalents may be credited in respect of shares covered by a restricted stock unit award. Except as otherwise provided in the applicable award agreement, restricted stock units that have not vested will be forfeited upon the participant’s cessation of continuous service for any reason.
Stock Appreciation Rights. Stock appreciation rights are granted pursuant to stock appreciation grant agreements adopted by the plan administrator. The plan administrator determines the strike price for a stock appreciation right, which generally cannot be less than 100% of the fair market value of our common stock on the date of grant. Upon the exercise of a stock appreciation right, we will pay the participant an amount equal to (1) the excess of the per share fair market value of our common stock on the date of exercise over the strike price, multiplied by (2) the number of shares of common stock with respect to which the stock appreciation right is exercised. A stock appreciation right granted under the 2014 Plan vests at the rate specified in the stock appreciation right agreement as determined by the plan administrator.
The plan administrator determines the term of stock appreciation rights granted under the 2014 Plan, up to a maximum of ten years. Unless the terms of a participant’s stock appreciation right agreement provides otherwise, if a participant’s service relationship with us or any of our affiliates ceases for any reason other than cause, disability or death, the participant may generally exercise any vested stock appreciation right for a period of three months following the cessation of service. The stock appreciation right term may be further extended in the event that exercise of the stock appreciation right following such a termination of service is prohibited by applicable securities laws. If a participant’s service relationship with us, or any of our affiliates, ceases due to disability or death, or a participant dies within a certain period following cessation of service, the participant or a beneficiary may generally exercise any vested stock appreciation right for a period of 12 months in the event of disability and 18 months in the event of death. In the event of a termination for cause, stock appreciation rights generally terminate immediately upon the occurrence of the event giving rise to the termination of the individual for cause. In no event may a stock appreciation right be exercised beyond the expiration of its term.
107
Table of Contents
Performance Awards. If certain material terms of the 2014 Plan are approved by our stockholders after we are publicly traded, the 2014 Plan permits the grant of performance-based stock and cash awards that may qualify as performance-based compensation that is not subject to the $1.0 million limitation on the income tax deductibility of compensation paid to a covered executive officer imposed by Section 162(m) of the Code. To help assure that the compensation attributable to performance-based awards will so qualify, our compensation committee can structure such awards so that stock or cash will be issued or paid pursuant to such award only after the achievement of certain pre-established performance goals during a designated performance period.
The performance goals that may be selected include one or more of the following: (1) earnings (including earnings per share and net earnings); (2) earnings before interest, taxes and depreciation; (3) earnings before interest, taxes, depreciation and amortization; (4) total stockholder return; (5) return on equity or average stockholders’ equity; (6) return on assets, investment, or capital employed; (7) stock price; (8) margin (including gross margin); (9) income (before or after taxes); (10) operating income; (11) operating income after taxes; (12) pre-tax profit; (13) operating cash flow; (14) sales or revenue targets; (15) increases in revenue or product revenue; (16) expenses and cost reduction goals; (17) improvement in or attainment of working capital levels; (18) economic value added (or an equivalent metric); (19) market share; (20) cash flow; (21) cash flow per share; (22) share price performance; (23) debt reduction; (24) implementation or completion of projects or processes; (25) customer satisfaction; (26) stockholders’ equity; (27) capital expenditures; (28) debt levels; (29) operating profit or net operating profit; (30) workforce diversity; (31) growth of net income or operating income; (32) billings; and (33) to the extent that an award is not intended to comply with Section 162(m) of the Code, other measures of performance selected by our board of directors.
The performance goals may be based on a company-wide basis, with respect to one or more business units, divisions, affiliates, or business segments, and in either absolute terms or relative to the performance of one or more comparable companies or the performance of one or more relevant indices. Unless specified otherwise (1) in the award agreement at the time the award is granted or (2) in such other document setting forth the performance goals at the time the goals are established, we will appropriately make adjustments in the method of calculating the attainment of performance goals as follows: (a) to exclude restructuring and/or other nonrecurring charges; (b) to exclude exchange rate effects, as applicable, for non-U.S. dollar denominated goals; (c) to exclude the effects of changes to generally accepted accounting principles; (d) to exclude the effects of any statutory adjustments to corporate tax rates; and (e) to exclude the effects of any “extraordinary items” as determined under generally accepted accounting principles. In addition, we retain the discretion to reduce or eliminate the compensation or economic benefit due upon attainment of the goals. The performance goals may differ from participant to participant and from award to award.
Other Stock Awards. The plan administrator may grant other awards based in whole or in part by reference to our common stock. The plan administrator will set the number of shares under the stock award and all other terms and conditions of such awards.
Changes to Capital Structure. In the event that there is a specified type of change in our capital structure, such as a stock split or recapitalization, appropriate adjustments will be made to (1) the class and maximum number of shares reserved for issuance under the 2014 Plan, (2) the class and maximum number of shares by which the share reserve may increase automatically each year, (3) the class and maximum number of shares that may be issued upon the exercise of incentive stock options, (4) the class and maximum number of shares subject to stock awards that can be granted in a calendar year (as established under the 2014 Plan pursuant to Section 162(m) of the Code) and (5) the class and number of shares and exercise price, strike price, or purchase price, if applicable, of all outstanding stock awards.
Corporate Transactions. In the event of certain specified significant corporate transactions, the plan administrator has the discretion to take any of the following actions with respect to stock awards:
| • | arrange for the assumption, continuation or substitution of a stock award by a surviving or acquiring entity or parent company; |
108
Table of Contents
| • | arrange for the assignment of any reacquisition or repurchase rights held by us to the surviving or acquiring entity or parent company; |
| • | accelerate the vesting of the stock award and provide for its termination prior to the effective time of the corporate transaction; |
| • | arrange for the lapse of any reacquisition or repurchase right held by us; |
| • | cancel or arrange for the cancellation of the stock award in exchange for such cash consideration, if any, as our board of directors may deem appropriate; or |
| • | make a payment equal to the excess of (1) the value of the property the participant would have received upon exercise of the stock award over (2) the exercise price otherwise payable in connection with the stock award. |
Our plan administrator is not obligated to treat all stock awards, even those that are of the same type, in the same manner.
Under the 2014 Plan, a corporate transaction is generally the consummation of (1) a sale or other disposition of all or substantially all of our consolidated assets, (2) a sale or other disposition of at least 90% of our outstanding securities, (3) a merger, consolidation or similar transaction following which we are not the surviving corporation, or (4) a merger, consolidation or similar transaction following which we are the surviving corporation but the shares of our common stock outstanding immediately prior to such transaction are converted or exchanged into other property by virtue of the transaction.
Change in Control. The plan administrator may provide, in an individual award agreement or in any other written agreement between a participant and us that the stock award will be subject to additional acceleration of vesting and exercisability in the event of a change in control. Under the 2014 Plan, a change in control is generally (1) the acquisition by a person or entity of more than 50% of our combined voting power other than by merger, consolidation or similar transaction; (2) a consummated merger, consolidation or similar transaction immediately after which our stockholders cease to own more than 50% of the combined voting power of the surviving entity; or (3) a consummated sale, lease or exclusive license or other disposition of all or substantially all of our consolidated assets.
Amendment and Termination. Our board of directors has the authority to amend, suspend, or terminate our 2014 Plan, provided that such action does not materially impair the existing rights of any participant without such participant’s written consent. No incentive stock options may be granted after the tenth anniversary of the date our board of directors adopted our 2014 Plan.
2014 Employee Stock Purchase Plan
We expect that our board will adopt and our stockholders will approve prior to the closing of this offering our 2014 Employee Stock Purchase Plan, or our 2014 ESPP. We do not expect to grant purchase rights under our 2014 ESPP until after the closing of this offering.
The maximum number of shares of our common stock that may be issued under our 2014 ESPP is shares. Additionally, the number of shares of our common stock reserved for issuance under our 2014 ESPP will automatically increase on January 1 of each year, beginning on January 1 of the year after the closing of this offering and ending on and including January 1, 2024, by the lesser of (1) % of the total number of shares of our common stock outstanding on December 31 of the preceding calendar year, (2) shares of our common stock, or (3) such lesser number of shares of common stock as determined by our board of directors. Shares subject to purchase rights granted under our 2014 ESPP that terminate without having been exercised in full will not reduce the number of shares available for issuance under our 2014 ESPP.
Our board of directors, or a duly authorized committee thereof, will administer our 2014 ESPP. Our board of directors has delegated its authority to administer our 2014 ESPP to our compensation committee under the terms of the compensation committee’s charter.
109
Table of Contents
Employees, including executive officers, of ours or any of our designated affiliates may have to satisfy one or more of the following service requirements before participating in our 2014 ESPP, as determined by the administrator: (1) customary employment with us or one of our affiliates for more than 20 hours per week and more than five months per calendar year, or (2) continuous employment with us or one of our affiliates for a minimum period of time, not to exceed two years, prior to the first date of an offering. An employee may not be granted rights to purchase stock under our 2014 ESPP if such employee (a) immediately after the grant would own stock possessing 5% or more of the total combined voting power or value of all classes of our common stock, and (b) holds rights to purchase stock under our 2014 ESPP that would accrue at a rate that exceeds $25,000 worth of our stock for each calendar year that the rights remain outstanding.
Our 2014 ESPP is intended to qualify as an employee stock purchase plan under Section 423 of the Code. The administrator may specify offerings with a duration of not more than 27 months, and may specify one or more shorter purchase periods within each offering. Each offering will have one or more purchase dates on which shares of our common stock will be purchased for the employees who are participating in the offering. The administrator, in its discretion, will determine the terms of offerings under our 2014 ESPP.
Our 2014 ESPP permits participants to purchase shares of our common stock through payroll deductions up to 15% of their earnings. Unless otherwise determined by the administrator, the purchase price of the shares will be 85% of the lower of the fair market value of our common stock on the first day of an offering or on the date of purchase. Participants may end their participation at any time during an offering and will be paid their accrued contributions that have not yet been used to purchase shares. Participation ends automatically upon termination of employment with us.
A participant may not transfer purchase rights under our 2014 ESPP other than by will, the laws of descent and distribution or as otherwise provided under our 2014 ESPP.
In the event of a specified corporate transaction, such as a merger or change in control, a successor corporation may assume, continue or substitute each outstanding purchase right. If the successor corporation does not assume, continue or substitute for the outstanding purchase rights, the offering in progress will be shortened and a new exercise date will be set. The participants’ purchase rights will be exercised on the new exercise date and such purchase rights will terminate immediately thereafter.
Our board of directors has the authority to amend, suspend or terminate our 2014 ESPP, at any time and for any reason. Our 2014 ESPP will remain in effect until terminated by our board of directors in accordance with the terms of the 2014 ESPP.
2007 Equity Incentive Plan
Our board of directors and our stockholders approved our 2007 Equity Incentive Plan, or 2007 Plan, which became effective in May 2007, and was further amended by our board of directors and stockholders, most recently in October 2013. As of May 31, 2014, there were 1,170,473 shares remaining available for the grant of stock awards under our 2007 Plan and there were outstanding stock awards covering a total of 21,929,642 shares that were granted under our 2007 Plan. Following this offering, no further grants will be made under our 2007 Plan and all outstanding stock awards granted under our 2007 Plan will continue to be governed by the terms of our 2007 Plan.
Stock Awards. Our 2007 Plan provides for the grant of incentive stock options to our employees, and for the grant of nonstatutory stock options, bonus shares, stock awards, performance shares and the right to purchase restricted stock to our employees, non-employee directors and consultants, collectively, “stock awards.”
Share Reserve. The aggregate number of shares of our common stock reserved for issuance pursuant to stock awards under the 2007 Plan is 34,353,663 shares, subject to adjustment as provided in the 2007 Plan.
110
Table of Contents
Administration. Our board of directors, or a duly authorized committee thereof, each referred to herein as the plan administrator, has the authority to administer the 2007 Plan. Our board of directors may also delegate to an officer the authority to (1) designate employees (other than other officers) to be recipients of certain stock awards, and (2) determine the number of shares of common stock to be subject to such stock awards. Subject to the terms of the 2007 Plan, the plan administrator determines recipients, dates of grant, the numbers and types of stock awards to be granted and the terms and conditions of the stock awards, including the period of their exercisability and vesting schedule applicable to a stock award. Subject to the limitations set forth below, the plan administrator will also determine the exercise price, strike price or purchase price of awards granted and the types of consideration to be paid for the award. The plan administrator has the authority to modify outstanding awards under our 2007 Plan. Subject to the terms of the 2007 Plan, the plan administrator has full authority and discretion to interpret the plan and prescribe and rescind rules and regulations related to it.
Stock Options. Incentive and nonstatutory stock options are granted pursuant to stock option agreements adopted by the plan administrator. The plan administrator determines the exercise price for a stock option, within the terms and conditions of the 2007 Plan, provided that the exercise price of an option generally cannot be less than 100% of the fair market value of our common stock on the date of grant. Options granted under the 2007 Plan vest at the rate specified by the plan administrator.
The plan administrator determines the term of stock options granted under the 2007 Plan, up to a maximum of 10 years. Unless the terms of an option holder’s stock option agreement provide otherwise, if an option holder’s service relationship with us, or any of our affiliates, ceases for any reason other than disability or death, the option holder may generally exercise any vested options for a period of 90 days following the cessation of service. If an option holder’s service relationship with us or any of our affiliates ceases due to disability or death, the option holder or a beneficiary may generally exercise any vested options for a period of 12 months. In no event may an option be exercised beyond the expiration of its term.
Acceptable consideration for the purchase of common stock issued upon the exercise of a stock option will be determined by the plan administrator and may include cash or, at the discretion of the plan administrator, by (1) delivery of a promissory note, (2) proceeds from a broker-assisted exercise and (3) any combination of such forms.
Unless the plan administrator provides otherwise, options generally are not transferable or assignable except by will or the laws of descent and distribution.
Tax Limitations on Incentive Stock Options. The aggregate fair market value, determined at the time of grant, of our common stock with respect to incentive stock options that are exercisable for the first time by an option holder during any calendar year under all of our stock plans may not exceed $100,000. Options or portions thereof that exceed such limit will generally be treated as nonqualified stock options. No incentive stock option may be granted to any person who, at the time of the grant, owns or is deemed to own stock possessing more than 10% of our total combined voting power or that of any of our affiliates unless (1) the option exercise price is at least 110% of the fair market value of the stock subject to the option on the date of grant, and (2) the term of the incentive stock option does not exceed five years from the date of grant.
Restricted Stock Awards. Restricted stock awards are granted pursuant to restricted stock award agreements adopted by the plan administrator. Restricted stock award agreements conform to the terms and conditions of the 2007 Plan to the extent applicable, and may contain such other provisions as the plan administrator deems advisable that are consistent with the terms of the 2007 Plan, including but not limited to transfer restrictions, rights of refusal, vesting provisions, repurchase rights, lock-up provisions, drag-along rights and such other restrictions as the plan administrator deems appropriate.
Changes to Capital Structure. In the event that there is a specified type of change in our capital structure, such as a stock split or recapitalization, appropriate adjustments will be made to (1) the number of shares available for future grants under the 2007 Plan, and (2) the number of shares covered by, and the exercise price of, each outstanding option.
111
Table of Contents
Corporate Transactions. In the event of a consolidation, merger or sale of assets or stock of the company, the plan administrator may take one or more of the following actions with respect to outstanding stock awards: (1) make appropriate provision for the continuation or substitution of such options; (2) accelerate the date of exercise of such options or of any installment of any such options; (3) upon written notice to the optionees, provide that all options must be exercised, to the extent then exercisable, within a specified number of days of the date of such notice, at the end of which period the options shall terminate; (4) terminate all vested options in exchange for a cash payment equal to the excess of the fair market value of the shares subject to such options (to the extent then exercisable) over the exercise price thereof; or (5) in the event of a stock sale, require that the optionee sell to the purchaser to whom such stock sale is to be made, all shares previously issued to such optionee upon exercise of any option, at a price equal to the portion of the net consideration from such sale which is attributable to such shares.
Amendment and Termination. The 2007 Plan will terminate in May 2017. However, our board of directors has the authority to amend, suspend or terminate our 2007 Plan. As noted above, in connection with this offering, our 2007 Plan will be terminated and no further awards will be granted thereunder. All outstanding awards under the 2007 Plan will continue to be governed by their existing terms.
401(k) Plan
We maintain a tax-qualified retirement plan that provides eligible U.S. employees with an opportunity to save for retirement on a tax advantaged basis. Eligible employees are able to defer eligible compensation subject to applicable annual Code limits. Currently, we do not make matching contributions or discretionary contributions to the 401(k) plan. Employees’ pre-tax contributions are allocated to each participant’s individual account and are then invested in selected investment alternatives according to the participants’ directions. Employees are immediately and fully vested in their contributions. The 401(k) plan is intended to be qualified under Section 401(a) of the Code with the 401(k) plan’s related trust intended to be tax exempt under Section 501(a) of the Code. As a tax-qualified retirement plan, contributions to the 401(k) plan and earnings on those contributions are not taxable to the employees until distributed from the 401(k) plan.
Limitations on Liability and Indemnification Matters
Upon completion of this offering, our certificate of incorporation will contain provisions that limit the liability of our current and former directors for monetary damages to the fullest extent permitted by Delaware law. Delaware law provides that directors of a corporation will not be personally liable for monetary damages for any breach of fiduciary duties as directors, except liability for:
| • | any breach of the director’s duty of loyalty to the corporation or its stockholders; |
| • | any act or omission not in good faith or that involves intentional misconduct or a knowing violation of law; |
| • | unlawful payments of dividends or unlawful stock repurchases or redemptions as provided in Section 174 of the Delaware General Corporation Law; or |
| • | any transaction from which the director derived an improper personal benefit. |
This limitation of liability does not apply to liabilities arising under federal securities laws and does not affect the availability of equitable remedies such as injunctive relief or rescission.
Our certificate of incorporation and our bylaws will provide that we are required to indemnify our directors to the fullest extent permitted by Delaware law. Our bylaws will also provide that, upon satisfaction of certain conditions, we are required to advance expenses incurred by a director in advance of the final disposition of any action or proceeding, and permit us to secure insurance on behalf of any officer, director, employee or other agent for any liability arising out of his or her actions in that capacity regardless of whether we would otherwise
112
Table of Contents
be permitted to indemnify him or her under the provisions of Delaware law. Our bylaws will also provide our board of directors with discretion to indemnify our officers and employees when determined appropriate by the board. We have entered and expect to continue to enter into agreements to indemnify our directors, executive officers and other employees as determined by the board of directors. With certain exceptions, these agreements provide for indemnification for related expenses including, among other things, attorneys’ fees, judgments, fines and settlement amounts incurred by any of these individuals in any action or proceeding. We believe that these bylaw provisions and indemnification agreements are necessary to attract and retain qualified persons as directors and officers. We also maintain customary directors’ and officers’ liability insurance.
The limitation of liability and indemnification provisions in our certificate of incorporation and bylaws may discourage stockholders from bringing a lawsuit against our directors for breach of their fiduciary duty. They may also reduce the likelihood of derivative litigation against our directors and officers, even though an action, if successful, might benefit us and other stockholders. Further, a stockholder’s investment may be adversely affected to the extent that we pay the costs of settlement and damage awards against directors and officers as required by these indemnification provisions. At present, there is no pending litigation or proceeding involving any of our directors, officers or employees for which indemnification is sought and we are not aware of any threatened litigation that may result in claims for indemnification.
Rule 10b5-1 Sales Plans
Our directors, executive officers and certain of our other employees may adopt written plans, known as Rule 10b5-1 plans, in which they will contract with a broker to buy or sell shares of our common stock on a periodic basis. Under a Rule 10b5-1 plan, a broker executes trades pursuant to parameters established by the director, executive officer or other employee when entering into the plan, without further direction from them. The director, executive officer or other employee may amend a Rule 10b5-1 plan in some circumstances and may terminate a plan at any time. Our directors, executive officers and certain of our other employees also may buy or sell additional shares outside of a Rule 10b5-1 plan when they are not in possession of material nonpublic information subject to compliance with the terms of our insider trading policy. Prior to 180 days after the date of this offering, subject to potential extension or early termination, the sale of any shares under such plan would be subject to any lock-up agreement that such director, executive officer or other employee has entered into.
113
Table of Contents
CERTAIN RELATIONSHIPS AND RELATED PARTY TRANSACTIONS
The following is a summary of transactions since January 1, 2011 to which we were a participant, in which the amount involved exceeded or will exceed $120,000, and in which any of our then directors, executive officers or holders of more than 5% of any class of our capital stock at the time of such transaction, or any members of their immediate family, had or will have a direct or indirect material interest, other than compensation arrangements which are described under the sections of this prospectus titled “Management—Non-Employee Director Compensation” and “Executive and Director Compensation.”
Sales of Series F Preferred Stock
In February 2013, we sold an aggregate of 1,666,667 shares of our Series F preferred stock at a price of $3.00 per share for an aggregate price of approximately $5.0 million. The following table summarizes purchases of shares of our Series F preferred stock by our directors, executive officers and holders of more than 5% of any class of our capital stock as of the date of such transaction:
| Related Party |
Shares of Series F Preferred Stock Purchased (#) |
Aggregate Purchase Price ($) |
||||||
| Entities affiliated with Bessemer Venture Partners(1) |
786,307 | 2,358,921 | ||||||
| Entities affiliated with Draper Fisher Jurvetson(2) |
644,916 | 1,934,748 | ||||||
| JAFCO Technology Partners III, L.P.(3) |
224,913 | 674,739 | ||||||
|
|
|
|
|
|||||
| Total |
1,656,136 | $ | 4,968,408 | |||||
|
|
|
|
|
|||||
| (1) | Includes 589,730 shares purchased by Bessemer Venture Partners VI L.P. and 196,577 shares purchased by Bessemer Venture Partners Co-Investment L.P. Rob Stavis, a partner at Bessemer Venture Partners, is a member of our board of directors. |
| (2) | Includes 473,725 shares purchased by Draper Fisher Jurvetson Fund IX, L.P., 12,837 shares purchased by Draper Fisher Jurvetson Partners IX, LLC, 130,906 shares purchased by Draper Fisher Jurvetson Growth Fund 2006, L.P., 10,583 shares purchased by Draper Fisher Jurvetson Partners Growth Fund 2006, LLC and 16,865 shares purchased by Draper Associates Riskmasters Fund III, LLC. Andreas Stavropoulos, a partner at DFJ, is a member of our board of directors. |
| (3) | Tom Mawhinney, a member of our board of directors, is affiliated with JAFCO Technology Partners III, L.P. |
ProfitFuel Acquisition and Financing
On May 23, 2011, we acquired 100% of ProfitFuel, Inc., or ProfitFuel, a privately held search-engine optimization firm. As consideration for this acquisition, we (1) paid approximately $15.3 million in cash at closing, (2) issued an aggregate of 13,000,000 shares of our common stock at a fair value of $1.51 per share and (3) promised to pay a deferred cash payment of $7.5 million, which was paid in 2012.
Issuance of Common Stock, Restricted Stock, Convertible Promissory Notes and Warrants
In connection with this acquisition, we also issued $9.0 million aggregate principal amount of convertible promissory notes, as well as warrants to purchase an aggregate of $900,000 of our capital stock (initially equal to 10% of the aggregate principal amount of the convertible promissory notes) to certain of our preferred stockholders, as listed below. Proceeds from this bridge financing were used to fund the acquisition.
In connection with our acquisition of ProfitFuel, directors, executive officers and holders of more than 5% of any class of our capital stock as of the date of such transaction received the following:
| • | Pursuant to the terms of the merger agreement, David Rubin, our Chief Revenue Officer and former Chief Executive Officer and shareholder of ProfitFuel, received (1) 6,037,392 shares of our common stock in exchange for his equity ownership in ProfitFuel and (2) 1,078,200 shares of restricted stock that, as of December 31, 2013, were fully vested, in exchange for his agreement to become a Yodle employee upon the closing of the acquisition. |
114
Table of Contents
| • | The warrants issued in connection with the bridge financing were amended and restated as of September 21, 2012 to account for certain adjustments, as provided by the terms of the original warrants. As of December 31, 2013, the warrants were exercisable for an aggregate of 1,537,917 shares of our Series D preferred stock at an exercise price of $1.4045 per share. The following table summarizes the warrants held, as of December 31, 2013, by our directors, executive officers and holders of more than 5% of any class of our capital stock as of the date of original issuance of the warrants: |
| Related Party |
Shares of Series D Preferred Stock Issuable Upon Exercise (#) |
|||
| Entities affiliated with Bessemer Venture Partners(1) |
736,631 | |||
| Entities affiliated with Draper Fisher Jurvetson(2) |
577,833 | |||
| JAFCO Technology Partners III, L.P.(3) |
213,458 | |||
|
|
|
|||
| Total |
1,527,922 | |||
|
|
|
|||
| (1) | Includes a warrant to purchase 552,473 shares held by Bessemer Venture Partners VI L.P. and a warrant to purchase 184,158 shares held by Bessemer Venture Partners Co-Investment L.P. Rob Stavis, a partner at Bessemer Venture Partners, is a member of our board of directors. |
| (2) | Includes a warrant to purchase 426,757 shares held by Draper Fisher Jurvetson Fund IX, L.P., a warrant to purchase 11,565 shares held by Draper Fisher Jurvetson Partners IX, LLC, a warrant to purchase 115,019 shares held by Draper Fisher Jurvetson Growth Fund 2006, L.P., a warrant to purchase 9,299 shares held by Draper Fisher Jurvetson Partners Growth Fund 2006, LLC and a warrant to purchase 15,193 shares held by Draper Associates, L.P. Andreas Stavropoulos, a partner at DFJ, is a member of our board of directors. |
| (3) | Tom Mawhinney, a member of our board of directors, is affiliated with JAFCO Technology Partners III, L.P. |
Issuance of Series D Preferred Stock
In September 2012, we issued an aggregate of 7,274,827 shares of our Series D preferred stock upon the full conversion of the notes described above, including all accrued and unpaid interest thereon. The following table summarizes the number of shares of our Series D preferred stock received as a result of such conversion by our directors, executive officers and holders of more than 5% of any class of our capital stock as of the date of such conversion:
| Related Party |
Shares of Series D Preferred Stock Received (#) |
|||
| Entities affiliated with Bessemer Venture Partners(1) |
3,484,497 | |||
| Entities affiliated with Draper Fisher Jurvetson(2) |
2,733,330 | |||
| JAFCO Technology Partners III, L.P.(3) |
1,009,724 | |||
|
|
|
|||
| Total |
7,227,551 | |||
|
|
|
|||
| (1) | Includes 871,124 shares received by Bessemer Venture Partners Co-Investment L.P. and 2,613,373 shares received by Bessemer Venture Partners VI L.P. Rob Stavis, a partner at Bessemer Venture Partners, is a member of our board of directors. |
| (2) | Includes 2,018,697 shares received by Draper Fisher Jurvetson Fund IX, L.P., 54,704 shares purchased by Draper Fisher Jurvetson Partners IX, LLC, 71,866 shares received by Draper Associates Riskmasters Fund, LLC, 544,076 shares received by Draper Fisher Jurvetson Growth Fund 2006, L.P. and 43,987 shares received by Draper Fisher Jurvetson Partners Growth Fund 2006, LLC. Andreas Stavropoulos, a partner at DFJ, is a member of our board of directors. |
| (3) | Tom Mawhinney, a member of our board of directors, is affiliated with JAFCO Technology Partners III, L.P. |
Agreement with Nathaniel V. Stevens and related Subordinated Promissory Note
In September 2011, we entered into an agreement with Nathaniel V. Stevens, one of our founders, a former holder of more than 5% of our common stock and a former member of our board of directors, for the purchase
115
Table of Contents
and sale of up to 5,000,000 shares of our common stock at a price per share equal to $0.82. Pursuant to the terms of the agreement, Mr. Stevens resigned from our board of directors. We also agreed to assist Mr. Stevens with the sale of additional shares of our common stock held by him, which obligation terminated on June 21, 2014.
On November 18, 2011, we purchased 3,000,000 shares of our common stock from Mr. Stevens and delivered a subordinated promissory note in the principal amount of approximately $2.5 million, or the promissory note, to Stevens Ventures, LP (an entity wholly owned and controlled by Mr. Stevens) as payment in-full for such purchased shares. The promissory note accrued interest at a rate of 3.3% per annum and matured upon the earlier to occur of June 21, 2014 and the consummation of this offering. On June 20, 2014, we repaid all of our outstanding obligations under the promissory note in full.
Family Relationships
Jerry Franklin, a Director of Sales for Yodle, is the brother-in-law of David Rubin, a strategic advisor and member of our board of directors. Compensation, including salary, bonus, commissions, perquisites and other compensation, earned by Mr. Franklin for the years ended December 31, 2011, 2012 and 2013 was $132,842, $225,788 and $225,675, respectively. He was also granted 102,000 shares of restricted stock on May 23, 2011, 5,000 stock options on September 14, 2011 with an exercise price of $0.95, 7,500 stock options on September 19, 2012 with an exercise price of $1.19 and 30,000 stock options on October 8, 2013 with an exercise price of $1.75.
Investors’ Rights Agreement
We have entered into a fourth amended and restated investors’ rights agreement with our preferred stockholders, including entities affiliated with Bessemer Venture Partners, entities affiliated with Draper Fisher Jurvetson, JAFCO Technology Partners III, L.P., Court Cunningham and Michael Gordon. The fourth amended and restated investors’ rights agreement, among other things:
| • | grants these stockholders specified registration rights with respect to shares of our common stock issued or issuable upon conversion of the shares of preferred stock held by them; |
| • | obligates us to deliver periodic financial statements to certain of these stockholders; |
| • | grants certain of these stockholders inspection rights; and |
| • | grants certain of these stockholders a right of first refusal with respect to sales of our shares by us, subject to specified exclusions, which exclusions include the sale of the shares pursuant to this prospectus, to the stockholders who are parties to the fourth amended and restated investors’ rights agreement. |
For more information regarding the registration rights provided in this agreement, please refer to the section of this prospectus titled “Description of Capital Stock—Registration Rights.” The provisions of this agreement, other than those relating to registration rights, will terminate immediately before the consummation of this offering. This summary discusses certain material provisions of the fourth amended and restated investors’ rights agreement and is qualified by the full text of the fourth amended and restated investors’ rights agreement filed as an exhibit to the registration statement of which this prospectus is a part.
Voting Agreement
We have entered into a fourth amended and restated voting agreement with certain of our stockholders, including entities affiliated with Bessemer Venture Partners, entities affiliated with Draper Fisher Jurvetson, JAFCO Technology Partners III, L.P., Court Cunningham, Michael Gordon, David Rubin and Fred Voccola. The fourth amended and restated voting agreement, among other things:
| • | provides for the voting of shares with respect to the constituency of our board of directors; and |
116
Table of Contents
| • | provides for the voting of shares with respect to specified transactions approved by our board of directors and the requisite majority of holders of our outstanding preferred stock. |
The fourth amended and restated voting agreement, except for the market stand-off provision contained therein, will terminate upon the consummation of this offering.
Right of First Refusal and Co-Sale Agreement
We have entered into a fourth amended and restated right of first refusal and co-sale agreement with certain of our stockholders, including entities affiliated with Bessemer Venture Partners, entities affiliated with Draper Fisher Jurvetson, JAFCO Technology Partners III, L.P., Court Cunningham, Michael Gordon, David Rubin and Fred Voccola. The fourth amended and restated right of first refusal and co-sale agreement, among other things:
| • | grants us rights of first refusal with respect to proposed transfers of our securities by specified stockholders; and |
| • | grants secondary rights of refusal and right of co-sale to certain of these stockholders with respect to proposed transfers of our securities by specified stockholders. |
The fourth amended and restated right of first refusal and co-sale agreement will terminate immediately prior to and subject to the consummation of this offering.
Employment Offer Letters
We have entered into employment offer letters with our executive officers that, among other things, provide for certain severance and acquisition benefits. For more information regarding these agreements with our named executive officers, see the section of this prospectus titled “Executive and Director Compensation—Employment Arrangements.”
Stock Option Grants to Executive Officers and Directors
We have granted stock options to certain of our directors and executive officers. For more information regarding the stock options granted to our directors and named executive officers see the section of this prospectus titled “Management—Non-Employee Director Compensation” and “Executive and Director Compensation—Outstanding Equity Awards at December 31, 2013.”
Indemnification Agreements
In connection with this offering, we will enter into indemnification agreements with each of our directors, executive officers and certain of our other employees as determined by the board in its discretion. These agreements will provide that we will indemnify each of our directors, executive officers and certain of our other employees against any and all expenses incurred by that director, executive officer or other employee because of his or her status as one of our directors, executive officers or other employees to the fullest extent permitted by Delaware law, our amended and restated certificate of incorporation and our amended and restated bylaws, as will be in effect upon the completion of this offering, except in a proceeding initiated by such director, executive officer or other employee without board of director approval. In addition, the agreements will generally provide that, to the fullest extent permitted by Delaware law, we will advance all expenses incurred by our directors, executive officers and other employees in connection with a legal proceeding.
Related Person Transaction Policy
Prior to this offering, we have not had a formal policy regarding approval of transactions with related parties. Prior to the completion of this offering, we expect to adopt a related person transaction policy that sets forth our procedures for the identification, review, consideration and approval or ratification of related person
117
Table of Contents
transactions. The policy will become effective immediately upon the execution of the underwriting agreement for this offering. For purposes of our policy only, a related person transaction is a transaction, arrangement or relationship, or any series of similar transactions, arrangements or relationships, in which we and any related person are, were or will be participants in which the amount involves exceeds $120,000. Transactions involving compensation for services provided to us as an employee or director are not covered by this policy. A related person is any executive officer, director or beneficial owner of more than 5% of any class of our voting securities, including any of their immediate family members and any entity owned or controlled by such persons.
Under the policy, if a transaction has been identified as a related person transaction, including any transaction that was not a related person transaction when originally consummated or any transaction that was not initially identified as a related person transaction prior to consummation, our management must present information regarding the related person transaction to our audit committee, or, if audit committee approval would be inappropriate, to another independent body of our board of directors, for review, consideration and approval or ratification. The presentation must include a description of, among other things, the material facts, the interests, direct and indirect, of the related persons, the benefits to us of the transaction and whether the transaction is on terms that are comparable with the terms available to or from, as the case may be, an unrelated third party or to or from employees generally. Under the policy, we will collect information that we deem reasonably necessary from each director, executive officer and, to the extent feasible, significant stockholder to enable us to identify any existing or potential related person transactions and to effectuate the terms of the policy.
In addition, under our Code of Business Conduct and Ethics, which we intend to adopt in connection with this offering, our employees and directors have an affirmative responsibility to disclose any transaction or relationship that reasonably could be expected to give rise to a conflict of interest.
In considering related person transactions, our audit committee, or other independent body of our board of directors, will take into account the relevant available facts and circumstances including, but not limited to:
| • | the risks, costs and benefits to us; |
| • | the impact on a director’s independence in the event that the related person is a director, immediate family member of a director or an entity with which a director is affiliated; |
| • | the availability of other sources for comparable offerings; and |
| • | the terms available to or from, as the case may be, unrelated third parties or to or from employees generally. |
The policy requires that, in determining whether to approve, ratify or reject a related person transaction, our audit committee, or other independent body of our board of directors, must consider, in light of known circumstances, whether the transaction is in, or is not inconsistent with, our best interests and those of our stockholders, as our audit committee, or other independent body of our board of directors, determines in the good faith exercise of its discretion.
All of the transactions described above were entered into prior to the adoption of the written policy, but all were approved by our board of directors considering similar factors to those described above.
118
Table of Contents
PRINCIPAL AND SELLING STOCKHOLDERS
The following table sets forth the beneficial ownership of our common stock as of May 31, 2014, as adjusted to reflect the sale of common stock offered by us and the selling stockholders in this offering, for:
| • | each person, or group of affiliated persons, who is known by us to beneficially own more than 5% of our common stock; |
| • | each of our named executive officers; |
| • | each of our directors; |
| • | all of our executive officers and directors as a group; and |
| • | each of the selling stockholders. |
The percentage ownership information shown in the table prior to this offering is based upon shares of common stock outstanding as of May 31, 2014, after giving effect to the conversion of all outstanding shares of preferred stock into shares of our common stock (assuming a conversion ratio equal to common shares for each Series F preferred share based on an assumed initial public offering price of $ per share, which is the midpoint of the range set forth on the cover page of this prospectus), as well as the automatic net exercise of preferred stock warrants into shares of our common stock, each of which will occur automatically upon the closing of this offering. See “Prospectus Summary—The Offering” for a description of the number of shares issuable upon conversion of our Series F preferred stock, which depends on the initial public offering price of our common stock. The percentage ownership information shown in the table after this offering is based upon shares, assuming the sale of shares of our common stock by us in the offering and no exercise of the underwriters’ over-allotment option. The percentage ownership information shown in the table after this offering if the underwriters’ over-allotment option is exercised in full is based upon shares, assuming the sale of shares of our common stock by us pursuant to the underwriters’ option.
We have determined beneficial ownership in accordance with the rules of the SEC. These rules generally attribute beneficial ownership of securities to persons who possess sole or shared voting power or investment power with respect to those securities. In addition, the rules include shares of common stock issuable pursuant to the exercise of stock options or warrants that are either immediately exercisable or exercisable on or before July 30, 2014, which is 60 days after May 31, 2014. These shares are deemed to be outstanding and beneficially owned by the person holding those options or warrants for the purpose of computing the percentage ownership of that person, but they are not treated as outstanding for the purpose of computing the percentage ownership of any other person. Unless otherwise indicated, the persons or entities identified in this table have sole voting and investment power with respect to all shares shown as beneficially owned by them, subject to applicable community property laws.
119
Table of Contents
Except as otherwise noted below, the address for persons listed in the table is c/o Yodle, Inc., 50 West 23rd Street, Suite 401, New York, NY 10010.
| Shares Beneficially Owned Prior to this Offering |
Number of Shares Offered |
Shares Beneficially Owned After this Offering |
Number of Shares to be Sold if Underwriters’ Option is Exercised in Full |
Shares Beneficially Owned After this Offering if Underwriters’ Option is Exercised in Full | ||||||||||||||||
| Name of Beneficial Owner |
Shares | Percentage | Shares | Percentage | Shares | Percentage | ||||||||||||||
| 5% Stockholders: |
||||||||||||||||||||
| Entities affiliated with Bessemer Venture Partners(1) |
37,512,743 | 29.7 | % | |||||||||||||||||
| Entities affiliated with Draper Fisher Jurvetson(2) |
30,767,343 | 24.4 | ||||||||||||||||||
| JAFCO Technology |
10,974,051 | 8.7 | ||||||||||||||||||
| David Rubin(4) |
6,373,507 | 5.0 | ||||||||||||||||||
| Named Executive Officers and Directors: |
||||||||||||||||||||
| Court Cunningham(5) |
5,164,710 | 4.1 | ||||||||||||||||||
| Eric Raab(6) |
152,083 | * | ||||||||||||||||||
| Fred Voccola(7) |
262,500 | * | ||||||||||||||||||
| Michael Adler(8) |
33,340 | * | ||||||||||||||||||
| Rick Faulk(9) |
90,002 | * | ||||||||||||||||||
| Tom Mawhinney(3) |
10,974,051 | 8.7 | ||||||||||||||||||
| Rob Stavis(1) |
37,512,743 | 29.7 | ||||||||||||||||||
| Andreas Stavropoulos |
— | * | ||||||||||||||||||
| All current directors and executive officers as a group (11 persons)(10) |
62,679,681 | 48.0 | % | |||||||||||||||||
| Other Selling Stockholders: |
||||||||||||||||||||
| * | Represents beneficial ownership of less than 1%. |
| (1) | Includes (a) 9,159,717 shares held by, and 184,158 shares issuable upon the exercise of a warrant held by, Bessemer Venture Partners Co-Investment L.P. (“Bessemer Co-Investment”), (b) 343,108 shares held by Bessemer Venture Partners VI Institutional L.P. (“Bessemer VI Institutional”) and (c) 27,273,287 shares held by, and 552,473 shares issuable upon the exercise of a warrant held by, Bessemer Venture Partners VI L.P. (“Bessemer VI” and, together with Bessemer Co-Investment and Bessemer VI Institutional, the “Bessemer Funds”). Deer VII & Co. L.P. is the general partner of each of the Bessemer Funds, and Deer VII & Co. Ltd. is the general partner of Deer VII & Co. L.P. Each of Deer VII & Co. L.P. and Deer VII & Co. Ltd. may be deemed to have voting and dispositive power over the shares held by the Bessemer Funds. Robert M. Stavis, a member of our board of directors, J. Edmund Colloton, David J. Cowan, Byron B. Deeter, Robert P. Goodman and Jeremy S. Levine are the directors of Deer VII & Co. Ltd. Investment and voting decisions with respect to shares held by the Bessemer Funds are made by the directors of Deer VII & Co. Ltd. acting as an investment committee. No stockholder, partner, director, officer, manager, member or employee of Deer VIII & Co. L.P. or Deer VII & Co. Ltd. has beneficial ownership (within the meaning of Rule 13d-3 promulgated under the Exchange Act) of any shares held by the Bessemer Funds. The principal business address for the Bessemer Funds is 1865 Palmer Avenue, Suite 104, Larchmont, NY 10538. |
| (2) | Includes (a) 11,964 shares held by Draper Associates Riskmasters Fund II, LLC (“DARF II”), (b) 34,619 shares held by Draper Associates Riskmasters Fund III, LLC (“DARF III”), (c) 71,866 shares held by Draper Associates Riskmasters Fund, LLC (“DARF”), (d) 670,937 shares held by, and 15,193 shares issuable upon the exercise of a warrant held by, Draper Associates, L.P. (“DALP”), (e) 22,173,476 shares held by, and 426,757 shares issuable upon the exercise of a warrant held by, Draper Fisher Jurvetson Fund IX, L.P. (“DFJ Fund IX”), (f) 6,130,166 shares held by, and 115,019 shares issuable upon the exercise of a warrant held by, Draper Fisher Jurvetson Growth Fund 2006, L.P. (“DFJ Growth Fund”), (g) 495,607 shares held by, and 9,299 shares issuable upon the exercise of a warrant held by, Draper Fisher Jurvetson Partners Growth Fund 2006, LLC (“DFJ Partners Growth”) and (h) a 600,875 shares held by, and 11,565 shares issuable upon the exercise of a warrant held by, Draper Fisher Jurvetson Partners IX, LLC (“DFJ Partners IX”). |
120
Table of Contents
Timothy C. Draper, John H.N. Fisher, and Stephen T. Jurvetson, as the managing directors of the general partner entities of DFJ Fund IX and managing members of DFJ Partners IX, share voting and dispositive power with respect to the shares held by DFJ Fund IX and DFJ Partners IX. Mark W. Bailey, Mr. Fisher and Barry M. Schuler, as the managing directors of the general partner of DFJ Growth Fund, share voting and dispositive power with respect to the shares held by DFJ Growth Fund. Any three of Messrs. Bailey, Draper, Fisher, Jurvetson and Schuler, as the managing members of DFJ Partners Growth, share voting and dispositive power with respect to the shares held by DFJ Partners Growth. Mr. Draper, the managing member of DARF, DARF II and DARF III and as President and majority shareholder of Draper Associates, Inc., the general partner of DALP, has voting and dispositive power with respect to the shares held by DARF, DARF II, DARF III and DALP. Each of the foregoing individuals disclaims beneficial ownership with respect to such shares except to the extent of their pecuniary interest therein. The address of each of the entities affiliated with Draper Fisher Jurvetson is 2882 Sand Hill Road, Suite 150, Menlo Park, California 94025.
| (3) | Includes 10,760,593 shares held by, and 213,458 shares issuable upon the exercise of warrants held by, JAFCO Technology Partners III, L.P. (“JTP III”). JTP Management Associates III, L.L.C. (“JTPMA III”) is the general partner of JTP III. Joseph Horowitz, Tom Mawhinney, Jeb Miller and Tsunesaburo Sugaya are the managing members of JTPMA III and may be deemed to share voting and investment power with respect to the shares held of record by JTP III. The address for each of these entities is 505 Hamilton Avenue, Palo Alto, CA 94301. |
| (4) | Includes (a) 723,125 shares subject to options that are exercisable within 60 days of May 31, 2014 and (b) 53,467 shares held by Melissa Rubin, Mr. Rubin’s wife. |
| (5) | Includes (a) 832,841 shares subject to options that are exercisable within 60 days of May 31, 2014 and (b) 120,000 shares subject to an irrevocable trust for the benefit of Mr. Cunningham’s minor children. |
| (6) | Includes 152,083 shares subject to options that are exercisable within 60 days of May 31, 2014. |
| (7) | Includes 162,500 shares subject to options that are exercisable within 60 days of May 31, 2014. |
| (8) | Includes 33,340 shares subject to options that are exercisable within 60 days of May 31, 2014. |
| (9) | Includes 90,002 shares subject to options that are exercisable within 60 days of May 31, 2014. |
| (10) | Includes 3,811,806 shares subject to options that are exercisable within 60 days of May 31, 2014 and 950,089 shares issuable upon the exercise of warrants held by entities related to Bessemer Venture Partners and JTP III. |
121
Table of Contents
The following description of our capital stock, certain provisions of our certificate of incorporation and bylaws, as each will be in effect upon the completion of this offering, and certain provisions of Delaware law are summaries. You should also refer to the certificate of incorporation and the bylaws, which are filed as exhibits to the registration statement of which this prospectus is part. We refer in this section to our certificate of incorporation and bylaws that we intend to adopt in connection with this offering as our certificate of incorporation and bylaws, respectively.
General
Upon the completion of this offering, our certificate of incorporation will authorize us to issue up to shares of common stock, $0.0002 par value per share, and 10,000,000 shares of preferred stock, $0.001 par value per share, all of which shares of preferred stock will be undesignated. Our board of directors may establish the rights and preferences of the preferred stock from time to time. As of May 31, 2014, after giving effect to the automatic preferred stock warrant exercise and the automatic conversion of all outstanding preferred stock into shares of our common stock in connection with the completion of the offering, there would have been shares of common stock issued and outstanding, held of record by 244 stockholders.
The number of shares of our common stock to be issued upon the automatic conversion of all outstanding shares of our Series F preferred stock depends in part on the initial public offering price of our common stock. The terms of our Series F preferred stock provide that the ratio at which each share of this series of preferred stock automatically converts into shares of our common stock in connection with this offering will increase if the initial public offering price is below $ per share, which would result in additional shares of our common stock being issued upon conversion of our Series F preferred stock immediately prior to the closing of this offering. Based upon the assumed initial public offering price of $ per share, the midpoint of the price range set forth on the cover page of this prospectus, the outstanding shares of our Series F preferred stock will convert into an aggregate of approximately shares of our common stock immediately prior to the closing of this offering.
Common Stock
Voting Rights
Each holder of our common stock is entitled to one vote for each share on all matters submitted to a vote of the stockholders, including the election of directors. Under our certificate of incorporation and bylaws, our stockholders will not have cumulative voting rights. Because of this, the holders of a majority of the shares of common stock entitled to vote in any election of directors can elect all of the directors standing for election, if they should so choose.
Dividends
Subject to preferences that may be applicable to any then-outstanding preferred stock, holders of common stock are entitled to receive ratably those dividends, if any, as may be declared from time to time by the board of directors out of legally available funds.
Liquidation
In the event of our liquidation, dissolution or winding up, holders of common stock will be entitled to share ratably in the net assets legally available for distribution to stockholders after the payment of all of our debts and other liabilities and the satisfaction of any liquidation preference granted to the holders of any then-outstanding shares of preferred stock.
122
Table of Contents
Rights and Preferences
Holders of common stock have no preemptive, conversion or subscription rights and there are no redemption or sinking fund provisions applicable to the common stock. The rights, preferences and privileges of the holders of common stock are subject to, and may be adversely affected by, the rights of the holders of shares of any series of preferred stock that we may designate in the future.
Preferred Stock
All currently outstanding shares of preferred stock will be converted automatically to common stock upon the completion of this offering.
Following the completion of this offering, our board of directors will have the authority, without further action by our stockholders, to issue up to shares of preferred stock in one or more series, to establish from time to time the number of shares to be included in each such series, to fix the rights, preferences and privileges of the shares of each wholly unissued series and any qualifications, limitations or restrictions thereon, and to increase or decrease the number of shares of any such series, but not below the number of shares of such series then outstanding.
Our board of directors may authorize the issuance of preferred stock with voting or conversion rights that could adversely affect the voting power or other rights of the holders of our common stock. The purpose of authorizing our board of directors to issue preferred stock and determine its rights and preferences is to eliminate delays associated with a stockholder vote on specific issuances. The issuance of preferred stock, while providing flexibility in connection with possible acquisitions and other corporate purposes, could, among other things, have the effect of delaying, deferring or preventing a change in control of us and may adversely affect the market price of our common stock and the voting and other rights of the holders of our common stock. It is not possible to state the actual effect of the issuance of any shares of preferred stock on the rights of holders of common stock until the board of directors determines the specific rights attached to that preferred stock.
We have no present plans to issue any shares of preferred stock.
Options
As of May 31, 2014, options to purchase an aggregate of 21,929,642 shares of common stock were outstanding under our 2007 Plan. For additional information regarding the terms of our 2007 Plan, see the section of this prospectus titled “Executive and Director Compensation—Equity Incentive Plans—2007 Equity Incentive Plan.”
Warrants
As of May 31, 2014, 15 warrants for the purchase of an aggregate of 2,981,299 shares of our common stock were outstanding, on an as-converted-to-common basis and subject to the net exercise provision described below, including (1) warrants to purchase an aggregate of 200,553 shares of our common stock at a weighted average exercise price of $1.1676 per share, expiring as early as March 9, 2019 and as late as September 3, 2022 and (2) warrants to purchase an aggregate of 2,780,746 shares of our preferred stock at a weighted average exercise price of $1.2209 per share, expiring as early as May 22, 2017 and as late as May 22, 2021.
All of our outstanding preferred stock warrants become exercisable for shares of our common stock on a one-for-one basis upon the closing of this offering, and 1,537,917 of these warrants that were issued in connection with the bridge financing for our acquisition of ProfitFuel will, subject to certain conditions, automatically be deemed exercised in full pursuant to a net exercise provision upon the closing of this offering. The net exercise provision contained in certain of our outstanding warrants provides that the holder may, in lieu of payment of the exercise price in cash, surrender the applicable warrant and receive a net amount of shares based on the fair market value of our stock at the time of exercise of the applicable warrant after deduction of the
123
Table of Contents
aggregate exercise price. The warrants also contain a provision for the adjustment of the exercise price and the number of shares issuable upon the exercise of the applicable warrant in the event of certain stock dividends, stock splits, reorganizations, reclassifications and consolidations.
Registration Rights
After our initial public offering, certain holders of shares of our common stock, including those shares of our common stock that will be issued upon conversion of our preferred stock in connection with this offering, and those shares of our common stock that are issuable pursuant to our outstanding preferred stock warrants, or the warrant shares, will be entitled to certain rights with respect to registration of such shares under the Securities Act. These shares are collectively referred to herein as registrable securities. The holders of these registrable securities possess registration rights pursuant to the terms of the fourth amended and restated investors’ rights agreement, or investors’ rights agreement, and are described in additional detail below.
The registration rights provisions of our investors’ rights agreement provide these holders of registrable securities with demand (other than the warrant shares), piggyback and S-3 registration rights as described more fully below.
Demand Registration Rights
At any time beginning upon the expiration of the lock-up period following this offering, as described in the section of this prospectus titled “Shares Eligible for Future Sale—Lock-Up Agreements,” the holders of a majority of our registrable securities then outstanding in the aggregate, have the right to demand that we file a registration statement under the Securities Act covering the registration of at least 20% of the then outstanding registrable securities (or such lesser percentage of registrable securities having an anticipated offering price of at least $5.0 million). These registration rights are subject to specified conditions and limitations, including the right of the underwriters, if any, to limit the number of shares included in any such registration under specified circumstances. Upon such a request, we will be required to file the registration within 60 days. As of March 31, 2014, an aggregate of registrable securities are entitled to these demand registration rights.
Piggyback Registration Rights
At any time after the completion of this offering, if we propose to register any of our securities under the Securities Act in connection with the public offering of our securities solely for cash, either for our own account or for the account of other stockholders, the holders of our registrable securities then outstanding will each be entitled to notice of the registration and will be entitled to include their shares of common stock in any such registration statement. These piggyback registration rights are subject to specified conditions and limitations, including the right of the underwriters to limit the number of shares included in any such registration under specified circumstances. As of March 31, 2014, an aggregate of registrable securities are entitled to these piggyback registration rights.
Registration on Form S-3
At any time we are qualified to file a registration statement on Form S-3, any holder of our registrable securities then outstanding are entitled to request to have such shares registered by us on a Form S-3 registration statement, provided that such requested registration has an anticipated aggregate offering price, net of any underwriting discounts, selling commissions, applicable stock transfer taxes and fees and disbursements of counsel, of at least $3.0 million and we have not already effected two registrations on Form S-3 within the preceding 12-month period. The right to have such shares registered on Form S-3 is further subject to other specified conditions and limitations. As of March 31, 2014, an aggregate of registrable securities are entitled to these Form S-3 registration rights.
124
Table of Contents
Expenses of Registration
We will pay all expenses relating to any demand, piggyback or Form S-3 registration, other than underwriting discounts and commissions, subject to specified conditions and limitations.
Termination of Registration Rights
All registration rights of any holder granted under the investors’ rights agreement will terminate no later than five years following the consummation of this offering. The registration rights will terminate as to any shares of registrable securities when those shares (1) have been (a) registered under the Securities Act pursuant to an effective registration statement filed thereunder and disposed of in accordance with the registration statement covering them or (b) publicly sold pursuant Rule 144 of the Securities Act or (2) could be sold without restriction under Rule 144 of the Securities Act during any 90-day period.
Anti-Takeover Provisions
Anti-Takeover Statute
We are subject to Section 203 of the Delaware General Corporation Law, which generally prohibits a publicly held Delaware corporation from engaging in any business combination with any interested stockholder for a period of three years after the date that such stockholder became an interested stockholder, with the following exceptions:
| • | before such date, the board of directors of the corporation approved either the business combination or the transaction that resulted in the stockholder becoming an interested stockholder; |
| • | upon completion of the transaction that resulted in the stockholder becoming an interested stockholder, the interested stockholder owned at least 85% of the voting stock of the corporation outstanding at the time the transaction began, excluding for purposes of determining the voting stock outstanding, but not the outstanding voting stock owned by the interested stockholder, those shares owned (1) by persons who are directors and also officers and (2) employee stock plans in which employee participants do not have the right to determine confidentially whether shares held subject to the plan will be tendered in a tender or exchange offer; or |
| • | on or after such date, the business combination is approved by the board of directors and authorized at an annual or special meeting of the stockholders, and not by written consent, by the affirmative vote of at least 66 2⁄3% of the outstanding voting stock that is not owned by the interested stockholder. |
| • | In general, Section 203 defines a “business combination” to include the following: |
| • | any merger or consolidation involving the corporation and the interested stockholder; |
| • | any sale, transfer, pledge or other disposition of 10% or more of the assets of the corporation involving the interested stockholder; |
| • | subject to certain exceptions, any transaction that results in the issuance or transfer by the corporation of any stock of the corporation to the interested stockholder; |
| • | any transaction involving the corporation that has the effect of increasing the proportionate share of the stock or any class or series of the corporation beneficially owned by the interested stockholder; or |
| • | the receipt by the interested stockholder of the benefit of any loans, advances, guarantees, pledges or other financial benefits by or through the corporation. |
In general, Section 203 defines an “interested stockholder” as an entity or person who, together with the person’s affiliates and associates, beneficially owns, or within three years prior to the time of determination of interested stockholder status did own, 15% or more of the outstanding voting stock of the corporation.
125
Table of Contents
Anti-Takeover Effects of Certain Provisions of our Certificate of Incorporation and Bylaws to be in Effect Upon the Completion of this Offering
Our certificate of incorporation will provide for our board of directors to be divided into three classes with staggered three-year terms. Only one class of directors will be elected at each annual meeting of our stockholders, with the other classes continuing for the remainder of their respective three-year terms. Because our stockholders do not have cumulative voting rights, stockholders holding a majority of the shares of common stock outstanding will be able to elect all of our directors. Our certificate of incorporation and bylaws will also provide that directors may be removed by the stockholders only for cause upon the vote of 662/3% or more of our outstanding common stock. Furthermore, the authorized number of directors may be changed only by resolution of the board of directors, and vacancies and newly created directorships on the board of directors may, except as otherwise required by law or determined by the board, only be filled by a majority vote of the directors then serving on the board, even though less than a quorum.
Our certificate of incorporation and bylaws will also provide that all stockholder actions must be effected at a duly called meeting of stockholders and will eliminate the right of stockholders to act by written consent without a meeting. Our bylaws will also provide that only our chairman of the board, chief executive officer or the board of directors pursuant to a resolution adopted by a majority of the total number of authorized directors may call a special meeting of stockholders.
Our bylaws will also provide that stockholders seeking to present proposals before our annual meeting of stockholders or to nominate candidates for election as directors at a meeting of stockholders must provide timely advance notice in writing, and, subject to applicable law, will specify requirements as to the form and content of a stockholder’s notice.
Our certificate of incorporation and bylaws will provide that the stockholders cannot amend many of the provisions described above except by a vote of 66 2⁄3% or more of our outstanding common stock.
The combination of these provisions will make it more difficult for our existing stockholders to replace our board of directors as well as for another party to obtain control of us by replacing our board of directors. Since our board of directors has the power to retain and discharge our officers, these provisions could also make it more difficult for existing stockholders or another party to effect a change in management. In addition, the authorization of undesignated preferred stock makes it possible for our board of directors to issue preferred stock with voting or other rights or preferences that could impede the success of any attempt to change our control.
These provisions are intended to enhance the likelihood of continued stability in the composition of our board of directors and its policies and to discourage coercive takeover practices and inadequate takeover bids. These provisions are also designed to reduce our vulnerability to hostile takeovers and to discourage certain tactics that may be used in proxy fights. However, such provisions could have the effect of discouraging others from making tender offers for our shares and may have the effect of delaying changes in our control or management. As a consequence, these provisions may also inhibit fluctuations in the market price of our stock that could result from actual or rumored takeover attempts. We believe that the benefits of these provisions, including increased protection of our potential ability to negotiate with the proponent of an unfriendly or unsolicited proposal to acquire or restructure our company, outweigh the disadvantages of discouraging takeover proposals, because negotiation of takeover proposals could result in an improvement of their terms.
Choice of Forum
Our certificate of incorporation to be in effect upon the completion of this offering will provide that the Court of Chancery of the State of Delaware will be the exclusive forum for any derivative action or proceeding brought on our behalf; any action asserting a breach of fiduciary duty owed by and of our directors, officers or employees to us or our stockholders; any action asserting a claim against us arising pursuant to the Delaware General Corporation Law, our certificate of incorporation or our bylaws; or any action asserting a claim against
126
Table of Contents
us that is governed by the internal affairs doctrine. Several lawsuits have been filed in Delaware challenging the enforceability of similar choice of forum provisions and it is possible that a court determines such provisions are not enforceable.
Transfer Agent and Registrar
The transfer agent and registrar for our common stock is . The transfer agent’s address is .
Listing
We intend to apply for listing of our common stock on the under the trading symbol “YO.”
127
Table of Contents
SHARES ELIGIBLE FOR FUTURE SALE
Prior to this offering, no public market existed for our common stock, and although we expect that our common stock will be approved for listing on , we cannot assure investors that there will be an active public market for our common stock following this offering. We cannot predict what effect, if any, sales of our shares in the public market or the availability of shares for sale will have on the market price of our common stock. Future sales of substantial amounts of common stock in the public market, including shares issued upon exercise of outstanding options or warrants, or the perception that such sales may occur, however, could adversely affect the market price of our common stock and also could adversely affect our future ability to raise capital through the sale of our common stock or other equity-related securities at times and prices we believe appropriate.
Upon completion of this offering, based on our shares outstanding as of , shares of our common stock will be outstanding, or shares of common stock if the underwriters exercise their over-allotment option in full.
All of the shares of common stock sold in this offering will be freely tradable without restrictions or further registration under the Securities Act, except for any shares sold to our “affiliates,” as that term is defined under Rule 144 under the Securities Act. The remaining outstanding shares of common stock held by existing stockholders are “restricted securities,” as that term is defined in Rule 144 under the Securities Act. Restricted securities may be sold in the public market only if the offer and sale is registered under the Securities Act or if the offer and sale of those securities qualifies for exemption from registration, including exemptions provided by Rules 144 and 701 promulgated under the Securities Act.
As a result of lock-up agreements and market standoff provisions described below and the provisions of Rules 144 and 701, shares of our common stock will be available for sale in the public market as follows:
| • | the shares sold in this offering will be eligible for immediate sale upon the completion of this offering; and |
| • | approximately shares of our common stock will be eligible for sale upon expiration of lock-up agreements and market stand-off provisions described below, beginning 180 days after the date of this prospectus, subject in certain circumstances to the volume, manner of sale and other limitations under Rule 144 and Rule 701. |
We may issue shares of our common stock from time to time for a variety of corporate purposes, including in capital-raising activities through future public offerings or private placements, in connection with exercise of stock options and warrants, vesting of restricted stock units and other issuances relating to our employee benefit plans and as consideration for future acquisitions, investments or other purposes. The number of shares of our common stock that we may issue may be significant, depending on the events surrounding such issuances. In some cases, the shares we issue may be freely tradable without restriction or further registration under the Securities Act; in other cases, we may grant registration rights covering the shares issued in connection with these issuances, in which case the holders of the common stock will have the right, under certain circumstances, to cause us to register any resale of such shares to the public.
Rule 144
In general, persons who have beneficially owned restricted shares of our common stock for at least six months, and any affiliate of the company who owns either restricted shares of our common stock, are entitled to sell their securities without registration with the SEC under an exemption from registration provided by Rule 144 under the Securities Act.
128
Table of Contents
Non-Affiliates
Any person who is not deemed to have been one of our affiliates at the time of, or at any time during the three months preceding, a sale may sell an unlimited number of restricted securities under Rule 144 if:
| • | the restricted securities have been held for at least six months, including the holding period of any prior owner other than one of our affiliates; |
| • | we have been subject to the Exchange Act periodic reporting requirements for at least 90 days before the sale; and |
| • | we are current in our Exchange Act reporting at the time of sale. |
Any person who is not deemed to have been an affiliate of ours at the time of, or at any time during the three months preceding, a sale and has held the restricted securities for at least one year, including the holding period of any prior owner other than one of our affiliates, will be entitled to sell an unlimited number of restricted securities without regard to the length of time we have been subject to Exchange Act periodic reporting or whether we are current in our Exchange Act reporting.
Affiliates
Persons seeking to sell restricted securities who are our affiliates at the time of, or any time during the three months preceding, a sale, would be subject to the restrictions described above. They are also subject to additional restrictions, by which such person would be required to comply with the manner of sale and notice provisions of Rule 144 and would be entitled to sell within any three-month period only that number of securities that does not exceed the greater of either of the following:
| • | 1% of the number of shares of our common stock then outstanding, which will equal approximately shares immediately after the completion of this offering based on the number of shares outstanding as of May 31, 2014; or |
| • | the average weekly trading volume of our common stock on the during the four calendar weeks preceding the filing of a notice on Form 144 with respect to the sale. |
Rule 701
In general, under Rule 701 a person who purchased shares of our common stock pursuant to a written compensatory plan or contract and who is not deemed to have been one of our affiliates during the immediately preceding 90 days may sell these shares in reliance upon Rule 144, but without being required to comply with the notice, manner of sale or public information requirements or volume limitation provisions of Rule 144. Rule 701 also permits affiliates to sell their Rule 701 shares under Rule 144 without complying with the holding period requirements of Rule 144. All holders of Rule 701 shares, however, are required to wait until 90 days after the date of this prospectus before selling such shares pursuant to Rule 701. As of May 31, 2014, 12,253,548 shares of our outstanding common stock had been issued in reliance on Rule 701 as a result of exercises of stock options and issuance of restricted stock. However, substantially all Rule 701 shares are subject to lock-up agreements as described below and in the section of this prospectus titled “Underwriting” and will become eligible for sale upon the expiration of the restrictions set forth in those agreements.
Form S-8 Registration Statements
As of May 31, 2014 options to purchase an aggregate 21,929,642 shares of our common stock were outstanding. As soon as practicable after the completion of this offering, we intend to file with the SEC one or more registration statements on Form S-8 under the Securities Act to register the shares of our common stock that are issuable pursuant to our equity incentive plans. See the section of this prospectus titled “Executive and Director Compensation—Equity Incentive Plans” for a description of our equity incentive plans. These
129
Table of Contents
registration statements will become effective immediately upon filing. Shares covered by these registration statements will then be eligible for sale in the public markets, subject to vesting restrictions, any applicable lock-up agreements described below and Rule 144 limitations applicable to affiliates.
Lock-Up Agreements
In connection with this offering, we, our directors and officers, and substantially all of the holders of equity securities outstanding immediately prior to this offering, including all of the selling stockholders, have agreed, subject to certain exceptions, not to offer, sell, or transfer any common stock or securities convertible into or exchangeable for our common stock for 180 days after the date of this prospectus without the prior written consent of Credit Suisse Securities (USA) LLC and Deutsche Bank Securities Inc. on behalf of the underwriters.
The agreements do not contain any pre-established conditions to the waiver by Credit Suisse Securities (USA) LLC and Deutsche Bank Securities Inc. on behalf of the underwriters of any terms of the lock-up agreements. Any determination to release shares subject to the lock-up agreements would be based on a number of factors at the time of determination, including but not necessarily limited to the market price of the common stock, the liquidity of the trading market for the common stock, general market conditions, the number of shares proposed to be sold, contractual obligations to release certain shares subject to the lock-up agreements in the event any such shares are released, subject to certain specific limitations and thresholds, and the timing, purpose and terms of the proposed sale.
In addition to the restrictions contained in the lock-up agreements described above, we have entered into agreements with certain of our security holders, including our investors rights agreement, our voting agreement and our standard forms of option agreements under our equity incentive plans, that contain market stand-off provisions imposing restrictions on the ability of such security holders to offer, sell or transfer our equity securities for a period of 180 days following the date of this prospectus.
Registration Rights
Upon the completion of this offering, the holders of shares of our common stock issuable upon the conversion of our preferred stock (assuming a conversion ratio equal to common shares for each Series F preferred share based on an assumed initial public offering price of $ per share, which is the midpoint of the range set forth on the cover page of this prospectus) and 2,780,746 shares of our common stock issuable upon the exercise of outstanding warrants, or their transferees, will be entitled to specified rights with respect to the registration of the offer and sale of their shares under the Securities Act. Registration of the offer and sale of these shares under the Securities Act would result in the shares becoming freely tradable without restriction under the Securities Act immediately upon the effectiveness of the registration. See the section of this prospectus titled “Description of Capital Stock—Registration Rights” for additional information.
130
Table of Contents
MATERIAL U.S. FEDERAL INCOME TAX CONSIDERATIONS FOR NON-U.S. HOLDERS
The following is a general discussion of the material U.S. federal income tax consequences of the acquisition, ownership and disposition of our common stock by “Non-U.S. Holders” (as defined below). This discussion is a summary for general information purposes only and does not consider all aspects of U.S. federal income taxation that may be relevant to particular Non-U.S. Holders in light of their individual circumstances or to certain types of Non-U.S. Holders subject to special tax rules, including partnerships or other pass-through entities for U.S. federal income tax purposes, banks, financial institutions or other financial services entities, broker-dealers, insurance companies, tax-exempt organizations, regulated investment companies, real estate investment trusts, controlled foreign corporations, passive foreign investment companies, corporations that accumulate earnings to avoid U.S. federal income tax, persons who use or are required to use mark-to-market accounting, persons that hold our shares as part of a “straddle,” a “hedge,” a “conversion transaction,” or other integrated transaction, certain former citizens or permanent residents of the United States, persons who hold or receive our common stock pursuant to the exercise of any employee stock option or otherwise as compensation, investors in pass-through entities, or persons subject to the alternative minimum tax. In addition, this summary does not address, except to the extent discussed below, the effects of any applicable gift or estate tax, and this summary does not address the potential application of Medicare contribution tax or any tax considerations that may apply to Non-U.S. Holders of our common stock under state, local or non-U.S. tax laws and any other U.S. federal tax laws.
This summary is based on the Internal Revenue Code of 1986, as amended, or the Code, applicable U.S. Treasury Regulations, rulings, administrative pronouncements and decisions as of the date of this registration statement, all of which are subject to change or differing interpretations at any time with possible retroactive effect. We have not sought, and will not seek, any ruling from the Internal Revenue Service, or the IRS, with respect to the tax consequences discussed herein, and there can be no assurance that the IRS will not take a position contrary to the tax consequences discussed below or that any position taken by the IRS would not be sustained. This discussion assumes that a Non-U.S. Holder will hold our common stock as a capital asset within the meaning of the Code (generally, property held for investment). For purposes of this discussion, the term “Non-U.S. Holder” means, for U.S. federal tax purposes, a beneficial owner of our shares that is not a partnership (or entity or arrangement treated as a partnership for U.S. federal income tax purposes) and is not:
| • | an individual who is a citizen or resident of the United States; |
| • | a corporation (or other entity taxable as a corporation) created or organized in the United States or under the laws of the United States or of any state thereof or the District of Columbia; |
| • | an estate, the income of which is subject to U.S. federal income tax regardless of its source; or |
| • | a trust if (1) a U.S. court can exercise primary supervision over the trust’s administration and one or more U.S. persons have the authority to control all of the trust’s substantial decisions or (2) the trust has a valid election in effect under applicable U.S. Treasury Regulations to be treated as a U.S. person. |
If a partnership (or entity or arrangement treated as a partnership for U.S. federal income tax purposes) is a beneficial owner of our common stock, the tax treatment of a partner in the partnership will generally depend upon the status of the partner and the activities of the partnership. If you are a partner of a partnership holding our shares, you should consult your tax advisor regarding the tax consequences of the purchase, ownership, and disposition of our common stock.
PROSPECTIVE INVESTORS SHOULD CONSULT THEIR TAX ADVISORS REGARDING THE PARTICULAR U.S. FEDERAL INCOME TAX CONSEQUENCES TO THEM OF ACQUIRING, OWNING AND DISPOSING OF OUR COMMON STOCK, AS WELL AS ANY TAX CONSEQUENCES ARISING UNDER ANY STATE, LOCAL OR FOREIGN TAX LAWS AND ANY OTHER U.S. FEDERAL TAX LAWS.
131
Table of Contents
Distributions on Our Common Stock
As described in the section entitled “Dividend Policy,” we do not anticipate declaring or paying dividends to holders of our common stock in the foreseeable future. However, if we make distributions of cash or property on our common stock, such distributions paid to a Non-U.S. Holder (to the extent paid out of our current or accumulated earnings and profits, as determined under U.S. federal income tax principles) will constitute dividends and be subject to U.S. federal withholding tax at a rate equal to 30% of the gross amount of the dividend, or a lower rate prescribed by an applicable income tax treaty, unless the dividends are effectively connected with a trade or business carried on by the Non-U.S. Holder within the United States. Any distribution not constituting a dividend (because such distribution exceeds our current and accumulated earnings and profits) will be treated first as reducing the Non-U.S. Holder’s adjusted tax basis in its shares of common stock, but not below zero, and to the extent it exceeds the Non-U.S. Holder’s basis, as capital gain (see “Gain on Sale, Exchange or Other Taxable Disposition of Common Stock” below).
A Non-U.S. Holder who claims the benefit of an applicable income tax treaty generally will be required to satisfy certain certification and other requirements prior to the distribution date. Such Non-U.S. Holders must generally provide the withholding agent with a properly executed IRS Form W-8BEN (or other applicable documentation) claiming an exemption from or reduction in withholding under an applicable income tax treaty. If tax is withheld in an amount in excess of the amount applicable under an income tax treaty, a refund of the excess amount may generally be obtained by timely filing an appropriate claim for refund with the IRS. Non-U.S. Holders should consult their tax advisors regarding their entitlement to benefits under an applicable income tax treaty.
Dividends that are effectively connected with a Non-U.S. Holder’s conduct of a U.S. trade or business (and, if required by an applicable income tax treaty, attributable to a U.S. permanent establishment or fixed base of the Non-U.S. Holder) generally will not be subject to U.S. federal withholding tax if the Non-U.S. Holder files the required forms, generally IRS Form W-8ECI, with the withholding agent, but instead generally will be subject to U.S. federal income tax on a net income basis at the regular graduated rates in the same manner as if the Non-U.S. Holder were a resident of the United States. A corporate Non-U.S. Holder that receives effectively connected dividends may also be subject to a branch profits tax at a rate of 30%, or a lower rate prescribed by an applicable income tax treaty. Non-U.S. Holders should consult their tax advisors regarding any applicable tax treaties that may provide for different rules.
Gain on Sale, Exchange or Other Disposition of Our Common Stock
In general, a non-U.S. holder will not be subject to any U.S. federal income tax or withholding tax on any gain realized upon such holder’s sale, exchange or other disposition of shares of our common stock unless:
| (1) | the gain is effectively connected with a trade or business carried on by the Non-U.S. Holder within the United States (and, if required by an applicable income tax treaty, attributable to a U.S. permanent establishment or fixed base of the Non-U.S. Holder); |
| (2) | the Non-U.S. Holder is an individual who is present in the United States for 183 days or more in the taxable year of disposition and certain other conditions are met; or |
| (3) | we are or have been a “United States real property holding corporation” for U.S. federal income tax purposes at any time during the shorter of the five-year period ending on the date of disposition or the period that the Non-U.S. Holder held the common stock, and, in the case where shares of our common stock are regularly traded on an established securities market, the Non-U.S. Holder owns, or is treated as owning, more than five percent of our common stock at any time during the foregoing period. |
Net gain realized by a Non-U.S. Holder described in clause (1) above generally will be subject to U.S. federal income tax in the same manner as if the Non-U.S. Holder were a resident of the United States. Any gains of a
132
Table of Contents
corporate Non-U.S. Holder described in clause (1) above may also be subject to a “branch profits tax” at a 30% rate, or such lower rate as may be specified by an applicable income tax treaty.
Gain realized by an individual Non-U.S. Holder described in clause (2) above will be subject to a flat 30% tax, which gain may be offset by certain U.S. source capital losses, even though the individual is not considered a resident of the United States.
For purposes of clause (3) above, a corporation is a United States real property holding corporation if the fair market value of its United States real property interests equals or exceeds 50% of the sum of the fair market value of its worldwide real property interests plus its other assets used or held for use in a trade or business. We believe that we are not, and we do not anticipate that we will become, a United States real property holding corporation.
Non-U.S. Holders should consult their tax advisors regarding potentially applicable income tax treaties that may provide for different rules.
U.S. Federal Estate Tax
The estate of an individual Non-U.S. Holder is generally subject to U.S. federal estate tax on property having a U.S. situs. Because we are a U.S. corporation, our common stock will be U.S. situs property and therefore will be included in the taxable estate of an individual Non-U.S. Holder decedent, unless an applicable estate tax treaty between the United States and the decedent’s country of residence provides otherwise.
Information Reporting and Backup Withholding
Generally, we or the applicable withholding agent must report annually to the IRS and to each Non-U.S. Holder the amount of dividends paid, the name and address of the recipient, and the amount, if any, of tax withheld. These information reporting requirements apply even if withholding was not required because the dividends were effectively connected with the Non-U.S. Holder’s conduct of a trade or business within the United States or withholding was reduced by an applicable income tax treaty. Under applicable income tax treaties or other agreements, the IRS may make its reports available to the tax authorities in the Non-U.S. Holder’s country of residence.
Dividends paid to a Non-U.S. Holder that is not an exempt recipient generally will be subject to backup withholding, currently at a rate of 28%, unless the Non-U.S. Holder certifies to the applicable withholding agent as to its foreign status, which certification may generally be made on IRS Form W-8BEN or other appropriate version of IRS Form W-8.
Proceeds from the sale or other disposition of common stock by a Non-U.S. Holder effected by or through a U.S. office of a broker will generally be subject to information reporting and backup withholding, currently at a rate of 28%, unless the Non-U.S. Holder certifies to the withholding agent under penalties of perjury as to, among other things, its name, address and status as a Non-U.S. Holder or otherwise establishes an exemption. Payment of disposition proceeds effected outside the United States by or through a non-U.S. office of a non-U.S. broker generally will not be subject to information reporting or backup withholding if the payment is not received in the United States. Information reporting, but generally not backup withholding, will apply to such a payment if the broker has certain connections with the United States unless the broker has documentary evidence in its records that the beneficial owner thereof is a Non-U.S. Holder and specified conditions are met or an exemption is otherwise established.
Backup withholding is not an additional tax. Any amounts withheld under the backup withholding rules from a payment to a Non-U.S. Holder that results in an overpayment of taxes generally will be refunded, or credited against the holder’s U.S. federal income tax liability, if any, provided that the required information is timely furnished to the IRS.
133
Table of Contents
Foreign Account Tax Compliance Act (“FATCA”)
A U.S. federal withholding tax of 30% may apply to dividends on and the gross proceeds of a sale or other disposition of our common stock paid to a “foreign financial institution” (as specially defined under applicable rules) unless such institution enters into an agreement with the U.S. Department of Treasury to withhold on certain payments and to collect and provide to the U.S. tax authorities substantial information regarding certain U.S. account holders of such institution (which includes certain equity holders of such institution, as well as certain account holders that are foreign entities with U.S. owners). This U.S. federal withholding tax of 30% will also apply to payments of dividends and the gross proceeds of a disposition of our common stock paid to a non-financial foreign entity unless such entity either certifies it does not have any substantial U.S. owners or provides the withholding agent with a certification identifying substantial direct and indirect U.S. owners of the entity. The withholding tax described above will not apply if the foreign financial institution or non-financial foreign entity otherwise qualifies for an exemption from the rules. Under certain circumstances, a Non-U.S. Holder might be eligible for refunds or credits of such taxes. The U.S. has entered into agreements with certain countries that modify these general rules for entities located in those countries. Prospective investors are encouraged to consult with their own tax advisors regarding the possible implications of this legislation on their investment in our common stock.
The withholding provisions described above will generally apply to payments of dividends made on or after July 1, 2014 and to payments of gross proceeds from a sale or other disposition of common stock on or after January 1, 2017.
Prospective investors should consult their tax advisors regarding the potential application of withholding under FATCA to their investment in our common stock.
134
Table of Contents
Under the terms and subject to the conditions contained in an underwriting agreement dated, we and the selling stockholders have agreed to sell to the underwriters named below, for whom Credit Suisse Securities (USA) LLC and Deutsche Bank Securities Inc. are acting as representatives, the following respective numbers of shares of common stock:
|
|
Number of Shares | |
| Credit Suisse Securities (USA) LLC |
||
| Deutsche Bank Securities Inc. |
||
| Jefferies LLC |
||
| Piper Jaffray & Co. |
||
| Canaccord Genuity Inc. |
||
| Needham & Company, LLC |
||
| Oppenheimer & Co. Inc. |
||
|
| ||
| Total |
||
|
|
The underwriting agreement provides that the underwriters are obligated to purchase all the shares of common stock in the offering if any are purchased, other than those shares covered by the over-allotment option described below. The underwriting agreement also provides that if an underwriter defaults the purchase commitments of non-defaulting underwriters may be increased or the offering may be terminated.
We and the selling stockholders have granted to the underwriters a 30-day option to purchase on a pro rata basis up to additional shares from at the initial public offering price less the underwriting discounts and commissions. The option may be exercised only to cover any over-allotments of common stock.
The underwriters propose to offer the shares of common stock initially at the public offering price on the cover page of this prospectus and to selling group members at that price less a selling concession of $ per share. After the initial public offering the representatives may change the public offering price and concession.
The following table summarizes the compensation we and the selling stockholders will pay:
| Per Share | Total | |||||||||||||||
| Without Over-allotment |
With Over-allotment |
Without Over-allotment |
With Over-allotment |
|||||||||||||
| Underwriting Discounts and Commissions paid by us |
$ | $ | $ | $ | ||||||||||||
| Underwriting Discounts and Commissions paid by selling stockholders |
$ | $ | $ | $ | ||||||||||||
We estimate that our out-of-pocket expenses for this offering will be approximately $ .
We have agreed to reimburse the underwriters for expenses of approximately $ related to clearance of this offering with the Financial Industry Regulatory Authority, Inc., or FINRA.
The underwriters have informed us that they do not expect sales to accounts over which the underwriters have discretionary authority to exceed 5% of the shares of common stock being offered.
We have agreed that we will not, directly or indirectly, offer, sell, issue, contract to sell, pledge or otherwise dispose of or file with the SEC a registration statement under the Securities Act relating to, any shares of our
135
Table of Contents
common stock or securities convertible into or exchangeable or exercisable for any shares of our common stock, or publicly disclose the intention to take any such action, without the prior written consent of Credit Suisse Securities (USA) LLC and Deutsche Bank Securities Inc. for a period of 180 days after the date of this prospectus.
Our officers, directors and substantially all of our stockholders and option holders have agreed, subject to certain exceptions, that they will not offer, sell, contract to sell, pledge or otherwise dispose of, directly or indirectly, any shares of our common stock or securities convertible into or exchangeable or exercisable for any shares of our common stock, enter into a transaction that would have the same effect, or enter into any swap, hedge or other arrangement that transfers, in whole or in part, any of the economic consequences of ownership of our common stock, whether any of these transactions are to be settled by delivery of our common stock or such other securities, in cash or otherwise, or publicly disclose the intention to make any offer, sale, pledge or disposition, or to enter into any such transaction, swap, hedge or other arrangement, without, in each case, the prior written consent of Credit Suisse Securities (USA) LLC and Deutsche Bank Securities Inc. for a period of 180 days after the date of this prospectus.
Credit Suisse Securities (USA) LLC and Deutsche Bank Securities Inc., on behalf of the underwriters, in their sole discretion, may release our common stock and other securities subject to the lock-up agreements described above in whole or in part at any time with or without notice.
We and the selling stockholders have agreed to indemnify the underwriters against certain liabilities, including liabilities under the Securities Act, or to contribute to payments that the underwriters may be required to make in that respect.
We will apply to list the shares of common stock on under the symbol “YO.”
In connection with the offering the underwriters may engage in stabilizing transactions, over-allotment transactions, syndicate covering transactions and penalty bids in accordance with Regulation M under the Exchange Act.
| • | Stabilizing transactions permit bids to purchase the underlying security so long as the stabilizing bids do not exceed a specified maximum. |
| • | Over-allotment involves sales by the underwriters of shares in excess of the number of shares the underwriters are obligated to purchase, which creates a syndicate short position. The short position may be either a covered short position or a naked short position. In a covered short position, the number of shares over-allotted by the underwriters is not greater than the number of shares that they may purchase in the over-allotment option. In a naked short position, the number of shares involved is greater than the number of shares in the over-allotment option. The underwriters may close out any covered short position by either exercising their over-allotment option and/or purchasing shares in the open market. |
| • | Syndicate covering transactions involve purchases of the common stock in the open market after the distribution has been completed in order to cover syndicate short positions. In determining the source of shares to close out the short position, the underwriters will consider, among other things, the price of shares available for purchase in the open market as compared to the price at which they may purchase shares through the over-allotment option. If the underwriters sell more shares than could be covered by the over-allotment option, a naked short position, the position can only be closed out by buying shares in the open market. A naked short position is more likely to be created if the underwriters are concerned that there could be downward pressure on the price of the shares in the open market after pricing that could adversely affect investors who purchase in the offering. |
| • | Penalty bids permit the representatives to reclaim a selling concession from a syndicate member when the common stock originally sold by the syndicate member is purchased in a stabilizing or syndicate covering transaction to cover syndicate short positions. |
136
Table of Contents
These stabilizing transactions, syndicate covering transactions and penalty bids may have the effect of raising or maintaining the market price of our common stock or preventing or retarding a decline in the market price of the common stock. As a result the price of our common stock may be higher than the price that might otherwise exist in the open market. These transactions may be effected on or otherwise and, if commenced, may be discontinued at any time.
Prior to this offering, there has been no public market for our common stock. The initial public offering price will be determined by negotiations between us and the representatives. In determining the initial public offering price, we and the representatives expect to consider a number of factors including:
| • | the information set forth in this prospectus and otherwise available to the representatives; |
| • | our prospects and the history and prospects for the industry in which we compete; |
| • | an assessment of our management; |
| • | our prospects for future earnings; |
| • | the general condition of the securities markets at the time of this offering; |
| • | the recent market prices of, and demand for, publicly traded common stock of generally comparable companies; and |
| • | other factors deemed relevant by the underwriters and us. |
A prospectus in electronic format may made available on the websites maintained by one or more of the underwriters, or selling group members, if any, participating in this offering and one or more of the underwriters participating in this offering may distribute prospectuses electronically. The representatives may agree to allocate a number of shares to underwriters and selling group members for sale to their online brokerage account holders. Internet distributions will be allocated by the underwriters and selling group members that will make internet distributions on the same basis as other allocations.
Other relationships
The underwriters and their respective affiliates are full-service financial institutions engaged in various activities, which may include securities trading, commercial and investment banking, financial advisory, investment management, investment research, principal investment, hedging, financing and brokerage activities. In the past, the underwriters and their affiliates have not rendered underwriting services to us.
We expect that the underwriters and their respective affiliates will continue to perform various financial advisory, investment banking and lending services for us or our affiliates, from time to time in the future, for which they may receive customary fees and commissions. In the ordinary course of their various business activities, the underwriters and their respective affiliates may also make or hold a broad array of investments and actively trade debt and equity securities (or related derivative securities) and financial instruments (including bank loans) for their own account and for the accounts of their customers and may at any time hold long and short positions in such securities and instruments. Such investment and securities activities may involve our securities and instruments (directly, as collateral securing other obligations or otherwise). The underwriters and their respective affiliates may also make investment recommendations and/or publish or express independent research views in respect of such securities or instruments and may at any time hold, or recommend to clients that they acquire, long and/or short positions in such securities and instruments.
Selling restrictions
Notice to Investors in the European Economic Area
In relation to each Member State of the European Economic Area that has implemented the Prospectus Directive, each, a Relevant Member State, each underwriter represents and agrees that with effect from and
137
Table of Contents
including the date on which the Prospectus Directive is implemented in that Relevant Member State, or the Relevant Implementation Date, it has not made and will not make an offer of our common stock to the public in that Relevant Member State prior to the publication of a prospectus in relation to our common stock that has been approved by the competent authority in that Relevant Member State or, where appropriate, approved in another Relevant Member State and notified to the competent authority in that Relevant Member State, all in accordance with the Prospectus Directive, except that it may, with effect from and including the Relevant Implementation Date, make an offer of our common stock to the public in that Relevant Member State at any time:
| • | to any legal entity which is a qualified investor as defined in the Prospectus Directive; |
| • | to fewer than 100 or, if the Relevant Member State has implemented the relevant provision of the PD Amending Directive, 150, natural or legal persons (other than qualified investors as defined in the Prospectus Directive) subject to obtaining the prior consent of the manager for any such offer; or |
| • | in any other circumstances falling within Article 3(2) of the Prospectus Directive; |
provided that no such offer of our common stock shall require the publication by the Issuer or any underwriter of a prospectus pursuant to Article 3 of the Prospectus Directive.
For the purposes of this provision, the expression an “offer to the public” in relation to any shares of our common stock in any Relevant Member State means the communication in any form and by any means of sufficient information on the terms of the offer and our common stock to be offered so as to enable an investor to decide to purchase or subscribe our common stock, as the same may be varied in that Relevant Member State by any measure implementing the Prospectus Directive in that Member State and the expression Prospectus Directive means Directive 2003/71/EC and (and amendments thereto, including Directive 2010/73/EU, to the extent implemented in each Relevant Member State) includes any relevant implementing measure in each Relevant Member State.
Notice to Investors in Switzerland
Our common stock will not be publicly offered in Switzerland and will not be listed on the SIX Swiss Exchange (“SIX”) or on any other stock exchange or regulated trading facility in Switzerland. This prospectus has been prepared without regard to the disclosure standards for issuance prospectuses under art. 652a or art. 1156 of the Swiss Code of Obligations or the disclosure standards for listing prospectuses under art. 27 ff. of the SIX Listing Rules or the listing rules of any other stock exchange or regulated trading facility in Switzerland.
Neither this prospectus nor any other offering or marketing material relating to our company or our common stock has been or will be filed with or approved by any Swiss regulatory authority. In particular, this prospectus will not be filed with, and the offer of our common stock will not be supervised by, the Swiss Financial Market Supervisory Authority, and the offer of our common stock has not been and will not be authorized under the Swiss Federal Act on Collective Investment Schemes (the “CISA”). The investor protection afforded to acquirers of interests in collective investment schemes under the CISA does not extend to acquirers of our common stock.
Notice to Investors in the United Kingdom
Each underwriter:
| • | has only communicated or caused to be communicated and will only communicate or cause to be communicated any invitation or inducement to engage in investment activity (within the meaning of section 21 of FSMA) in connection with the sale or issue of common stock in circumstances in which section 21 of FSMA does not apply to such underwriter; and |
| • | has complied with, and will comply with all applicable provisions of FSMA with respect to anything done by it in relation to the shares of common stock in, from or otherwise involving the United Kingdom. |
138
Table of Contents
This prospectus is directed solely at persons who (i) are outside the United Kingdom or (ii) have professional experience in matters relating to investments or (iii) are persons falling within Article 49(2)(a) to (d) of The Financial Services and Markets Act (Financial Promotion) Order 2005 (all such persons together being referred to as “relevant persons”). This prospectus must not be acted on or relied on by persons who are not relevant persons. Any investment or investment activity to which this prospectus relates is available only to relevant persons and will be engaged in with relevant persons only.
139
Table of Contents
The validity of the shares of common stock being offered by this prospectus will be passed upon for us by Cooley LLP, New York, New York. Latham & Watkins LLP, New York, New York is representing the underwriters in connection with this offering.
The consolidated financial statements of Yodle, Inc. at December 31, 2012 and 2013 and for each of the three years in the period ended December 31, 2013 appearing in this prospectus and the registration statement, of which this prospectus forms a part, have been audited by Deloitte & Touche LLP, our independent registered public accounting firm, as set forth in their report thereon appearing elsewhere herein, and are included in reliance upon such report given on the authority of such firm as experts in accounting and auditing.
WHERE YOU CAN FIND ADDITIONAL INFORMATION
We have filed with the SEC a registration statement on Form S-1 under the Securities Act, with respect to the shares of common stock being offered by this prospectus. This prospectus, which constitutes part of the registration statement, does not contain all of the information in the registration statement and its exhibits. For further information with respect to us and the common stock offered by this prospectus, we refer you to the registration statement and its exhibits. Statements contained in this prospectus as to the contents of any contract or any other document referred to are not necessarily complete, and in each instance, we refer you to the copy of the contract or other document filed as an exhibit to the registration statement. Each of these statements is qualified in all respects by this reference.
You can read our SEC filings, including the registration statement, over the internet at the SEC’s website at www.sec.gov. You may also read and copy any document we file with the SEC at its public reference facilities at 100 F Street, N.E., Room 1580, Washington, D.C. 20549. You may also obtain copies of these documents at prescribed rates by writing to the Public Reference Section of the SEC at 100 F Street, N.E., Washington, D.C. 20549. Please call the SEC at 1-800-SEC-0330 for further information on the operation of the public reference facilities.
Upon completion of this offering, we will be subject to the information reporting requirements of the Exchange Act, and we will file reports, proxy statements and other information with the SEC. These reports, proxy statements and other information will be available for inspection and copying at the public reference room and web site of the SEC referred to above. We also maintain a website at www.yodle.com, at which you may access these materials free of charge as soon as reasonably practicable after they are electronically filed with, or furnished to, the SEC. However, the information contained in or accessible through our website is not part of this prospectus or the registration statement of which this prospectus forms a part, and investors should not rely on such information in making a decision to purchase our common stock in this offering.
140
Table of Contents
INDEX TO CONSOLIDATED FINANCIAL STATEMENTS
| Audited Financial Statements: |
||||
| Report of Independent Registered Public Accounting Firm |
F-2 | |||
| Consolidated Balance Sheets |
F-3 | |||
| Consolidated Statements of Operations and Comprehensive Loss |
F-4 | |||
| Consolidated Statements of Stockholders’ Deficit |
F-5 | |||
| Consolidated Statements of Cash Flows |
F-6 | |||
| Notes to Consolidated Financial Statements |
F-7 | |||
| Unaudited Interim Financial Statements: |
||||
| Condensed Consolidated Balance Sheet |
F-45 | |||
| Condensed Consolidated Statements of Operations and Comprehensive Income (Loss) |
F-46 | |||
| Condensed Consolidated Statement of Stockholders’ Deficit |
F-47 | |||
| Condensed Consolidated Statements of Cash Flows |
F-48 | |||
| Notes to Unaudited Interim Condensed Consolidated Financial Statements |
F-49 |
F-1
Table of Contents
Report of Independent Registered Public Accounting Firm
To the Board of Directors and Stockholders of
Yodle, Inc.
New York, New York
We have audited the accompanying consolidated balance sheets of Yodle, Inc. and subsidiaries (the “Company”) as of December 31, 2013 and 2012, and the related consolidated statements of operations and comprehensive loss, stockholders’ deficit and cash flows for each of the three years in the period ended December 31, 2013. These consolidated financial statements are the responsibility of the Company’s management. Our responsibility is to express an opinion on the consolidated financial statements based on our audits.
We conducted our audits in accordance with the standards of the Public Company Accounting Oversight Board (United States). Those standards require that we plan and perform the audit to obtain reasonable assurance about whether the financial statements are free of material misstatement. The Company is not required to have, nor were we engaged to perform, an audit of its internal control over financial reporting. Our audits included consideration of internal control over financial reporting as a basis for designing audit procedures that are appropriate in the circumstances, but not for the purpose of expressing an opinion on the effectiveness of the Company’s internal control over financial reporting. Accordingly, we express no such opinion. An audit also includes examining, on a test basis, evidence supporting the amounts and disclosures in the financial statements, assessing the accounting principles used and significant estimates made by management, as well as evaluating the overall financial statement presentation. We believe that our audits provide a reasonable basis for our opinion.
In our opinion, such consolidated financial statements present fairly, in all material respects, the financial position of Yodle Inc. and subsidiaries as of December 31, 2013 and 2012, and the results of their operations and their cash flows for each of the three years in the period ended December 31, 2013, in conformity with accounting principles generally accepted in the United States of America.
/s/ Deloitte & Touche LLP
New York, New York
May 14, 2014
F-2
Table of Contents
Yodle, Inc. and Subsidiaries
Consolidated Balance Sheets
(in thousands, except share and per share data)
| December 31, | ||||||||
| 2012 | 2013 | |||||||
| Assets |
||||||||
| Current assets: |
||||||||
| Cash and cash equivalents |
$ | 9,166 | $ | 12,345 | ||||
| Accounts receivable, net |
3,790 | 3,405 | ||||||
| Prepaid expenses |
1,154 | 953 | ||||||
| Other current assets |
603 | 1,316 | ||||||
|
|
|
|
|
|||||
| Total current assets |
14,713 | 18,019 | ||||||
| Property and equipment, net |
3,757 | 5,277 | ||||||
| Restricted cash |
2,363 | 2,228 | ||||||
| Goodwill |
42,671 | 55,227 | ||||||
| Intangible assets, net |
1,988 | 11,608 | ||||||
| Capitalized technology development costs, net |
895 | 1,103 | ||||||
| Other assets, net |
95 | 267 | ||||||
|
|
|
|
|
|||||
| Total assets |
$ | 66,482 | $ | 93,729 | ||||
|
|
|
|
|
|||||
| Liabilities, convertible preferred stock and stockholders’ deficit |
||||||||
| Current liabilities: |
||||||||
| Accounts payable |
$ | 9,936 | $ | 11,613 | ||||
| Accrued expenses and other current liabilities |
5,944 | 9,383 | ||||||
| Deferred revenue |
13,399 | 13,037 | ||||||
| Preferred stock warrant liabilities |
2,655 | 3,561 | ||||||
| Contingent consideration in business combination |
— | 5,290 | ||||||
| Current portion of bank loan |
3,508 | — | ||||||
| Current portion of subordinated debt |
— | 2,460 | ||||||
|
|
|
|
|
|||||
| Total current liabilities |
35,442 | 45,344 | ||||||
| Other liabilities, long-term portion |
878 | 5,505 | ||||||
| Deferred revenue, long-term portion |
3,667 | 4,000 | ||||||
| Deferred consideration |
— | 1,637 | ||||||
| Bank loan, long-term portion |
12,066 | 2,970 | ||||||
| Subordinated debt, long-term portion |
2,460 | 15,000 | ||||||
|
|
|
|
|
|||||
| Total liabilities |
54,513 | 74,456 | ||||||
|
|
|
|
|
|||||
| Commitments and contingencies (see note 16) |
||||||||
| Convertible preferred stock (see note 13) |
48,733 | 62,411 | ||||||
|
|
|
|
|
|||||
| Stockholders’ deficit: |
||||||||
| Common stock; par value $.0002 per share—142,000,000 and 155,000,000 shares authorized; 34,367,464 and 38,316,173 issued and outstanding as of December 31, 2012 and 2013, respectively |
7 | 8 | ||||||
| Additional paid-in capital |
31,349 | 35,376 | ||||||
| Accumulated deficit |
(68,120 | ) | (78,522 | ) | ||||
|
|
|
|
|
|||||
| Total stockholders’ deficit |
(36,764 | ) | (43,138 | ) | ||||
|
|
|
|
|
|||||
| Total liabilities, convertible preferred stock and stockholders’ deficit |
$ | 66,482 | $ | 93,729 | ||||
|
|
|
|
|
|||||
The accompanying notes are an integral part of these consolidated financial statements.
F-3
Table of Contents
Yodle, Inc. and Subsidiaries
Consolidated Statements of Operations and Comprehensive Loss
(in thousands, except share and per share data)
| Year Ended December 31, | ||||||||||||
| 2011 | 2012 | 2013 | ||||||||||
| Revenues |
$ | 87,584 | $ | 132,321 | $ | 161,863 | ||||||
|
|
|
|
|
|
|
|||||||
| Costs and expenses: |
||||||||||||
| Cost of revenues (exclusive of depreciation and amortization shown separately below) |
33,876 | 42,760 | 53,843 | |||||||||
| Selling and marketing |
36,318 | 51,623 | 64,605 | |||||||||
| Technology and product development |
10,157 | 14,977 | 20,346 | |||||||||
| General and administrative |
15,305 | 19,591 | 29,271 | |||||||||
| Depreciation and amortization |
2,328 | 3,721 | 6,419 | |||||||||
|
|
|
|
|
|
|
|||||||
| Total costs and expenses |
97,984 | 132,672 | 174,484 | |||||||||
|
|
|
|
|
|
|
|||||||
| Loss from operations |
(10,400 | ) | (351 | ) | (12,621 | ) | ||||||
|
|
|
|
|
|
|
|||||||
| Interest expense and other |
(7,074 | ) | (4,690 | ) | (2,912 | ) | ||||||
|
|
|
|
|
|
|
|||||||
| Loss before income taxes |
(17,474 | ) | (5,041 | ) | (15,533 | ) | ||||||
| Provision (benefit) for income taxes |
(2,035 | ) | 387 | (5,131 | ) | |||||||
|
|
|
|
|
|
|
|||||||
| Net loss and comprehensive loss |
$ | (15,439 | ) | $ | (5,428 | ) | $ | (10,402 | ) | |||
|
|
|
|
|
|
|
|||||||
| Net loss attributable to common stockholders: |
||||||||||||
| Basic and diluted |
$ | (15,439 | ) | $ | (5,428 | ) | $ | (10,402 | ) | |||
|
|
|
|
|
|
|
|||||||
| Weighted-average shares used to compute net loss per share attributable to common stockholders: |
||||||||||||
| Basic and diluted |
31,954,766 | 32,572,644 | 35,743,067 | |||||||||
|
|
|
|
|
|
|
|||||||
| Net loss per share attributable to common stockholders: |
||||||||||||
| Basic and diluted |
$ | (0.48 | ) | $ | (0.17 | ) | $ | (0.29 | ) | |||
|
|
|
|
|
|
|
|||||||
The accompanying notes are an integral part of these consolidated financial statements.
F-4
Table of Contents
Yodle, Inc. and Subsidiaries
Consolidated Statements of Stockholders’ Deficit
(in thousands, except share and per share data)
| Common Stock |
Treasury Stock |
Accumulated deficit |
Total Stockholders’ deficit |
|||||||||||||||||||||||||
| Shares | Amount | Shares | Amount | APIC | ||||||||||||||||||||||||
| Balance as of January 1, 2011 |
28,008,229 | $ | 6 | 8,196,897 | $ | (3,706 | ) | $ | 1,304 | $ | (41,089 | ) | $ | (43,485 | ) | |||||||||||||
| Common stock issued upon exercise of stock options |
1,355,513 | — | — | — | 277 | — | 277 | |||||||||||||||||||||
| Restricted stock issued |
2,000,000 | 1 | — | — | — | — | 1 | |||||||||||||||||||||
| Stock issued in connection with acquisition |
13,000,000 | 2 | — | — | 19,627 | — | 19,630 | |||||||||||||||||||||
| Purchase of treasury stock from employees |
— | — | 3,000,000 | (2,460 | ) | — | — | (2,460 | ) | |||||||||||||||||||
| Retirement of treasury stock |
(11,196,897 | ) | (2 | ) | (11,196,897 | ) | 6,166 | — | (6,164 | ) | — | |||||||||||||||||
| Stock-based compensation |
— | — | — | — | 1,832 | — | 1,832 | |||||||||||||||||||||
| Debt discount on conversion feature |
— | — | — | — | 4,975 | — | 4,975 | |||||||||||||||||||||
| Net loss |
— | — | — | — | — | (15,439 | ) | (15,439 | ) | |||||||||||||||||||
|
|
|
|
|
|
|
|
|
|
|
|
|
|
|
|||||||||||||||
| Balance as of December 31, 2011 |
33,166,845 | 7 | — | — | 28,015 | (62,692 | ) | (34,669 | ) | |||||||||||||||||||
| Common stock issued upon exercise of stock options and warrants |
1,200,629 | — | — | — | 269 | — | 269 | |||||||||||||||||||||
| Stock-based compensation |
— | — | — | — | 2,866 | — | 2,866 | |||||||||||||||||||||
| Issuance of warrants with debt issuance |
— | — | — | — | 199 | — | 199 | |||||||||||||||||||||
| Conversion of bridge financing |
— | — | — | — | — | — | — | |||||||||||||||||||||
| Net loss |
— | — | — | — | — | (5,428 | ) | (5,428 | ) | |||||||||||||||||||
|
|
|
|
|
|
|
|
|
|
|
|
|
|
|
|||||||||||||||
| Balance as of December 31, 2012 |
34,367,474 | 7 | — | — | 31,349 | (68,120 | ) | (36,764 | ) | |||||||||||||||||||
| Common stock issued upon exercise of stock options and warrants |
3,987,810 | 1 | — | — | 1,396 | — | 1,397 | |||||||||||||||||||||
| Treasury stock acquired from ProfitFuel escrow |
— | — | 39,111 | (117 | ) | — | — | (117 | ) | |||||||||||||||||||
| Retirement of treasury stock |
(39,111 | ) | — | (39,111 | ) | 117 | — | — | 117 | |||||||||||||||||||
| Stock-based compensation |
— | — | — | — | 2,631 | — | 2,631 | |||||||||||||||||||||
| Net loss |
— | — | — | — | — | (10,402 | ) | (10,402 | ) | |||||||||||||||||||
|
|
|
|
|
|
|
|
|
|
|
|
|
|
|
|||||||||||||||
| Balance as of December 31, 2013 |
38,316,173 | $ | 8 | — | $ | — | $ | 35,376 | $ | (78,522 | ) | $ | (43,138 | ) | ||||||||||||||
|
|
|
|
|
|
|
|
|
|
|
|
|
|
|
|||||||||||||||
The accompanying notes are an integral part of these consolidated financial statements.
F-5
Table of Contents
Yodle, Inc. and Subsidiaries
Consolidated Statements of Cash Flows
(in thousands)
| Year Ended December 31, | ||||||||||||
| 2011 | 2012 | 2013 | ||||||||||
| Cash Flows from Operating Activities |
||||||||||||
| Net loss |
$ | (15,439 | ) | $ | (5,428 | ) | $ | (10,402 | ) | |||
| Adjustments to reconcile net loss to net cash provided by/(used in) operating activities: |
||||||||||||
| Depreciation of property and equipment |
907 | 1,373 | 2,000 | |||||||||
| Amortization of acquired intangible assets and capitalized technology development costs |
1,421 | 2,348 | 4,419 | |||||||||
| Stock-based compensation expense |
1,832 | 2,866 | 2,631 | |||||||||
| Chargebacks expense |
1,477 | 1,059 | 1,108 | |||||||||
| Accretion/amortization of debt discounts |
5,609 | 621 | 354 | |||||||||
| Deferred rent and lease abandonment |
780 | (639 | ) | 724 | ||||||||
| Preferred stock warrant liabilities mark-to-market loss/(gain) |
(373 | ) | 917 | 906 | ||||||||
| Fair value change in contingent consideration—Lighthouse business combination |
— | — | 712 | |||||||||
| Compensation expense in connection with Lighthouse business combination |
— | — | 4,000 | |||||||||
| Deferred taxes on business combination |
(2,100 | ) | — | (5,399 | ) | |||||||
| Other |
562 | 751 | 314 | |||||||||
| Changes in operating assets and liabilities, net of effect of business combinations: |
||||||||||||
| Prepaid expenses |
(169 | ) | (544 | ) | 259 | |||||||
| Other current assets |
— | (307 | ) | (693 | ) | |||||||
| Accounts receivable |
(765 | ) | (2,186 | ) | 588 | |||||||
| Other assets |
(321 | ) | 17 | (33 | ) | |||||||
| Accounts payable |
1,447 | 4,042 | 1,515 | |||||||||
| Accrued expenses and other current liabilities |
(2,035 | ) | 1,698 | 1,495 | ||||||||
| Deferred revenue |
13,670 | (1,532 | ) | (369 | ) | |||||||
|
|
|
|
|
|
|
|||||||
| Net cash provided by operating activities |
6,503 | 5,056 | 4,129 | |||||||||
|
|
|
|
|
|
|
|||||||
| Cash Flows from Investing Activities |
||||||||||||
| Cash paid for business combination, net of cash acquired |
(17,282 | ) | — | (4,997 | ) | |||||||
| Purchase of property and equipment |
(1,222 | ) | (2,889 | ) | (3,281 | ) | ||||||
| Capitalization of technology development costs |
(688 | ) | (381 | ) | (815 | ) | ||||||
| Change in restricted cash |
— | (1,500 | ) | 135 | ||||||||
|
|
|
|
|
|
|
|||||||
| Net cash used in investing activities |
(19,192 | ) | (4,770 | ) | (8,958 | ) | ||||||
|
|
|
|
|
|
|
|||||||
| Cash Flows from Financing Activities |
||||||||||||
| Proceeds from bank loan |
10,000 | 3,806 | 561 | |||||||||
| Repayment of bank loan |
(556 | ) | (2,163 | ) | (13,652 | ) | ||||||
| Proceeds from subordinated debt |
9,000 | — | 15,000 | |||||||||
| Payment of deferred payment for ProfitFuel business combination |
— | (7,500 | ) | — | ||||||||
| Repayment of vendor financing |
(31 | ) | (139 | ) | — | |||||||
| Issuance costs from borrowings related to bank and subordinated loans |
— | — | (226 | ) | ||||||||
| Proceeds from issuance of preferred stock, net |
— | — | 4,928 | |||||||||
| Proceeds from issuance of common stock, net |
277 | 269 | 1,397 | |||||||||
|
|
|
|
|
|
|
|||||||
| Net cash provided by/(used in) financing activities |
18,690 | (5,727 | ) | 8,008 | ||||||||
|
|
|
|
|
|
|
|||||||
| Net increase/(decrease) in cash and cash equivalents |
6,001 | (5,441 | ) | 3,179 | ||||||||
| Cash and cash equivalents as of beginning of year |
8,606 | 14,607 | 9,166 | |||||||||
|
|
|
|
|
|
|
|||||||
| Cash and cash equivalents as of end of year |
$ | 14,607 | $ | 9,166 | $ | 12,345 | ||||||
|
|
|
|
|
|
|
|||||||
The accompanying notes are an integral part of these consolidated financial statements.
F-6
Table of Contents
Yodle, Inc. and Subsidiaries
Notes to Consolidated Financial Statements
As of December 31, 2012 and 2013 and for the
years ended December 31, 2011, 2012 and 2013
(in thousands, except share and per share data)
1. DESCRIPTION OF BUSINESS
Yodle, Inc. and subsidiaries (“Yodle” or the “Company”) is a provider of cloud-based marketing automation solutions for local businesses that makes digital marketing easy, affordable and transparent. Yodle’s platform provides its customers with an online, mobile and social presence, as well as automates, manages and optimizes their marketing activities and other consumer interactions. Yodle’s solutions are highly integrated and designed to be easy-to-use, helping local businesses navigate the rapidly evolving, technologically challenging, and highly fragmented digital marketing landscape without having to invest a significant amount of time and money or needing any in-house marketing or IT expertise.
Certain Significant Risks and Uncertainties—Yodle operates in a rapidly changing environment that involves a number of risks, some of which are beyond the Company’s control that could have a material adverse effect on the Company’s business, operating results, and financial condition. These risks include, among others, Yodle’s history of losses and ability to achieve profitability in the future, highly competitive environment, ability to maintain and increase usage rate of the Company’s platform, and ability to increase demand for its solutions. Yodle purchases the majority of its media from Google, and the business could be adversely affected if Google takes actions that are adverse to Yodle’s interests. Similar actions from Yahoo!, Microsoft, and other media providers could adversely affect the business to a lesser degree. The media purchases represent traffic acquisition costs, net, and are recorded in cost of revenues in the consolidated financial statements.
2. SUMMARY OF SIGNIFICANT ACCOUNTING POLICIES
Basis of Presentation—The consolidated financial statements and accompanying notes have been prepared in accordance with accounting principles generally accepted in the United States of America (“GAAP”).
Use of Estimates—The preparation of consolidated financial statements in conformity with GAAP requires management to make estimates and assumptions that affect the reported amounts of assets and liabilities and disclosure of contingent assets and liabilities at the date of the consolidated financial statements and the reported amounts of revenue and expenses during the reported period. Significant estimates include fair value of the Company’s common stock, stock based compensation, preferred stock warrant liability, purchase price allocation, revenue recognition, expected customer lives, and recoverability of goodwill and acquired intangible assets. These estimates are based on information available as of the date of the consolidated financial statements. Therefore, actual results could differ from those estimates.
Principles of Consolidation—The accompanying consolidated financial statements include the accounts of Yodle, Inc. and its wholly-owned subsidiaries, ProfitFuel, Inc., Lighthouse Practice Management Group, Inc., and Yodle Canada Inc. All intercompany balances and transactions have been eliminated in consolidation.
Business Combinations—Yodle’s consolidated financial statements include the operations of acquired businesses from the date of their acquisition. Yodle records business combinations under the acquisition method of accounting. All acquired assets and liabilities assumed are recorded at fair value on the date of acquisition. Transaction costs of $0.3 million related to the acquisition of ProfitFuel, Inc. in 2011 and $0.4 million related to the acquisition of Lighthouse Practice Management Group, Inc. in 2013 were expensed as incurred and recorded in general and administrative expenses in the consolidated statements of operations. Any excess of the purchase price over the assigned values of the net assets acquired is recorded as goodwill and is allocated to the reporting unit(s) expected to benefit from the business combination. Contingent consideration is included within the
F-7
Table of Contents
Yodle, Inc. and Subsidiaries
Notes to Consolidated Financial Statements
As of December 31, 2012 and 2013 and for the
years ended December 31, 2011, 2012 and 2013
(in thousands, except share and per share data)
acquisition cost and is recognized at its fair value on the acquisition date. A liability resulting from contingent consideration is remeasured to fair value at each reporting date until the contingency is resolved and changes in fair value are recorded in the consolidated statements of operations within general and administrative expenses.
Foreign Currency Translation—Yodle and its subsidiaries are U.S. based except for Yodle Canada which began operations in 2012 and uses the U.S. Dollar as its functional currency since the income and expenses of the subsidiary are in U.S. Dollars. Since almost all of Yodle’s transactions are in U.S. dollars, the Company is not subject to material foreign currency translation adjustments in its consolidated financial statements.
Cash and Cash Equivalents—Yodle considers all highly liquid investments with an original maturity of three months or less when purchased to be cash equivalents. Included in cash and cash equivalents is approximately $6.7 million and $5.3 million invested in a money market account at December 31, 2012 and 2013, respectively (see note on Fair Value Measurements).
Accounts Receivable, net—Yodle bills the majority of its customers by credit card or e-check. Some larger customers and resellers are invoiced. Accounts receivable are recorded at the billed amount and no interest is charged. Yodle reviews the accounts receivable which are past due to identify specific customers with known disputes or collectability issues. The allowance for doubtful accounts is insignificant as of December 31, 2012 and 2013.
Refunds and Chargebacks—The majority of Yodle customers are billed in advance via credit card or e-check.
Refunds occur when a customer approaches Yodle directly and requests all or a portion of amounts paid to be returned. We apply these refunds to amounts Yodle has collected but not yet recognized as revenue, as a reduction to Deferred revenue. To the extent that a refund exceeds amounts Yodle has collected but not yet recognized as revenue, Yodle reduces revenue accordingly. Refunds of $0.8 million, $1.3 million and $1.4 million reduced revenues for the years ended December 31, 2011, 2012 and 2013, respectively.
Chargebacks occur when a customer requests their credit card provider to take back payment previously made to Yodle after services have been rendered. Yodle records estimates for probable losses from chargebacks based on historical experience. Expenses related to chargebacks totaled $1.8 million, $1.3 million and $1.1 million for the years ended December 31, 2011, 2012, and 2013, respectively, and are recorded in general and administrative expense in the consolidated statements of operations. Accrued chargebacks were $0.2 million and $0.4 million as of December 31, 2012 and 2013, respectively and recorded in accrued expenses and other current liabilities in the consolidated balance sheets.
Restricted Cash—Restricted cash represents deposits made to fully collateralize certain standby letters of credit issued in connection with office lease arrangements. The restrictions will lapse when the letters of credit expire at the end of the respective lease terms from 2015 through 2021.
Long-lived Assets—Yodle reviews long-lived assets that have finite useful lives when an event occurs indicating the potential for impairment. If any indicators are present, Yodle performs a recoverability test by comparing the sum of the estimated undiscounted future cash flows attributable to the assets in question to their carrying amounts. If the undiscounted cash flows used in the test for recoverability are less than the long-lived assets carrying amount, Yodle determines the fair value of the long-lived asset and recognizes an impairment loss if the carrying amount of the long-lived asset exceeds its fair value. The impairment loss recognized is the amount by which the carrying amount of the long-lived asset exceeds its fair value. Management determined that there was no impairment charge for long-lived assets during the years ended December 31, 2011, 2012 and 2013.
F-8
Table of Contents
Yodle, Inc. and Subsidiaries
Notes to Consolidated Financial Statements
As of December 31, 2012 and 2013 and for the
years ended December 31, 2011, 2012 and 2013
(in thousands, except share and per share data)
Property and Equipment, net—Property and equipment consists of office furniture, office and computer equipment and leasehold improvements and is recorded at cost, with the exception of the long-lived assets acquired in the ProfitFuel and Lighthouse business combinations, which were recorded at fair value at the time of the business combination. Depreciation is computed using the straight-line method over five years for all office furniture and over three years for office and computer equipment. Leasehold improvements are amortized on a straight-line basis over the shorter of the lease term or their estimated useful lives. Improvements that extend the useful lives of property and equipment are capitalized while expenditures for maintenance and repairs are charged to expense as incurred.
Goodwill and Acquired Intangible Assets, net—Yodle records goodwill when the purchase price of net tangible and acquired intangible assets acquired exceeds their fair value. Acquired intangible assets include identifiable acquired technologies, trade names and trade marks, customer relationships and non-competition agreements. Yodle amortizes the cost of finite-lived acquired intangible assets over their estimated useful lives, which are periods of five years or less. Amortization is based on the pattern in which the economic benefits of the intangible asset are expected to be realized.
Yodle tests goodwill for impairment at least annually as of October 1, or more frequently if events or changes in circumstances indicate that this asset may be impaired. The analysis is done at the reporting unit level, and the Company has determined it has one reporting unit. This is consistent with its one operating segment value for all years presented (see note on Segment, Geographic, and Significant Customer Information). Therefore, the Company’s uses it enterprise value as its fair value.
Impairment testing for goodwill is performed utilizing either a qualitative assessment or a two-step process. If the Company decides that it is appropriate to perform a qualitative assessment, management first assesses qualitative factors to determine whether it is more likely than not that the fair value of a reporting unit is less than its carrying amount. If we conclude that the fair value of a reporting unit more likely than not exceeds its carrying value, no further evaluation is necessary. If we conclude that it is not more likely than not that the fair value exceeds its carrying value, management is required to perform the two-step process. If management performs the two-step process, then we estimate the fair value of the reporting unit and compare that to the carry value of the reporting unit. If the fair value of the reporting unit exceeds its carrying value, the goodwill is not considered impaired and no further evaluation is necessary. If the carrying value is higher than the estimated fair value, there is an indication that impairment may exist and the second step is required. In the second step, the implied fair value of goodwill is calculated as the excess of the fair value of a reporting unit over the fair values assigned to its assets and liabilities. If the implied fair value of goodwill is less than the carrying value of the reporting unit’s goodwill, the difference is recognized as an impairment charge.
Under the qualitative assessment, the Company considers a variety of qualitative factors, including general economic conditions, industry and market specific conditions, customer behavior, cost factors, the Company’s financial performance and trends, its strategies and business plans, capital requirements, management and personnel issues, and stock price, among others. Under the two step process, the Company estimates the fair value based on a number of factors, including: (a) appropriate consideration of valuation approaches (income approach, comparable public company approach, and comparable transaction approach), (b) estimates of future growth rates, (c) estimates of the Company’s future cost structure, (d) discount rates for its estimated cash flows, (e) selection of peer group companies for the public company and the market transaction approaches, (f) required levels of working capital, (g) assumed terminal value, and (h) time horizon of cash flow forecasts. Changes in these estimates and assumptions could materially affect the determination of fair value and goodwill impairment of the one reporting unit.
Yodle reviews acquired intangible assets that have finite useful lives when an event occurs indicating the potential for impairment. If any indicators are present, Yodle performs a recoverability test by comparing the
F-9
Table of Contents
Yodle, Inc. and Subsidiaries
Notes to Consolidated Financial Statements
As of December 31, 2012 and 2013 and for the
years ended December 31, 2011, 2012 and 2013
(in thousands, except share and per share data)
sum of the estimated undiscounted future cash flows attributable to the acquired intangibles in question to their carrying amounts. If the undiscounted cash flows used in the tests for recoverability are less than the acquired intangibles carrying amount, the Company determines the fair value of the acquired intangibles and recognizes an impairment loss if the carrying amount of the acquired intangibles exceeds its fair value. The impairment loss recognized is the amount by which the carrying amount of the acquired intangibles exceeds its fair value.
Capitalized Technology Development Costs, net—Yodle follows the guidance of the Financial Accounting Standards Board’s (“FASB”) Accounting Standards Codification (“ASC”) 350-40, Intangibles-Internal Use Software, to account for capitalized technology development costs. The Company capitalizes payroll and payroll-related costs incurred by employees involved in developing new or additional functionality essential to Yodle’s platform during the development stage. Costs incurred during the preliminary project and post-implementation stages are expensed as incurred and included in technology and product development in the consolidated statements of operations. Once the technology has reached technological feasibility, internal and external costs, if direct and incremental, are capitalized until it is substantially complete and ready for intended use. Capitalized technology development costs are amortized on a straight-line basis over their estimated useful life of three years.
Deferred Revenue—Deferred revenue consists of billings or payments received in advance of revenue recognition and is recognized when the revenue recognition criteria are met. Deferred revenue that is expected to be recognized during the subsequent 12-month period is classified as current and the remainder is classified long-term.
Deferred Rent—Yodle is subject to operating leases that contain predetermined fixed escalations of the minimum rental payments to be made during the original term of the lease (which includes “rent free” periods and construction periods). For these leases, the Company recognizes the related expense on a straight-line basis over the life of the lease, commencing on the date it takes possession of the premises.
Concentrations of Credit Risk—Financial instruments which potentially subject Yodle to concentrations of credit risk consist primarily of cash and cash equivalents and bank loans. Yodle has investment policies that limit the amount of credit exposure to any one issuer.
Cash and cash equivalents and restricted cash are deposited with major financial institutions and, at times, such balances with any one financial institution may be in excess of the Federal Deposit Insurance Company’s (FDIC) insured limits of $250,000. At December 31, 2012 and 2013, approximately $11.3 million and $14.3 million, respectively, in cash and cash equivalents and restricted cash were deposited in excess of FDIC-insured limits.
Fair Value of Financial Instruments—The carrying amount of cash and cash equivalents except for money market funds, accounts receivable, accounts payable, and accrued expenses and other current liabilities approximate fair value because of the short maturity of these instruments. Money market funds are stated at fair value. The carrying amount of restricted cash approximates fair value because as the restrictions expire, the carrying value represents the amount that the Company will receive. Amounts outstanding under bank loans and other debt instruments are shown net of any discounts, including beneficial conversion and warrant discounts (see notes on Bank Loans, Warrants, and Subordinated Debt). Yodle has not elected the fair value measurement option for its financial instruments, assets, or liabilities under ASC 825, Financial Instruments. For example, Yodle’s loan principal balances are not marked to market in each reporting period. Instead they are shown net of any discount (primarily from issuance of warrants) and the debt discount is amortized using an effective interest method. All preferred stock warrants were recorded as derivative liabilities at fair value upon issuance and subsequently recorded at fair value in each reporting period, with changes in fair value recorded as interest expense and other in the consolidated statements of operations in accordance with ASC 815, Derivatives and
F-10
Table of Contents
Yodle, Inc. and Subsidiaries
Notes to Consolidated Financial Statements
As of December 31, 2012 and 2013 and for the
years ended December 31, 2011, 2012 and 2013
(in thousands, except share and per share data)
Hedging (see notes on Bank Loans, Preferred Stock Warrants, and Subordinated Debt). Inputs used to measure the fair value of warrants issued in connection with debt are disclosed in the note on Preferred Stock Warrants.
Treasury Stock—Shares of Yodle’s common stock that are repurchased are recorded as treasury stock at cost and are included as a component of stockholders’ deficit. In 2011, the Company retired all of its then outstanding treasury stock. In August 2013, Yodle acquired additional treasury stock in connection with shares of stock held in escrow related to the ProfitFuel business combination; these shares were retired in December 2013.
Convertible Preferred Stock—Yodle follows the guidance of ASC 480, Distinguishing Liabilities from Equity and ASC 815, Derivatives and Hedging Instruments in determining the treatment of its preferred shares.
The convertible preferred stock is classified in mezzanine/temporary equity under the terms of ASC 480-10-S99-A3, as it represents a contingently redeemable security due to the holders’ right to redeem upon the occurrence of a deemed liquidation event. The convertible preferred stock is initially measured at their fair value at the issuance date and the carrying amount of convertible preferred stock is not remeasured as long as it is not probable of becoming redeemable. Costs directly associated with the issuance of the convertible preferred stock (e.g., legal costs, etc.) were recorded at issuance as a reduction to the redeemable preferred stock amount. At the time when a deemed liquidation event is considered probable, the convertible preferred stock balance will be re-measured to its redemption value (i.e., liquidation preference) and then will adjust the carrying amount of the instrument to equal the redemption value at the end of each reporting period. As of December 31, 2013, Yodle concluded that a deemed liquidation event was not probable and therefore preferred stock is presented net of issuance costs.
Preferred Stock Warrants Liabilities—The preferred stock warrants are exercisable into Series A, B, or D Preferred Stock, which includes certain redemption rights that are considered outside of the control of the Company, in accordance with ASC 480 – Distinguishing Liabilities from Equity, the Warrants are accounted for as a liability at their fair value and are re-measured at fair value on each reporting date with the change reported as interest expense and other on the consolidated statements of operations. Fair values for the preferred stock warrants are determined using the Black-Scholes-Merton valuation technique. The Black-Scholes-Merton valuation model provides for dynamic assumptions regarding volatility and risk-free interest rates within the total period to maturity. Accordingly, within the contractual term, the Company provided multiple date intervals over which multiple volatilities and risk free interest rates were used. These intervals allow the Black-Scholes-Merton model valuation to project outcomes along specific paths which consider volatilities and risk free rates that would be more likely in an early exercise scenario (see note on Fair Value Measurements). Upon the consummation of an IPO, the preferred stock warrants, except for Series D preferred bridge financing warrants which expire or will net exercise upon an IPO, will convert into warrants to purchase common stock. Upon conversion, the liability recorded for the preferred stock warrants will be reclassified to additional paid-in capital.
Segments—Operating segments are components of an enterprise about which separate financial information is available and evaluated regularly by the enterprise’s chief operating decision maker (“CODM”) in deciding how to allocate resources and in assessing performance. Yodle’s Chief Executive Officer is its CODM. Yodle’s operations constitute one operating and reportable segment.
Revenue Recognition—Revenue is recognized when there is persuasive evidence of an agreement or arrangement, services have been rendered, the price to the buyer is fixed or determinable and collectability is reasonably assured. Yodle’s primary sources of revenue are from sales related to Yodle Ads, and sales of its platform offerings, including Yodle Organic, Yodle Web, Lighthouse, and set up and website design fees.
F-11
Table of Contents
Yodle, Inc. and Subsidiaries
Notes to Consolidated Financial Statements
As of December 31, 2012 and 2013 and for the
years ended December 31, 2011, 2012 and 2013
(in thousands, except share and per share data)
Revenue from Yodle Ads is generated from online advertising, including search engine marketing (“SEM”). Revenue is recognized as local online advertising is purchased for that customer. Under the Yodle Ads offering, customers agree in advance to a monthly media budget. If the entirety of the customer’s media budget is not used during the relevant period, the outstanding amount remains recorded as deferred revenue and is recognized when used. Yodle acts as a principal in these transactions as the Company is the primary obligor in the arrangement, performs a significant portion of the services, sets the pricing, retains credit risk and has discretion in the supplier selection.
Revenue from Yodle Organic is generated from subscriptions for search engine optimization (“SEO”) whereby Yodle uses it proprietary algorithm technology to enable our customers to be more easily found through various internet search engines. Yodle charges a monthly subscription fee which is recognized ratably over the period of service.
Revenue from Yodle Web is generated from subscriptions to our digital presence offering, which encompasses the maintenance of a professional quality website that is easily discoverable and optimized for mobile devices and connected to online directories and rating and review sites. Yodle charges a monthly subscription fee which is recognized ratably over the period of service.
Revenue from Lighthouse is generated from subscriptions to our business practice automation software service that is used by customers to manage many of their customer interactions and administrative office routines such as appointment management. Yodle charges a monthly subscription fee which is recognized ratably over the period of service.
Set up and website design fees are one-time and are recognized over the expected customer life, which is based on historical experience.
Yodle applies ASC 605-25, Revenue Recognition—Multiple Element Arrangements, to account for the revenue arrangements with customers that involve multiple deliverables. When an arrangement involves multiple elements and it is determined that the elements should be accounted for as separate units of accounting, the entire fee from the arrangement is allocated to each respective element based on relative fair value and recognized when the revenue recognition criteria for each element is met. For all services provided, Yodle determines the selling price using either vendor specific objective evidence (“VSOE”) or if VSOE is not available, estimated selling price. The significant factors, inputs and assumptions used in estimating selling price include actual selling prices, historical information and other entity specific considerations.
Yodle also provides its offerings through resellers. Yodle earns a per customer fee for offerings of Yodle Organic and Yodle Web sold by resellers. Additionally, Yodle collects a share of the revenue that resellers generate from sales of Yodle Ads. Yodle recognizes revenue in the period that it delivers its offerings to the customer on behalf of the resellers. Additionally, certain of Yodle’s resellers have guaranteed to provide the Company with a minimum fee structure, regardless of the volume of their sales. Historically resellers have exceeded the minimum guarantee. For sales through resellers, Yodle is not the primary obligor and is not subject to credit risk, and therefore revenue is recognized on a net basis.
In 2011, effective for the 2012 fiscal year, Yodle entered into a multi-year licensing agreement to distribute its offerings in Canada through a reseller. The reseller paid a $10.0 million licensing fee upon signing the
F-12
Table of Contents
Yodle, Inc. and Subsidiaries
Notes to Consolidated Financial Statements
As of December 31, 2012 and 2013 and for the
years ended December 31, 2011, 2012 and 2013
(in thousands, except share and per share data)
agreement. The licensing fee is being recognized ratably over the estimated life of the reseller relationship, which approximates the term of the contract, commencing in January 2012 and originally ending December 31, 2014. On September 9, 2013, Yodle and the reseller agreed to modify the agreement, including extending the term until December 31, 2018. At that time, Yodle updated its estimated life of the reseller relationship to consider the remaining contract term and amortizes the remaining license fee over the remaining estimated life of the reseller relationship. In addition to this licensing fee, Yodle may also earn milestone payments if certain revenue targets are met by the reseller. These milestone payments, if earned, would be recognized ratably over the estimated life of the reseller relationship with a cumulative catch up recognized for the elapsed portion of the estimated life of the reseller relationship. In 2012 and 2013, the first and second milestones were obtained, and therefore the reseller paid the Yodle an additional $1.0 million for each milestone. As of December 31, 2013, one additional milestone remained unearned. Yodle also earns per customer fee revenue from its Canadian reseller on sales of Yodle offerings to its customers as well as revenues from assisting its reseller in executing its operations.
Cost of Revenues—Cost of revenues consists of traffic acquisition costs, net of provider rebates, client service account setup personnel costs including salaries, bonuses, stock-based compensation and other personnel costs, third party costs associated with service delivery, co-location, hosting and designing websites, and credit card processing fees. No allocation of depreciation and amortization expense was made to cost of revenues.
Three vendors accounted for approximately 89 percent of Yodle’s net traffic acquisition costs net of $26.2 million, $32.7 million and $38.5 million in 2011, 2012 and 2013, respectively. Traffic acquisition costs are the expenses charged by search engines when a consumer clicks on a sponsored link. Yodle has agreements with all three vendors, which either party may terminate through written notice.
Advertising expense—Advertising expense is recorded in Selling and Marketing in the consolidated statements of operations and was approximately $3.8 million, $3.3 million and $5.1 million for the years ended December 31, 2011, 2012 and 2013, respectively.
Income Taxes—Yodle uses the asset and liability method of accounting for income taxes as prescribed by ASC Topic 740, Income Taxes, which recognizes deferred tax assets and liabilities for the future tax consequences attributable to differences between the financial statement carrying amounts of existing assets and liabilities and their respective tax bases. Deferred tax assets and liabilities are measured using existing enacted tax rates expected to apply to taxable income in the years in which those temporary differences are expected to be recovered or settled. The effect on deferred tax assets and liabilities of a change in tax rates is recognized in income in the period that includes the enactment date. Valuation allowances are recorded to reduce deferred tax assets when it is more likely than not that a tax benefit will not be realized. Yodle follows the provisions of ASC 740-10, Accounting for Uncertainty in Income Taxes, and includes in the consolidated financial statements only those tax positions that are more-likely-than-not to be sustained.
Stock-Based Compensation—Yodle accounts for stock-based compensation awards issued to its employees and members of its Board of Directors (the “Board”) in accordance with ASC 718, Compensation—Stock Compensation. ASC 718 requires that the cost resulting from all share-based payment transactions be recognized in the financial statements. This statement establishes fair value as the measurement objective in accounting for share-based payment arrangements and requires all entities to apply a fair value-based measurement method in accounting for these transactions with employees.
F-13
Table of Contents
Yodle, Inc. and Subsidiaries
Notes to Consolidated Financial Statements
As of December 31, 2012 and 2013 and for the
years ended December 31, 2011, 2012 and 2013
(in thousands, except share and per share data)
Stock-based compensation is measured at grant date based on the estimated fair value of the award and is expensed on a straight-line basis over the requisite service period. Fair values of share-based payment awards are determined on the date of grant using the Black-Scholes-Merton option pricing model to estimate the fair value of its stock options awards to employees.
Since there is no public market for Yodle’s common stock, the Company uses the “calculated value method,” which relies on comparable company historical volatility and uses the average of i) the weighted-average vesting period and ii) the contractual life of the option, calculated using the “simplified method”. The simplified method allows for estimating the expected life based on an average of the option vesting term and option life, provided that all options meet certain criteria of “plain vanilla” options. Yodle bases its estimates of expected volatility on the median historical volatility of a group of publicly traded companies it believes are comparable to the Company based on the criteria set forth in ASC 718, Compensation-Stock Compensation, considering factors such as line of business, stage of development, size and financial leverage. The risk-free rate of interest for periods within the contractual life of the stock option award is based on the yield of U.S. Treasury bonds on the date the award is granted with a maturity equal to the expected term of the award. Since Yodle makes grants throughout the year, there will be a range of risk-free rates and average expected lives used during the year. The Company uses historical data to estimate forfeitures. Additionally, Yodle has assumed that dividends will not be paid.
The Company accounts for stock awards issued to consultants other than members of the Board in accordance with the provisions of ASC 505-50, Equity-Based Payments to Non-Employees. Restricted stock awards are measured based on the fair market values of the underlying common stock on the dates of grant and expensed on a straight-line basis over the requisite service period.
Other Comprehensive Loss—Yodle did not have any items of other comprehensive income or loss during the years ended December 31, 2011, 2012 or 2013.
Subsequent Events—Yodle follows ASC 855-10, Subsequent Events, which contains general standards of accounting for and disclosure of events that occur after the balance sheet date but before the consolidated financial statements are available to be issued. Management has considered subsequent events through May 14, 2014, the date the consolidated financial statements were available to be issued (see note on Subsequent Events).
Recently Issued Accounting Guidance—During the fiscal third quarter of 2012, the FASB issued ASU No. 2012-02, Intangibles—Goodwill and Other (Topic 350), Testing Indefinite-Lived Intangible Assets for Impairment, which provides guidance and amendments related to testing indefinite-lived intangible assets for impairment. Under the amendments in this update, an entity has the option to first assess qualitative factors to determine whether the existence of events or circumstances indicates that it is more likely than not that the indefinite-lived intangible asset is impaired. If, after assessing the totality of events and circumstances, an entity concludes that it is not more likely than not that the indefinite-lived intangible asset is impaired, then the entity is not required to determine the fair value. However, if an entity concludes otherwise, then it is required to determine the fair value of the indefinite-lived intangible asset and perform the quantitative impairment test. An entity also has the option to bypass the qualitative assessment for any indefinite-lived intangible asset in any period and proceed directly to performing the quantitative impairment test. This update became effective for impairment tests performed for fiscal years beginning after September 15, 2012. However, early adoption was permitted. Yodle adopted this standard on January 1, 2013, and the adoption did not have a material impact on the Company’s consolidated results of operations, cash flows, or financial position.
F-14
Table of Contents
Yodle, Inc. and Subsidiaries
Notes to Consolidated Financial Statements
As of December 31, 2012 and 2013 and for the
years ended December 31, 2011, 2012 and 2013
(in thousands, except share and per share data)
In July 2013, the FASB issued ASU No. 2013-11, Presentation of an Unrecognized Tax Benefit When a Net Operating Loss Carryforward, a Similar Tax Loss, or Tax Credit Carryforward Exists. ASU 2013-11 requires entities to present an unrecognized tax benefit, or a portion of an unrecognized tax benefit, as a reduction to a deferred tax asset for a net operating loss carryforward, a similar tax loss, or a tax credit carryforward when settlement in this manner is available under the tax law. This ASU is effective prospectively for fiscal years, and interim periods within those years, beginning after December 15, 2013. Yodle is evaluating the potential impact of this adoption on its consolidated financial statements.
3. BUSINESS COMBINATIONS
Lighthouse Practice Management Group, Inc.
On February 28, 2013, Yodle acquired 100% of Lighthouse Practice Management Group, Inc. (“Lighthouse”), a provider of dental appointment reminder and practice automation software services, based in Georgia. This business combination resulted in Yodle adding a strong practice automation capability to its existing offerings.
Under the terms of the merger agreement, Yodle (i) paid Lighthouse shareholders $5.0 million in cash at closing; (ii) issued 3,804,348 shares of its Series E Preferred Stock at a fair value of $2.30 per share to the shareholders of Lighthouse that qualified as accredited investors (of which 2,065,217 shares remain in escrow as of December 31, 2013); (iii) promised to pay the Lighthouse shareholders deferred payment consideration of $6.2 million in cash at a later time (the “Deferred Payment”); and (iv) agreed to pay the shareholders an earn-out consideration (the “Earn-out”), the amount of which is based on revenue performance over the measurement period (commencing March 1, 2013 and ending February 28, 2014), not to exceed $3.0 million in cash and 869,565 shares. A portion (40%) of the Earn-out will be paid by the issuance of additional Series E Preferred Stock, calculated by dividing the amount of share based Earn-out earned by the initial fair value of $2.30 per share, and the balance (60%) will be paid in cash to the shareholders. Fair value of the Earn-out at the acquisition date was $4.6 million.
The Deferred Payment is due on the earlier of (a) the second anniversary of the effective date (February 28, 2015), (b) the closing of an initial public offering that nets proceeds to Yodle of at least $20.0 million (“Qualifying Public Offering”), and (c) the closing of a sale of Yodle. The Deferred Payment was subject to a post-close working capital adjustment and was reduced by $0.1 million. The Deferred Payment, subject to the terms of the agreement, accrues a simple interest rate of 8% per annum from the effective date and is payable to shareholders quarterly in arrears. The Company has an option to extend the due date to February 28, 2017 which would result in the interest rate increasing from 8% to 12%.
Under the terms of the Deferred Payment, $1.7 million is accounted for as consideration in the business combination, and $4.5 million is compensation expense under ASC 710. The $1.7 million had a fair value at acquisition of $1.6 million, and is adjusted to fair value at each reporting date. As of December 31, 2013, the fair value of the consideration remained $1.6 million and is recorded in deferred consideration in the consolidated balance sheets.
The $4.5 million of compensation expense is being expensed on a straight-line basis over a period of one year from acquisition date, which is the required service period per the agreement and is reflected in the consolidated statements of operations in general and administrative expenses. In September, the merger
F-15
Table of Contents
Yodle, Inc. and Subsidiaries
Notes to Consolidated Financial Statements
As of December 31, 2012 and 2013 and for the
years ended December 31, 2011, 2012 and 2013
(in thousands, except share and per share data)
agreement was amended and the terms of the Deferred Payment were modified, which accelerated expenses for services related to one key employee. For the year ended December 31, 2013, $4.0 million was charged to and classified as general and administrative expense in the consolidated statements of operations and to other liabilities, long-term portion in the consolidated balance sheets.
The fair value of the Earn-out at the acquisition date was $4.6 million and was recorded as a liability as of the purchase date. In September 2013, the merger agreement was amended to recognize that the Earn-out targets had been met in full; and that in March 2014, the shareholders would be paid 869,565 shares of Series E Preferred Stock, and $3.0 million in cash. Subsequent to the amendment, the Company continued to record the fair value of the Earn-out as a liability under ASC 480. As of December 31, 2013, the Earn-out liability is recorded at a fair value of $5.3 million and is recorded in contingent consideration in business combination in the consolidated balance sheets. The $0.7 million change in fair value of the Earn-out is recorded to general and administrative expense in the consolidated statements of operations. In March 2014, Yodle settled its Earn-out liability in accordance with the terms of September 2013 amendment to the Lighthouse purchase agreement.
The following table summarizes the components of purchase price that constitutes the consideration transferred:
| February 28, 2013 | ||||
| Cash |
$ | 5,000 | ||
| Fair value of Series E Preferred Stock issued |
8,750 | |||
| Fair value of Deferred Payment |
1,615 | |||
| Fair value of Earn-out consideration |
4,600 | |||
|
|
|
|||
| Total |
$ | 19,965 | ||
|
|
|
|||
At each reporting date, Yodle remeasures the Deferred Payment and Earn-out consideration obligations to their fair values. Changes in the fair value of the Deferred Payment and Earn-out consideration obligations result from changes in probability assumptions with respect to the likelihood of achieving the Earn-out targets, changes in the fair value of the Series E Preferred Stock, and changes in the time to payment.
Interest on the Deferred Payment has a stated interest rate of 8% and is payable quarterly in arrears. Interest expense is bifurcated between the consideration amount and the compensation expense. The interest related to the consideration is recorded to interest expense and other in the consolidated statements of operations, and interest related to the compensation cost is recorded in general and administrative expense in the consolidated statements of operations. The table below summarizes the interest costs related to the Deferred Payment for the year ended December 31, 2013:
| Year Ended December 31, 2013 |
||||
| Accrued interest on deferred consideration |
$ | 113 | ||
| Accrued interest on compensation expense |
302 | |||
|
|
|
|||
| Total accrued interest on deferred payment |
$ | 415 | ||
|
|
|
|||
F-16
Table of Contents
Yodle, Inc. and Subsidiaries
Notes to Consolidated Financial Statements
As of December 31, 2012 and 2013 and for the
years ended December 31, 2011, 2012 and 2013
(in thousands, except share and per share data)
The effective interest rate for the consideration, based upon changes in fair value and stated interest, is 9.59%.
The transaction is considered a merger for federal and relevant state tax purposes. The financial results of Lighthouse have been included in Yodle’s consolidated financial statements from February 28, 2013. Immediately subsequent to the transaction, the operations of Lighthouse were merged with the operations of Yodle and the combined company operated as one reporting unit and one operating segment.
The pro-forma impact of this business combination is not material to Yodle’s historical consolidated operating results and is therefore not presented.
The purchase price was allocated to the tangible and intangible assets acquired and liabilities assumed based on their estimated fair values on the business combination date, with the remaining unallocated purchase price recorded to goodwill. The fair values assigned were determined using the market approach, the income approach and the cost approach. Additional models of probability trees were utilized in deriving the fair values of the Deferred Payment and Earn-out. The acquired identifiable intangible assets are being amortized on a straight-line basis, which Yodle believes approximates the pattern in which the assets are utilized, over their estimated useful lives.
The following table summarizes the allocation of the purchase price for the Lighthouse business combination:
| February 28, 2013 | ||||
| Net tangible liabilities: |
||||
| Cash |
$ | 3 | ||
| Accounts receivable |
221 | |||
| Property and equipment |
97 | |||
| Other assets |
52 | |||
| Accounts payable and accrued expenses |
(353 | ) | ||
| Deferred revenue |
(123 | ) | ||
| Other current liabilities |
(521 | ) | ||
| Deferred tax liability |
(5,399 | ) | ||
|
|
|
|||
| Net tangible liabilities acquired |
(6,023 | ) | ||
|
|
|
|||
| Identifiable intangible assets: |
||||
| Developed technology |
$ | 8,510 | ||
| Customer relationships |
2,675 | |||
| Tradenames and trademarks |
1,472 | |||
| Non-competition agreements |
775 | |||
| Total identifiable intangible assets |
13,432 | |||
| Goodwill |
12,556 | |||
|
|
|
|||
| Total purchase price |
$ | 19,965 | ||
|
|
|
|||
F-17
Table of Contents
Yodle, Inc. and Subsidiaries
Notes to Consolidated Financial Statements
As of December 31, 2012 and 2013 and for the
years ended December 31, 2011, 2012 and 2013
(in thousands, except share and per share data)
ProfitFuel, Inc.
On May 23, 2011, Yodle acquired 100% of ProfitFuel, Inc. (“ProfitFuel”), a privately held search engine optimization firm based in Austin, Texas. As consideration for the business combination, Yodle (i) paid the ProfitFuel shareholders approximately $17.3 million in cash at closing ($17.5 million net of cash acquired), (ii) issued 13,000,000 shares of its common stock at a fair value of $1.51 per share (of which an insignificant amount of shares remain in escrow as of December 31, 2013), and (iii) promised to pay the ProfitFuel shareholders $7.5 million in cash at a future date (the “Deferred Payment”). The Deferred Payment was (a) due on the earlier of (x) 10 days after the closing of a qualified financing yielding gross proceeds to Yodle of at least $29.0 million (including conversion of the Bridge Financing) or (y) May 23, 2013 and (b) subject to a subordination agreement with Silicon Valley Bank (“SVB”).
The transaction was considered a merger for federal and relevant state tax purposes.
During 2012, Yodle repaid the Deferred Payment and all accrued interest in cash (see note on Subordinated Debt). The financial results of ProfitFuel have been included in Yodle’s consolidated financial statements from May 23, 2011. Immediately subsequent to the transaction, the operations of ProfitFuel were merged with the operations of Yodle and the combined company operated as one reporting unit and one operating segment.
The following table is a pro-forma presentation of Yodle’s unaudited results of operations had the ProfitFuel transaction occurred on January 1, 2011:
| Combined Pro-forma Results of Operations Unaudited 2011 |
||||
| Revenue |
$ | 94,369 | ||
|
|
|
|||
| Net loss |
$ | (15,328 | ) | |
|
|
|
|||
| Net loss attributable to common stockholders: |
||||
| Basic and diluted |
$ | (15,328 | ) | |
|
|
|
|||
| Weighted-average shares used to compute net loss per share attributable to common stockholders: |
||||
| Basic and diluted |
31,954,766 | |||
|
|
|
|||
| Net loss per share attributable to common stockholders: |
||||
| Basic and diluted |
$ | (0.48 | ) | |
|
|
|
|||
The following table summarizes the components of purchase price:
| May 23, 2011 | ||||
| Cash |
$ | 17,500 | ||
| Fair value of common stock issued |
19,630 | |||
| Fair value of Deferred Payment |
7,500 | |||
|
|
|
|||
| Total |
$ | 44,630 | ||
|
|
|
|||
F-18
Table of Contents
Yodle, Inc. and Subsidiaries
Notes to Consolidated Financial Statements
As of December 31, 2012 and 2013 and for the
years ended December 31, 2011, 2012 and 2013
(in thousands, except share and per share data)
The purchase price was allocated to the tangible and intangible assets acquired and liabilities assumed based on their estimated fair values on the business combination date, with the remaining unallocated purchase price recorded to goodwill. The fair values assigned were determined using the income approach, the market approach and the cost approach. The acquired identifiable intangible assets are being amortized on a straight-line basis, which Yodle believes approximates the pattern in which the assets are utilized, over their estimated useful lives.
The following table summarizes the allocation of the purchase price for the ProfitFuel business combination:
| May 23, 2011 | ||||
| Net tangible liabilities: |
||||
| Cash |
$ | 218 | ||
| Accounts receivable |
119 | |||
| Property and equipment |
519 | |||
| Other assets |
186 | |||
| Accounts payable and accrued expenses |
(850 | ) | ||
| Other non-current liabilities |
(262 | ) | ||
| Deferred tax liabilities |
(2,100 | ) | ||
| Deferred revenue |
(855 | ) | ||
|
|
|
|||
| Net tangible liabilities acquired |
(3,025 | ) | ||
|
|
|
|||
| Identifiable intangible assets: |
||||
| Non-competition agreements |
$ | 3,640 | ||
| Customer relationships |
1,290 | |||
| Tradenames and trademarks |
54 | |||
|
|
|
|||
| Total identifiable intangible assets |
4,984 | |||
|
|
|
|||
| Goodwill |
42,671 | |||
|
|
|
|||
| Total purchase price |
$ | 44,630 | ||
|
|
|
|||
F-19
Table of Contents
Yodle, Inc. and Subsidiaries
Notes to Consolidated Financial Statements
As of December 31, 2012 and 2013 and for the
years ended December 31, 2011, 2012 and 2013
(in thousands, except share and per share data)
4. SUPPLEMENTAL CASH FLOW INFORMATION
Supplemental cash flow information for the years ended December 31, 2011, 2012 and 2013 is as follows:
| Year Ended December 31, | ||||||||||||
| 2011 | 2012 | 2013 | ||||||||||
| Supplemental disclosures of cash flow information |
||||||||||||
| Cash paid for interest |
$ | 880 | $ | 2,777 | $ | 1,514 | ||||||
| Cash paid for taxes |
16 | 221 | 298 | |||||||||
| Non-cash investing and financing activities |
||||||||||||
| SVB 2012 Loan exchanged for SVB 2013 Loan |
$ | — | $ | — | $ | 2,435 | ||||||
| SVB 2010 Loan exchanged for SVB 2012 Loan |
— | 3,194 | — | |||||||||
| Stock issued as consideration in business combinations |
19,630 | — | 8,750 | |||||||||
| Deferred Payment obligation issued as consideration in business combinations |
7,500 | — | 1,615 | |||||||||
| Lighthouse Earn-out liability |
— | — | 4,600 | |||||||||
| Restricted stock issuance |
3,020 | — | — | |||||||||
| Conversion of Bridge Financing to Series D Preferred Stock |
10,217 | — | ||||||||||
| Vendor financed equipment purchase |
170 | — | — | |||||||||
| Issuance of debt to purchase treasury stock |
2,460 | — | — | |||||||||
| Treasury stock acquired from ProfitFuel escrow |
— | — | (117 | ) | ||||||||
| Retirement of treasury stock |
6,166 | — | 117 | |||||||||
| Property and equipment acquired that are unpaid in accounts payable |
— | — | 281 | |||||||||
| Proceeds of debt issuances were allotted to: |
||||||||||||
| Fair value of preferred stock warrant liabilities in connection with debt |
1,165 | 270 | — | |||||||||
| Beneficial conversion feature on debt |
4,975 | — | — | |||||||||
| Fair value of equity warrants in connection with debt issuance |
— | 199 | — | |||||||||
5. PROPERTY AND EQUIPMENT, NET
Property and equipment, net is shown by major classifications as follows:
| As of December 31, | ||||||||
| 2012 | 2013 | |||||||
| Office furniture |
$ | 1,633 | $ | 2,224 | ||||
| Office and computer equipment |
4,293 | 5,507 | ||||||
| Leasehold improvements |
1,429 | 1,827 | ||||||
|
|
|
|
|
|||||
| Total |
7,355 | 9,558 | ||||||
| Less accumulated depreciation and amortization |
(3,598 | ) | (4,281 | ) | ||||
|
|
|
|
|
|||||
| Property and equipment, net |
$ | 3,757 | $ | 5,277 | ||||
|
|
|
|
|
|||||
Depreciation expense was $0.9 million, $1.4 million and $2.0 million in 2011, 2012 and 2013 respectively.
Yodle disposed of office furniture with a cost of $0.2 million, office and computer equipment with a cost of $1.1 million, and leasehold improvements with a cost of $0.1 million during 2013. The items were essentially fully depreciated with a combined insignificant net book value.
F-20
Table of Contents
Yodle, Inc. and Subsidiaries
Notes to Consolidated Financial Statements
As of December 31, 2012 and 2013 and for the
years ended December 31, 2011, 2012 and 2013
(in thousands, except share and per share data)
6. GOODWILL AND ACQUIRED INTANGIBLE ASSETS, NET
The changes in the carrying amount of goodwill as of December 31, 2012 and 2013 are as follows:
| 2012 | 2013 | |||||||
| Goodwill, gross, at January 1, |
$ | 42,671 | $ | 42,671 | ||||
| Accumulated impairment losses through January 1, |
— | — | ||||||
|
|
|
|
|
|||||
| Balance as of January 1 |
42,671 | 42,671 | ||||||
| Goodwill from business combination |
— | 12,556 | ||||||
|
|
|
|
|
|||||
| Balance as of December 31 |
$ | 42,671 | $ | 55,227 | ||||
|
|
|
|
|
|||||
Goodwill as of December 31, 2012 related to the purchase of ProfitFuel. The $12.6 million addition to goodwill in 2013 relates to Lighthouse (see note on Business Combinations). There was no impairment charge for goodwill or acquired intangible assets, during the years ended December 31, 2011, 2012 and 2013.
Information regarding acquired intangible assets, net that are being amortized is as follows:
| Customer Relationships |
Non - competition agreements |
Tradenames & Trademarks |
Developed Technology |
Total Intangible Assets |
||||||||||||||||
| Balance January 1, 2012 |
$ | 914 | $ | 2,932 | $ | 23 | $ | — | $ | 3,869 | ||||||||||
| Amortization 2012 |
(645 | ) | (1,213 | ) | (23 | ) | — | (1,881 | ) | |||||||||||
|
|
|
|
|
|
|
|
|
|
|
|||||||||||
| Net carrying value December 31, 2012 |
269 | 1,719 | — | — | 1,988 | |||||||||||||||
| Business combination, Lighthouse |
2,675 | 775 | 1,472 | 8,510 | 13,432 | |||||||||||||||
| Amortization 2013 |
(715 | ) | (1,429 | ) | (250 | ) | (1,418 | ) | (3,812 | ) | ||||||||||
|
|
|
|
|
|
|
|
|
|
|
|||||||||||
| Net carrying value December 31, 2013 |
$ | 2,229 | $ | 1,065 | $ | 1,222 | $ | 7,092 | $ | 11,608 | ||||||||||
|
|
|
|
|
|
|
|
|
|
|
|||||||||||
ProfitFuel-related customer relationships were determined to have a useful life of two years. Customer relationships and trademarks and tradenames are fully amortized as of December 31, 2013. Non-competition agreements are being amortized over three years. Total amortization was $1.1 million for the year ended December 31, 2011. Non-competition agreements have a remaining useful life of less than six months as of December 31, 2013.
Lighthouse-related developed technology, customer relationships, and trademarks and tradenames were all determined to have a useful life of five years. Non-competition agreements are being amortized over three years. Developed technology, customer relationships and trademarks and tradenames have remaining useful lives of approximately four years and non-competition agreements have a remaining useful life of two years.
The weighted average remaining useful life of the acquired intangible assets is 3.91 years.
F-21
Table of Contents
Yodle, Inc. and Subsidiaries
Notes to Consolidated Financial Statements
As of December 31, 2012 and 2013 and for the
years ended December 31, 2011, 2012 and 2013
(in thousands, except share and per share data)
Estimated remaining amortization of the acquired intangible assets is as follows:
| 2014 |
$ | 3,295 | ||
| 2015 |
2,788 | |||
| 2016 |
2,573 | |||
| 2017 |
2,530 | |||
| 2018 |
422 | |||
|
|
|
|||
| Total |
$ | 11,608 | ||
|
|
|
7. CAPITALIZED TECHNOLOGY DEVELOPMENT COSTS, NET
| 2012 | 2013 | |||||||
| Capitalized technology development costs |
$ | 1,666 | $ | 2,481 | ||||
| Less accumulated amortization |
(771 | ) | (1,378 | ) | ||||
|
|
|
|
|
|||||
| Capitalized technology development costs, net |
$ | 895 | $ | 1,103 | ||||
|
|
|
|
|
|||||
Amortization of capitalized technology development costs was approximately $0.3 million, $0.5 million and $0.6 million in 2011, 2012 and 2013, respectively.
8. ACCRUED EXPENSES AND OTHER CURRENT LIABILITIES
The following table details the outstanding accrued expenses and other current liabilities of Yodle as of December 31, 2012 and December 31, 2013:
| As of December 31, | ||||||||
| 2012 | 2013 | |||||||
| Accrued payroll expenses |
$ | 3,015 | $ | 4,496 | ||||
| Accrued expenses, other |
1,289 | 1,876 | ||||||
| Accrued traffic acquisition costs |
827 | 1,288 | ||||||
| Accrued taxes |
404 | 1,099 | ||||||
| Accrued interest expense |
213 | 363 | ||||||
| Deferred rent |
196 | 261 | ||||||
|
|
|
|
|
|||||
| Total |
$ | 5,944 | $ | 9,383 | ||||
|
|
|
|
|
|||||
F-22
Table of Contents
Yodle, Inc. and Subsidiaries
Notes to Consolidated Financial Statements
As of December 31, 2012 and 2013 and for the
years ended December 31, 2011, 2012 and 2013
(in thousands, except share and per share data)
9. BANK LOANS
The principal amounts, unamortized discounts, and net carrying amounts are as follows:
| December 31, 2012 | December 31, 2013 | |||||||||||||||||||||||||||
| Bank Loans |
Initial Principal |
Principal Outstanding |
Unamortized Discount |
Net Carrying Amount |
Principal Outstanding |
Unamortized Discount |
Net Carrying Amount |
|||||||||||||||||||||
| 2013 Loan |
$ | 3,000 | $ | — | $ | — | $ | — | $ | 3,000 | $ | (30 | ) | $ | 2,970 | |||||||||||||
| 2012 Loan |
7,000 | 6,087 | (174 | ) | 5,913 | — | — | — | ||||||||||||||||||||
| 2011 Loan |
10,000 | 10,000 | (338 | ) | 9,662 | — | — | — | ||||||||||||||||||||
|
|
|
|
|
|
|
|
|
|
|
|
|
|||||||||||||||||
| Total Bank Debt |
$ | 16,087 | $ | (512 | ) | $ | 15,575 | $ | 3,000 | $ | (30 | ) | $ | 2,970 | ||||||||||||||
|
|
|
|
|
|
|
|
|
|
|
|
|
|||||||||||||||||
| Current portion |
$ | 3,652 | $ | (144 | ) | $ | 3,508 | $ | — | $ | — | $ | — | |||||||||||||||
| Long-term portion |
$ | 12,435 | $ | (369 | ) | $ | 12,066 | $ | 3,000 | $ | (30 | ) | $ | 2,970 | ||||||||||||||
2011 Loan
In May 2011, Yodle modified the Loan and Security Agreement (“LSA”) with SVB (“2011 Loan”). Based on the new modification, SVB agreed to lend Yodle $10.0 million. The loan had a maturity date of May 31, 2014; payment is due in full at that time and bears a stated interest rate of 11%.
In connection with the 2011 Loan, SVB was granted warrants to purchase shares of Yodle’s Series D preferred stock worth $1.0 million. Yodle recorded the value of this preferred stock warrant as a liability based on the fair value as of the date of issuance, $0.7 million, and as a reduction of the stated value of the loan, which will be accreted into the loan over its maturity as additional interest expense. The warrant issued in connection with the 2011 Loan is presented as a reduction of the related debt outstanding and reduces the debt by $0.3 million as of December 31, 2012. During the years ended December 31, 2011 and 2012, $0.1 million and, $0.2 million respectively, was accreted and recorded as additional interest expense and other in the consolidated statements of operations.
In September 2013, Yodle entered into an agreement to borrow $15.0 million (see note on Subordinated Debt), and used a portion of those proceeds to pay off the $10.0 million balance of the 2011 Loan; an early extinguishment of debt in the amount of $0.2 million was recorded related to the unamortized loan warrants associated with the loan.
2012 Loan
In September 2012, Yodle modified the LSA with SVB and borrowed a total of $7.0 million (“2012 Loan”). $3.8 million was used to partially pay down the ProfitFuel Deferred Payment (see note on Subordinated Debt). The remaining $3.2 million was used to pay off the previous existing LSA from 2010 (“2010 Loan”) in contemporaneous debt exchange. Yodle incurred an insignificant amount in fees in connection with amending the LSA, all of which were expensed in 2012.
As part of the September 2012 loan amendment, SVB received common stock warrants to purchase 195,000 shares of common stock at a purchase price of $1.19 per share. Yodle recorded the fair value of the common stock warrants, determined using a binomial pricing model, on the date of the grant as a reduction of the stated
F-23
Table of Contents
Yodle, Inc. and Subsidiaries
Notes to Consolidated Financial Statements
As of December 31, 2012 and 2013 and for the
years ended December 31, 2011, 2012 and 2013
(in thousands, except share and per share data)
value of the loan, which will be accreted into the loan over its maturity as additional interest expense. The warrants issued in connection with the 2012 Loan is presented as a reduction of the related debt outstanding and reduces the debt by $0.3 million, with an offset to equity, which includes the remaining unamortized warrant discount of less than $0.1 million from the 2010 Loan. During the year ended December 31, 2012, $0.1 million was accreted and recorded as additional interest expense and other in the consolidated statements of operations.
During 2013, Yodle made principal payments of $3.7 million which reduced the outstanding loan balance to $2.4 million. In December 2013, Yodle used the proceeds from the 2013 Loan to pay off the remaining principal and interest due on the 2012 Loan. Since the 2013 Loan was considered a modification of the 2012 Loan, the unamortized warrants of the 2012 Loan will be amortized over the life of the 2013 Loan. During the year ended December 31, 2013, $0.2 million of loan warrant discounts were accreted and recorded as additional interest expense in interest expense and other in the consolidated statements of operations.
2013 Loan
In December 2013, Yodle modified its LSA with SVB. Under the LSA, SVB agreed to loan Yodle up to $10.0 million under a term loan facility (the “Term Loan Facility”), as well as the lesser of $2.0 million and 80% of eligible accounts receivable under a revolving credit facility (the “Revolving Credit Facility” and together with the “Term Loan Facility”, the “2013 Loan”). The 2013 Loan was considered a modification of the 2012 Loan and is secured by substantially all of Yodle’s assets. A condition of the LSA was that a portion of the loan amount would be used to pay in full the outstanding balances of Yodle’s existing 2012 Loan.
The repayment period of the Term Loan Facility will commence on January 2, 2015, with 30 equal monthly payments, and bears interest at 0.75% above prime. From January 1, 2014 to December 31, 2014, Yodle will be required only to pay interest monthly. The Term Loan Facility matures on June 1, 2017, but the draw period for the Term Loan Facility ends on December 31, 2014. On December 12, 2013, Yodle made its first drawdown of $3.0 million and used $2.4 million of the proceeds to pay off the balance of the outstanding 2012 Loan in a contemporaneous debt exchange. As of December 31, 2013, $7.0 million was available for future drawdowns against the Term Loan Facility.
Any outstanding principal amount under the Revolving Credit Facility and any accrued and unpaid interest must be paid in full by December 12, 2015. Borrowings under our Revolving Credit Facility accrue interest on a monthly basis and bears interest at 0.25% above prime. As of December 31, 2013, Yodle has not borrowed any amounts under the Revolving Credit Facility.
At December 31, 2013, $3.0 million was classified as long term in the consolidated balance sheets. The fair value of 2013 Loan as of December 31, 2013 approximates the recorded value since the loan was made on December 18, 2013.
Scheduled repayments of the loans outstanding under the LSA at December 31, 2013 are as follows:
| 2014 |
$ | — | ||
| 2015 |
1,200 | |||
| 2016 |
1,200 | |||
| 2017 |
600 | |||
|
|
|
|||
| $ | 3,000 | |||
|
|
|
F-24
Table of Contents
Yodle, Inc. and Subsidiaries
Notes to Consolidated Financial Statements
As of December 31, 2012 and 2013 and for the
years ended December 31, 2011, 2012 and 2013
(in thousands, except share and per share data)
The schedule of stated interest rates, effective interest rates, interest expense, discount amortization amounts, and loss on early extinguishment of debt are as follows:
| Stated interest rate |
Effective interest rate |
Interest expense |
Discount amortization |
Loss on early extinguishment of debt |
||||||||||||||||
| Year ended December 31, 2011 |
||||||||||||||||||||
| 2011 Loan |
11.00 | % | 12.54 | % | $ | 654 | $ | 109 | $ | — | ||||||||||
| 2010 Loan |
prime + 1.25 | % | 5.72 | % | 258 | 20 | — | |||||||||||||
| Year ended December 31, 2012 |
||||||||||||||||||||
| 2012 Loan |
prime + 1.25 | % | 8.75 | % | $ | 113 | $ | 54 | $ | — | ||||||||||
| 2011 Loan |
11.00 | % | 13.34 | % | 1,115 | 219 | — | |||||||||||||
| 2010 Loan |
prime + 1.25 | % | 136 | 18 | — | |||||||||||||||
| Year ended December 31, 2013 |
||||||||||||||||||||
| 2013 Loan |
prime + 0.75 | % | 3.94 | % | $ | 6 | $ | — | $ | — | ||||||||||
| 2012 Loan |
prime + 1.25 | % | 8.43 | % | 213 | 144 | — | |||||||||||||
| 2011 Loan |
11.00 | % | 13.75 | % | 767 | 149 | 216 | |||||||||||||
In connection with the LSA, Yodle is subject to certain covenants with which it must comply. On December 12, 2013, Yodle amended the financial covenants relating to Capital Expenditures, and Minimum Adjusted EBITDA/Maximum Adjusted EBITDA Loss. As of December 31, 2013, Yodle was in compliance with all such covenants.
10. SUBORDINATED DEBT
Yodle has entered into debt agreements which are subordinated to the SVB loans. The schedule of principal amounts and net carrying amounts are as follows:
| December 31, 2012 | December 31, 2013 | |||||||||||||||||||
| Subordinated Debt |
Initial principal |
Principal outstanding |
Net carrying amount |
Principal outstanding |
Net carrying amount |
|||||||||||||||
| Subordinated Loan |
$ | 15,000 | $ | — | $ | — | $ | 15,000 | $ | 15,000 | ||||||||||
| Promissory Note |
2,460 | 2,460 | 2,460 | 2,460 | 2,460 | |||||||||||||||
|
|
|
|
|
|
|
|
|
|||||||||||||
| Total Subordinated Debt |
$ | 2,460 | $ | 2,460 | $ | 17,460 | $ | 17,460 | ||||||||||||
| Current portion |
$ | — | $ | — | $ | 2,460 | $ | 2,460 | ||||||||||||
| Long-term portion |
$ | 2,460 | $ | 2,460 | $ | 15,000 | $ | 15,000 | ||||||||||||
Subordinated Loan
In September 2013, Yodle borrowed $15.0 million from a reseller. The loan has a fixed interest rate of 5%, payable monthly. A portion of the proceeds from this loan was used to repay the SVB 2011 Loan of $10.0 million (see note on Bank Loans). The Subordinated Loan is due on September 9, 2017. Interest expense of $0.2 million was recorded in the consolidated statements of operations for the year ended December 31, 2013. The carrying value of the subordinated loan as of December 31, 2013 approximates fair value as the interest rate is relative when compared to the Company’s interest rate from the 2013 Loan obtained in December 2013.
F-25
Table of Contents
Yodle, Inc. and Subsidiaries
Notes to Consolidated Financial Statements
As of December 31, 2012 and 2013 and for the
years ended December 31, 2011, 2012 and 2013
(in thousands, except share and per share data)
Promissory Note
On November 18, 2011, Yodle purchased 3,000,000 shares of its common stock from one of the Company’s founders. As consideration for the purchase, Yodle issued a promissory note in the amount of $2.5 million, of which the principal accrues interest at 3.3% per annum. The note is due on the earlier of (i) the closing of an acquisition of Yodle or (ii) June 21, 2014. For the years ended December 31, 2011, 2012, and 2013, $0.01 million, $0.1 million and $0.1 million, respectively, was recorded in interest expense and other on the consolidated statements of operations. As of December 31, 2013, the note was recorded as current debt, and the fair value approximates the carrying value as the Note’s interest rate is, consistent with the rates available in market.
ProfitFuel Deferred Payment
The ProfitFuel business combination in 2011 included a deferred payment obligation of $7.5 million. During 2012, Yodle paid the Deferred Payment by (a) $1.0 million on each of April 10, 2012 and July 3, 2012, (b) $4.0 million on September 7, 2012 and (c) $2.9 million on November 20, 2012 which reduced the outstanding principal balance to zero. Payments included accrued interest of $1.4 million. As of December 31, 2011, and 2012, interest expense of $0.3 million and $1.1 million was recorded, respectively, in interest expense and other on the consolidated statements of operations.
Bridge Financing
On May 23, 2011, Yodle issued convertible promissory notes totaling $9.0 million to a group of existing holders of its convertible preferred stock (the “Bridge Financing”). Proceeds from this issuance were used for the ProfitFuel business combination (see note on Business Combinations). The Bridge Financing was due on the earlier of (i) completion of a preferred stock equity financing yielding gross proceeds of at least $30.0 million to Yodle or (ii) on demand any time after six months by the “Requisite Majority” of shareholders, which was defined as holders who hold greater than 50% of the outstanding balances. Interest accrued on the note at a rate of 10%. On May 23, 2011, Yodle issued warrants to the holders of the notes to purchase Series D Preferred Stock of 10% of the face value of the notes, or $0.9 million. After July 23, 2011, the value of the warrants increased by 1% of the face value of notes of $9.0 million (i.e. $90,000) each month the convertible promissory notes remained outstanding. All convertible promissory notes were converted in September 2012 and no more warrants were issued after August 2012.
Yodle recorded the value of this warrant as a liability based on the fair value as of the date of issuance, $0.5 million, and as a reduction of the stated value of the loan, which will be accreted into the loan over its maturity as additional interest expense. The warrant issued in connection with Bridge Financing is presented as a reduction of the related debt outstanding and reduces the debt by $0.3 million as of December 31, 2012.
The Bridge Financing contained terms enabling the holders to convert their notes into equity shares, that, when tested under ASC 470-20, Debt with Conversion and Other Options, are beneficial to the holders of the notes. The beneficial conversion feature had value that was required to be allocated and was recorded as a discount to the debt, with an offsetting entry to additional paid-in capital. This amount was $4.9 million, and was fully amortized to interest expense and other in the year ended December 31, 2011. The expense from the beneficial conversion feature was not deductible for tax purposes.
F-26
Table of Contents
Yodle, Inc. and Subsidiaries
Notes to Consolidated Financial Statements
As of December 31, 2012 and 2013 and for the
years ended December 31, 2011, 2012 and 2013
(in thousands, except share and per share data)
In September 2012, the Bridge Financing holders converted all the outstanding notes into 7,274,827 shares of Series D Preferred Stock, including accrued interest of $1.2 million. The conversion price of the shares was $1.4045 per share as per the terms of the warrants. As of December 31, 2011, and 2012, recorded interest expense was $0.5 million and $0.7 million respectively. No additional consideration was paid by the holders for the conversion.
In 2012, prior to conversion, additional warrants with a grant date fair value totaling $0.3 million were issued in connection with the Bridge Financing. As of December 31, 2011 and 2012, $0.5 million and $0.3 million, respectively, was accreted to interest expense and other in the consolidated statements of operations as debt discount in connection with the warrants.
The schedule of stated interest rates, effective interest rates, interest expense and discount amortization amounts are as follows:
| Stated interest rate |
Effective interest rate |
Interest expense |
Discount amortization |
|||||||||||||
| Year ended December 31, 2011 |
||||||||||||||||
| Promissory Note |
3.30 | % | 3.35 | % | $ | 10 | $ | — | ||||||||
| 2011 Deferred Payment |
* | 7.59 | % | 346 | — | |||||||||||
| Bridge Financing |
10.00 | % | 110.12 | % | 553 | 5,475 | ||||||||||
| Year ended December 31, 2012 |
||||||||||||||||
| Promissory Note |
3.30 | % | 3.35 | % | $ | 82 | $ | — | ||||||||
| 2011 Deferred Payment |
18.00 | % | 18.00 | % | 1,054 | — | ||||||||||
| Bridge Financing |
10.00 | % | 14.37 | % | 665 | 270 | ||||||||||
| Year ended December 31, 2013 |
||||||||||||||||
| Subordinated Loan |
5.00 | % | 5.11 | % | $ | 238 | $ | — | ||||||||
| Promissory Note |
3.30 | % | 3.35 | % | 82 | — | ||||||||||
| * | 6.00% for May 23, 2011 through November 23, 2011, then 18.00% thereafter |
Scheduled repayments of subordinated debt as of December 31, 2013 is as follows:
| 2014 |
$ | 2,460 | ||
| 2015 |
— | |||
| 2016 |
— | |||
| 2017 |
15,000 | |||
|
|
|
|||
| $ | 17,460 | |||
|
|
|
11. WARRANTS
Yodle examines the terms of each warrant instrument at issuance, along with the terms and conditions of any other instruments issued in conjunction with the warrants, such as debt agreements, to determine the proper accounting treatment.
F-27
Table of Contents
Yodle, Inc. and Subsidiaries
Notes to Consolidated Financial Statements
As of December 31, 2012 and 2013 and for the
years ended December 31, 2011, 2012 and 2013
(in thousands, except share and per share data)
Preferred Stock Warrants
2010 Loan
In connection with the 2010 Loan, SVB was granted a warrant to purchase 78,320 warrants to purchase shares of Yodle’s Series D Preferred Stock with an exercise price of $1.4045 per share. Yodle initially recorded the value of these warrants based on the fair value on the date of grant of $0.1 million as a reduction of the stated value of the loan, which was accreted into the loan over its maturity as additional interest expense. As of December 31, 2013, the fair value of these warrants to purchase 78,320 shares of the Series D Preferred Stock, in the amount of $0.1 million, was included within the preferred stock warrant liabilities on the consolidated balance sheets.
As the warrants are exercisable into Series D Preferred Stock, which includes certain redemption rights that are considered outside of the control of the Company, in accordance with ASC 480—Distinguishing Liabilities from Equity, the warrants are accounted for as a liability and are revalued at each balance sheet date. The change in fair value upon being re-measured is recorded in interest expense and other within the Company’s consolidated statements of operations. The warrants were fully vested at issuance. The warrants were valued at $0.1 million as of December 31, 2013 using a Black-Scholes-Merton option pricing model.
2011 Loan
In November 2011, in accordance with terms of the 2011 Loan, the warrants converted to warrants to purchase 711,997 shares of Series D Preferred Stock. The warrants were transferable without restriction by the holder. Yodle recorded the value of these warrants based on the fair value on the date of issuance, $0.7 million, and as a reduction of the stated value of the loan, which will be accreted into the loan over its maturity as additional interest expense. As of December 31, 2013, the fair value of these warrants to purchase 711,997 shares of the Series D Preferred Stock, in the amount of $1.0 million, was included within the preferred stock warrant liabilities on the consolidated balance sheets.
As the warrants are exercisable into Series D Preferred Stock, which includes certain redemption rights that are considered outside of the control of the Company, in accordance with ASC 480 – Distinguishing Liabilities from Equity, the warrants are accounted for as a liability and are revalued at each balance sheet date. The change in fair value upon being re-measured is recorded in interest expense and other within the consolidated statements of operations. The warrants were fully vested at issuance. The warrants were valued at $1.0 million as of December 31, 2013 using a Black-Scholes-Merton option pricing model.
Bridge Financing
On May 23, 2011, in conjunction with the Bridge Financing, Yodle issued 640,797 warrants to the holders of the convertible promissory notes “Bridge Financing Warrants” based on the terms of the Bridge Financing. 897,120 additional Bridge Financing Warrants were issued between July 23, 2011 and August 23, 2012. In September 2012, in accordance with the terms of the Bridge Financing, the Bridge Financing Warrants matured and were converted to warrants for the purchase of shares of Series D Preferred Stock. The initial fair value of warrants issued in 2011 and 2012 was $0.5 million and $0.3 million, respectively. The warrants were fully vested at issuance.
F-28
Table of Contents
Yodle, Inc. and Subsidiaries
Notes to Consolidated Financial Statements
As of December 31, 2012 and 2013 and for the
years ended December 31, 2011, 2012 and 2013
(in thousands, except share and per share data)
As the warrants are exercisable into Series D Preferred Stock, which includes certain redemption rights that are considered outside of the control of the Company, in accordance with ASC 480 – Distinguishing Liabilities from Equity, the warrants are accounted for as a liability and are revalued at each balance sheet date. The change in fair value upon being re-measured is recorded in interest expense and other within the Company’s consolidated statements of operations. As of December 31, 2013, the fair value of these warrants to purchase a total of 1,537,917 shares of the Series D Preferred Stock, in the amount of $1.6 million, and was included within the preferred stock warrant liabilities on the consolidated balance sheets.
Series A Preferred Stock and Series B Preferred Stock warrants relate to debt issued prior to 2011. As the warrants are exercisable into Series A and Series B Preferred Stock, which includes certain redemption rights that are considered outside of the control of the Company, in accordance with ASC 480 – Distinguishing Liabilities from Equity, the warrants are accounted for as a liability and are revalued at each balance sheet date. The change in fair value upon being re-measured is recorded in interest expense and other within the Company’s consolidated statements of operations. The warrants were fully vested at issuance. The Series A and Series B Preferred Stock warrants were valued at $0.7 million and $0.2 million, respectively, as of December 31, 2013 using a Black-Scholes-Merton option pricing model.
The below table summarizes the outstanding preferred stock warrant liabilities as of December 31, 2012 and 2013:
| Preferred Stock Warrants |
Issue Date | Expiration Date |
Exercise Price |
Shares Outstanding |
Fair value at issue date |
Fair value as of December 31, 2012 |
Fair value as of December 31, 2013 |
|||||||||||||||||
| Series A |
5/1/2007 | 5/31/2017 | 0.1445 | 311,419 | — | 442 | 657 | |||||||||||||||||
| Series B |
7/18/2008 | 7/17/2018 | 0.5670 | 141,093 | 74 | 168 | 247 | |||||||||||||||||
| Series D—Bridge Financing |
5/23/2011 7/23/11-8/23/12 |
5/23/2018 5/23/2018 |
|
1.4045 1.4045 |
|
|
640,797 897,120 |
|
|
326 444 |
|
|
482 656 |
|
|
659 894 |
| |||||||
| Series D—2011 Loan |
5/23/11-11/23/11 | 5/22/2021 | 1.4045 | 711,997 | 666 | 819 | 997 | |||||||||||||||||
| Series D—2010 Loan |
10/1/2010 | 10/1/2020 | 1.4045 | 78,320 | 76 | 88 | 107 | |||||||||||||||||
|
|
|
|
|
|
|
|
|
|||||||||||||||||
| 2,780,746 | $ | 1,586 | $ | 2,655 | $ | 3,561 | ||||||||||||||||||
|
|
|
|
|
|
|
|
|
|||||||||||||||||
The changes in fair value of the warrants recorded to interest expense and other represents income for the year ended December 31, 2011 of $0.4 million and expense of $0.9 million and $0.9 million for the years ended December 31, 2012, and 2013, respectively.
All of Yodle’s outstanding Preferred Stock warrants become exercisable for shares of common stock on a one-for-one basis upon the closing of an IPO, and 1,537,917 of these warrants that were issued in connection with the Bridge Financing for our acquisition of ProfitFuel will, subject to certain conditions, automatically be deemed exercised in full pursuant to a net exercise provision upon its closing. The net exercise provision contained in certain of the Company’s outstanding warrants provides that the holder may, in lieu of payment of the exercise price in cash, surrender the applicable warrant and receive a net amount of shares based on the fair market value of the Company’s stock at the time of exercise of the applicable warrant after deduction of the aggregate exercise price. The warrants also contain a provision for the adjustment of the exercise price and the number of shares issuable upon the exercise of the applicable warrant in the event of certain stock dividends, stock splits, reorganizations, reclassifications and consolidations.
F-29
Table of Contents
Yodle, Inc. and Subsidiaries
Notes to Consolidated Financial Statements
As of December 31, 2012 and 2013 and for the
years ended December 31, 2011, 2012 and 2013
(in thousands, except share and per share data)
Common Stock Warrants
As part of the 2012 Loan, SVB received a warrant to purchase 195,000 shares of common stock at a purchase price of $1.19 per share. Yodle recorded the fair value of the warrants, determined using a binomial pricing model, on the date of the grant as a reduction of the stated value of the loan, which will be accreted into the loan over its maturity as additional interest expense (see note on Bank Loans for details of 2012 Loan).
In March 2009, a recruiting firm received warrants to purchase 37,500 shares of common stock at a purchase price of $0.38 per share. As of December 31, 2012 and December 31, 2013, 16,393 and 5,553 of these warrants remained outstanding, respectively.
The common warrants issued and outstanding were assessed under ASC 815 and were determined to initially not meet the definition of a derivative, but will require evaluation on an on-going basis. As of December 31, 2013, the warrants still did not meet the definition of a derivative and were therefore classified in stockholders’ equity.
The table below summarizes the inputs to determine the fair value of the common warrants issued in connection with the 2012 Loan:
| 2012 | ||||
| Common stock warrants—2012 Loan |
||||
| Risk-free interest rate (percentage) |
1.59 | |||
| Expected term (in years) |
10.00 | |||
| Expected dividend yield (percentage) |
— | |||
| Expected volatility (percentage) |
54.80 | |||
12. INCOME TAXES
The provision (benefit) for income taxes is as follows:
| Year Ended December 31, | ||||||||||||
| 2011 | 2012 | 2013 | ||||||||||
| Current |
||||||||||||
| Federal |
$ | — | $ | 149 | $ | 3 | ||||||
| State |
65 | 238 | 265 | |||||||||
|
|
|
|
|
|
|
|||||||
| Total current |
65 | 387 | 268 | |||||||||
|
|
|
|
|
|
|
|||||||
| Deferred |
||||||||||||
| Federal |
$ | (1,863 | ) | $ | — | $ | (4,600 | ) | ||||
| State |
(237 | ) | — | (799 | ) | |||||||
|
|
|
|
|
|
|
|||||||
| Total deferred |
(2,100 | ) | — | (5,399 | ) | |||||||
|
|
|
|
|
|
|
|||||||
| Total income tax expense/(benefit) |
$ | (2,035 | ) | $ | 387 | $ | (5,131 | ) | ||||
|
|
|
|
|
|
|
|||||||
F-30
Table of Contents
Yodle, Inc. and Subsidiaries
Notes to Consolidated Financial Statements
As of December 31, 2012 and 2013 and for the
years ended December 31, 2011, 2012 and 2013
(in thousands, except share and per share data)
The reconciliation between the effective income tax rate and the federal statutory income tax rate is as follows:
| Year Ended December 31, | ||||||||||||
| 2011 | 2012 | 2013 | ||||||||||
| Federal statutory income tax rate |
(34.00 | )% | (34.00 | )% | (34.00 | )% | ||||||
| Non-deductible portion of Lighthouse deferred payment |
— | — | 11.02 | |||||||||
| State income taxes, net of federal benefit |
0.25 | 3.11 | 1.21 | |||||||||
| Valuation allowances on deferred tax assets |
13.86 | 25.71 | (5.63 | ) | ||||||||
| Stock compensation |
0.73 | 4.79 | (5.56 | ) | ||||||||
| Preferred stock warrants / debt |
8.95 | 11.30 | 2.01 | |||||||||
| Other permanent differences |
1.39 | (0.97 | ) | (2.20 | ) | |||||||
| Other |
(2.83 | ) | (2.26 | ) | 0.12 | |||||||
|
|
|
|
|
|
|
|||||||
| Effective income tax rate |
(11.65 | )% | 7.68 | % | (33.03 | )% | ||||||
|
|
|
|
|
|
|
|||||||
The significant components of Yodle’s deferred tax assets and liabilities are as follows:
| December 31, | ||||||||
| 2012 | 2013 | |||||||
| Current deferred tax assets |
||||||||
| Accrued expenses |
$ | 249 | $ | 238 | ||||
|
|
|
|
|
|||||
| Total current deferred tax assets |
249 | 238 | ||||||
|
|
|
|
|
|||||
| Non-current deferred tax assets |
||||||||
| Operating loss and credit carryforwards |
$ | 15,137 | $ | 18,731 | ||||
| Deferred revenue |
2,660 | 1,759 | ||||||
| Deferred rent |
428 | 690 | ||||||
| Stock-based compensation |
363 | 441 | ||||||
| Depreciation |
77 | 88 | ||||||
| Other |
333 | 161 | ||||||
|
|
|
|
|
|||||
| Total non-current deferred tax assets |
18,998 | 21,870 | ||||||
|
|
|
|
|
|||||
| Total deferred tax assets |
19,247 | 22,108 | ||||||
|
|
|
|
|
|||||
| Non-current deferred tax liabilities |
||||||||
| Amortization of intangibles |
(793 | ) | (4,521 | ) | ||||
|
|
|
|
|
|||||
| Total non-current deferred tax liabilities |
(793 | ) | (4,521 | ) | ||||
| Net deferred tax assets before valuation allowances |
18,454 | 17,587 | ||||||
| Valuation allowances |
(18,454 | ) | (17,587 | ) | ||||
|
|
|
|
|
|||||
| Net deferred tax assets after valuation allowances |
$ | — | $ | — | ||||
|
|
|
|
|
|||||
ASC 740-10 requires that deferred tax assets be reduced by a valuation allowance if it is more likely than not that some or all of the deferred tax assets will not be realized based on all available positive and negative evidence. Based on Yodle’s history of generating net operating losses, management has concluded that it is more
F-31
Table of Contents
Yodle, Inc. and Subsidiaries
Notes to Consolidated Financial Statements
As of December 31, 2012 and 2013 and for the
years ended December 31, 2011, 2012 and 2013
(in thousands, except share and per share data)
likely than not that Yodle will not be able to generate sufficient taxable income in future periods to utilize the net operating losses and other deferred tax assets. Therefore, Yodle has established a full valuation against net deferred tax assets.
The ProfitFuel and Lighthouse business combinations were both nontaxable reorganizations. In accordance with ASC 805 and 740, the intangible assets recorded as part of the business combinations of both Lighthouse and ProfitFuel were considered finite lived, and a deferred tax liability was recorded as part of the purchase price allocation for the additional future taxable income caused by not being able to deduct the intangible asset amortization expense on the Company’s tax returns. In addition, as Yodle had recorded a full valuation allowance against its net deferred tax assets previously, it reassessed the amount of the valuation allowance as a result of the additional deferred tax liabilities. This reassessment reduced the valuation allowance by $2.1 million and $5.4 million at December 31, 2011 and 2013, respectively.
As of December 31, 2013, Yodle has net operating loss carryforwards (“NOLs”) available to offset future taxable income of approximately $49.1 million. The NOLs expire in varying years beginning 2028 through 2033. In accordance with Section 382 of the Internal Revenue code, the ability to utilize Yodle’s net operating loss carryforwards could be limited in the event of a change in ownership. Yodle has reviewed the impact of Section 382 on its net operating losses and has determined that although it has experienced one or more changes in ownership, the resulting limitations should not significantly restrict its ability to utilize its net operating losses in the future.
A reconciliation of the gross amounts of unrecognized tax benefits, excluding interest and penalties is as follows:
| Balance as at January 1, 2013 |
$ | — | ||
| Additions for prior year tax positions |
286 | |||
|
|
|
|||
| Balance as at December 31, 2013 |
$ | 286 | ||
|
|
|
There were no unrecognized tax benefits recorded in the year ended December 31, 2011 and 2012.
Approximately $0.3 million of unrecognized benefits at December 31, 2013 would affect Yodle’s effective tax rate if recognized. Yodle does not expect a material change in the amount of unrecognized benefits in the next 12 months. Yodle accrued interest and penalties related to unrecognized tax benefits as part of the provision for income taxes. As of December 31, 2013, accrued interest and penalties included in unrecognized tax benefits were insignificant.
Yodle is subject to federal and state income tax examinations for years subsequent to 2009.
F-32
Table of Contents
Yodle, Inc. and Subsidiaries
Notes to Consolidated Financial Statements
As of December 31, 2012 and 2013 and for the
years ended December 31, 2011, 2012 and 2013
(in thousands, except share and per share data)
13. CONVERTIBLE PREFERRED STOCK
Yodle has issued six series of convertible preferred stock: Series A, Series B, Series C, Series D, Series E, and Series F collectively “Convertible Preferred Stock”.
| Convertible |
Issue Date |
Issued | Outstanding | Authorized | Original issue price |
Original proceeds at issuance |
Issuance Costs |
Proceeds net of issuance costs |
Liquidation preference |
Carrying value as of December 31, 2012 |
Carrying value as of December 31, 2013 |
|||||||||||||||||||||||||||||||||
| Series A |
Nov-06 | 21,453,287 | 21,453,287 | 21,453,287 | $ | 0.1444 | $ | 3,098 | $ | 110 | $ | 2,988 | $ | 0.1444 | $ | 2,988 | $ | 2,988 | ||||||||||||||||||||||||||
| Series A |
Jun-07 | 3,460,208 | 3,460,208 | 25,224,914 | $ | 0.1445 | 500 | — | 500 | $ | 0.1445 | 500 | 500 | |||||||||||||||||||||||||||||||
| Series B |
Nov-07 | 21,164,021 | 21,164,021 | 21,305,114 | $ | 0.5670 | 12,000 | 68 | 11,932 | $ | 0.5670 | 11,932 | 11,932 | |||||||||||||||||||||||||||||||
| Series C |
Jan-09 | 15,539,089 | 15,539,089 | 15,837,919 | $ | 0.8366 | 13,000 | 90 | 12,910 | $ | 0.8366 | 12,910 | 12,910 | |||||||||||||||||||||||||||||||
| Series C |
Aug-09 | 298,830 | 298,830 | 15,837,919 | $ | 0.8366 | 250 | — | 250 | $ | 0.8366 | 250 | 250 | |||||||||||||||||||||||||||||||
| Series D |
May-11 | 7,119,973 | 7,119,973 | 7,119,973 | $ | 1.4045 | 10,000 | 65 | 9,935 | $ | 1.4045 | 9,935 | 9,935 | |||||||||||||||||||||||||||||||
| Series D |
Sep-12 | 7,274,827 | 7,274,827 | 16,723,034 | $ | 1.4045 | 10,218 | — | 10,218 | $ | 1.4045 | 10,218 | 10,218 | |||||||||||||||||||||||||||||||
| Series E |
Feb-13 | 3,804,348 | 3,804,348 | 4,673,913 | $ | 2.3000 | 8,750 | 72 | 8,678 | $ | 2.3000 | — | 8,678 | |||||||||||||||||||||||||||||||
| Series F |
Feb-13 | 1,666,667 | 1,666,667 | 1,666,667 | $ | 3.0000 | 5,000 | — | 5,000 | $ | 3.7500 | — | 5,000 | |||||||||||||||||||||||||||||||
|
|
|
|
|
|
|
|
|
|
|
|
|
|||||||||||||||||||||||||||||||||
| 81,781,250 | $ | 62,816 | $ | 405 | $ | 62,411 | $ | 48,733 | $ | 62,411 | ||||||||||||||||||||||||||||||||||
|
|
|
|
|
|
|
|
|
|
|
|
|
|||||||||||||||||||||||||||||||||
Voting Rights—The number of votes that a share of preferred stock is entitled to vote is calculated by converting the preferred series share into a share of common at a 1:1 ratio. Preferred stock classes A, B and D each elect one board of director. The Company’s voting agreement sets the size of the board of directors.
Conversion Option—Holders of Series A, B, C, D, E, and F Preferred Stock have the option of converting their shares into shares of common stock at any time, at a conversion ratio of 1:1, adjusted for any dilutive transactions such as stock splits, certain dividends, mergers or acquisitions.
The conversion ratio of Series F Preferred shares is 1:1, with the potential exception in an IPO transaction. In accordance with the Fifth Amendment and Restated Certificate of Incorporation, if the per share offering price to the public in Yodle’s initial public offering of Common Stock is less than the amount to which shares of Series F Preferred Stock is entitled as a liquidation preference, and the proceeds available for distribution to the holders of the Company’s capital stock were equal to the pre-IPO valuation of the Company, then immediately prior to the conversion of the shares of Series F Preferred Stock in connection with the IPO (mandatory conversion), the Series F Preferred Stock conversion price shall be reduced to a price equal to (i) the Series F Conversion price in effect immediately prior to such conversion ($3.00 per share) multiplied by (ii) a fraction, the numerator of which is the IPO offering price and the denominator of which is the per share price which a share of Series F Preferred Stock would be entitled to as a liquidation preference (as described below in Liquidation Preference).
Mandatory Conversion—Upon a qualifying public offering, which results in net cash proceeds of at least $20.0 million to Yodle, Series A, B, C, D, E, and F are mandatorily converted into shares of common stock, at the then prevailing conversion ratio, unless holders of at least 55% of shareholders of Series A, B, C, D, and F object to the conversion.
Dividends—Dividends are payable only when declared by Yodle. The holders of convertible preferred stock shall first receive or simultaneously receive a dividend on each outstanding share of convertible preferred stock in an amount at least equal to $0.0116 per share for Series A Preferred, $0.0454 per share for Series B Preferred, $0.0669 per share for Series C Preferred, $0.1124 for Series D Preferred, $0.184 per share for Series E Preferred, and $0.2400 per share for Series F Preferred. No dividends have been declared for any of the periods presented in these consolidated
F-33
Table of Contents
Yodle, Inc. and Subsidiaries
Notes to Consolidated Financial Statements
As of December 31, 2012 and 2013 and for the
years ended December 31, 2011, 2012 and 2013
(in thousands, except share and per share data)
financial statements. The Company is precluded from paying cash dividends pursuant to the terms and conditions in the 2013 Loan and the Subordinated Loan.
Liquidation Preference—In the event of a voluntary or involuntary liquidation, the holders of convertible preferred stock outstanding shall be entitled to be paid out of assets of Yodle available for distribution to the Company’s shareholders, before any payment shall be made to the holders of common stock in relation to the convertible preferred stock’s original issue price (Series A $0.1445, Series B $0.5670, Series C $0.8366, Series D $1.4045, Series E $2.30, Series F, (a) $3.75 if the event occurs before the first anniversary of Original Issue Date (The Original Issue Date is February 28, 2013), (b) $4.50 if event occurs after the first anniversary but before second anniversary of Original Issue Date, (c) $6.00 if event occurs after the second anniversary of the Original Issue Date). If there is not enough to satisfy the entire payout, the liquidation amount will be ratably divided among all convertible preferred stock shareholders based on the convertible preferred stock’s original issue price. Finally, holders of commons stock share in liquidation proceeds, if any remain available.
Yodle’s amended Certificate of Incorporation states that upon the occurrence of certain deemed liquidation events, such as certain merger, consolidation, reorganization or other transactions, the majority of preferred stockholders, specifically, 55% of the holders of Series A, B, C, D, and F Preferred Stock, can require the Company to redeem their shares of preferred stock upon the occurrence of a Deemed Liquidation Event. Since the preferred stockholders control the Board, the occurrence of a Deemed Liquidation Event is not solely within Yodle’s control. Further, since the Certificate of Incorporation does not explicitly require that common stockholders and Preferred stockholders receive the same form of consideration upon the occurrence of a Deemed Liquidation Event, the shares of preferred stock do not meet the limited exception in ASC 480-10-S99-3A(3)(F) that would allow the shares of preferred stock to be classified in permanent equity. Therefore, the preferred stock has been classified as temporary equity on the consolidated balance sheets.
Participation Rights—Series A, B, C, D, E, and F preferred stockholders of at least 4,000,000 preferred shares have participation rights which are calculated on a fully diluted basis and allow each convertible preferred stockholder to purchase a pro-rata portion of any offering of new securities of the enterprise in line with their then current ownership. Participation rights give the convertible preferred stockholders the ability to maintain their respective ownership percentages and restrict the ability of common stockholders to diversify the shareholdings of the enterprise.
Financing Costs—In connection with the issuance of shares of Series A, B, C, D, E, and F Preferred Stock, Yodle incurred aggregate financing costs of approximately $0.4 million. The preferred stock issuance costs are recorded at issuance as a reduction to redeemable preferred stock amount.
14. STOCKHOLDERS’ DEFICIT
In October 2013, Yodle amended its certificate of incorporation to allow an increase in the number of authorized shares of common stock from 147,000,000 to 155,000,000 at $0.0002 par value. The authorized shares had previously been increased from 133,000,000 to 142,000,000 in February 2012 and from 142,000,000 to 147,000,000 in February 2013. Common stock shareholders are entitled to one vote for each share of common stock held and may only receive dividends only the payment in full of all the preferred. Yodle has agreements in place with common stockholders which gives Yodle the first right of refusal in the event common stockholders intend to sell their holdings.
F-34
Table of Contents
Yodle, Inc. and Subsidiaries
Notes to Consolidated Financial Statements
As of December 31, 2012 and 2013 and for the
years ended December 31, 2011, 2012 and 2013
(in thousands, except share and per share data)
The following shares of common stock are reserved for the future issuance of stock options and warrants:
| As of December 31, | ||||||||
| 2012 | 2013 | |||||||
| Conversion of Convertible Preferred stock |
76,310,235 | 81,781,250 | ||||||
| Conversion of Stock options |
20,257,105 | 20,960,745 | ||||||
| Conversion of Preferred stock warrants |
2,780,746 | 2,780,746 | ||||||
| Conversion of Common stock warrants |
211,393 | 200,553 | ||||||
|
|
|
|
|
|||||
| Total |
99,559,479 | 105,723,294 | ||||||
|
|
|
|
|
|||||
15. STOCK-BASED COMPENSATION
Under the Equity Incentive Plan (the “Plan”) for directors, employees, and consultants of Yodle, in 2007, the Board authorized the grant of nonqualified and incentive stock options. In February 2013, the Board increased the number of options available to be issued under the plan to 30,953,663 from 26,853,663. In October 2013, the Board increased the number of options available to be issued to 34,953,663 from 30,953,663. Such options become exercisable subject to vesting schedules up to five years from the date of the grant.
The fair market value of each option granted for the periods presented has been estimated on the grant date using the Black-Scholes-Merton option-pricing model with the following assumptions:
| 2011 | 2012 | 2013 | ||||
| Risk-free interest rate (percentage) |
1.05 – 2.40 | 0.88 – 1.24 | 1.02 – 2.02 | |||
| Expected term (in years) |
5.50 – 6.20 | 5.80 – 6.30 | 5.55 –6.32 | |||
| Expected dividend yield (percentage) |
— | — | — | |||
| Expected volatility (percentage) |
53.68 – 64.90 | 52.31 – 53.84 | 52.34 – 56.71 |
As of December 31, 2013, there remains approximately $3.8 million of unrecognized compensation cost from stock options granted under the plan, which is expected to be recognized over a period of 3.75 years.
During the years ended December 31, 2011, 2012 and 2013, no stock–based compensation expense for non-employee consultants was recognized as no grants were issued to consultants.
F-35
Table of Contents
Yodle, Inc. and Subsidiaries
Notes to Consolidated Financial Statements
As of December 31, 2012 and 2013 and for the
years ended December 31, 2011, 2012 and 2013
(in thousands, except share and per share data)
A summary of stock option activity as of and for the year ended December 31, 2013 is as follows:
| Number of Shares |
Weighted Average Exercise Price |
Average Remaining Contract Life |
Aggregate Intrinsic Value |
|||||||||||||
| Options outstanding as of January 1, 2013 |
20,257,105 | $ | 0.55 | 6.88 years | $ | 19,556 | ||||||||||
| Granted |
6,630,350 | 1.71 | ||||||||||||||
| Exercised |
(3,976,595 | ) | 0.35 | |||||||||||||
| Forfeited—unvested |
(1,750,699 | ) | 1.28 | |||||||||||||
| Forfeited—vested and cancelled |
(199,416 | ) | 0.72 | |||||||||||||
|
|
|
|||||||||||||||
| Options outstanding as of December 31, 2013 |
20,960,745 | 0.89 | 7.04 years | 23,401 | ||||||||||||
|
|
|
|||||||||||||||
| Options expected to vest as of December 31, 2013 |
17,050,139 | 0.78 | 6.60 years | |||||||||||||
| Options exercisable as of December 31, 2013 |
11,638,776 | 0.46 | 5.43 years | 18,106 | ||||||||||||
The weighted-average grant date fair value of options granted during the years ended December 31, 2011, 2012, and 2013 was, $0.53, $0.52 and $0.91 respectively. The total intrinsic value of options exercised in the years December 31, 2011, 2012, and 2013 was $0.9 million, $0.9 million and $5.3 million respectively.
A summary of the status of Yodle’s unvested options as of December 31, 2013, and changes during the year are as follows:
| Number Of Options |
Weighted Average Grant- Date Fair Value |
|||||||
| Non-vested as of January 1, 2013 |
7,630,353 | $ | 0.51 | |||||
| Granted |
6,630,350 | 0.91 | ||||||
| Vested |
(3,188,035 | ) | ||||||
| Forfeited |
(1,750,699 | ) | 0.68 | |||||
|
|
|
|||||||
| Non-vested as of December 31, 2013 |
9,321,969 | 0.77 | ||||||
|
|
|
|||||||
On May 23, 2011, the Board authorized the Company to make restricted stock grants of 2,000,000 shares of the Company’s common stock with a fair value of $1.51 per share. The restricted stock grant vests over a two year period; 50% of the shares vest at the one-year anniversary and the remainder vest monthly thereafter. Total fair value of the awards was $3.0 million. Stock-based compensation expense related to restricted stock for 2011, 2012 and 2013 was $0.9 million, $1.5 million and $0.6 million, respectively. As of December 31, 2011, none of the shares were vested. During 2012, 1,583,000 shares vested, and the remaining 417,000 shares vested in 2013. There were no other grants of restricted stock units during the three years ended December 31, 2013.
F-36
Table of Contents
Yodle, Inc. and Subsidiaries
Notes to Consolidated Financial Statements
As of December 31, 2012 and 2013 and for the
years ended December 31, 2011, 2012 and 2013
(in thousands, except share and per share data)
Stock-based compensation expense was included in the following costs and expenses:
| Year ended December 31, | ||||||||||||
| 2011 | 2012 | 2013 | ||||||||||
| Cost of revenue |
$ | 15 | $ | 17 | $ | 15 | ||||||
| Selling and marketing |
422 | 577 | 780 | |||||||||
| Technology and product development |
235 | 445 | 675 | |||||||||
| General and administrative |
1,160 | 1,827 | 1,161 | |||||||||
|
|
|
|
|
|
|
|||||||
| Total stock-based compensation expense |
$ | 1,832 | $ | 2,866 | $ | 2,631 | ||||||
|
|
|
|
|
|
|
|||||||
16. COMMITMENTS AND CONTINGENCIES
Operating Leases—As of December 31, 2013, the fixed minimum rentals on operating leases for office space, furniture, and equipment are as follows:
| Years Ending December 31, |
| |||
| 2014 |
$ | 5,016 | ||
| 2015 |
3,808 | |||
| 2016 |
2,767 | |||
| 2017 |
2,218 | |||
| 2018 |
1,966 | |||
| Thereafter |
7,486 | |||
|
|
|
|||
| $ | 23,261 | |||
|
|
|
|||
The fixed minimum rental total includes $1.5 million related to offices no longer in use as of December 31, 2013.
Yodle’s rent expense for the years ended December 31, 2011, 2012 and 2013 was approximately $2.4 million, $3.3 million and $3.9 million, respectively.
Lease Abandonment—Yodle announced the closure of its Boston office in 2012 and its Indianapolis office in 2013. In addition, Yodle vacated an office location in Austin in 2012. The cost for these offices, which is included in general and administrative expenses in the consolidated statements of operations, for the year ended December 31, 2012 was $0.3 million and was insignificant for the year ended December 31, 2013. The leases terminate by June 2016.
Legal Matters—From time to time Yodle or its subsidiaries may be involved in legal proceedings and/or litigation arising in the ordinary course of business. While the outcome of these matters cannot be predicted with certainty, Yodle does not believe that the outcome of any current claims, individually and in aggregate, will have a material effect on its consolidated financial position, results of operations, or cash flows.
17. EMPLOYEE BENEFIT PLAN
Yodle maintains a defined contribution retirement plan qualifying under Section 401(k) of the Internal Revenue Code of 1986, with a salary deferral feature for all eligible employees. Under the plan, eligible employees may make pretax contributions subject to limitations imposed by the Internal Revenue Service. Yodle has not made any matching contributions during the years ended December 31, 2011, 2012, or 2013.
F-37
Table of Contents
Yodle, Inc. and Subsidiaries
Notes to Consolidated Financial Statements
As of December 31, 2012 and 2013 and for the
years ended December 31, 2011, 2012 and 2013
(in thousands, except share and per share data)
18. FAIR VALUE MEASUREMENTS
In accordance with ASC 820, Fair Value Measurements, Yodle has categorized its assets and liabilities recorded at fair value based upon the fair value hierarchy. The levels of fair value hierarchy are as follows:
| • | Level 1 inputs utilize quoted prices (unadjusted) in active markets for identical assets or liabilities that Yodle has the ability to access. |
| • | Level 2 inputs utilize other-than-quoted prices that are observable, either directly or indirectly. Level 2 inputs include quoted prices for similar assets and liabilities in active markets, and inputs such as interest rates and yield curves that are observable at commonly quoted intervals. |
| • | Level 3 inputs are unobservable and are typically based on Yodle’s own assumptions, including situations where there is little, if any, market activity. |
In certain cases, the inputs used to measure fair value may fall into different levels of the fair value hierarchy. In such cases, Yodle categorizes such assets or liabilities based on the lowest level input that is significant to the fair value measurement in its entirety. Yodle’s assessment of the significance of a particular input to the fair value measurement in its entirety requires judgment and considers factors specific to the asset. Both observable and unobservable inputs may be used to determine the fair value of positions that are classified within the Level 3 category. As a result, the unrealized gains and losses for assets within the Level 3 category presented below may include changes in fair value that were attributable to both observable (e.g. changes in market interest rates) and unobservable (e.g. changes in historical company data) inputs. The major categories of assets and liabilities measured on a recurring basis, at fair value, as of December 31, 2012 and 2013 are as follows:
| At December 31, 2012 | ||||||||||||||||||
| Level 1 | Level 2 | Level 3 | Total | |||||||||||||||
| Asset |
Money market funds | $ | 6,718 | $ | — | $ | — | $ | 6,718 | |||||||||
| Asset |
Certificates of deposit | — | 2,363 | — | 2,363 | |||||||||||||
| Liability |
Preferred stock warrant liabilities | — | — | 2,655 | 2,655 | |||||||||||||
| At December 31, 2013 | ||||||||||||||||||
| Level 1 | Level 2 | Level 3 | Total | |||||||||||||||
| Asset |
Money market funds | $ | 5,294 | $ | — | $ | — | $ | 5,294 | |||||||||
| Asset |
Certificates of deposit | — | 2,228 | — | 2,228 | |||||||||||||
| Liability |
Preferred stock warrant liabilities | — | — | 3,561 | 3,561 | |||||||||||||
| Liability |
Contingent consideration in business combination | — | 2,977 | 2,313 | 5,290 | |||||||||||||
| Liability |
Deferred consideration | — | 1,637 | — | 1,637 | |||||||||||||
Money market funds—Yodle values its money market funds using quoted active market prices for such funds at each reporting date.
Certificates of deposit (“CD”)—Yodle compares its CD rates with active market prices of comparable CDs at each reporting date. The certificates of deposit are classified as restricted cash and have a maturity date of March 2015 or sooner.
F-38
Table of Contents
Yodle, Inc. and Subsidiaries
Notes to Consolidated Financial Statements
As of December 31, 2012 and 2013 and for the
years ended December 31, 2011, 2012 and 2013
(in thousands, except share and per share data)
Preferred stock warrant liabilities—The valuation technique used to measure fair value for Yodle’s Level 3 warrant liabilities was a Black Scholes-Merton option pricing model at each reporting date. A rollforward of the fair value measurements of the warrant liability categorized with Level 3 inputs as of December 31, 2012 and 2013 is as follows:
| December 31, | ||||||||
| 2012 | 2013 | |||||||
| Balance as at January 1 |
$ | 1,468 | $ | 2,655 | ||||
| Issuance of warrants |
270 | — | ||||||
| Change in fair value of warrant liability |
917 | 906 | ||||||
|
|
|
|
|
|||||
| Balance as at December 31 |
$ | 2,655 | $ | 3,561 | ||||
|
|
|
|
|
|||||
Contingent consideration in business combination—Yodle agreed to pay the shareholders an Earn-out, the amount of which is based on gross revenue performance over the measurement period (commencing March 1, 2013 and ending February 28, 2014), not to exceed $3.0 million in cash and 869,565 preferred stock shares of Series E Preferred Stock (see Business Combinations footnote).
The fair value of the Earn-out at the acquisition date was $4.6 million and was recorded as a liability as of the purchase date. In September 2013, the merger agreement was amended to recognize that the Earn-out targets had been met in full; and that in March 2014, the shareholders would be paid 869,565 shares of Series E Preferred Stock, and $3.0 million in cash. On the amendment date, the removal of the revenue contingency caused the cash portion of the liability to transfer out of Level 3 and into Level 2. The valuation technique used to measure fair value for Yodle’s Level 2 Earn-out consideration was the present value of expected future cash flows, using a discount rate equivalent to the Company’s cost of debt. Yodle used an adjusted option pricing model to derive the fair value of the Level 3 Earn-out consideration. The option pricing model was calibrated to the Company’s estimated probability of being above the Earn-out cap. Level 3 inputs into the adjusted option pricing model to determine the fair value of the Earn-out included forecasts, the fair value of the underlying Series E Preferred Stock, time to payment and probabilities for achieving revenue targets. As of December 31, 2013 the fair value of contingent consideration for the Earn-out amounted to $3.0 million of Level 2 and $2.3 million of Level 3.
A rollforward of the fair value measurements of the contingent consideration in business combination categorized with Level 3 inputs as of December 31, 2012 and 2013 is as follows:
| December 31, | ||||||||
| 2012 | 2013 | |||||||
| Balance as at January 1 |
$ | — | $ | — | ||||
| Fair value at date of business combination |
— | 4,600 | ||||||
| Change in fair value |
— | 479 | ||||||
| Transfer from Level 3 to Level 2 at September 2013 |
— | (2,940 | ) | |||||
| Change in fair value of contingent consideration |
— | 174 | ||||||
|
|
|
|
|
|||||
| Balance as at December 31 |
$ | — | $ | 2,313 | ||||
|
|
|
|
|
|||||
F-39
Table of Contents
Yodle, Inc. and Subsidiaries
Notes to Consolidated Financial Statements
As of December 31, 2012 and 2013 and for the
years ended December 31, 2011, 2012 and 2013
(in thousands, except share and per share data)
Yodle reviews the fair value hierarchy classification of its applicable assets and liabilities at each reporting period. Changes in the observability of valuation inputs may result in transfers within the fair value measurement hierarchy. The Company’s policy is to record transfers between levels, if any, in the month in which the transfer occurs.
Deferred consideration—The valuation technique used to measure fair value for Yodle’s Level 2 deferred consideration was the present value of expected future cash flows.
The fair value of the deferred consideration was determined using the present value of expected cash payments, including interest, over the term of the liability. The discount rate used, 7.03%, was consistent with the discount rate used to calculate the fair value at the acquisition date.
F-40
Table of Contents
Yodle, Inc. and Subsidiaries
Notes to Consolidated Financial Statements
As of December 31, 2012 and 2013 and for the
years ended December 31, 2011, 2012 and 2013
(in thousands, except share and per share data)
The fair market value of each warrant granted for the periods presented has been estimated on each reporting period using a Black Scholes-Merton pricing model with the following assumptions. There were no warrants issued in the year 2013.
| 2011 | 2012 | 2013 | ||||
| Series A Preferred | ||||||
| Risk-free interest rate (percentage) |
0.93 | 0.56 – 1.08 | 0.37 – 0.99 | |||
| Expected term (in years) |
5.39 | 4.39 – 5.14 | 3.39 – 4.14 | |||
| Expected dividend yield (percentage) |
— | — | — | |||
| Expected volatility (percentage) |
71.60 | 64.10 – 69.5 | 49.50 – 67.50 | |||
| 2011 | 2012 | 2013 | ||||
| Series B Preferred | ||||||
| Risk-free interest rate (percentage) |
1.23 | 0.79 – 1.40 | 0.55 – 1.42 | |||
| Expected term (in years) |
6.55 | 5.55 – 6.30 | 4.55 – 5.30 | |||
| Expected dividend yield (percentage) |
— | — | — | |||
| Expected volatility (percentage) |
62.40 | 59.90 – 62.7 | 48.80 – 64.70 | |||
| 2011 | 2012 | 2013 | ||||
| Series D Preferred—Bridge Financing | ||||||
| Risk-free interest rate (percentage) |
0.30 – 0.73 | 0.25 – 0.46 | 0.17 – 0.23 | |||
| Expected term (in years) |
2.25 – 2.50 | 2.00 – 2.50 | 1.26 – 1.55 | |||
| Expected dividend yield (percentage) |
— | — | — | |||
| Expected volatility (percentage) |
36.70 –39.40 | 39.70 – 47.10 | 42.10 – 52.10 | |||
| 2011 | 2012 | 2013 | ||||
| Series D Preferred—2010 Loan | ||||||
| Risk-free interest rate (percentage) |
1.67 | 1.25 – 1.92 | 1.00 – 2.02 | |||
| Expected term (in years) |
8.81 | 7.81 – 8.56 | 6.81 – 7.56 | |||
| Expected dividend yield (percentage) |
— | — | — | |||
| Expected volatility (percentage) |
41.3 | 44.20 – 44.50 | 42.10 – 52.10 | |||
| 2011 | 2012 | 2013 | ||||
| Series D Preferred—2011 Loan | ||||||
| Risk-free interest rate (percentage) |
1.82 – 3.13 | 1.37 – 2.04 | 1.12 – 2.14 | |||
| Expected term (in years) |
9.40 – 10.00 | 8.39 – 9.14 | 7.39 – 8.14 | |||
| Expected dividend yield (percentage) |
— | — | — | |||
| Expected volatility (percentage) |
36.70 – 39.40 | 44.20 – 44.50 | 42.10 – 52.10 | |||
| 2013 | ||
| Earn-out consideration | ||
| Risk-free interest rate (percentage) |
0.06 – 0.13 | |
| Expected term (in years) |
0.20 – 1.00 | |
| Expected dividend yield (percentage) |
— | |
| Expected volatility (percentage) |
52.50 – 52.80 | |
| Cost of Debt (percentage) |
5.00 – 8.00 | |
| Risk adjusted discount rate (percentage) |
14.32 – 14.70 |
F-41
Table of Contents
Yodle, Inc. and Subsidiaries
Notes to Consolidated Financial Statements
As of December 31, 2012 and 2013 and for the
years ended December 31, 2011, 2012 and 2013
(in thousands, except share and per share data)
19. SEGMENT, GEOGRAPHIC AND SIGNIFICANT CUSTOMER INFORMATION
The CODM reviews financial information presented on a consolidated basis for purposes of allocating resources and evaluating financial performance. Yodle has concluded that its operations constitute one operating and reportable segment. Substantially all assets were held in the United States as of each year ended December 31, 2012 and 2013.
Yodle’s geographic revenues by country of customer residence, and percentage of total revenue by location, are as follows:
| 2011 | 2012 | 2013 | ||||||||||||||||||||||
| United States |
$ | 87,584 | 100.00 | % | $ | 125,513 | 94.85 | % | $ | 151,571 | 93.64 | % | ||||||||||||
| International |
— | 6,808 | 5.15 | % | 10,292 | 6.36 | % | |||||||||||||||||
|
|
|
|
|
|
|
|||||||||||||||||||
| $ | 87,584 | 100.00 | % | $ | 132,321 | 100.00 | % | $ | 161,863 | 100.00 | % | |||||||||||||
|
|
|
|
|
|
|
|||||||||||||||||||
No single customer exceeds ten percent of Yodle’s revenue for all years presented above. As of December 31, 2012, a customer accounted for 29% of accounts receivable, net. As of December 31, 2013, a different customer accounted for 38% of accounts receivable, net.
20. RELATED PARTY TRANSACTIONS
As a result of the Lighthouse business combination, Yodle became a party to an office lease in a building owned by an employee of Lighthouse. Yodle currently utilizes that office space located in Sugar Hill, Georgia and the building owner remains employed at Yodle. Rent expense paid for the office space for the year ended December 31, 2013 totaled $0.1 million.
21. NET LOSS PER SHARE
Basic and diluted net loss per share attributable to common stockholders are presented in conformity with the two-class method required for participating securities.
In the event a dividend is paid on common stock, convertible preferred stock participates as if they were holders of common shares (on an if-converted basis). To date no dividends have been declared.
Under the two-class method for periods with net income, basic net income per share attributable to common stockholders is computed by dividing the net income attributable to common stockholders by the weighted average number of common shares outstanding during the period. Net income attributable to common stockholders is determined by allocating undistributed earnings among common stock and convertible preferred stock. For periods with a net loss, an allocation of the undistributed losses to the holders of convertible preferred stock and unvested restricted stock is not made, as the holders have no obligation to fund losses.
Diluted net income (loss) per share attributable to common stockholders is computed by using the weighted average number of common shares outstanding, plus, for periods with net income attributable to common stockholders, the potential dilutive effect of outstanding stock options and warrants using the treasury stock
F-42
Table of Contents
Yodle, Inc. and Subsidiaries
Notes to Consolidated Financial Statements
As of December 31, 2012 and 2013 and for the
years ended December 31, 2011, 2012 and 2013
(in thousands, except share and per share data)
method. In addition, the Company analyzes the potential effect of the outstanding participating securities under the “if-converted” method when calculating diluted earnings per share, in which it is assumed that the outstanding participating securities convert into common stock at the beginning of the period. The Company reports the more dilutive of the approaches (two-class or “if-converted”) as its diluted net income per share during the period. Due to net losses for the years ended December 31, 2011, 2012 and 2013, basic and diluted per share were the same.
| For the year ended December 31, | ||||||||||||
| 2011 | 2012 | 2013 | ||||||||||
| Net loss attributable to common stockholders: |
||||||||||||
| Basic and diluted |
$ | (15,439 | ) | $ | (5,428 | ) | $ | (10,402 | ) | |||
|
|
|
|
|
|
|
|||||||
| Weighted-average shares used to compute net loss per share attributable to common stockholders: |
||||||||||||
| Basic and diluted |
31,954,796 | 32,572,544 | 35,743,067 | |||||||||
|
|
|
|
|
|
|
|||||||
| Net loss per share attributable to common stockholders: |
||||||||||||
| Basic and diluted |
$ | (0.48 | ) | $ | (0.17 | ) | $ | (0.29 | ) | |||
|
|
|
|
|
|
|
|||||||
Yodle excluded the following weighted-average common shares underlying stock-based securities from the calculations of diluted net income per common share because their inclusion would have been anti-dilutive:
| Year Ended December 31 | ||||||||||||||
| 2011 |
|
2012 | 2013 | |||||||||||
| Common share equivalents excluded from calculation: |
||||||||||||||
| Dilutive effect of assumed conversion of Preferred Stock |
69,035,408 | 71,042,942 | 80,896,894 | |||||||||||
| Dilutive effect of employee stock options |
16,453,269 | 19,738,003 | 20,733,313 | |||||||||||
| Dilutive effect of Preferred Stock Warrants |
1,497,920 | 2,631,927 | 2,780,747 | |||||||||||
| Dilutive effect of Common Stock Warrants |
37,500 | 100,712 | 203,226 | |||||||||||
| Dilutive effect of Convertible Promissory Notes |
4,395,208 | 5,456,120 | — | |||||||||||
|
|
|
|
|
|
|
|
||||||||
| 91,419,305 | 98,969,704 | 104,614,180 | ||||||||||||
|
|
|
|
|
|
|
|
||||||||
F-43
Table of Contents
Yodle, Inc. and Subsidiaries
Notes to Consolidated Financial Statements
As of December 31, 2012 and 2013 and for the
years ended December 31, 2011, 2012 and 2013
(in thousands, except share and per share data)
22. SUBSEQUENT EVENTS
On February 27, 2014, Yodle drew down $3.0 million against the Term Loan Facility and used the funds to satisfy the Earn-out consideration related to the Lighthouse business combination.
On February 28, 2014, Yodle acquired certain assets of New Service, LLC. Consideration for the assets acquired was (a) $0.5 million in cash, which was paid at the closing and (b) 87,000 common shares, valued at $2.01 per share, and a note for $0.7 million, each of which are paid 50% on the first anniversary and 50% on the second anniversary of the closing. The assets acquired are an early stage software product. Yodle expects to complete the accounting for the New Service, LLC asset acquisition by the end of 2014.
Unaudited Interim Condensed Consolidated Financial Statements for the Three Months Ended March 31, 2013 and 2014, follow.
F-44
Table of Contents
Yodle, Inc. and Subsidiaries
Condensed Consolidated Balance Sheets
(in thousands, except share and per share data)
(Unaudited)
| December 31, | March 31, | Pro-forma March 31, | ||||||||
| 2013 | 2014 | 2014 | ||||||||
| Assets |
||||||||||
| Current assets: |
||||||||||
| Cash and cash equivalents |
$ | 12,345 | $ | 10,274 | ||||||
| Accounts receivable, net |
3,405 | 3,762 | ||||||||
| Prepaid expenses |
953 | 1,705 | ||||||||
| Other current assets |
1,316 | 1,486 | ||||||||
|
|
|
|
|
|||||||
| Total current assets |
18,019 | 17,227 | ||||||||
| Property and equipment, net |
5,277 | 5,325 | ||||||||
| Restricted cash |
2,228 | 2,228 | ||||||||
| Goodwill |
55,227 | 55,227 | ||||||||
| Intangible assets, net |
11,608 | 10,610 | ||||||||
| Capitalized technology development costs, net |
1,103 | 2,455 | ||||||||
| Other assets, net |
267 | 591 | ||||||||
|
|
|
|
|
|||||||
| Total assets |
$ | 93,729 | $ | 93,663 | ||||||
|
|
|
|
|
|||||||
| Liabilities, convertible preferred stock and stockholders’ deficit |
||||||||||
| Current liabilities: |
||||||||||
| Accounts payable |
$ | 11,613 | $ | 11,085 | ||||||
| Accrued expenses and other current liabilities |
9,383 | 13,760 | ||||||||
| Deferred revenue |
13,037 | 14,518 | ||||||||
| Preferred stock warrant liabilities |
3,561 | 5,846 | ||||||||
| Contingent consideration in business combination |
5,290 | — | ||||||||
| Current portion of deferred consideration |
— | 1,679 | ||||||||
| Current portion of bank loan |
— | 600 | ||||||||
| Current portion of subordinated debt |
2,460 | 2,460 | ||||||||
|
|
|
|
|
| ||||||
| Total current liabilities |
45,344 | 49,948 | ||||||||
| Other liabilities, long-term portion |
5,505 | 1,754 | ||||||||
| Deferred revenue, long-term portion |
4,000 | 3,750 | ||||||||
| Deferred consideration, long-term portion |
1,637 | — | ||||||||
| Bank loan, long-term portion |
2,970 | 5,373 | ||||||||
| Subordinated debt, long-term portion |
15,000 | 15,000 | ||||||||
|
|
|
|
|
| ||||||
| Total liabilities |
74,456 | 75,825 | ||||||||
|
|
|
|
|
| ||||||
| Commitments and contingencies (see note 12) |
||||||||||
| Convertible preferred stock (see note 10) |
62,411 | 65,159 | ||||||||
|
|
|
|
|
| ||||||
| Stockholders’ deficit: |
||||||||||
| Common stock; par value $.0002 per share—155,000,000 shares authorized; 38,316,173 and 42,812,887 issued and outstanding as of December 31, 2013 and March 31, 2014, respectively |
8 | 9 | ||||||||
| Additional paid-in capital |
35,376 | 37,137 | ||||||||
| Accumulated deficit |
(78,522 | ) | (84,467 | ) | ||||||
|
|
|
|
|
| ||||||
| Total stockholders’ deficit |
(43,138 | ) | (47,321 | ) | ||||||
|
|
|
|
|
| ||||||
| Total liabilities, convertible preferred stock and stockholders’ deficit |
$ | 93,729 | $ | 93,663 | ||||||
|
|
|
|
|
| ||||||
The accompanying notes are an integral part of these condensed consolidated financial statements.
F-45
Table of Contents
Yodle, Inc. and Subsidiaries
Condensed Consolidated Statements of Operations and Comprehensive Income (Loss)
(in thousands, except share and per share data)
(Unaudited)
| Three months ended March 31, | ||||||||
| 2013 | 2014 | |||||||
| Revenues |
$ | 35,202 | $ | 45,746 | ||||
|
|
|
|
|
|||||
| Costs and expenses: |
||||||||
| Cost of revenues (exclusive of depreciation and amortization shown separately below) |
11,925 | 14,446 | ||||||
| Selling and marketing |
14,076 | 18,628 | ||||||
| Technology and product development |
4,568 | 5,660 | ||||||
| General and administrative |
6,085 | 8,349 | ||||||
| Depreciation and amortization |
1,248 | 1,845 | ||||||
|
|
|
|
|
|||||
| Total costs and expenses |
37,902 | 48,928 | ||||||
|
|
|
|
|
|||||
| Loss from operations |
(2,700 | ) | (3,182 | ) | ||||
|
|
|
|
|
|||||
| Interest expense and other |
(440 | ) | (2,660 | ) | ||||
|
|
|
|
|
|||||
| Loss before income taxes |
(3,140 | ) | (5,842 | ) | ||||
| (Benefit) provision for income taxes |
(5,327 | ) | 103 | |||||
|
|
|
|
|
|||||
| Net income (loss) and comprehensive income (loss) |
$ | 2,187 | $ | (5,945 | ) | |||
|
|
|
|
|
|||||
| Net income (loss) |
$ | 2,187 | $ | (5,945 | ) | |||
| Less: Income attributable to participating preferred stock |
(2,187 | ) | — | |||||
|
|
|
|
|
|||||
| Net income (loss) attributable to common stockholders |
$ | — | $ | (5,945 | ) | |||
|
|
|
|
|
|||||
| Net income (loss) per share attributable to common stockholders: |
||||||||
| Basic |
$ | — | $ | (0.14 | ) | |||
|
|
|
|
|
|||||
| Diluted |
$ | — | $ | (0.14 | ) | |||
|
|
|
|
|
|||||
| Weighted-average shares used to compute net income (loss) per share attributable to common stockholders: |
||||||||
| Basic |
34,279,294 | 41,242,673 | ||||||
|
|
|
|
|
|||||
| Diluted |
46,875,884 | 41,242,673 | ||||||
|
|
|
|
|
|||||
| Unaudited pro-forma net loss per share attributable to common stockholders |
||||||||
| Basic |
||||||||
|
|
|
|||||||
| Diluted |
||||||||
|
|
|
|||||||
| Unaudited pro-forma weighted average shares used in computing net loss per share attributable to common stockholders |
||||||||
| Basic |
||||||||
|
|
|
|||||||
| Diluted |
||||||||
|
|
|
|||||||
The accompanying notes are an integral part of these condensed consolidated financial statements.
F-46
Table of Contents
Yodle, Inc. and Subsidiaries
Condensed Consolidated Statement of Stockholders’ Deficit
(in thousands, except share and per share data)
(Unaudited)
| Common Stock | APIC | Accumulated deficit |
Total Stockholders’ deficit |
|||||||||||||||||
| Shares | Amount | |||||||||||||||||||
| Balance as of December 31, 2013 |
38,316,173 | $ | 8 | $ | 35,376 | $ | (78,522 | ) | $ | (43,138 | ) | |||||||||
| Common stock issued upon exercise of stock options and warrants |
4,496,714 | 1 | 836 | — | 837 | |||||||||||||||
| Stock-based compensation |
— | — | 679 | — | 679 | |||||||||||||||
| Stock used to acquire software asset |
— | — | 246 | — | 246 | |||||||||||||||
| Net loss |
— | — | — | (5,945 | ) | (5,945 | ) | |||||||||||||
|
|
|
|
|
|
|
|
|
|
|
|||||||||||
| Balance as of March 31, 2014 |
42,812,887 | $ | 9 | $ | 37,137 | $ | (84,467 | ) | $ | (47,321 | ) | |||||||||
|
|
|
|
|
|
|
|
|
|
|
|||||||||||
The accompanying notes are an integral part of these condensed consolidated financial statements.
F-47
Table of Contents
Yodle, Inc. and Subsidiaries
Condensed Consolidated Statements of Cash Flows
(in thousands)
(Unaudited)
| Three months ended March 31, |
||||||||
| 2013 | 2014 | |||||||
| Cash Flows from Operating Activities |
||||||||
| Net income (loss) |
$ | 2,187 | $ | (5,945 | ) | |||
| Adjustments to reconcile net income (loss) to net cash provided by (used in) operating activities: |
— | — | ||||||
| Depreciation of property and equipment |
406 | 608 | ||||||
| Amortization of acquired intangible assets and capitalized technology development costs |
842 | 1,237 | ||||||
| Stock-based compensation expense |
925 | 679 | ||||||
| Chargebacks expense |
220 | 349 | ||||||
| Accretion/amortization of debt discounts |
117 | 23 | ||||||
| Deferred rent and lease abandonment |
223 | (38 | ) | |||||
| Preferred stock warrant liabilities mark-to-market (gain) loss |
(53 | ) | 2,285 | |||||
| Fair value change in contingent consideration – Lighthouse business combination |
42 | 458 | ||||||
| Compensation expense in connection with Lighthouse business combination |
375 | 500 | ||||||
| Deferred taxes on business combination |
(5,399 | ) | — | |||||
| Other |
58 | 41 | ||||||
| Changes in operating assets and liabilities, net of effect of business combination: |
— | — | ||||||
| Accounts receivable |
160 | (357 | ) | |||||
| Prepaid expenses |
(66 | ) | (752 | ) | ||||
| Other current assets |
(590 | ) | (171 | ) | ||||
| Other assets |
(19 | ) | (16 | ) | ||||
| Accounts payable |
883 | (631 | ) | |||||
| Accrued expenses and other current liabilities |
(236 | ) | (737 | ) | ||||
| Deferred revenue |
651 | 1,171 | ||||||
| Other liabilities, long-term |
(18 | ) | — | |||||
| Payment of contingent consideration |
— | (328 | ) | |||||
|
|
|
|
|
|||||
| Net cash provided by (used in) operating activities |
708 | (1,624 | ) | |||||
|
|
|
|
|
|||||
| Cash Flows from Investing Activities |
||||||||
| Cash paid for business combination, net of cash acquired |
(4,997 | ) | — | |||||
| Purchase of property and equipment |
(386 | ) | (553 | ) | ||||
| Capitalization of technology development costs |
(150 | ) | (191 | ) | ||||
| Acquired capitalized software and other intangible assets |
— | (534 | ) | |||||
| Change in restricted cash |
135 | — | ||||||
|
|
|
|
|
|||||
| Net cash used in investing activities |
(5,398 | ) | (1,278 | ) | ||||
|
|
|
|
|
|||||
| Cash Flows from Financing Activities |
||||||||
| Payment of contingent consideration |
— | (2,672 | ) | |||||
| Proceeds from bank loan |
— | 3,000 | ||||||
| Repayment of bank loan |
(913 | ) | — | |||||
| Proceeds from issuance of preferred stock, net |
4,928 | — | ||||||
| Proceeds from issuance of common stock, net |
151 | 837 | ||||||
| Deferred issuance costs |
— | (334 | ) | |||||
|
|
|
|
|
|||||
| Net cash provided by financing activities |
4,166 | 831 | ||||||
|
|
|
|
|
|||||
| Net decrease in cash and cash equivalents |
(524 | ) | (2,071 | ) | ||||
| Cash and cash equivalents as of beginning of period |
9,166 | 12,345 | ||||||
|
|
|
|
|
|||||
| Cash and cash equivalents as of end of period |
$ | 8,642 | $ | 10,274 | ||||
|
|
|
|
|
|||||
The accompanying notes are an integral part of these condensed consolidated financial statements.
F-48
Table of Contents
Yodle, Inc. and Subsidiaries
Notes to Unaudited Interim Condensed Consolidated Financial Statements
As of December 31, 2013 and March 31, 2014 and
for the three months ended March 31, 2013 and 2014
(in thousands, except share and per share data)
1. DESCRIPTION OF BUSINESS
Yodle, Inc. and subsidiaries (“Yodle” or the “Company”) is a provider of cloud-based marketing automation solutions for local businesses that makes digital marketing easy, affordable, and transparent. Yodle’s platform provides its customers with an online, mobile, and social presence, as well as automates, manages and optimizes their marketing activities and other consumer interactions. Yodle’s solutions are highly integrated and designed to be easy-to-use, helping local businesses navigate the rapidly evolving, technologically challenging, and highly fragmented digital marketing landscape without having to invest a significant amount of time and money or needing any in-house marketing or IT expertise.
Certain Significant Risks and Uncertainties—Yodle operates in a rapidly changing environment that involves a number of risks, some of which are beyond the Company’s control that could have a material adverse effect on the Company’s business, operating results, and financial condition. These risks include, among others, Yodle’s history of losses and ability to achieve profitability in the future, highly competitive environment, ability to maintain and increase usage rate of the Company’s platform, and ability to increase demand for its solutions. Yodle purchases the majority of its media from Google, and the business could be adversely affected if Google takes actions that are adverse to Yodle’s interests. Similar actions from Yahoo!, Microsoft, and other media providers could adversely affect the business to a lesser degree. The media purchases represent traffic acquisition costs, net, and are recorded in cost of revenues in the condensed consolidated financial statements.
Unaudited Pro Forma Presentation—Yodle has filed a Registration Statement on Form S-1 with the United States Securities and Exchange Commission (the SEC) for the proposed initial public offering of its common stock (the “IPO”). If consummated, 82,650,815 shares of convertible preferred stock will automatically convert into common stock based on 1:1 basis. In the event that the IPO price is below $4.50 per common share, then 1,666,667 Series F convertible preferred stock will convert at such ratio to give effect to a price of $4.50 per common share.
Warrants to purchase 1,242,829 shares of preferred stock will automatically convert into warrants to purchase common stock, and $3.1 million of the preferred stock warrant liabilities will be reclassified to additional paid-in capital. Warrants held by our shareholders to purchase 1,537,917 shares of preferred stock will automatically be exercised on a net basis for shares of Series D Preferred Stock if the fair market value per share exceeds the $1.4045 per share exercise price and, if the exercise occurs, $2.7 million of the preferred stock warrant liabilities will be reclassified to convertible preferred stock.
If the IPO is effective and the net exercise of warrants occurs, approximately $71 million will be reclassified into additional paid-in capital from convertible preferred stock and preferred stock warrant liabilities. Unaudited pro forma stockholders’ deficit, to adjust for the assumed conversion of the convertible preferred stock and reclassification of the preferred stock warrants outstanding, will be set forth on the unaudited condensed consolidated March 31, 2014 pro forma balance sheet.
2. SUMMARY OF SIGNIFICANT ACCOUNTING POLICIES
Basis of Presentation—The accompanying unaudited interim condensed consolidated balance sheets as of March 31, 2014 and December 31, 2013, the condensed consolidated statements of operations and comprehensive income (loss) and cash flows for the three months ended March 31, 2014 and 2013, and the condensed consolidated statement of stockholders’ deficit for the three months ended March 31, 2014 are
F-49
Table of Contents
Yodle, Inc. and Subsidiaries
Notes to Unaudited Interim Condensed Consolidated Financial Statements
As of December 31, 2013 and March 31, 2014 and
for the three months ended March 31, 2013 and 2014
(in thousands, except share and per share data)
unaudited but reflect all adjustments that are of a normal recurring nature and that are considered necessary for a fair presentation of the results for the periods shown in accordance with accounting principles generally accepted in the United States of America (“U.S. GAAP”) and the applicable rules and regulations of the SEC for interim financial reporting. Accordingly, certain information and footnote disclosures have been condensed or omitted pursuant to SEC rules that would ordinarily be required by GAAP for complete financial statements. These unaudited interim condensed consolidated financial statements should be read in conjunction with the audited consolidated financial statements and accompanying notes thereto for the fiscal year ended December 31, 2013 included in the Company’s Registration Statement on Form S-1 as an integral part of this filing.
Use of Estimates—The preparation of condensed consolidated financial statements in conformity with GAAP requires management to make estimates and assumptions that affect the reported amounts of assets and liabilities and disclosure of contingent assets and liabilities at the date of the condensed consolidated financial statements and the reported amounts of revenue and expenses during the reported period. Significant estimates include fair value of the Company’s common stock, stock based compensation, preferred stock warrant liability, purchase price allocation, revenue recognition, expected customer lives, and recoverability of goodwill and acquired intangible assets. These estimates are based on information available as of the date of the condensed consolidated financial statements. Therefore, actual results could differ from those estimates.
Multi-year licensing agreement—In 2011, effective for the 2012 fiscal year, Yodle entered into a multi-year licensing agreement to distribute its offerings in Canada through a reseller. The reseller paid a $10.0 million licensing fee upon signing the agreement. The licensing fee is being recognized ratably over the estimated life of the reseller relationship, which approximates the term of the contract, commencing in January 2012 and originally ending December 31, 2014. On September 9, 2013, Yodle and the reseller agreed to modify the agreement, including extending the term until December 31, 2018. At that time, Yodle updated its estimate of the life of the reseller relationship to consider the remaining contract term and amortizes the remaining license fee over the remaining estimated life of the reseller relationship. In addition to this licensing fee, Yodle may also earn milestone payments if certain revenue targets are met by the reseller. These milestone payments, if earned, would be recognized ratably over the estimated life of the reseller relationship with a cumulative catch up recognized for the elapsed portion of the estimated life of the reseller relationship. In 2012 and 2013, the first and second milestones were obtained, and therefore the reseller paid Yodle an additional $1.0 million for each milestone. As of March 31, 2014, one additional milestone remained unearned. Yodle also earns per customer fee revenue from its Canadian reseller on sales of Yodle offerings as well as revenues from assisting its reseller in executing its operations.
Recently Issued Accounting Guidance—In May 2014, the Financial Accounting Standards Board (“FASB”) issued Accounting Standards Update (“ASU”) No. 2014-09, Revenue from Contracts with Customers. This guidance supersedes the revenue recognition requirements in ASC 605, Revenue Recognition. This guidance is based on the principle that revenue is recognized to depict the transfer of goods or services to customers in an amount that reflects the consideration to which the entity expects to be entitled in exchange for those goods or services. The guidance also requires additional disclosure about the nature, amount, timing and uncertainty of revenue and cash flows arising from customer contracts, including significant judgments and changes in judgments and assets recognized from costs incurred to obtain or fulfill a contract. The amendments in this ASU are effective retrospectively for annual reporting periods beginning after December 15, 2016, including interim periods within that reporting period. Yodle is evaluating the potential impact of this adoption on its consolidated financial statements.
F-50
Table of Contents
Yodle, Inc. and Subsidiaries
Notes to Unaudited Interim Condensed Consolidated Financial Statements
As of December 31, 2013 and March 31, 2014 and
for the three months ended March 31, 2013 and 2014
(in thousands, except share and per share data)
Subsequent Events—Yodle follows ASC 855-10, Subsequent Events, which contains general standards of accounting for, and disclosure of, events that occur after the balance sheet date but before the condensed consolidated financial statements are available to be issued. Management has considered subsequent events through June 25, 2014, the date the condensed consolidated financial statements were available to be issued (see note on Subsequent Events).
3. BUSINESS COMBINATION AND ASSET ACQUISITION
On February 28, 2013, Yodle acquired 100% of Lighthouse Practice Management Group, Inc. (“Lighthouse”), a provider of dental appointment reminder and practice automation software services, based in Georgia. This business combination resulted in Yodle adding a strong practice automation capability to its existing offerings.
Under the terms of the merger agreement, Yodle (i) paid Lighthouse shareholders $5.0 million in cash at closing; (ii) issued 3,804,348 shares of its Series E Preferred Stock at a fair value of $2.30 per share to the shareholders of Lighthouse that qualified as accredited investors (of which 2,065,217 shares remain in escrow as of March 31, 2014); (iii) promised to pay the Lighthouse shareholders deferred payment consideration of $6.2 million in cash at a later time (the “Deferred Payment”); and (iv) agreed to pay the shareholders an earnout consideration (the “Earn-out”), the amount of which is based on revenue performance over the measurement period (commencing March 1, 2013 and ending February 28, 2014), not to exceed $3.0 million in cash and 869,565 shares. A portion (40%) of the Earn-out will be paid by the issuance of additional Series E Preferred Stock, calculated by dividing the amount of share based Earn-out earned by the initial fair value of $2.30 per share, and the balance (60%) will be paid in cash to the shareholders.
The Deferred Payment is due on the earlier of (a) the second anniversary of the effective date (February 28, 2015), (b) the closing of an initial public offering that nets proceeds to Yodle of at least $20.0 million (“Qualifying Public Offering”), and (c) the closing of a sale of Yodle. The Deferred Payment was subject to a post-close working capital adjustment and was reduced by $0.1 million. The Deferred Payment, subject to the terms of the agreement, accrues a simple interest rate of 8% per annum from the effective date and is payable to shareholders quarterly in arrears. The Company has an option to extend the due date to February 28, 2017 which would result in the interest rate increasing from 8% to 12%. Under the terms of the Deferred Payment, $1.7 million is accounted for as consideration in the business combination, and $4.5 million is compensation expense under ASC 710. The Deferred Payment had a fair value at acquisition of $1.6 million, and is adjusted to fair value at each reporting date. As of December 31, 2013 and March 31, 2014, the fair value of the consideration was $1.6 million and $1.7 respectively and is recorded in deferred consideration in the condensed consolidated balance sheets.
The $4.5 million of compensation expense is being expensed on a straight-line basis over a period of one year from acquisition date, which is the required service period per the agreement and is reflected in the condensed consolidated statements of operations in general and administrative expenses. In September 2013, the merger agreement was amended and the terms of the Deferred Payment were modified, which accelerated expenses for services related to one key employee. For the three months ended March 31, 2013 and 2014, $0.4 million and $0.5 million, respectively were charged to and classified as general and administrative expense in the condensed consolidated statements of operations. Compensation expense of $4.0 million and $4.5 million was outstanding on December 31, 2013 and March 31, 2014, respectively, and recorded in other liabilities, long-term portion and accrued expenses and other current liabilities, respectively, in the condensed consolidated balance sheets.
F-51
Table of Contents
Yodle, Inc. and Subsidiaries
Notes to Unaudited Interim Condensed Consolidated Financial Statements
As of December 31, 2013 and March 31, 2014 and
for the three months ended March 31, 2013 and 2014
(in thousands, except share and per share data)
Interest on the Deferred Payment has a stated interest rate of 8% and is payable quarterly in arrears. Interest expense is bifurcated between the consideration amount and the compensation expense. The interest related to the consideration is recorded to interest expense and other in the condensed consolidated statements of operations, and interest related to the compensation cost is recorded in general and administrative expense in the condensed consolidated statements of operations. The table below summarizes the interest costs related to the Deferred Payment;
| Three months ended March 31, |
||||||||
| 2013 | 2014 | |||||||
| Accrued interest on deferred consideration |
$ | 11 | $ | 33 | ||||
| Accrued interest on compensation expense |
31 | 89 | ||||||
|
|
|
|
|
|||||
| Total accrued interest on deferred payment |
$ | 42 | $ | 122 | ||||
|
|
|
|
|
|||||
The fair value of the Earn-out at the acquisition date was $4.6 million and was recorded as a liability as of the purchase date. In September 2013, the merger agreement was amended to recognize that the Earn-out targets had been met in full; and that in March 2014, the shareholders would be paid 869,565 shares of Series E Preferred Stock, and $3.0 million in cash. Subsequent to the amendment, the Company continued to record the fair value of the Earn-out as a liability under ASC 480. As of December 31, 2013, the Earn-out liability is recorded at a fair value of $5.3 million and is recorded in contingent consideration in business combination in the condensed consolidated balance sheets.
In March 2014, Yodle settled its Earn-out liability in accordance with the terms of September 2013 amendment to the Lighthouse purchase agreement. The changes in fair value of the Earn-out totaled less than $0.1 million and $0.5 million for the three months ended March 31, 2013 and 2014, respectively and were recorded in general and administrative expenses in the condensed consolidated statements of operations.
Software acquisition
On February 28, 2014, Yodle acquired early stage software code from New Service, LLC. Consideration for the acquired asset was $1.4 million, reflected in capitalized technology development costs, net, and consisting of (a) $0.5 million in cash, (b) 87,000 common shares, valued at $2.82 per share, and a deferred payment of $0.6 million, each of (b) and (c) are paid 50% on the first anniversary and 50% on the second anniversary of the closing. The Company estimates the useful life of the acquired software to be three years and is being amortized accordingly.
4. SUPPLEMENTAL CASH FLOW INFORMATION
| Supplemental disclosures of cash flow information |
||||||||
| Cash paid for interest |
$ | 348 | $ | 274 | ||||
| Cash paid for taxes |
93 | 39 | ||||||
| Non-cash investing and financing activities |
||||||||
| Stock issued as consideration in business combination |
8,750 | — | ||||||
| Deferred payment obligation issued as consideration in business combination |
1,615 | — | ||||||
| Fair value of Lighthouse earnout liability |
4,600 | — | ||||||
| Stock issued for Lighthouse earnout liability |
— | 2,748 | ||||||
| Property and equipment acquired that are unpaid in accounts payable |
249 | 103 | ||||||
| Deferred payment obligation issued in software acquisition |
— | 615 | ||||||
| Stock used to acquire software asset |
— | 246 |
F-52
Table of Contents
Yodle, Inc. and Subsidiaries
Notes to Unaudited Interim Condensed Consolidated Financial Statements
As of December 31, 2013 and March 31, 2014 and
for the three months ended March 31, 2013 and 2014
(in thousands, except share and per share data)
5. GOODWILL AND ACQUIRED INTANGIBLE ASSETS, NET
The changes in the carrying amount of goodwill for the three months ended March 31, 2014 are as follows:
| 2014 | ||||
| Goodwill, gross, as of January 1 |
$ | 55,227 | ||
| Accumulated impairment losses through January 1, |
— | |||
|
|
|
|||
| Balance as of January 1 |
55,227 | |||
| Goodwill from business combination |
— | |||
|
|
|
|||
| Balance as of March 31, 2014 |
$ | 55,227 | ||
|
|
|
|||
Information regarding acquired intangible assets, net that are being amortized is as follows:
| Customer Relationships |
Non - competition agreements |
Tradenames & Trademarks |
Developed Technology |
Total Intangible Assets |
||||||||||||||||
| Balance December 31, 2013 |
$ | 2,229 | $ | 1,065 | $ | 1,222 | $ | 7,092 | $ | 11,608 | ||||||||||
| Additions |
— | — | — | 4 | 4 | |||||||||||||||
| Amortization |
(134 | ) | (368 | ) | (74 | ) | (426 | ) | (1,002 | ) | ||||||||||
|
|
|
|
|
|
|
|
|
|
|
|||||||||||
| Net Carrying Value March 31, 2014 |
$ | 2,095 | $ | 697 | $ | 1,148 | $ | 6,670 | $ | 10,610 | ||||||||||
|
|
|
|
|
|
|
|
|
|
|
|||||||||||
Estimated remaining amortization of the acquired intangible assets is as follows:
| 2014 (remainder of year) |
$ | 2,294 | ||
| 2015 |
2,790 | |||
| 2016 |
2,574 | |||
| 2017 |
2,530 | |||
| 2018 |
422 | |||
|
|
|
|||
| Total |
$ | 10,610 | ||
|
|
|
6. BANK LOANS
The principal amounts, unamortized discounts, and net carrying amounts are as follows:
| December 31, 2013 | March 31, 2014 | |||||||||||||||||||||||||||
| Bank Loan |
Initial Principal |
Principal Outstanding |
Unamortized Discount |
Net Carrying Amount |
Principal Outstanding |
Unamortized Discount |
Net Carrying Amount |
|||||||||||||||||||||
| 2013 Loan |
$ | 3,000 | $ | 3,000 | $ | (30 | ) | $ | 2,970 | $ | 6,000 | $ | (27 | ) | $ | 5,973 | ||||||||||||
|
|
|
|
|
|
|
|
|
|
|
|
|
|||||||||||||||||
| Current portion |
$ | — | $ | — | $ | — | $ | 600 | $ | — | $ | 600 | ||||||||||||||||
| Long-term portion |
$ | 3,000 | $ | (30 | ) | $ | 2,970 | $ | 5,400 | $ | (27 | ) | $ | 5,373 | ||||||||||||||
In December 2013, Yodle modified its Loan and Security Agreement (“LSA”) with Silicon Valley Bank (“SVB”). Under the LSA, SVB agreed to loan Yodle up to $10.0 million under a term loan facility (the “Term Loan Facility”), as well as the lesser of $2.0 million and 80% of eligible accounts receivable under a revolving
F-53
Table of Contents
Yodle, Inc. and Subsidiaries
Notes to Unaudited Interim Condensed Consolidated Financial Statements
As of December 31, 2013 and March 31, 2014 and
for the three months ended March 31, 2013 and 2014
(in thousands, except share and per share data)
credit facility (the “Revolving Credit Facility” and together with the “Term Loan Facility”, the “2013 Loan”). The 2013 Loan is secured by substantially all of Yodle’s assets.
The repayment period of the Term Loan Facility will commence on January 2, 2015, with 30 equal monthly payments, and bears interest at 0.75% above prime. From January 1, 2014 to December 31, 2014, Yodle will be required only to pay interest monthly. The Term Loan Facility matures on June 1, 2017, but the draw period for the Term Loan Facility ends on December 31, 2014. On December 12, 2013, Yodle made its first drawdown under the Term Loan Facility of $3.0 million. On February 27, 2014, Yodle drew down an additional $3.0 million and used the funds to satisfy the cash portion of the Earn-out consideration related to the Lighthouse business combination (see note on Business Combination and Asset Acquisition).
Any outstanding principal amount under the Revolving Credit Facility and any accrued and unpaid interest must be paid in full by December 12, 2015. Borrowings under our Revolving Credit Facility accrue interest on a monthly basis and bears interest at 0.25% above prime. As of March 31, 2014, Yodle has not borrowed any amounts under the Revolving Credit Facility.
As of March 31, 2014, $5.4 million was classified as bank loan, long term and $0.6 million was classified as current portion of bank loan in the condensed consolidated balance sheets. The fair value of Term Loan Facility as of March 31, 2014 approximates the recorded value since the loans were made on December 18, 2013 and February, 27 2014 respectively.
Stated interest rates were 4.0% as of December 31, 2013 and March 31, 2014. For the three months ended March 31, 2013 and 2014, the effective interest rates including discount amortization for all bank debt were 11.62% and 4.35%, respectively and interest expense was $0.5 million and less than $0.1 million, inclusive of discount amortization, respectively. In connection with the LSA, Yodle is subject to certain covenants relating to Adjusted EBIDTA/Maximum EBIDTA Loss with which it must comply. As of March 31, 2014, Yodle is in compliance with all such covenants.
7. SUBORDINATED DEBT
Yodle has entered into debt agreements which are subordinated to the SVB loan. The schedule of principal amounts and net carrying amounts are as follows:
| Subordinated Debt |
Initial principal |
December 31, 2013 | March 31, 2014 | |||||||||||||||||
| Principal outstanding |
Net carrying amount |
Principal outstanding |
Net carrying amount |
|||||||||||||||||
| Subordinated Loan |
$ | 15,000 | $ | 15,000 | $ | 15,000 | $ | 15,000 | $ | 15,000 | ||||||||||
| Promissory Note |
2,460 | 2,460 | 2,460 | 2,460 | 2,460 | |||||||||||||||
|
|
|
|
|
|
|
|
|
|||||||||||||
| Total Subordinated Debt |
$ | 17,460 | $ | 17,460 | $ | 17,460 | $ | 17,460 | ||||||||||||
| Current portion |
$ | 2,460 | $ | 2,460 | $ | 2,460 | $ | 2,460 | ||||||||||||
| Long-term portion |
$ | 15,000 | $ | 15,000 | $ | 15,000 | $ | 15,000 | ||||||||||||
Subordinated Loan
In September 2013, Yodle borrowed $15.0 million from a reseller. The loan has a fixed interest rate of 5%, payable monthly. The Subordinated Loan is due in September 2017. Interest expense of $0.2 million was
F-54
Table of Contents
Yodle, Inc. and Subsidiaries
Notes to Unaudited Interim Condensed Consolidated Financial Statements
As of December 31, 2013 and March 31, 2014 and
for the three months ended March 31, 2013 and 2014
(in thousands, except share and per share data)
recorded in the condensed consolidated statements of operations for the three months ended March 31, 2014. The carrying value of the subordinated loan as of March 31, 2014 approximates fair value as the interest rate is relative when compared to the Company’s interest rate from the 2013 Loan. The effective interest rate was 5.13% and interest expense was $0.2 million for the three months ended March 31, 2014.
Promissory Note
On November 2011, Yodle issued a promissory note in the amount of $2.5 million, of which the principal accrues interest at 3.3% per annum. The note is due on the earlier of (i) the closing of an acquisition of Yodle or (ii) June 21, 2014. For the three months ended March 31, 2013 and 2014, $0.02 million and $0.02 million, respectively, was recorded in interest expense and other on the condensed consolidated statements of operations. As of March 31, 2014, the note is recorded as current debt, and the fair value approximates the carrying value as the Note’s interest rate is consistent with the rates available in market. The effective interest rate was 3.38% and interest expense was less than $0.1 million for the three months ended March 31, 2013 and 2014, respectively.
8. WARRANTS
Preferred Stock Warrants
The following table summarizes the outstanding preferred stock warrant liabilities as of December 31, 2013 and March 31, 2014:
| Preferred Stock Warrants |
Issue Date | Expiration Date |
Exercise Price |
Shares Outstanding |
Fair value at issue date |
Fair value as of December 31, 2013 |
Fair value as of March 31, 2014 |
|||||||||||||||||||
| Series A |
5/1/2007 | 5/31/2017 | 0.1445 | 311,419 | $ | — | $ | 657 | $ | 912 | ||||||||||||||||
| Series B |
7/18/2008 | 7/17/2018 | 0.5670 | 141,093 | 74 | 247 | 365 | |||||||||||||||||||
| Series D—Bridge Financing |
5/23/2011 | 5/23/2018 | 1.4045 | 640,797 | 326 | 658 | 1,135 | |||||||||||||||||||
| 7/23/11-8/23/12 | 5/23/2018 | 1.4045 | 897,120 | 444 | 895 | 1,588 | ||||||||||||||||||||
| Series D—2011 Loan |
5/23/11-11/23/11 | 5/22/2021 | 1.4045 | 711,997 | 666 | 997 | 1,666 | |||||||||||||||||||
| Series D—2010 Loan |
10/1/2010 | 10/1/2020 | 1.4045 | 78,320 | 76 | 107 | 180 | |||||||||||||||||||
|
|
|
|
|
|
|
|
|
|||||||||||||||||||
| 2,780,746 | $ | 1,586 | $ | 3,561 | $ | 5,846 | ||||||||||||||||||||
|
|
|
|
|
|
|
|
|
|||||||||||||||||||
The changes in fair value of the warrants recorded to interest expense and other represents income for the three months ended March 31, 2013 was $0.1 million and expense of $2.3 million for the three months ended March 31, 2014.
Common Stock Warrants
As part of a LSA in 2012, SVB received a warrant to purchase 195,000 shares of common stock at a purchase price of $1.19 per share. As of December 31, 2013 and March 31, 2014, respectively, all 195,000 of these warrants remained outstanding.
In March 2009, a recruiting firm received warrants to purchase 37,500 shares of common stock at a purchase price of $0.38 per share. As of December 31, 2013 and March 31, 2014, respectively, 5,553 of these warrants remained outstanding.
F-55
Table of Contents
Yodle, Inc. and Subsidiaries
Notes to Unaudited Interim Condensed Consolidated Financial Statements
As of December 31, 2013 and March 31, 2014 and
for the three months ended March 31, 2013 and 2014
(in thousands, except share and per share data)
The common warrants issued and outstanding were assessed under ASC 815 and were determined to initially not meet the definition of a derivative, but will require evaluation on an on-going basis. As of March 31, 2014, the warrants still did not meet the definition of a derivative and were therefore classified in stockholders’ equity.
9. INCOME TAXES
The Company recorded an income tax provision of $0.1 million on a pre-tax loss of $5.8 million during the three months ended March 31, 2014. The Company recorded a $5.3 million tax benefit on a pre-tax loss of $3.1 million during the three months ended March 31, 2013. The effective tax rates are not meaningful. The difference in rates between the two periods is primarily a result of the recording of a one-time benefit for a decrease in the valuation allowance resulting from the acquisition of Lighthouse.
Based on Yodle’s history of generating net operating losses, management has concluded that it is more likely than not that Yodle will not be able to generate sufficient taxable income in future periods to utilize the net operating losses and other deferred tax assets. Therefore, Yodle has established a full valuation against net deferred tax assets.
As of December 31, 2013 and March 31, 2014, the Company had $0.3 million of unrecognized tax benefits, all of which, if recognized, would affect the Company’s effective tax rate. The Company’s continuing practice is to recognize interest and penalties related to income tax matters in income tax expense. The Company had less than $0.1 million accrued for interest and penalties, which is included in the $0.3 million of unrecognized tax benefits noted above. There were no events in the first quarter of 2014 that created new uncertain tax positions.
The Company’s income tax returns are subject to tax examinations in several jurisdictions in which it operates. The tax years that remain subject to examination are primarily 2010 and forward.
10. CONVERTIBLE PREFERRED STOCK
Yodle has issued six series of convertible preferred stock: Series A, Series B, Series C, Series D, Series E, and Series F collectively “Convertible Preferred Stock”, as follows:
| Convertible |
Issue Date |
Issued | Outstanding | Authorized | Original issue price |
Original proceeds at issuance |
Issuance Costs |
Proceeds net of issuance costs |
Liquidation preference |
Carrying value as of December 31, 2013 |
Carrying value as of March 31, 2014 |
|||||||||||||||||||||||||||||||||
| Series A |
Nov-06 | 21,453,287 | 21,453,287 | 21,453,287 | $ | 0.1444 | $ | 3,098 | $ | 110 | $ | 2,988 | $ | 0.1444 | $ | 2,988 | $ | 2,988 | ||||||||||||||||||||||||||
| Series A |
Jun-07 | 3,460,208 | 3,460,208 | 25,224,914 | $ | 0.1445 | 500 | — | 500 | $ | 0.1445 | 500 | 500 | |||||||||||||||||||||||||||||||
| Series B |
Nov-07 | 21,164,021 | 21,164,021 | 21,305,114 | $ | 0.5670 | 12,000 | 68 | 11,932 | $ | 0.5670 | 11,932 | 11,932 | |||||||||||||||||||||||||||||||
| Series C |
Jan-09 | 15,539,919 | 15,539,919 | 15,539,919 | $ | 0.8366 | 13,000 | 90 | 12,910 | $ | 0.8366 | 12,910 | 12,910 | |||||||||||||||||||||||||||||||
| Series C |
Aug-09 | 298,000 | 298,000 | 15,837,919 | $ | 0.8366 | 250 | — | 250 | $ | 0.8366 | 250 | 250 | |||||||||||||||||||||||||||||||
| Series D |
May-11 | 7,119,973 | 7,119,973 | 7,119,973 | $ | 1.4045 | 10,000 | 65 | 9,935 | $ | 1.4045 | 9,935 | 9,935 | |||||||||||||||||||||||||||||||
| Series D |
Sep-12 | 7,274,827 | 7,274,827 | 16,723,034 | $ | 1.4045 | 10,218 | — | 10,218 | $ | 1.4045 | 10,218 | 10,218 | |||||||||||||||||||||||||||||||
| Series E |
Feb-13 | 3,804,348 | 3,804,348 | 4,673,913 | $ | 2.3000 | 8,750 | 72 | 8,678 | $ | 2.3000 | 8,678 | 8,678 | |||||||||||||||||||||||||||||||
| Series E |
Mar-14 | 869,565 | 869,565 | 4,673,913 | $ | 3.1600 | 2,748 | — | 2,748 | $ | 2.3000 | — | 2,748 | |||||||||||||||||||||||||||||||
| Series F |
Feb-13 | 1,666,667 | 1,666,667 | 1,666,667 | $ | 3.0000 | 5,000 | — | 5,000 | $ | 4.5000 | 5,000 | 5,000 | |||||||||||||||||||||||||||||||
|
|
|
|
|
|
|
|
|
|
|
|
|
|||||||||||||||||||||||||||||||||
| 82,650,815 | $ | 65,442 | $ | 405 | $ | 65,037 | $ | 62,411 | $ | 65,159 | ||||||||||||||||||||||||||||||||||
|
|
|
|
|
|
|
|
|
|
|
|
|
|||||||||||||||||||||||||||||||||
F-56
Table of Contents
Yodle, Inc. and Subsidiaries
Notes to Unaudited Interim Condensed Consolidated Financial Statements
As of December 31, 2013 and March 31, 2014 and
for the three months ended March 31, 2013 and 2014
(in thousands, except share and per share data)
In March 2014, Yodle settled its Earn-out liability in accordance with the terms of the September 2013 amendment to the Lighthouse merger agreement which included the issuance of 869,565 shares of Series E Preferred Stock at a fair value of $3.16 per share (see note on Business Combination and Asset Acquisition). As of March 31, 2014, Yodle concluded that a deemed liquidation event was not probable and, therefore, preferred stock is presented net of issuance costs.
11. STOCK-BASED COMPENSATION
Under the Equity Incentive Plan (the “Plan”) for directors, employees, and consultants of Yodle, in 2007, the Board authorized the grant of nonqualified and incentive stock options. In February 2013, the Board increased the number of options available to be issued under the plan to 30,953,663 from 26,853,663. In October 2013, the Board increased the number of options available to be issued to 34,953,663 from 30,953,663. Such options become exercisable subject to vesting schedules up to five years from the date of the grant.
There were no option grants during the three months ended March 31, 2013. The fair market value of each option granted for the three months ended March 31, 2014 has been estimated on the grant date using the Black-Scholes-Merton option-pricing model with the following assumptions:
| Three months ended March 31, 2014 | ||
| Risk-free interest rate (percentage) |
1.78 – 1.84 | |
| Expected term (in years) |
6.03 – 6.08 | |
| Expected dividend yield (percentage) |
— | |
| Expected volatility (percentage) |
56.86 –56.89 |
As of March 31, 2014, there remains approximately $5.1 million of unrecognized compensation cost from stock options granted under the plan, which is expected to be recognized over a period of 3.61 years.
During the three months ended March 31, 2013 and 2014, no stock–based compensation expense for non-employee consultants was recognized as no non-employee grants were issued or outstanding. A summary of stock option activity as of and for the three months ended March 31, 2014 is as follows:
| Number of Shares |
Weighted Average Exercise Price |
Average Remaining Contract Life |
Aggregate Intrinsic Value |
|||||||||||||
| Options outstanding as of January 1, 2014 |
20,960,745 | $ | 0.89 | 7.04 Years | $ | 23,372 | ||||||||||
| Granted |
1,412,000 | 2.01 | ||||||||||||||
| Exercised |
(4,496,714 | ) | 0.19 | |||||||||||||
| Forfeited—unvested |
(297,361 | ) | 1.18 | |||||||||||||
| Forfeited—vested and cancelled |
(4,186 | ) | 0.97 | |||||||||||||
|
|
|
|||||||||||||||
| Options outstanding as of March 31, 2014 |
17,574,484 | 1.16 | 7.80 Years | 31,615 | ||||||||||||
|
|
|
|||||||||||||||
| Options expected to vest as of March 31, 2014 |
13,919,884 | 1.07 | 7.50 Years | |||||||||||||
| Options exercisable as of March 31, 2014 |
7,742,112 | 0.67 | 6.28 Years | 17,738 | ||||||||||||
F-57
Table of Contents
Yodle, Inc. and Subsidiaries
Notes to Unaudited Interim Condensed Consolidated Financial Statements
As of December 31, 2013 and March 31, 2014 and
for the three months ended March 31, 2013 and 2014
(in thousands, except share and per share data)
The weighted-average grant date fair value of options granted during the three months ended March 31, 2014 was $1.29. There were no grants during the three months ended March 31, 2013. The total intrinsic value of options exercised in the three months ended March 31, 2013 and 2014 was $0.4 million and $9.3 million respectively.
A summary of the status of Yodle’s unvested options as of March 31, 2014, and changes during the three months ended March 31, 2014 is as follows:
| Number Of Options |
Weighted Average Grant- Date Fair Value |
|||||||
| Nonvested as of January 1, 2014 |
9,321,969 | 0.77 | ||||||
| Granted |
1,412,000 | 1.29 | ||||||
| Vested |
(604,236 | ) | ||||||
| Forfeited |
(297,361 | ) | 0.61 | |||||
|
|
|
|||||||
| Nonvested as of March 31, 2014 |
9,832,372 | 0.85 | ||||||
|
|
|
|||||||
On May 23, 2011, the Board authorized the Company to make restricted stock grants of 2,000,000 shares of the Company’s common stock with a fair value of $1.51 per share. The restricted stock grant vests over a two year period; 50% of the shares vest at the one-year anniversary and the remainder vest monthly thereafter. Total fair value of the awards was $3.0 million. Stock-based compensation expense related to restricted stock for the three months ended March 31, 2013 was $0.6 million. As of December 31, 2013 all shares had vested. There were no other grants of restricted stock units during the three months ended March 31, 2014.
Stock-based compensation expense was included in the following costs and expenses:
| Three months ended March 31 |
||||||||
| 2013 | 2014 | |||||||
| Cost of revenue |
$ | 4 | $ | 10 | ||||
| Selling and Marketing |
241 | 237 | ||||||
| Technology and product development |
159 | 218 | ||||||
| General and administrative |
521 | 214 | ||||||
|
|
|
|
|
|||||
| Total stock-based compensation expense |
$ | 925 | $ | 679 | ||||
|
|
|
|
|
|||||
12. COMMITMENTS AND CONTINGENCIES
Legal Matters—From time to time Yodle or its subsidiaries may be involved in legal proceedings and/or litigation arising in the ordinary course of business. While the outcome of these matters cannot be predicted with certainty, Yodle does not believe that the outcome of any current claims, individually and in aggregate, will have a material effect on its condensed consolidated financial position, results of operations, or cash flows.
F-58
Table of Contents
Yodle, Inc. and Subsidiaries
Notes to Unaudited Interim Condensed Consolidated Financial Statements
As of December 31, 2013 and March 31, 2014 and
for the three months ended March 31, 2013 and 2014
(in thousands, except share and per share data)
13. FAIR VALUE MEASUREMENTS
In accordance with ASC 820, Fair Value Measurements, Yodle has categorized its assets and liabilities recorded at fair value based upon the fair value hierarchy. The levels of fair value hierarchy are as follows:
| • | Level 1 inputs utilize quoted prices (unadjusted) in active markets for identical assets or liabilities that Yodle has the ability to access. |
| • | Level 2 inputs utilize other-than-quoted prices that are observable, either directly or indirectly. Level 2 inputs include quoted prices for similar assets and liabilities in active markets, and inputs such as interest rates and yield curves that are observable at commonly quoted intervals. |
| • | Level 3 inputs are unobservable and are typically based on Yodle’s own assumptions, including situations where there is little, if any, market activity. |
In certain cases, the inputs used to measure fair value may fall into different levels of the fair value hierarchy. In such cases, Yodle categorizes such assets or liabilities based on the lowest level input that is significant to the fair value measurement in its entirety. Yodle’s assessment of the significance of a particular input to the fair value measurement in its entirety requires judgment and considers factors specific to the asset. Both observable and unobservable inputs may be used to determine the fair value of positions that are classified within the Level 3 category. As a result, the unrealized gains and losses for assets within the Level 3 category presented below may include changes in fair value that were attributable to both observable (e.g. changes in market interest rates) and unobservable (e.g. changes in historical company data) inputs.
The major categories of assets and liabilities measured on a recurring basis, at fair value, as of December 31, 2013 and March 31, 2014 are as follows:
| At December 31, 2013 | ||||||||||||||||||
| Level 1 | Level 2 | Level 3 | Total | |||||||||||||||
| Asset |
Money market funds | $ | 5,294 | $ | — | $ | — | $ | 5,294 | |||||||||
| Asset |
Certificates of deposit | — | 2,228 | — | 2,228 | |||||||||||||
| Liability |
Preferred stock warrant liabilities | — | — | 3,561 | 3,561 | |||||||||||||
| Liability |
Contingent consideration in business combination | — | 2,977 | 2,313 | 5,290 | |||||||||||||
| Liability |
Deferred consideration, long-term portion | — | 1,637 | — | 1,637 | |||||||||||||
| At March 31, 2014 | ||||||||||||||||||
| Level 1 | Level 2 | Level 3 | Total | |||||||||||||||
| Asset |
Money market funds | $ | 8,294 | $ | — | $ | — | $ | 8,294 | |||||||||
| Asset |
Certificates of deposit | — | 2,228 | — | 2,228 | |||||||||||||
| Liability |
Preferred stock warrant liabilities | — | — | 5,846 | 5,846 | |||||||||||||
| Liability |
Current portion of deferred consideration | — | 1,679 | — | 1,679 | |||||||||||||
Money market funds—Yodle values its money market funds using quoted active market prices for such funds at each reporting date.
Certificates of deposit (“CD”)—Yodle compares its CD rates with active market prices of comparable CDs at each reporting date. The certificates of deposit are classified as restricted cash and have a maturity date of March 2015 or sooner.
F-59
Table of Contents
Yodle, Inc. and Subsidiaries
Notes to Unaudited Interim Condensed Consolidated Financial Statements
As of December 31, 2013 and March 31, 2014 and
for the three months ended March 31, 2013 and 2014
(in thousands, except share and per share data)
Contingent consideration in business combination—In March 2014, Yodle paid the shareholders of Lighthouse an Earn-out, the amount of which was based on gross revenue performance over the measurement period (commencing March 1, 2013 and ending February 28, 2014). The Earn-out was settled by the issuance of 869,565 Series E Preferred Shares at a fair value of $3.16 per share and the payment of $3.0 million in cash to the shareholders.
Deferred consideration—The valuation technique used to measure fair value for Yodle’s Level 2 deferred consideration was the present value of expected future cash flows.
The fair value of the deferred consideration was determined using the present value of expected cash payments, including interest, over the term of the liability. The discount rate used, 7.03%, was consistent with the discount rate used to calculate the fair value at the acquisition date.
Preferred stock warrant liabilities—The valuation technique used to measure fair value for Yodle’s Level 3 warrant liabilities was a Black Scholes-Merton option pricing model at each reporting date. A rollforward of the fair value measurements of the warrant liability categorized with Level 3 inputs from January 1, 2014 to March 31, 2014 is as follows:
| Balance as of January 1, 2014 |
$ | 3,561 | ||
| Issuance of warrants |
— | |||
| Change in fair value of warrant liability |
2,285 | |||
|
|
|
|||
| Balance as of March 31, 2014 |
$ | 5,846 | ||
|
|
|
F-60
Table of Contents
Yodle, Inc. and Subsidiaries
Notes to Unaudited Interim Condensed Consolidated Financial Statements
As of December 31, 2013 and March 31, 2014 and
for the three months ended March 31, 2013 and 2014
(in thousands, except share and per share data)
The fair market value of each warrant granted has been estimated as of December 31, 2013 and March 31, 2014 using a Black Scholes-Merton pricing model with the following assumptions:
| Year ended December 31, 2013 |
Three months ended March 31, 2014 | |||
| Series A Preferred |
||||
| Risk-free interest rate (percentage) |
0.37 –0.99 | 0.96 | ||
| Expected term (in years) |
3.39 –4.14 | 3.14 | ||
| Expected dividend yield (percentage) |
— | — | ||
| Expected volatility (percentage) |
49.50–67.50 | 60.70 | ||
| 2013 | 2014 | |||
| Series B Preferred |
||||
| Risk-free interest rate (percentage) |
0.55 –1.42 | 1.43 | ||
| Expected term (in years) |
4.55 –5.30 | 4.30 | ||
| Expected dividend yield (percentage) |
— | — | ||
| Expected volatility (percentage) |
48.80–64.70 | 60.70 | ||
| 2013 | 2014 | |||
| Series D Preferred—Bridge Financing |
||||
| Risk-free interest rate (percentage) |
0.17 –0.23 | 0.21 | ||
| Expected term (in years) |
1.26 –1.55 | 1.26 | ||
| Expected dividend yield (percentage) |
— | — | ||
| Expected volatility (percentage) |
42.10–52.10 | 59.40 | ||
| 2013 | 2014 | |||
| Series D Preferred—2010 Loan |
||||
| Risk-free interest rate (percentage) |
1.00 –2.02 | 2.16 | ||
| Expected term (in years) |
6.81 –7.56 | 6.56 | ||
| Expected dividend yield (percentage) |
— | — | ||
| Expected volatility (percentage) |
42.10–52.10 | 59.40 | ||
| 2013 | 2014 | |||
| Series D Preferred—2011 Loan |
||||
| Risk-free interest rate (percentage) |
1.12 –2.14 | 2.31 | ||
| Expected term (in years) |
7.39 –8.14 | 7.14 | ||
| Expected dividend yield (percentage) |
— | — | ||
| Expected volatility (percentage) |
42.10–52.10 | 59.40 | ||
F-61
Table of Contents
Yodle, Inc. and Subsidiaries
Notes to Unaudited Interim Condensed Consolidated Financial Statements
As of December 31, 2013 and March 31, 2014 and
for the three months ended March 31, 2013 and 2014
(in thousands, except share and per share data)
14. SEGMENT, GEOGRAPHIC AND SIGNIFICANT CUSTOMER INFORMATION
The chief operating decision maker (“CODM”) reviews financial information presented on a consolidated basis for purposes of allocating resources and evaluating financial performance. Yodle has concluded that its operations constitute one operating and reportable segment. Substantially all assets were held in the United States as of December 31, 2013 and March 31, 2014.
Yodle’s geographic revenues by country of customer residence, and percentage of total revenue by location, are as follows:
| Three months ended March 31, 2013 |
Three months ended March 31, 2014 |
|||||||||||||||
| United States |
$ | 33,063 | 94 | % | $ | 43,686 | 95 | % | ||||||||
| International |
2,139 | 6 | % | 2,060 | 5 | % | ||||||||||
|
|
|
|
|
|||||||||||||
| $ | 35,202 | 100 | % | $ | 45,746 | 100 | % | |||||||||
|
|
|
|
|
|||||||||||||
No single customer exceeds ten percent of Yodle’s revenue for the three months ended March 31, 2013 and 2014. As of December 31, 2013, one customer accounted for 38% of accounts receivable, net. As of March 31, 2014, this customer accounted for 29% of accounts receivable, net.
15. NET INCOME (LOSS) PER SHARE
Basic and diluted net loss per share attributable to common stockholders is presented in conformity with the two-class method required for participating securities.
In the event a dividend is paid on common stock, convertible preferred stock participates as if they were holders of common shares (on an if-converted basis). To date no dividends have been declared.
Under the two-class method for periods with net income, basic net income per share attributable to common stockholders is computed by dividing the net income attributable to common stockholders by the weighted average number of common shares outstanding during the period. Net income attributable to common stockholders is determined by allocating undistributed earnings among common stock and convertible preferred stock. The holders of convertible preferred stock shall first receive or simultaneously receive a dividend on each outstanding share of convertible preferred stock in an amount at least equal to $0.0116 per share for Series A Preferred, $0.0454 per share for Series B Preferred, $0.0669 per share for Series C Preferred, $0.1124 for Series D Preferred, $0.184 per share for Series E Preferred, and $0.2400 per share for Series F Preferred. Since preferred stockholders are entitled to receive minimum dividend payouts prior to any common stockholders receiving dividends, undistributed earnings is allocated first to preferred shares up to the minimum dividend. In the three months ended March 31, 2013, the undistributed earnings did not exceed the minimum preferred dividend, and as such, all earnings were allocated to preferred stockholders in determining net income per share attributable to common stockholders.
For periods with a net loss, an allocation of the undistributed losses to the holders of convertible preferred stock and unvested restricted stock is not made, as the holders have no obligation to fund losses.
F-62
Table of Contents
Yodle, Inc. and Subsidiaries
Notes to Unaudited Interim Condensed Consolidated Financial Statements
As of December 31, 2013 and March 31, 2014 and
for the three months ended March 31, 2013 and 2014
(in thousands, except share and per share data)
Diluted net income (loss) per share attributable to common stockholders is computed by using the weighted average number of common shares outstanding, plus, for periods with net income attributable to common stockholders, the potential dilutive effect of outstanding stock options and warrants using the treasury stock method. In addition, the Company analyzes the potential effect of the outstanding participating securities under the “if-converted” method when calculating diluted earnings per share, in which it is assumed that the outstanding participating securities convert into common stock at the beginning of the period. The Company reports the more dilutive of the approaches (two-class or “if-converted”) as its diluted net income per share during the period.
| Three months ended March 31 |
Three months ended March 31 |
|||||||
| 2013 | 2014 | |||||||
| Net income (loss) |
$ | 2,187 | $ | (5,945 | ) | |||
| Less: Income attributable to participating preferred stock |
(2,187 | ) | — | |||||
|
|
|
|
|
|||||
| Net income (loss) attributable to common stockholders |
$ | — | $ | (5,945 | ) | |||
|
|
|
|
|
|||||
| Denominator: |
||||||||
| Denominator for basic EPS-weighted average shares |
34,279,294 | 41,242,673 | ||||||
| Effect of dilutive securities: |
||||||||
| Preferred stock warrants |
645,524 | |||||||
| Common stock warrants |
61,532 | |||||||
| Employee stock options |
11,889,534 | |||||||
|
|
|
|
|
|||||
| Denominator for diluted EPS-adjusted weighted average shares |
46,875,884 | 41,242,673 | ||||||
|
|
|
|
|
|||||
| Net income (loss) per share attributable to common stockholders: |
||||||||
| Basic EPS |
$ | — | $ | (0.14 | ) | |||
|
|
|
|
|
|||||
| Diluted EPS |
$ | — | $ | (0.14 | ) | |||
|
|
|
|
|
|||||
Yodle excluded the following weighted-average common shares underlying stock-based securities from the calculations of diluted net income per common share because their inclusion would have been anti-dilutive:
| Three months ended March 31 |
Three months ended March 31 |
|||||||
| 2013 | 2014 | |||||||
| Dilutive effect of preferred stock |
78,194,696 | 82,071,105 | ||||||
| Dilutive effect of employee stock options |
302,000 | 18,870,335 | ||||||
| Dilutive effect of Preferred Stock Warrants |
— | 2,780,746 | ||||||
| Dilutive effect of Common Stock Warrants |
— | 200,553 | ||||||
|
|
|
|
|
|||||
| 78,496,696 | 103,922,739 | |||||||
|
|
|
|
|
|||||
F-63
Table of Contents
Yodle, Inc. and Subsidiaries
Notes to Unaudited Interim Condensed Consolidated Financial Statements
As of December 31, 2013 and March 31, 2014 and
for the three months ended March 31, 2013 and 2014
(in thousands, except share and per share data)
16. SUBSEQUENT EVENTS
On May 29, 2014, the Board increased the number of options available to be issued under the Company’s Equity Incentive Plan to 37,353,663 from 34,953,663. During May 2014, Yodle granted 4,875,600 shares to various employees under the plan. Of these options, 2,380,000 are not exercisable unless certain objectives are met, and are subject to cancellation if such objectives are not met within one year of the grant date.
On June 18, 2014, Yodle made a third drawdown, in the amount of $3.0 million, against its 2013 Loan with SVB. Yodle used $2.7 million of the proceeds to pay off the balance and accrued interest due on the promissory note on June 20, 2014. The promissory note was due for payment on June 21, 2014. Following the drawdown, the principal outstanding for the 2013 Loan increased to $9.0 million, with $1.0 million of the agreed loan amount of $10.0 million available for future drawdowns. The drawdown period ends on December 31, 2014. The current portion of the principal outstanding increased to $0.9 million, with the long-term portion increasing to $8.1 million. The payment of the promissory note reduced total subordinated debt by $2.5 million to $15.0 million, all of which is long term. Yodle did not incur additional fees in connection with the June 18, 2014 drawdown.
F-64
Table of Contents
Table of Contents
PART II
INFORMATION NOT REQUIRED IN PROSPECTUS
| Item 13. | Other Expenses of Issuance and Distribution. |
The following table sets forth all costs and expenses, other than underwriting discounts and commissions, payable by us in connection with the sale of the common stock being registered. All amounts shown are estimates except for the SEC registration fee and the Financial Industry Regulatory Authority, or FINRA, filing fee.
| Amount to be Paid |
||||
| SEC registration fee |
$ | 9,660 | ||
| FINRA filing fee |
11,100 | |||
| Stock exchange initial listing fee |
* | |||
| Blue sky fees and expenses |
* | |||
| Printing and engraving expenses |
* | |||
| Legal fees and expenses |
* | |||
| Accounting fees and expenses |
* | |||
| Transfer agent and registrar fees |
* | |||
| Miscellaneous fees and expenses |
* | |||
|
|
|
|||
| Total |
$ | * | ||
|
|
|
|||
| * | To be filed by amendment. |
| Item 14. | Indemnification of Directors and Officers. |
We are incorporated under the laws of the State of Delaware. Section 102 of the Delaware General Corporation Law permits a corporation to eliminate the personal liability of directors of a corporation to the corporation or its stockholders for monetary damages for a breach of fiduciary duty as a director, except where the director breached his or her duty of loyalty, failed to act in good faith, engaged in intentional misconduct or knowingly violated a law, authorized the payment of a dividend or approved a stock repurchase in violation of Delaware corporate law or obtained an improper personal benefit.
Section 145 of the Delaware General Corporation Law provides that a corporation has the power to indemnify a director, officer, employee or agent of the corporation and certain other persons serving at the request of the corporation in related capacities against expenses (including attorneys’ fees), judgments, fines and amounts paid in settlements actually and reasonably incurred by the person in connection with an action, suit or proceeding to which he is or is threatened to be made a party by reason of such position, if such person acted in good faith and in a manner he reasonably believed to be in or not opposed to the best interests of the corporation, and, in any criminal action or proceeding, had no reasonable cause to believe his or her conduct was unlawful, except that, in the case of actions brought by or in the right of the corporation, no indemnification shall be made with respect to any claim, issue or matter as to which such person shall have been adjudged to be liable to the corporation unless and only to the extent that the Court of Chancery or other adjudicating court determines that, despite the adjudication of liability but in view of all of the circumstances of the case, such person is fairly and reasonably entitled to indemnity for such expenses which the Court of Chancery or such other court shall deem proper.
As permitted by the Delaware General Corporation Law, our amended and restated certificate of incorporation and bylaws will provide that: (1) we are required to indemnify our directors to the fullest extent permitted by the Delaware General Corporation Law; (2) we may, in our discretion, indemnify our officers, employees and agents as set forth in the Delaware General Corporation Law; (3) we are required, upon
II-1
Table of Contents
satisfaction of certain conditions, to advance all expenses incurred by our directors in connection with certain legal proceedings; (4) the rights conferred in the bylaws are not exclusive; and (5) we are authorized to enter into indemnification agreements with our directors, officers, employees and agents.
We have entered into agreements with our directors that require us to indemnify them against expenses, judgments, fines, settlements and other amounts that any such person becomes legally obligated to pay (including with respect to a derivative action) in connection with any proceeding, whether actual or threatened, to which such person may be made a party by reason of the fact that such person is or was a director or officer of us or any of our affiliates, provided such person acted in good faith and in a manner such person reasonably believed to be in, or not opposed to, our best interests. The indemnification agreements also set forth certain procedures that will apply in the event of a claim for indemnification thereunder. At present, no litigation or proceeding is pending that involves any of our directors or officers regarding which indemnification is sought, nor are we aware of any threatened litigation that may result in claims for indemnification.
We maintain a directors’ and officers’ liability insurance policy. The policy insures directors and officers against unindemnified losses arising from certain wrongful acts in their capacities as directors and officers and reimburses us for those losses for which we have lawfully indemnified the directors and officers. The policy contains various exclusions.
In addition, the underwriting agreement to be filed as Exhibit 1.1 to this Registration Statement provides for indemnification by the underwriters of us and our officers and directors for certain liabilities arising under the Securities Act, or otherwise. Our fourth amended and restated investors’ rights agreement with certain investors also provides for cross-indemnification in connection with the registration of our common stock on behalf of such investors.
| Item 15. | Recent Sales of Unregistered Securities. |
The following list sets forth information regarding all unregistered securities issued by us since January 1, 2011 through the date of the prospectus that is a part of this registration statement:
Issuances of Common Stock, Restricted Stock and Options to Purchase Common Stock
As partial consideration for our acquisition of ProfitFuel, Inc., on May 23, 2011 we issued 13,000,000 shares of our common stock to entities and individuals that qualified as “accredited investors” within the meaning of Regulation D under the Securities Act in reliance on Rule 506 thereunder. As partial consideration for the agreement of three ProfitFuel employees to become Yodle employees upon the closing of the acquisition on May 23, 2011, we issued 2,000,000 shares of our restricted stock in reliance on Section 4(2) of the Securities Act.
From January 1, 2011 through the date of this prospectus, we have granted under our 2007 Plan options to purchase an aggregate of 21,969,642 shares of our common stock to employees, consultants and directors, having exercise prices ranging from $0.38 to $2.96 per share. Of these options to purchase, an aggregate of 4,758,226 shares have been cancelled without being exercised. During the period from January 1, 2011 through the date of this prospectus, an aggregate of 11,301,948 shares of our common stock were issued upon the exercise of stock options under the 2007 Plan, at exercise prices between $0.06 and $1.64 per share, for aggregate proceeds of approximately $3.0 million.
The offers, sales and issuances of the securities described in the preceding paragraph were exempt from registration under Rule 701 promulgated under the Securities Act, or Rule 701, in that the transactions were by an issuer not involving any public offering or under Section 4(a)(2) of the Securities Act or under compensatory benefit plans and contracts relating to compensation as provided under Rule 701. The recipients of such securities were our employees, directors or consultants and received the securities under our equity incentive plans. Appropriate legends were affixed to the securities issued in these transactions.
II-2
Table of Contents
Issuances of Preferred Stock
In September 2012, we issued an aggregate of 7,274,827 shares of our Series D preferred stock to nine accredited investors upon the full conversion of the notes described below under “—Issuances of Convertible Notes and Warrants.”
In February 2013, we issued (1) an aggregate of 3,804,348 shares of our Series E preferred stock to five accredited investors at a per share price of $2.30, for aggregate consideration of approximately $8.8 million and (2) an aggregate of 1,666,667 shares of our Series F preferred stock to nine accredited investors at a per share price of $3.00, for aggregate consideration of approximately $5.0 million, in each case in reliance on Rule 506 of Regulation D.
In March 2014, we issued an additional 869,565 shares of our Series E preferred stock, or an aggregate amount of $2.0 million, to the same five accredited investors that received shares of our Series E preferred stock in February 2013 pursuant to the terms of the merger agreement entered into in connection with our acquisition of Lighthouse Practice Management. This issuance was made in reliance on Rule 506 of Regulation D.
Issuances of Convertible Notes and Warrants
On May 23, 2011, we issued of $9.0 million aggregate principal amount of convertible promissory notes to nine accredited investors, in reliance on Rule 506 of Regulation D, to partially fund our acquisition of ProfitFuel, Inc. In September 2012, the holders of these notes converted all outstanding principal and accrued and unpaid interest of approximately $1.2 million under such promissory notes into 7,274,827 shares of our Series D preferred stock.
In connection with the issuance of $9.0 million aggregate principal amount of convertible promissory notes to nine accredited investors as described above, on May 23, 2011, we issued warrants to purchase an aggregate of $900,000 of our capital stock (initially equal to 10% of the aggregate principal amount of the convertible promissory notes) to those same accredited investors. The issuance of these warrants was made in reliance on Rule 506 of Regulation D. These were amended and restated as of September 21, 2012 to account for certain adjustments, as provided by the terms of the original warrants. As of December 31, 2013, the warrants were convertible into an aggregate of approximately $2.2 million of our Series D preferred stock at an exercise price of $1.4045 per share.
The recipients of the securities in these transactions represented their intentions to acquire the securities for investment only and not with a view to or for sale in connection with any distribution thereof, and appropriate legends were placed upon the stock certificates issued in these transactions. All recipients had adequate access, through their relationships with us, to information about us. The sales of these securities were made without any general solicitation or advertising.
| Item 16. | Exhibits and Financial Statement Schedules. |
(a) Exhibits
| Exhibit Number |
Description of Document | |
| 1.1† | Form of Underwriting Agreement. | |
| 2.1 | Agreement and Plan of Merger, dated as of February 28, 2013, by and among Registrant, LH Merger Corp., Lighthouse Practice Management Group, Inc., Brian Smith and the other parties thereto. | |
| 3.1 | Fifth Amended and Restated Certificate of Incorporation, as amended and as currently in effect. | |
| 3.2† | Form of Amended and Restated Certificate of Incorporation to be effective upon completion of this offering. | |
II-3
Table of Contents
| 3.3 | By-Laws, as currently in effect. | |
| 3.4† | Form of Amended and Restated Bylaws to be effective upon completion of this offering. | |
| 4.1† | Specimen stock certificate evidencing shares of common stock. | |
| 4.2 | Fourth Amended and Restated Investors’ Rights Agreement, dated as of February 28, 2013, by and among the Registrant and certain of its stockholders. | |
| 5.1† | Opinion of Cooley LLP as to legality. | |
| 10.1† | Loan and Security Agreement, dated as of September 9, 2013, between Rogers Communications Inc. and the Registrant, ProfitFuel, Inc. and Lighthouse Practice Management Group, Inc. | |
| 10.1.1† | Intellectual Property Security Agreements relating to the Loan and Security Agreement with Rogers Communications Inc. dated as of September 9, 2013. | |
| 10.1.2† | Subordination Agreement, dated as of September 9, 2013, between Rogers Communications Inc. and Silicon Valley Bank. | |
| 10.2† | Amended and Restated Loan and Security Agreement, dated as of December 12, 2013, between Silicon Valley Bank and the Registrant, ProfitFuel, Inc. and Lighthouse Practice Management Group, Inc. | |
| 10.2.1† | Intellectual Property Security Agreements relating to the Amended and Restated Loan and Security Agreement with Silicon Valley Bank, dated as of December 12, 2013. | |
| 10.3 | Agreement of Lease by and between the Registrant and Matana LLC, dated as of October 23, 2008. | |
| 10.3.1 | Letter Agreement, dated as of February 1, 2010, between Matana LLC and Registrant. | |
| 10.3.2 | Lease Amendment, dated as of April 1, 2011, between 50 West 23rd Street A LLC and Registrant. | |
| 10.3.3 | Second Amendment to Lease, dated as of October 14, 2013, between 50 West 23rd Street A LLC and Registrant. | |
| 10.4+† | Yodle, Inc. 2007 Equity Incentive Plan, as amended. | |
| 10.5+† | Forms of Incentive Stock Option Agreements under Yodle, Inc. 2007 Equity Incentive Plan. | |
| 10.6+† | Form of Nonqualified Stock Option Agreement under the Yodle, Inc. 2007 Equity Incentive Plan. | |
| 10.7+† | Form of 2014 Equity Incentive Plan. | |
| 10.8+† | Form of Incentive Stock Option Agreement under 2014 Equity Incentive Plan. | |
| 10.9+† | Form of Nonqualified Stock Option Agreement under 2014 Equity Incentive Plan. | |
| 10.10+† | Form of Restricted Stock Award Agreement under 2014 Equity Incentive Plan. | |
| 10.11+† | Non-Employee Director Compensation Plan to be in effect upon the completion of this offering. | |
| 10.12+† | Form of Indemnification Agreement by and between Registrant and each of its directors and executive officers. | |
| 10.13+† | 2014 Executive Bonus Plan. | |
| 10.14+† | Employment Offer Letter by and between the Registrant and Court Cunningham, dated March 19, 2007. | |
| 10.15+† | Employment Offer Letter by and between the Registrant and Eric Raab, dated March 12, 2013. | |
| 10.16+† | Employment Offer Letter by and between the Registrant and Fred Voccola, dated March 8, 2013. | |
| 10.17+† | 2013 Yodle Bonus Plan. | |
| 10.18+† | General Manager, Yodle for Brand Networks Bonus Plan. | |
| 21.1† | Subsidiaries of the Registrant. | |
| 23.1 | Consent of Deloitte & Touche LLP, independent registered public accounting firm. | |
II-4
Table of Contents
| 23.2† | Consent of Cooley LLP (included in Exhibit 5.1). | |
| 24.1 | Power of Attorney. Reference is made to the signature page hereto. | |
| 99.1 | Consent of Research Now. | |
| † | To be filed by amendment. |
| + | Indicates management contract or compensatory plan. |
| Item 17. | Undertakings. |
The undersigned Registrant hereby undertakes to provide to the underwriters at the closing specified in the underwriting agreement, certificates in such denominations and registered in such names as required by the underwriters to permit prompt delivery to each purchaser.
Insofar as indemnification for liabilities arising under the Securities Act may be permitted to directors, officers and controlling persons of the registrant pursuant to the foregoing provisions, or otherwise, the registrant has been advised that in the opinion of the Securities and Exchange Commission such indemnification is against public policy as expressed in the Securities Act and is, therefore, unenforceable. In the event that a claim for indemnification against such liabilities (other than the payment by the registrant of expenses incurred or paid by a director, officer or controlling person of the registrant in the successful defense of any action, suit or proceeding) is asserted by such director, officer or controlling person in connection with the securities being registered, the registrant will, unless in the opinion of its counsel the matter has been settled by controlling precedent, submit to a court of appropriate jurisdiction the question whether such indemnification by it is against public policy as expressed in the Securities Act and will be governed by the final adjudication of such issue.
The undersigned registrant hereby undertakes that:
(1) For purposes of determining any liability under the Securities Act, the information omitted from the form of prospectus filed as part of this Registration Statement in reliance upon Rule 430A and contained in a form of prospectus filed by the registrant pursuant to Rule 424(b)(1) or (4) or 497(h) under the Securities Act shall be deemed to be part of this Registration Statement as of the time it was declared effective.
(2) For the purpose of determining any liability under the Securities Act, each post-effective amendment that contains a form of prospectus shall be deemed to be a new registration statement relating to the securities offered therein, and the offering of such securities at that time shall be deemed to be the initial bona fide offering thereof.
II-5
Table of Contents
SIGNATURES
Pursuant to the requirements of the Securities Act, the Registrant has duly caused this Registration Statement to be signed on its behalf by the undersigned, thereunto duly authorized, in the City of New York, State of New York, on the 7th day of July, 2014.
| YODLE, INC. | ||
| By: |
/s/ Court Cunningham | |
| Court Cunningham Chief Executive Officer and Director | ||
KNOW ALL PERSONS BY THESE PRESENTS, that each person whose signature appears below hereby constitutes and appoints Court Cunningham and Michael Gordon, and each of them, his true and lawful agent, proxy and attorney-in-fact, with full power of substitution and resubstitution, for him and in his name, place and stead, in any and all capacities, to (1) act on, sign and file with the Securities and Exchange Commission any and all amendments (including post-effective amendments) to this registration statement together with all schedules and exhibits thereto and any subsequent registration statement filed pursuant to Rule 462(b) under the Securities Act of 1933, as amended, together with all schedules and exhibits thereto, (2) act on, sign and file such certificates, instruments, agreements and other documents as may be necessary or appropriate in connection therewith, (3) act on and file any supplement to any prospectus included in this registration statement or any such amendment or any subsequent registration statement filed pursuant to Rule 462(b) under the Securities Act of 1933, as amended, and (4) take any and all actions which may be necessary or appropriate to be done, as fully for all intents and purposes as he might or could do in person, hereby approving, ratifying and confirming all that such agent, proxy and attorney-in-fact or any of his substitutes may lawfully do or cause to be done by virtue thereof.
Pursuant to the requirements of the Securities Act, this Registration Statement has been signed by the following persons in the capacities and on the dates indicated.
| Signature | Title | Date | ||
| /s/ Court Cunningham Court Cunningham |
Chief Executive Officer and Director (Principal Executive Officer) |
July 7, 2014 | ||
| /s/ Michael Gordon Michael Gordon |
Chief Operating Officer, Chief Financial Officer, Treasurer and Secretary (Principal Financial Officer) |
July 7, 2014 | ||
| /s/ Ernest D’Ambrose Ernest D’Ambrose |
Chief Accounting Officer (Principal Accounting Officer) |
July 7, 2014 | ||
| /s/ Michael Adler Michael Adler |
Director |
July 7, 2014 | ||
| /s/ Rick Faulk Rick Faulk |
Director |
July 7, 2014 | ||
| /s/ Tom Mawhinney Tom Mawhinney |
Director |
July 7, 2014 | ||
| /s/ David Rubin David Rubin |
Director |
July 7, 2014 | ||
| /s/ Rob Stavis Rob Stavis |
Director |
July 7, 2014 | ||
| /s/ Andreas Stavropoulos Andreas Stavropoulos |
Director |
July 7, 2014 | ||
II-6
Table of Contents
EXHIBIT INDEX
| Exhibit Number |
Description of Document | |
| 1.1† | Form of Underwriting Agreement. | |
| 2.1 | Agreement and Plan of Merger, dated as of February 28, 2013, by and among Registrant, LH Merger Corp., Lighthouse Practice Management Group, Inc., Brian Smith and the other parties thereto. | |
| 3.1 | Fifth Amended and Restated Certificate of Incorporation, as amended and as currently in effect. | |
| 3.2† | Form of Amended and Restated Certificate of Incorporation to be effective upon completion of this offering. | |
| 3.3 | By-Laws, as currently in effect. | |
| 3.4† | Form of Amended and Restated Bylaws to be effective upon completion of this offering. | |
| 4.1† | Specimen stock certificate evidencing shares of common stock. | |
| 4.2 | Fourth Amended and Restated Investors’ Rights Agreement, dated as of February 28, 2013, by and among the Registrant and certain of its stockholders. | |
| 5.1† | Opinion of Cooley LLP as to legality. | |
| 10.1† | Loan and Security Agreement, dated as of September 9, 2013, between Rogers Communications Inc. and the Registrant, ProfitFuel, Inc. and Lighthouse Practice Management Group, Inc. | |
| 10.1.1† | Intellectual Property Security Agreements relating to the Loan and Security Agreement with Rogers Communications Inc. dated as of September 9, 2013. | |
| 10.1.2† | Subordination Agreement, dated as of September 9, 2013, between Rogers Communications Inc. and Silicon Valley Bank. | |
| 10.2† | Amended and Restated Loan and Security Agreement, dated as of December 12, 2013, between Silicon Valley Bank and the Registrant, ProfitFuel, Inc. and Lighthouse Practice Management Group, Inc. | |
| 10.2.1† | Intellectual Property Security Agreements relating to the Amended and Restated Loan and Security Agreement with Silicon Valley Bank, dated as of December 12, 2013. | |
| 10.3 | Agreement of Lease by and between the Registrant and Matana LLC, dated as of October 23, 2008. | |
| 10.3.1 | Letter Agreement, dated as of February 1, 2010, between Matana LLC and Registrant. | |
| 10.3.2 | Lease Amendment, dated as of April 1, 2011, between 50 West 23rd Street A LLC and Registrant. | |
| 10.3.3 | Second Amendment to Lease, dated as of October 14, 2013, between 50 West 23rd Street A LLC and Registrant. | |
| 10.4+† | Yodle, Inc. 2007 Equity Incentive Plan, as amended. | |
| 10.5+† | Forms of Incentive Stock Option Agreements under Yodle, Inc. 2007 Equity Incentive Plan. | |
| 10.6+† | Form of Nonqualified Stock Option Agreement under the Yodle, Inc. 2007 Equity Incentive Plan. | |
| 10.7+† | Form of 2014 Equity Incentive Plan. | |
| 10.8+† | Form of Incentive Stock Option Agreement under 2014 Equity Incentive Plan. | |
| 10.9+† | Form of Nonqualified Stock Option Agreement under 2014 Equity Incentive Plan. | |
| 10.10+† | Form of Restricted Stock Award Agreement under 2014 Equity Incentive Plan. | |
| 10.11+† | Non-Employee Director Compensation Plan to be in effect upon the completion of this offering. | |
| 10.12+† | Form of Indemnification Agreement by and between Registrant and each of its directors and executive officers. | |
| 10.13+† | 2014 Executive Bonus Plan. | |
| 10.14+† | Employment Offer Letter by and between the Registrant and Court Cunningham, dated March 19, 2007. | |
II-7
Table of Contents
| 10.15+† | Employment Offer Letter by and between the Registrant and Eric Raab, dated March 12, 2013. | |
| 10.16+† | Employment Offer Letter by and between the Registrant and Fred Voccola, dated March 8, 2013. | |
| 10.17+† | 2013 Yodle Bonus Plan. | |
| 10.18+† | General Manager, Yodle for Brand Networks Bonus Plan. | |
| 21.1† | Subsidiaries of the Registrant. | |
| 23.1 | Consent of Deloitte & Touche LLP, independent registered public accounting firm. | |
| 23.2† | Consent of Cooley LLP (included in Exhibit 5.1). | |
| 24.1 | Power of Attorney. Reference is made to the signature page hereto. | |
| 99.1 | Consent of Research Now. | |
| † | To be filed by amendment. |
| + | Indicates management contract or compensatory plan. |
II-8