Attached files
| file | filename |
|---|---|
| 8-K - 8-K - TAKE TWO INTERACTIVE SOFTWARE INC | a14-16639_18k.htm |
Exhibit 99.1
|
|
Shareholder Outreach July 2014 |

|
|
TTWO: Industry Leader We seek to be the most creative, most innovative and most efficient company in our business Our commitment to creativity and innovation enables us to consistently differentiate our products We combine leading technology with deep creative content to provide unique gameplay experiences We build compelling franchises by publishing a select number of titles for which we can create sequels and incremental revenue opportunities The talent at our wholly-owned labels, Rockstar Games and 2K, is the essential ingredient to building what we believe is the strongest portfolio of intellectual property in the business We have assembled a diversified portfolio of proprietary interactive entertainment that spans all major hardware platforms and broad consumer demographics Our intellectual property is primarily internally owned and developed, which we believe best positions us financially and competitively 2 Take-Two Interactive is a leading developer, marketer and publisher of interactive entertainment |

|
|
Track Record of Strong Shareholder Returns 3 Strong Share Price Growth: 5-Year Performance vs. Peers Leader in Shareholder Returns: 5-Year TSR vs. Peers Share price increased 38% in FY2014 Repurchased $277 million in shares in FY2014 FY2014 Achievements Peer Group UBI: Ubisoft EA: Electronic Arts ATVI: Activision TTWO: Take-Two TTWO: +162.6% |

|
|
Record Results in a Growing Industry 4 Record Financial Results in FY20141 Non-GAAP EPS Non-GAAP Net Income Non-GAAP Revenue 1083% (y-o-y) 1444% (y-o-y) 97% (y-o-y) $4.26 $510.7M $2.4B 33% CAGR (Non-GAAP Revenue) 5.1% CAGR Positioned to Capitalize on Expected Global Video Game Market Growth3 Strong Outlook for Continued Growth 2 1 See the Appendix for a discussion of Non-GAAP financial measures and cautionary statement, and a reconciliation of Non-GAAP metrics to GAAP metrics 2 FY2010 represents an unaudited pro forma 12 month period ended 31-Mar-10 3 Source: International Development Group, April 2014. Excludes hardware. |

|
|
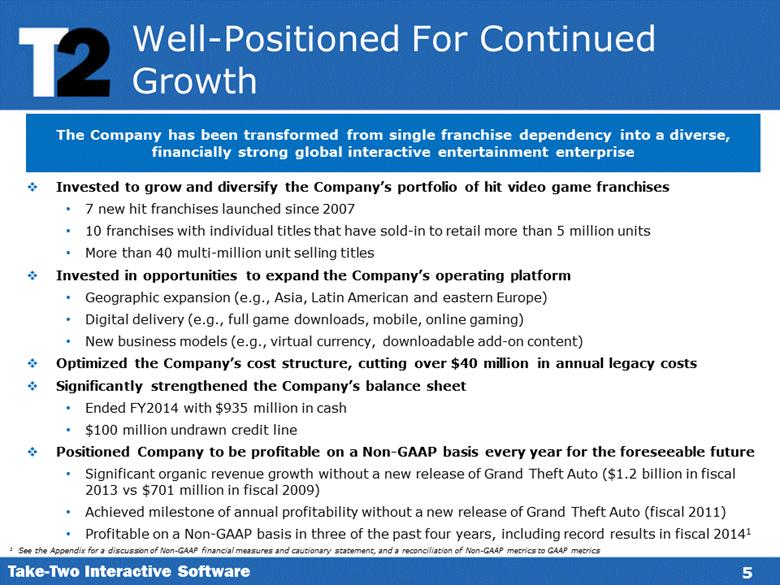
Well-Positioned For Continued Growth 5 Invested to grow and diversify the Company’s portfolio of hit video game franchises 7 new hit franchises launched since 2007 10 franchises with individual titles that have sold-in to retail more than 5 million units More than 40 multi-million unit selling titles Invested in opportunities to expand the Company’s operating platform Geographic expansion (e.g., Asia, Latin American and eastern Europe) Digital delivery (e.g., full game downloads, mobile, online gaming) New business models (e.g., virtual currency, downloadable add-on content) Optimized the Company’s cost structure, cutting over $40 million in annual legacy costs Significantly strengthened the Company’s balance sheet Ended FY2014 with $935 million in cash $100 million undrawn credit line Positioned Company to be profitable on a Non-GAAP basis every year for the foreseeable future Significant organic revenue growth without a new release of Grand Theft Auto ($1.2 billion in fiscal 2013 vs $701 million in fiscal 2009) Achieved milestone of annual profitability without a new release of Grand Theft Auto (fiscal 2011) Profitable on a Non-GAAP basis in three of the past four years, including record results in fiscal 20141 The Company has been transformed from single franchise dependency into a diverse, financially strong global interactive entertainment enterprise 1 See the Appendix for a discussion of Non-GAAP financial measures and cautionary statement, and a reconciliation of Non-GAAP metrics to GAAP metrics |
|
|
Proven Strategy Focused On Franchise Management World Class Creative Teams Compelling Interactive Entertainment Franchises Innovative Marketing Distribution Across All Relevant Platforms Emerging Platforms Traditional Retail New IP IP Launched Pre-2006 Diverse portfolio of industry-leading intellectual property Robust pipeline of the highest quality titles in development, including new IP and sequels Generating growing revenue and profits from recurrent consumer spending, including virtual currency, downloadable add-on content and online gaming 6 |

|
|
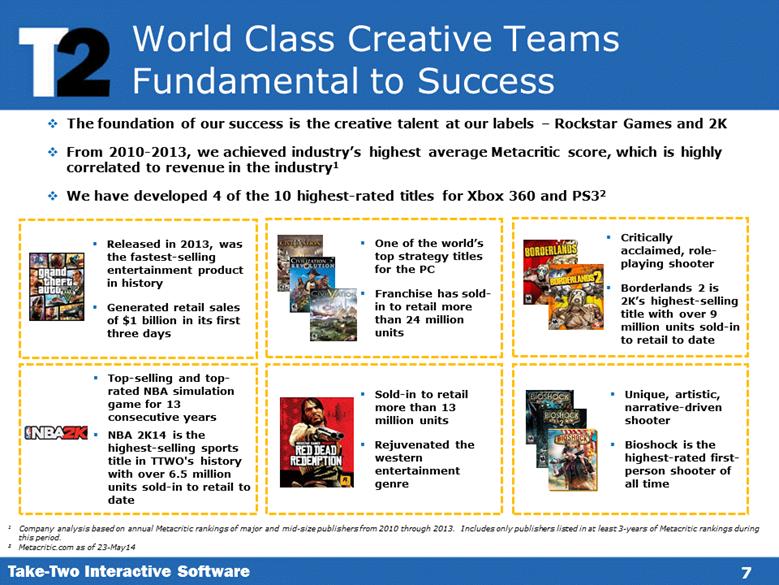
World Class Creative Teams Fundamental to Success 7 Released in 2013, was the fastest-selling entertainment product in history Generated retail sales of $1 billion in its first three days The foundation of our success is the creative talent at our labels – Rockstar Games and 2K From 2010-2013, we achieved industry’s highest average Metacritic score, which is highly correlated to revenue in the industry1 We have developed 4 of the 10 highest-rated titles for Xbox 360 and PS32 Top-selling and top-rated NBA simulation game for 13 consecutive years NBA 2K14 is the highest-selling sports title in TTWO's history with over 6.5 million units sold-in to retail to date One of the world’s top strategy titles for the PC Franchise has sold-in to retail more than 24 million units Sold-in to retail more than 13 million units Rejuvenated the western entertainment genre Critically acclaimed, role-playing shooter Borderlands 2 is 2K’s highest-selling title with over 9 million units sold-in to retail to date Unique, artistic, narrative-driven shooter Bioshock is the highest-rated first-person shooter of all time 1 Company analysis based on annual Metacritic rankings of major and mid-size publishers from 2010 through 2013. Includes only publishers listed in at least 3-years of Metacritic rankings during this period. 2 Metacritic.com as of 23-May14 |
|
|
Retaining Creative Talent Through The Use of Equity Grants 8 Retaining Key Talent is Core to Our Business We Use Equity Incentives Throughout TTWO to Motivate and Retain Key Talent Our creative employees at our wholly-owned labels drive our business, are critical to our continued success, and help us build shareholder value Almost two-thirds of our employees work in our development studios and have technical capabilities to develop software titles for multiple platforms and in multiple languages Equity is an essential tool to attract and retain highly-skilled creative talent, and it aligns the interests of our creative talent with our shareholders Equity used in FY2014 to retain key creative talent1 1 Based on number of shares granted; no equity grants to ZelnickMedia in FY2014 Awards to Rockstar Games and 2K 90% |

|
|
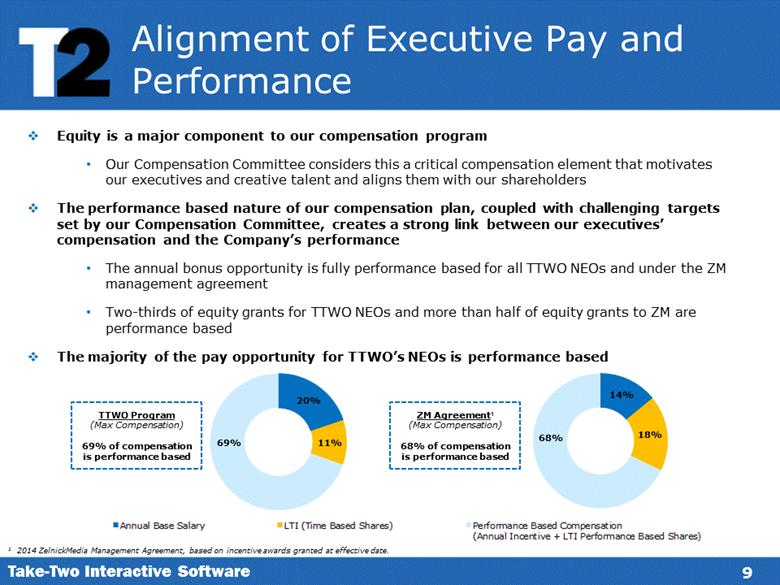
Alignment of Executive Pay and Performance 9 Equity is a major component to our compensation program Our Compensation Committee considers this a critical compensation element that motivates our executives and creative talent and aligns them with our shareholders The performance based nature of our compensation plan, coupled with challenging targets set by our Compensation Committee, creates a strong link between our executives’ compensation and the Company’s performance The annual bonus opportunity is fully performance based for all TTWO NEOs and under the ZM management agreement Two-thirds of equity grants for TTWO NEOs and more than half of equity grants to ZM are performance based The majority of the pay opportunity for TTWO’s NEOs is performance based ZM Agreement1 (Max Compensation) 68% of compensation is performance based TTWO Program (Max Compensation) 69% of compensation is performance based 1 2014 ZelnickMedia Management Agreement, based on incentive awards granted at effective date. Annual Base Salary LTI (Time Based Shares) Performance Based Compensation (Annual Incentive + LTI Performance Based Shares) |
|
|
Management of Equity To Create Shareholder Value 10 In 2011, our Board made a burn rate commitment related to our equity granting practices When presented with the opportunity to lock up key creative talent, our Board determined it was in shareholders’ best interests to execute those agreements In connection with these agreements, we made equity grants that resulted in a three-year burn rate that exceeded the commitment made in 2011 If the Board had not reached those agreements, the associated equity grants would not have been made and we would not have violated our commitment Even with the equity grants in FY2014, we more than offset the dilution created with these awards through our share repurchase action in FY2014 Our y-o-y fully diluted share count was reduced by more than 4.2 million shares in FY2014 Our Board and Compensation Committee believe these decisions are in the best interests of our shareholders We reduced our overall share count through buybacks, fostered by strong cash generation resulting from successful development and marketing by our creative and marketing employees We anticipate returning to shareholders with a request for additional shares at the 2014 annual meeting Our Board is committed to retaining key creative talent while acting in the best interests of TTWO and its shareholders |

|
|
Responsiveness to Shareholder Feedback 11 During 2013 and 2014, we engaged with our shareholders to better understand their perspectives, particularly with respect to key elements of both our ZM management agreement and our executive compensation program In response to shareholder feedback, we made significant positive changes to our overall approach to incentivizing management to drive our strategy Eliminated the EBITDA “catch-up” metric in the performance based restricted share awards Adopted a relative TSR metric in the long-term incentive program We entered into a new management agreement with ZM on terms that were more favorable to TTWO and its shareholders Introduced individual caps on the compensation payable to Zelnick (<60% of total compensation of ZM) and Slatoff (<40% of total compensation of ZM) Eliminated automatic annual fee increases Increased share ownership requirement to 5x annual fee Limited up-front equity Extended the performance measurement period for long term incentives Annual incentives determined by performance against a pre-set, objective financial metric Performance metric for annual incentive plans is Non-GAAP EBITDA Caps on annual incentive awards Majority of compensation is delivered in equity Majority of long-term incentive compensation is performance based Vesting of performance equity is based on relative TSR performance and product performance Our compensation programs are strongly aligned with shareholder interests |

|
|
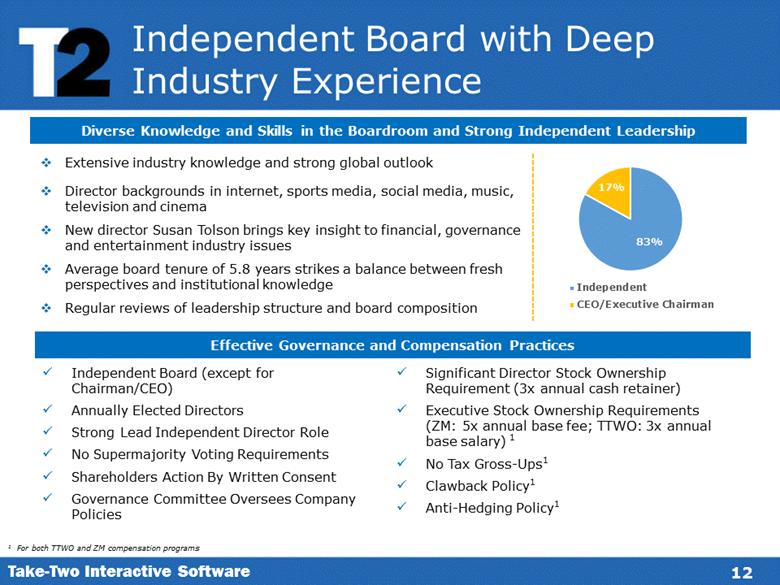
Independent Board with Deep Industry Experience 12 Extensive industry knowledge and strong global outlook Director backgrounds in internet, sports media, social media, music, television and cinema New director Susan Tolson brings key insight to financial, governance and entertainment industry issues Average board tenure of 5.8 years strikes a balance between fresh perspectives and institutional knowledge Regular reviews of leadership structure and board composition Independent Board (except for Chairman/CEO) Annually Elected Directors Strong Lead Independent Director Role No Supermajority Voting Requirements Shareholders Action By Written Consent Governance Committee Oversees Company Policies Significant Director Stock Ownership Requirement (3x annual cash retainer) Executive Stock Ownership Requirements (ZM: 5x annual base fee; TTWO: 3x annual base salary) 1 No Tax Gross-Ups1 Clawback Policy1 Anti-Hedging Policy1 Diverse Knowledge and Skills in the Boardroom and Strong Independent Leadership Effective Governance and Compensation Practices 1 For both TTWO and ZM compensation programs |
|
|
13 Appendix |

|
|
Non-GAAP Financial Measures 14 In addition to reporting its financial results in accordance with U.S. generally accepted accounting principles (GAAP), Take-Two Interactive Software, Inc. (the “Company”) uses Non-GAAP measures of financial performance. Included in this presentation are certain Non-GAAP financial measures: Non-GAAP EPS, Non-GAAP Net Income and Non-GAAP Revenue. The Company believes that these Non-GAAP financial measures, when taken into consideration with the corresponding GAAP financial measures, are important in gaining an understanding of the Company’s ongoing business. These Non-GAAP financial measures also provide for comparative results from period to period. Therefore, the Company believes it is appropriate to exclude the impact of certain items as follows: Net effect from deferral in net revenues and related cost of goods sold - the Company defers revenue and related costs from the sale of certain titles that have undelivered elements upon the sale of the game and recognizes that revenue upon the delivery of the undelivered elements. As there is no impact to the Company’s operating cash flow, management excludes the impact of deferred net revenue and related costs from its Non-GAAP financial measures when evaluating the Company's operating performance, when planning, forecasting and analyzing future periods, and when assessing the performance of its management team. In addition, we believe that these Non-GAAP financial measures provide a more timely indication of trends in our business, provide comparability with the way our business is measured by analysts, and provide consistency with industry data sources. Stock-based compensation – the Company does not consider stock-based compensation charges when evaluating business performance and management does not contemplate stock-based compensation expense in its short- and long-term operating plans. As a result, the Company has excluded such expenses from its Non-GAAP financial measures. Business reorganization, restructuring and related expenses – although the Company has incurred business reorganization expenses in the past, each charge relates to a discrete event based on a unique set of business objectives. Management does not believe these charges reflect the Company's primary business, ongoing operating results or future outlook. As such, the Company believes it is appropriate to exclude these expenses and related charges from its Non-GAAP financial measures. Non-cash amortization of discount on convertible notes – the Company records non-cash amortization of discount on convertible notes as interest expense in addition to the interest expense already recorded for coupon payments. The Company excludes the non-cash portion of the interest expense from its Non-GAAP financial measures because these amounts are unrelated to its ongoing business operations. |

|
|
Non-GAAP Financial Measures 15 Loss on extinguishment of debt – the Company recorded a loss on extinguishment of debt as a result of settling its 4.375% Convertible Notes in August 2013. The Company excludes the impact of such transactions when evaluating the Company’s operating performance. Management does not believe this loss reflects the Company's primary business, ongoing operating results or future outlook. As such, the Company believes it is appropriate to exclude this loss from its Non-GAAP financial measures. Gain on convertible note hedge and warrants, net – the Company entered into unwind agreements with respect to its convertible note hedge and warrant transactions. As a result of the unwind agreements, these transactions were accounted for as derivatives whereby gains and losses resulting from changes in the fair value were reported in gain on convertible note hedge and warrants, net. The Company excludes the impact of such transactions when evaluating the Company’s operating performance. Management does not believe these gains and losses reflect the Company's primary business, ongoing operating results or future outlook. As such, the Company believes it is appropriate to exclude these gains and losses from its Non-GAAP financial measures. Non-cash tax expense for the impact of deferred tax liabilities associated with tax deductible amortization of goodwill – due to the nature of the adjustment as well as the expectation that it will not have any cash impact in the foreseeable future, the Company believes it is appropriate to exclude this expense from its Non-GAAP financial measures. Discontinued operations – the Company does not engage in sales of subsidiaries on a regular basis and therefore believes it is appropriate to exclude such gains (losses) from its Non-GAAP financial measures. As the Company is no longer active in its discontinued operations, it believes it is appropriate to exclude income (losses) thereon from its Non-GAAP financial measures. These Non-GAAP financial measures are not intended to be considered in isolation from, as a substitute for, or superior to, GAAP results. These Non-GAAP financial measures may be different from similarly titled measures used by other companies. |

|
|
Reconciliation of GAAP to Non-GAAP Measures 16 Fiscal Year Ended March 31, 2014 Net Revenues GAAP Net Revenues $ 2,350,568 Net effect from deferral in net revenues 63,152 Non - GAAP Net Revenues $ 2,413,720 Net Income GAAP Net Income $ 361,605 Net effect from deferral in net revenues and related cost of goods sold 36,179 Stock-based compensation 78,118 Business reorganization, restructuring and related 4,490 Non - cash amortization of discount on Convertible Notes 22,801 Los s on extinguishment of debt 9,014 Gain on convertible note hedge and warrants , net (3,461) Non-cash tax expense 1,890 Discontinued operations 86 Non-GAAP Net Income $510,722 Diluted Earnings Per Share GAAP earnings per share $3.20 Non-GAAP earnings per share $4.26 Computation of Diluted GAAP EPS: Net income $361,605 Less: net income allocated to participating securities (31,397) Add: interest expense , net of tax, on Convertible Notes 33,718 Net income for dilute d EPS calculation $ 363,926 |

|
|
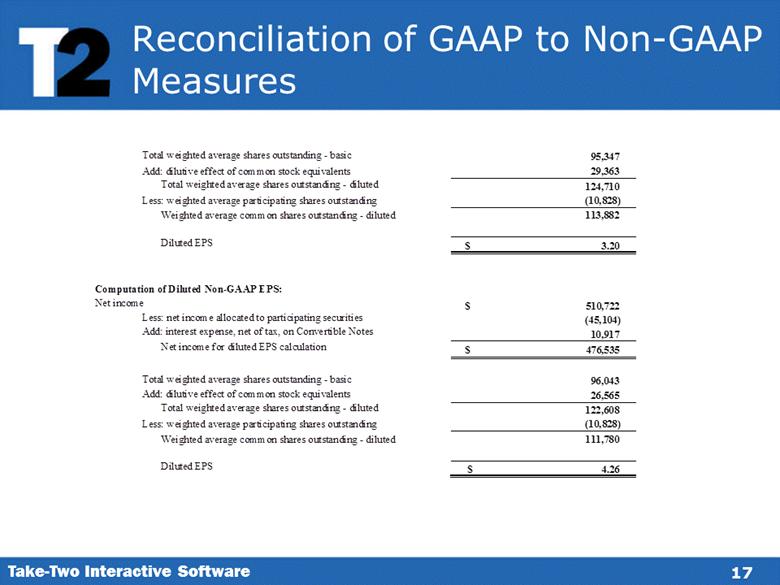
Reconciliation of GAAP to Non-GAAP Measures 17 Total weighted average shares out standing-basic 95,347 Add: dilutive effect of common stock equivalents 29,363 Tot al weighted average share sout standing-diluted 124,710 Less: weighted average participating shares outstanding (10,828) Weighted average common shares outstanding-diluted 113,882 Diluted EPS $3.20 Computation of Diluted Non-GAAP EPS: Net income $510,722 Less: ne t income allocated to participating securities (45,104) Add: interest expense, net of tax, on Convertible Notes 10,917 Net income for diluted EPS calculation $476,535 Tot al weighted average shares outstanding-basic 96,043 Add: dilutive effect of common stock equivalents 26,565 Total weighted average shares outstanding-diluted 122,608 Less: weighted average participating shares outstanding (10,828) Weighted average common shares outstanding-diluted 111,780 Diluted EPS $4.26 |
|
|
18 Take-Two Interactive Software, Inc. (the “Take-Two”) intends to file a definitive proxy statement with the Securities and Exchange Commission ("SEC") with respect to its 2014 Annual Meeting of Stockholders. Stockholders should read the definitive proxy statement carefully when it becomes available, before making any voting decision because it contains important information. Stockholders will be able to obtain that proxy statement, any amendments or supplements to that proxy statement and other documents filed by Take-Two with the SEC free of charge at the SEC's website (www.sec.gov) or at Take-Two’s website at www.take2games.com. Take-Two and its directors, executive officers and other employees may be deemed to be participants in any solicitation of proxies from Take-Two stockholders in connection with the matters to be considered at the 2014 Annual Meeting. Information about Take-Two’s directors and executive officers is available in Take-Two’s proxy statement, dated July 29, 2013, for its 2013 Annual Meeting of Stockholders. To the extent holdings of Take-Two’s securities have changed since the amounts printed in the 2013 proxy statement, such changes have been or will be reflected on Statements of Change in Ownership on Form 4 filed with the SEC. Proxy Materials |
|
|
[LOGO] |