Attached files
| file | filename |
|---|---|
| EX-99.1 - EX-99.1 - EQT RE, LLC | d749483dex991.htm |
| EX-23.2 - EX-23.2 - EQT RE, LLC | d749483dex232.htm |
| EX-10.44 - EX-10.44 - EQT RE, LLC | d749483dex1044.htm |
| EX-23.1 - EX-23.1 - EQT RE, LLC | d749483dex231.htm |
| EX-23.4 - EX-23.4 - EQT RE, LLC | d749483dex234.htm |
| EX-99.2 - EX-99.2 - EQT RE, LLC | d749483dex992.htm |
| EX-23.3 - EX-23.3 - EQT RE, LLC | d749483dex233.htm |
| EX-23.5 - EX-23.5 - EQT RE, LLC | d749483dex235.htm |
Table of Contents
Index to Financial Statements
As filed with the Securities and Exchange Commission on July 7, 2014
Registration No. 333-
UNITED STATES
SECURITIES AND EXCHANGE COMMISSION
Washington, D.C. 20549
Form S-1
REGISTRATION STATEMENT
UNDER
THE SECURITIES ACT OF 1933
RICE ENERGY INC.
(Exact name of registrant as specified in its charter)
| Delaware | 1311 | 46-3785773 | ||
| (State or other jurisdiction of incorporation or organization) |
(Primary Standard Industrial Classification Code Number) |
(IRS Employer Identification Number) |
171 Hillpointe Drive, Suite 301
Canonsburg, Pennsylvania 15317
(724) 746-6720
(Address, including zip code, and telephone number, including area code, of registrant’s principal executive offices)
Daniel J. Rice IV
Chief Executive Officer
171 Hillpointe Drive, Suite 301
Canonsburg, Pennsylvania 15317
(724) 746-6720
(Name, address, including zip code, and telephone number, including area code, of agent for service)
Copies to:
| Douglas E. McWilliams Matthew R. Pacey Vinson & Elkins L.L.P. 1001 Fannin, Suite 2500 Houston, Texas 77002 (713) 758-2222 |
Gerald M. Spedale Jason A. Rocha Baker Botts L.L.P. One Shell Plaza 910 Louisiana Street Houston, Texas 77002 (713) 229-1234 |
Approximate date of commencement of proposed sale of the securities to the public: As soon as practicable after the effective date of this Registration Statement.
If any of the securities being registered on this Form are to be offered on a delayed or continuous basis pursuant to Rule 415 under the Securities Act of 1933, check the following box: ¨
If this Form is filed to register additional securities for an offering pursuant to Rule 462(b) under the Securities Act, check the following box and list the Securities Act registration statement number of the earlier effective registration statement for the same offering. ¨
If this Form is a post-effective amendment filed pursuant to Rule 462(c) under the Securities Act, check the following box and list the Securities Act registration statement number of the earlier effective registration statement for the same offering. ¨
If this Form is a post-effective amendment filed pursuant to Rule 462(d) under the Securities Act, check the following box and list the Securities Act registration statement number of the earlier effective registration statement for the same offering. ¨
Indicate by check mark whether the registrant is a large accelerated filer, an accelerated filer, a non-accelerated filer, or a smaller reporting company. See the definitions of “large accelerated filer,” “accelerated filer” and “smaller reporting company” in Rule 12b-2 of the Exchange Act.
| Large accelerated filer | ¨ | Accelerated filer | ¨ | |||
| Non-accelerated filer | x (Do not check if a smaller reporting company) | Smaller reporting company | ¨ | |||
CALCULATION OF REGISTRATION FEE
|
| ||||||||
| Title of Each Class of Securities to be Registered |
Amount to be Registered(1) |
Proposed Maximum Offering Price Per Share(2) |
Proposed Maximum Aggregate Offering Price(2) |
Amount of Registration Fee | ||||
| Common stock, par value $0.01 per share |
23,484,433 | $29.585 | $694,786,951 | $89,489 | ||||
|
| ||||||||
|
| ||||||||
| (1) | Includes shares of common stock that may be sold to cover the exercise of an option to purchase additional shares granted to the underwriters. |
| (2) | Estimated solely for the purpose of calculating the registration fee pursuant to Rule 457(c) under the Securities Act of 1933, as amended, and based on a price of $29.585, which is the average of the high and low trading prices per share as reported by the New York Stock Exchange on July 2, 2014. |
The registrant hereby amends this registration statement on such date or dates as may be necessary to delay its effective date until the registrant shall file a further amendment which specifically states that this registration statement shall thereafter become effective in accordance with Section 8(a) of the Securities Act of 1933, as amended, or until this registration statement shall become effective on such date as the Securities and Exchange Commission, acting pursuant to said Section 8(a), may determine.
Table of Contents
Index to Financial Statements
The information in this prospectus is not complete and may be changed. We may not sell these securities until the registration statement filed with the Securities and Exchange Commission is effective. This prospectus is not an offer to sell these securities and it is not soliciting an offer to buy these securities in any state or jurisdiction where the offer or sale is not permitted.
| PROSPECTUS | Subject to Completion, dated July 7, 2014 |
20,421,246 Shares

Rice Energy Inc.
Common Stock
We are offering 7,500,000 shares and the selling stockholders identified in the prospectus are offering 12,921,246 shares of our common stock. We will not receive any proceeds from the sale of shares held by the selling stockholders. We are an “emerging growth company” and are eligible for reduced reporting requirements. Please see “Prospectus Summary—Emerging Growth Company Status.”
Our common stock is listed on the New York Stock Exchange under the symbol “RICE.” The last reported sales price of our common stock on the New York Stock Exchange on July 3, 2014 was $29.09 per share.
Investing in our common stock involves risks. See “Risk Factors” beginning on page 18 of this prospectus.
| Per Share | Total | |||||||
| Price to the public |
$ | $ | ||||||
| Underwriting discounts and commissions(1) |
$ | $ | ||||||
| Proceeds to us (before expenses) |
$ | $ | ||||||
| Proceeds to the selling stockholders |
$ | $ | ||||||
| (1) | Please read “Underwriting” for a description of all underwriting compensation payable in connection with this offering. |
Certain of the selling stockholders identified in this prospectus have granted the underwriters the option to purchase up to 3,063,187 additional shares of common stock on the same terms and conditions set forth above within 30 days from the date of this prospectus. We will not receive any of the proceeds from the sale of shares by the selling stockholders if the underwriters exercise their option to purchase 3,063,187 additional shares of common stock.
Neither the Securities and Exchange Commission nor any state securities commission has approved or disapproved of these securities or passed on the adequacy or accuracy of this prospectus. Any representation to the contrary is a criminal offense.
The underwriters expect to deliver the shares on or about , 2014.
| Goldman, Sachs & Co. | Barclays | Citigroup |
Prospectus dated , 2014
Table of Contents
Index to Financial Statements
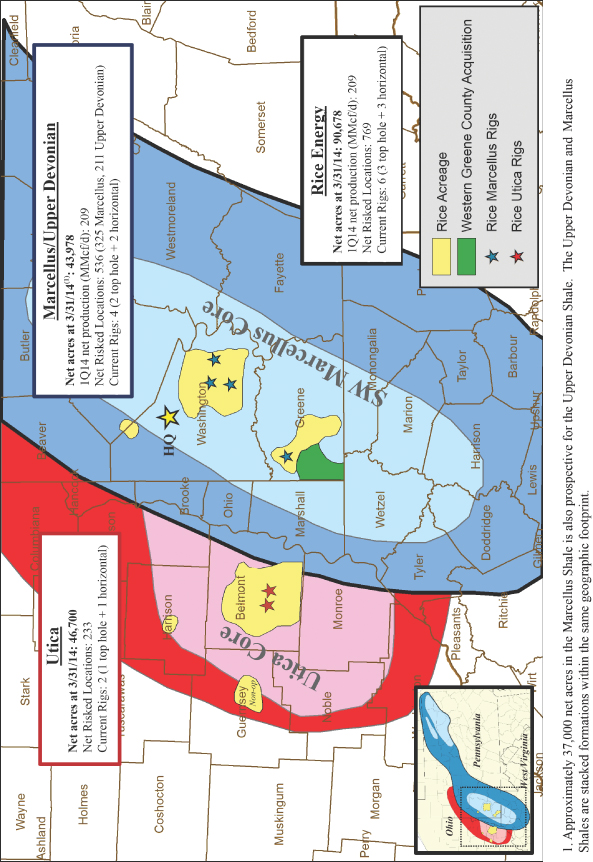
Table of Contents
Index to Financial Statements
| 1 | ||||
| 18 | ||||
| 47 | ||||
| 49 | ||||
| 50 | ||||
| 51 | ||||
| 52 | ||||
| SELECTED HISTORICAL CONSOLIDATED AND UNAUDITED PRO FORMA FINANCIAL DATA |
53 | |||
| MANAGEMENT’S DISCUSSION AND ANALYSIS OF FINANCIAL CONDITION AND RESULTS OF OPERATIONS |
55 | |||
| 82 | ||||
| 111 | ||||
| 118 | ||||
| 126 | ||||
| 128 | ||||
| 131 | ||||
| 135 | ||||
| MATERIAL U.S. FEDERAL INCOME AND ESTATE TAX CONSIDERATIONS FOR NON-U.S. HOLDERS |
137 | |||
| 141 | ||||
| 146 | ||||
| 146 | ||||
| 147 | ||||
| F-1 | ||||
| A-1 |
You should rely only on the information contained in this prospectus and any free writing prospectus prepared by us or on behalf of us or to the information which we have referred you. Neither we, the selling stockholders nor the underwriters have authorized anyone to provide you with information different from that contained in this prospectus and any free writing prospectus. We, the selling stockholders and the underwriters take no responsibility for, and can provide no assurance as to the reliability of, any other information that others may give you. We, the selling stockholders and the underwriters are offering to sell shares of common stock and seeking offers to buy shares of common stock only in jurisdictions where offers and sales are permitted. The information in this prospectus is accurate only as of the date of this prospectus, regardless of the time of delivery of this prospectus or any sale of the common stock. Our business, financial condition, results of operations and prospects may have changed since that date.
This prospectus contains forward-looking statements that are subject to a number of risks and uncertainties, many of which are beyond our control. See “Risk Factors” and “Cautionary Statement Regarding Forward-Looking Statements.”
i
Table of Contents
Index to Financial Statements
Commonly Used Defined Terms
As used in this prospectus, unless the context indicates or otherwise requires, the following terms have the following meanings:
| • | “Rice Energy,” the “Company,” “we,” “our,” “us” or like terms refer collectively to Rice Drilling B LLC and its consolidated subsidiaries before the completion of our corporate reorganization described in “Prospectus Summary—Initial Public Offering, Corporate Reorganization and Related Transactions—Corporate Reorganization” and to Rice Energy Inc. and its consolidated subsidiaries, including Rice Drilling B as of and following the completion of our corporate reorganization; |
| • | “Rice Drilling B” refers to Rice Drilling B LLC, which was our predecessor for accounting purposes, and its consolidated subsidiaries; |
| • | “Rice Partners” refers to Rice Energy Family Holdings, LP (formerly known as Rice Energy Limited Partners), an entity affiliated with members of the Rice family; |
| • | “Rice Holdings” refers to Rice Energy Holdings LLC; |
| • | “Rice Owners” refers to Rice Holdings, Rice Partners and Daniel J. Rice III; |
| • | “Rice Appalachia” refers to Rice Energy Appalachia, LLC, the parent company of our predecessor; |
| • | “Alpha Holdings” refers to Foundation PA Coal Company, LLC, a wholly owned indirect subsidiary of Alpha Natural Resources, Inc.; |
| • | “Marcellus joint venture” refers collectively to Alpha Shale Resources, LP and its general partner, Alpha Shale Holdings, LLC; |
| • | “Countrywide Energy Services” refers to Countrywide Energy Services, LLC; |
| • | “Natural Gas Partners” refers to a family of private equity investment funds organized to make direct equity investments in the energy industry, including the funds invested in us; and |
| • | “NGP Holdings” refers to NGP Rice Holdings, LLC. |
Industry and Market Data
The market data and certain other statistical information used throughout this prospectus are based on independent industry publications, government publications and other published independent sources. Some data is also based on our good faith estimates. Although we believe these third-party sources are reliable as of their respective dates, neither we, the selling stockholders nor the underwriters have independently verified the accuracy or completeness of this information. The industry in which we operate is subject to a high degree of uncertainty and risk due to a variety of factors, including those described in the section entitled “Risk Factors.” These and other factors could cause results to differ materially from those expressed in these publications.
Trademarks and Trade Names
We own or have rights to various trademarks, service marks and trade names that we use in connection with the operation of our business. This prospectus may also contain trademarks, service marks and trade names of third parties, which are the property of their respective owners. Our use or display of third parties’ trademarks, service marks, trade names or products in this prospectus is not intended to, and does not imply a relationship with, or endorsement or sponsorship by us. Solely for convenience, the trademarks, service marks and trade names referred to in this prospectus may appear without the ®, TM or SM symbols, but such references are not intended to indicate, in any way, that we will not assert, to the fullest extent under applicable law, our rights or the right of the applicable licensor to these trademarks, service marks and trade names.
ii
Table of Contents
Index to Financial Statements
Pro Forma Presentation
Unless otherwise noted, information presented in this prospectus on a pro forma basis gives effect to (i) our initial public offering and the completion of the corporate reorganization in connection with our initial public offering completed in January 2014 and the use of proceeds thereof and (ii) the consummation of our acquisition of Alpha Holdings’ 50% interest in our Marcellus joint venture (the “Marcellus JV Buy-In”) in January 2014, each as described under “Prospectus Summary—Initial Public Offering, Corporate Reorganization and Related Transactions.” Unless otherwise noted, information concerning the number of wells drilled and completed by us during historical periods is presented on a pro forma basis giving effect to the Marcellus JV Buy-In.
iii
Table of Contents
Index to Financial Statements
This summary highlights information contained elsewhere in this prospectus. You should read the entire prospectus carefully before making an investment decision, including the information under the headings “Risk Factors,” “Cautionary Statement Regarding Forward-Looking Statements” and “Management’s Discussion and Analysis of Financial Condition and Results of Operations” and the historical consolidated and unaudited pro forma financial statements and the related notes thereto appearing elsewhere in this prospectus. The estimated proved reserve information for the properties of each of us and our Marcellus joint venture contained in this prospectus are based on reserve reports relating thereto prepared by the independent petroleum engineers of Netherland, Sewell & Associates, Inc. (“NSAI”). We refer to these reports collectively as our “reserve reports.” We have provided definitions for some of the oil and natural gas industry terms used in this prospectus in the “Glossary” in Appendix A to this prospectus.
Our Company
We are an independent natural gas and oil company engaged in the acquisition, exploration and development of natural gas and oil properties in the Appalachian Basin. We are focused on creating shareholder value by identifying and assembling a portfolio of low-risk assets with attractive economic profiles and leveraging our technical and managerial expertise to deliver industry-leading results. We strive to be an early entrant into the core of a shale play by identifying what we believe to be the core of the play and aggressively executing our acquisition strategy to establish a largely contiguous acreage position. We believe we were an early identifier of the core of both the Marcellus Shale in southwestern Pennsylvania and the Utica Shale in southeastern Ohio.
All of our current and planned development is located in what we believe to be the core of the Marcellus and Utica Shales. The Marcellus Shale is one of the most prolific unconventional resource plays in the United States, and we believe the Utica Shale, based on initial drilling results, is a premier North American shale play. Together, these resource plays offer what we believe to be among the highest rate of return wells in North America. As of March 31, 2014, we held approximately 43,978 net acres in the southwestern core of the Marcellus Shale, primarily in Washington County, Pennsylvania. We established our Marcellus Shale acreage position through a combination of largely contiguous acreage acquisitions in 2009 and 2010 and through numerous bolt-on acreage acquisitions. In 2012, we acquired approximately 33,499 of our 46,700 net acres in the southeastern core of the Utica Shale, primarily in Belmont County, Ohio. We believe this area to be the core of the Utica Shale based on publicly available drilling results. We operate all of our acreage in the Marcellus Shale and a majority of our acreage in the Utica Shale.
1
Table of Contents
Index to Financial Statements
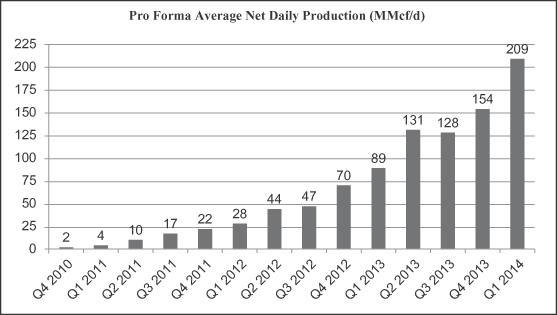
Since completing our first horizontal well in the fourth quarter of 2010, our pro forma average net daily production has grown approximately 105 times to 209 MMcf/d for the first quarter of 2014. Substantially all of our production through the first quarter of 2014 has been dry gas attributable to our operations in the Marcellus Shale. Prior to the second quarter of 2013, we ran a two-rig drilling program focused on delineating and defining the boundaries of our Marcellus Shale acreage position. In the second quarter of 2013, we shifted our operational focus from exploration to development, commencing a four-rig drilling program consisting of two rigs specifically for drilling the tophole sections of our horizontal wells and two rigs specifically for drilling the curve and lateral sections of our horizontal wells. In the first quarter of 2014, we increased to a six-rig drilling program (consisting of three tophole rigs and three horizontal rigs), two of which are operating in the Utica Shale. We expect to continue to operate a six-rig drilling program through the remainder of 2014. The following chart shows our pro forma average net daily production for each quarter since completing our first horizontal well in the Marcellus Shale.
As of March 31, 2014, we had drilled and completed 41 horizontal Marcellus wells with lateral lengths ranging from 2,444 feet to 9,147 feet and averaging 5,764 feet. Our estimated ultimate recoveries (“EUR”) from our 37 producing wells at December 31, 2013, as estimated by our independent reserve engineer, NSAI, and normalized for each 1,000 feet of horizontal lateral, range from 1.2 Bcf per 1,000 feet to 3.0 Bcf per 1,000 feet, with an average of 1.9 Bcf per 1,000 feet. As of March 31, 2014, we had 349 gross (325 net) risked drilling locations in the Marcellus Shale. For a description of our risked drilling locations, please see “Business—Our Operations—Reserve Data—Determination of Drilling Locations.” Additionally, we have drilled and completed three Upper Devonian horizontal wells on our Marcellus Shale acreage. Based on our Upper Devonian wells and those of other operators in the vicinity of our acreage as well as other geologic data, we estimate that substantially all of our Marcellus Shale acreage in Southwestern Pennsylvania is prospective for the slightly shallower Upper Devonian Shale. As of March 31, 2014, we had 211 gross (194 net) risked drilling locations in the Upper Devonian Shale.
For the Utica Shale, we applied the same shale analysis and acquisition strategy that we developed and employed in the Marcellus Shale to acquire our acreage. In June 2014 we completed our first Utica well, the
2
Table of Contents
Index to Financial Statements
Bigfoot 9H, which tested at a stabilized rate of 41.7 MMcf/d. Please see “—Recent Developments—Bigfoot 9H Test Results.” Our delineation operations are being conducted with a two-rig drilling program (one tophole rig and one horizontal rig). We intend to maintain this two-rig drilling program in the Utica Shale through 2014. In 2015, we intend to transition to a primarily development-focused strategy in the Utica Shale. As of March 31, 2014, we had 753 gross (233 net) risked drilling locations in the Utica Shale.
As of December 31, 2013, our pro forma estimated proved reserves were 602 Bcf, all of which were in southwestern Pennsylvania, with 42% proved developed and 100% natural gas. In 2014, we plan to invest $1,230.0 million in our operations (excluding acquisitions) as follows:
| • | $430.0 million for drilling and completion in the Marcellus Shale; |
| • | $150.0 million for drilling and completion in the Utica Shale; |
| • | $385.0 million for leasehold acquisitions; and |
| • | $265.0 million for midstream infrastructure development. |
This represents a 96% increase over our $629.0 million pro forma 2013 capital expenditures. Please see “Management’s Discussion and Analysis of Financial Condition and Results of Operations—Capital Resources and Liquidity.” The following table provides a summary of our net acreage, average working interest, producing wells, risked drilling locations and projected 2014 net wells online as of March 31, 2014:
| Net Acreage |
Average Working Interest |
Producing Wells |
Risked Drilling Locations(1) |
2014 Projected Net Wells Online |
||||||||||||||||||||||||
| Gross | Net | Gross | Net | |||||||||||||||||||||||||
| Marcellus Shale(2) |
43,978 | 95 | % | 41 | 38 | 349 | 325 | 37 | ||||||||||||||||||||
| Utica Shale(3) |
46,700 | 96 | % | — | — | 753 | 233 | 7 | (4) | |||||||||||||||||||
| Upper Devonian Shale(5) |
— | — | 3 | 3 | 211 | 194 | — | |||||||||||||||||||||
|
|
|
|
|
|
|
|
|
|
|
|
|
|
|
|||||||||||||||
| Total(5) |
90,678 | — | 44 | 41 | 1,313 | 752 | 44 | |||||||||||||||||||||
|
|
|
|
|
|
|
|
|
|
|
|
|
|
|
|||||||||||||||
| (1) | Based on our reserve reports as of December 31, 2013, we had 44 gross (39 net) locations in the Marcellus Shale associated with proved undeveloped reserves and 13 gross (12 net) locations in the Marcellus Shale associated with proved developed not producing reserves. Please see “Business—Our Operations—Reserve Data—Determination of Drilling Locations” for more information regarding the process and criteria through which these drilling locations were identified. The drilling locations on which we actually drill will depend on the availability of capital, regulatory approval, commodity prices, costs, actual drilling results and other factors. Please see “Risk Factors—Risks Related to Our Business—Our gross risked drilling locations are scheduled out over many years, making them susceptible to uncertainties that could materially alter the occurrence or timing of their drilling. In addition, we may not be able to raise the substantial amount of capital that would be necessary to drill our drilling locations.” |
| (2) | Excludes non-strategic properties consisting of 548 net acres in Fayette and Tioga Counties, Pennsylvania. Includes 1,338 net acres that were included as a leasehold payable on our balance sheet as of March 31, 2014. |
| (3) | Utica Shale risked drilling locations gives effect to our projected 31% working interest in the Utica Shale after applying unitization and participating interest assumptions described under “Business—Our Operations—Reserve Data—Determination of Drilling Locations.” |
| (4) | Includes wells to be drilled by Gulfport Energy Corporation. Please see “—Utica Shale—Development Agreement and Area of Mutual Interest Agreement.” |
| (5) | Approximately 39,020 gross (36,932 net) acres in the Marcellus Shale is also prospective for the Upper Devonian Shale. The Upper Devonian and the Marcellus Shale are stacked formations within the same geographic footprint. |
3
Table of Contents
Index to Financial Statements
Business Strategies
Our objective is to create shareholder value by identifying and assembling a portfolio of low-risk assets with attractive economic profiles and leveraging our technical and managerial expertise to deliver industry-leading results. We seek to achieve this objective by executing the following strategies:
| • | Pursue High-Graded Core Shale Acreage as an Early Entrant. Our acreage acquisition strategy has been predicated on our belief that core acreage provides superior production, ultimate recoveries and returns on investment. We leverage our technical expertise and analyze third-party data to be an early entrant into the core of a shale play. We develop an internally generated geologic model and then study publicly available third-party data, including well results and drilling and completion reports, to confirm our geologic model and define the core acreage position of a play. Once we believe that we have identified the core location, we aggressively execute on our acquisition strategy to establish a largely contiguous acreage position. By virtue of this strategy, we eliminate the need for large exploration programs requiring significant time and capital, and instead pursue areas that have been substantially de-risked, or high-graded, by our competitors. We have applied the expertise and approach that we employed in the Marcellus Shale to the Utica Shale, and we believe we will be able to achieve similar results. |
| • | Target Contiguous Acreage Positions in Prolific Unconventional Resource Plays. We will seek to continue to expand on our success in targeting contiguous acreage positions within the core of the Marcellus and Utica Shales. We believe a concentrated acreage position requires fewer wells and inherently less capital to define the geologic properties across the play and allows us to optimize our wellbore economics. As of March 31, 2014, we had drilled and completed 41 horizontal Marcellus wells, several of which have tested the outer boundaries of our Marcellus acreage position. Additionally, as a result of optimizing our wellbore design with a limited number of wells, we believe our ability to transition from exploration drilling to development drilling in the Marcellus Shale was accomplished with less capital invested than our peers. We intend to replicate this strategy in the Utica Shale. |
| • | Aggressively Develop Leasehold Positions to Economically Grow Production, Cash Flow and Reserves. We intend to continue to aggressively drill and develop our portfolio of 1,313 gross (752 net) pro forma risked drilling locations as of March 31, 2014 with a goal of growing production, cash flow and reserves in an economically-efficient manner. In the first quarter of 2014, we increased to a six-rig drilling program (consisting of three tophole rigs and three horizontal rigs), two of which are operating in the Utica Shale. We expect to continue to operate a six-rig drilling program through the remainder of 2014. In executing our development strategy, we intend to leverage our operational control and the expertise of our technical team to deliver attractive production and cash flow growth. As the operator of a substantial majority of our acreage in the Marcellus and Utica Shales, we are able to manage (i) the timing and level of our capital spending, (ii) our exploration and development drilling strategies and (iii) our operating costs. We will seek to optimize our wellbore economics through a meticulous focus on rig efficiency, wellbore accuracy and completion design and execution. We believe that the combination of our operational control and technical expertise will allow us to build on our track record of superior production, cash flow and reserve growth. |
| • | Maximize Pipeline Takeaway Capacity to Facilitate Production Growth. We maintain a strong commitment to construct, acquire and control the midstream infrastructure necessary to meet our production growth. We will also continue to enter into long-term firm transportation arrangements with third party midstream operators to ensure our access to market. We believe our commitment to midstream infrastructure allows us to commercialize our production more quickly and provides us with a competitive advantage in acquiring bolt-on acreage. |
4
Table of Contents
Index to Financial Statements
Competitive Strengths
We possess a number of competitive strengths that we believe will allow us to successfully execute our business strategies:
| • | Large, Contiguous Positions Concentrated in the Core of the Marcellus and Utica Shales. We own extensive and contiguous acreage positions in the core of two of the premier North American shale plays. We believe we were an early identifier of both the Marcellus Shale core in southwestern Pennsylvania and the Utica Shale core, primarily in Belmont County, Ohio, which allowed us to acquire concentrated acreage positions. Our core position and contiguous acreage in the Marcellus Shale have allowed us to delineate our position as well as produce industry-leading well results, as our wells have some of the highest initial production rates and EURs in the Marcellus Shale. Through a consolidated approach, we are able to increase rig efficiency, turning wells into sales faster, and de-risk our acreage position more efficiently. Additionally, to service our concentrated acreage positions, we construct and acquire water and midstream infrastructure, which enable us to reduce reliance on third party operators, minimize costs and increase our returns. This has been a strength in the Marcellus Shale and we believe our position in the Utica Shale will allow us to achieve similar results. |
| • | Multi-Year, Low-Risk Development Drilling Inventory. Our drilling inventory as of March 31, 2014 consisted of 1,313 gross (752 net) risked drilling locations, with 349 gross (325 net), 753 gross (233 net) and 211 gross (194 net) risked drilling locations in the Marcellus Shale, Utica Shale and Upper Devonian Shale, respectively. We believe that we and other operators in the area have substantially delineated and de-risked our contiguous acreage position in the southwestern core of the Marcellus Shale. As of March 31, 2014, we have drilled and completed 41 wells on our Marcellus Shale acreage with a 100% success rate. In June 2014 we completed our first Utica well, the Bigfoot 9H, which tested at a stabilized rate of 41.7 MMcf/d. Please see “—Recent Developments—Bigfoot 9H Test Results.” |
| • | Expertise in Unconventional Resource Plays and Technology. We have assembled a strong technical staff of shale petroleum engineers and shale geologists that have extensive experience in horizontal drilling, operating multi-rig development programs and using advanced drilling technology. We have been early adopters of new oilfield services and techniques for drilling (including rotary steerable tools) and completions (including reduced-length frac stages). In the Marcellus Shale as of March 31, 2014, we have completed 41 gross horizontal wells totaling approximately 236,000 lateral feet. We have realized improvements in our drilling efficiency over time and we are now drilling lateral sections approximately 50% longer in approximately half the time as it has taken us historically. Our average horizontal lateral drilled in 2011 was 4,733 feet and took 13.0 days to drill from kickoff to total depth. Our average horizontal lateral drilled in 2013 was 7,700 feet and took 5.8 days to drill from kickoff to total depth. Our operating proficiency has also led to increased wellbore accuracy, completion design efficiencies and has yielded top tier production results as reflected in the fact that out of approximately 550 producing horizontal Marcellus Shale wells in Washington County, Pennsylvania, we drilled and completed the top two and four of the top six wells in terms of cumulative production through June 30, 2013, as reported by Pennsylvania’s oil and gas department. Further, we are able to enhance our wellbore economics through multi-well pad drilling (one to nine wells per rig move) and long laterals targeting 6,000 to 10,000 feet. |
| • | Successful Infill Leasing Program. We have increased our acreage position in the core of the Marcellus Shale through bolt-on leases in the same targeted area. This strategy has allowed us to acquire acreage that provides additional drilling locations and/or adds horizontal feet to future wells. By implementing this strategy, we have grown our Marcellus Shale acreage position in Washington County from our initial acquisition of 642 net acres in 2009 to 43,978 net acres as of March 31, 2014. We have replicated this strategy successfully in the Utica Shale in Belmont County as well, leasing an additional 13,201 net acres as of March 31, 2014 since our initial acquisition of approximately 33,499 net acres in November 2012. We intend to continue to focus our near-term leasing program on Greene and Washington Counties in |
5
Table of Contents
Index to Financial Statements
| Pennsylvania and on Belmont County in Ohio, with the strategy of using bolt-on leases to acquire acreage that immediately increases our drilling locations and/or drillable horizontal feet. |
| • | Access to Committed Takeaway Capacity. Our gas gathering pipeline system is currently designed to handle up to approximately 1.5 Bcf/d in the aggregate and, as of March 31, 2014, has an operating capacity of approximately 620 MMcf/d in the aggregate. This system connects our producing wells to multiple interstate transmission and other third-party pipelines. We plan to continue to build out our Pennsylvania gathering system congruent with our future development plans. We plan to replicate our strategy of constructing and controlling our own midstream system in Ohio and expect to have our gathering system in Belmont County substantially complete by the second quarter of 2015. We believe our commitment to constructing and controlling midstream assets allows us to efficiently bring wells online, mitigates the risk of unplanned shut-ins and creates pricing and transportation optionality by connecting to multiple interstate pipelines. To further ensure the deliverability of our Utica Shale production, we have entered into a precedent agreement for 175,000 MMBtu/d firm transportation on the Rockies Express Pipeline beginning in June 2015 for a term of 20 years, which will provide us with greater access to Gulf Coast and Midwest markets. With this capacity, our firm transportation and firm sales portfolio will cover approximately 818,000 MMBtu/d in 2015 and 921,000 MMBtu/d in 2016. By securing firm transportation and firm sales contracts, we are better able to accommodate our growing production and manage basis differentials. |
| • | Significant Liquidity and Active Hedging Program. As of March 31, 2014, we had cash on hand of approximately $228.7 million and as of May 31, 2014, we had availability under our revolving credit facility of approximately $313.5 million. We believe this liquidity, along with our cash flow from operations, is sufficient to execute our current capital program. Additionally, our hedging program mitigates commodity price volatility and protects our future cash flows. We review our hedge position on an ongoing basis, taking into account our current and forecasted production volumes and commodity prices. As of May 1, 2014, we had entered into hedging contracts covering approximately 57 Bcf (207 MMcf/d) of natural gas production for April 2014 through December 2014 at a weighted average index floor price of $4.06 per MMBtu. Furthermore, as of May 1, 2014, we had entered into hedging contracts covering approximately 59.1 Bcf (162 MMcf/d) of natural gas production for 2015 at a weighted average index floor price of $4.05 per MMBtu. |
| • | Proven and Stockholder-Aligned Management Team. Our management team possesses extensive oil and natural gas acquisition, exploration and development expertise in shale plays. For a discussion of our management’s experience, please read “Management.” Our Chief Executive Officer, Chief Operating Officer, Vice President of Exploration & Geology and Vice President of Drilling have worked for us since we drilled our first horizontal Marcellus well. Our management team includes certain members of the Rice family (the founders of Rice Partners) who, along with other members of the management team, are also highly aligned with stockholders through a 31.3% economic interest in us after giving effect to this offering. In addition, our management team has a significant indirect economic interest in us through their ownership of incentive units in the form of interests in Rice Holdings and NGP Holdings. The value of these incentive units may increase over time, without diluting public investors, if our stock price appreciates in the future. For additional information regarding our incentive units, please read “Executive Compensation—Narrative Description to the Summary Compensation Table for the 2013 Fiscal Year—Long-Term Incentive Compensation.” We believe that our management team’s direct and indirect ownership interest in us will provide significant incentives to grow the value of our business. |
Initial Public Offering, Corporate Reorganization and Related Transactions
Initial Public Offering
On January 29, 2014, we completed our initial public offering (“IPO”) of 50,000,000 shares of our common stock, which included 30,000,000 shares sold by us and 20,000,000 shares sold by NGP Holdings.
6
Table of Contents
Index to Financial Statements
The net proceeds of our IPO, based on the public offering price of $21.00 per share, were approximately $993.5 million, which resulted in net proceeds to us of $593.6 million after deducting expenses and underwriting discounts and commissions of approximately $36.4 million and net proceeds to the selling stockholders of approximately $399.0 million after deducting underwriting discounts of approximately $21.0 million. We did not receive any proceeds from the sale of the shares by the selling stockholder. A portion of the net proceeds from our IPO were used to repay all outstanding borrowings under the revolving credit facility of our Marcellus joint venture, to make a $100.0 million payment to Alpha Holdings in partial consideration for the Marcellus JV Buy-In and to repay all outstanding borrowings under our revolving credit facility. The remainder of the net proceeds from our IPO are being used to fund a portion of our capital expenditure plan.
Corporate Reorganization
A corporate reorganization occurred concurrently with the completion of our IPO on January 29, 2014. As a part of this corporate reorganization, we acquired all of the outstanding membership interests in Rice Appalachia in exchange for shares of our common stock. Our business continues to be conducted through Rice Drilling B, as a wholly owned subsidiary. As of January 29, 2014, upon (a) the completion of the IPO, (b) the issuance of (i) 43,452,550 shares of common stock to NGP Holdings, (ii) 20,300,923 shares of common stock to Rice Holdings, (iii) 2,356,844 shares of common stock to Daniel J. Rice III, (iv) 20,000,000 shares of common stock to Rice Partners, (v) 160,831 shares of common stock to the persons holding incentive units representing interests in Rice Appalachia and (vi) 1,728,852 shares of common stock to the members of Rice Drilling B (other than Rice Appalachia), each of which were issued by us in connection with the closing of the IPO, and (c) the issuance of 9,523,810 shares of common stock to Alpha Holdings in connection with the completion of the Marcellus JV Buy-In described below under “—Marcellus JV Buy-In,” we had 127,523,810 shares of common stock outstanding.
Marcellus JV Buy-In
On January 29, 2014, in connection with the closing of the IPO and pursuant to the Transaction Agreement between us and Alpha Holdings dated as of December 6, 2013 (the “Transaction Agreement”), we completed our acquisition of Alpha Holdings’ 50% interest in our Marcellus joint venture in exchange for total consideration of $322 million, consisting of $100 million of cash and our issuance to Alpha Holdings of 9,523,810 shares of our common stock.
Recent Developments
Western Greene County Acquisition
On July 7, 2014, we announced our signing of a definitive purchase and sale agreement to acquire approximately 22,000 net acres and 12 developed Marcellus wells in western Greene County, Pennsylvania from Chesapeake Appalachia, L.L.C. and its partners for approximately $336 million (the “Greene County Acquisition”). We expect to close the transaction in August 2014, subject to customary closing conditions, with an effective date of February 1, 2014.
Upon completion of the Greene County Acquisition, the acquired properties are expected to:
| • | represent a 24% increase in our aggregate net acreage position and a 50% increase in our net acreage position in the core of the Marcellus Shale in southwestern Pennsylvania, each as of March 31, 2014; |
| • | add approximately 152 risked (190 unrisked) net drilling locations with an assumed 7,000’ average lateral length, representing a 47% increase to our Marcellus inventory of 325 net risked locations as of March 31, 2014; |
7
Table of Contents
Index to Financial Statements
| • | be 100% operated (average 95% working interest) with anticipated production being 1,080-1,100 Btu gas; and |
| • | add 20 MMcf/d current net production from seven producing wells, with five additional wells in progress. |
The acquired acreage will be dedicated to Access Midstream Partners. While the terms of the gas gathering agreement remain subject to negotiation, we expect the service fees will remain in line with historical rates of $0.45 per MMBtu for gathering and $0.12 per MMBtu for compression.
This offering is not contingent on the successful completion of the Greene County Acquisition. There can be no assurance that the Greene County Acquisition will close in the anticipated time frame or at all, or that we will realize the expected benefit from the Greene County Acquisition. See “Risk Factors—Risks Related to the Greene County Acquisition.”
Utica Update
On June 2, 2014, we announced the production test results of our first operated Utica Shale well, the Bigfoot 9H. After five days of flowback, the Bigfoot 9H stabilized at a rate of 41.7 MMcf/d of gas on a 33/64” choke with flowing casing pressures of 5,850 psi. Based upon a gas composition analysis, the heat content is 1,086 Btu and therefore will not require processing. We own an approximate 93% working interest in the well, which has an effective lateral length of 6,957 feet and was completed with 40 frac stages. First production from the Bigfoot 9H well was delivered into sales in late June 2014. In addition, in June 2014, we drilled and cased our second and third Utica Shale wells, the Blue Thunder 10H and 12H. We are in the process of completing both of these wells, each with lateral lengths of approximately 9,000 feet.
Senior Notes Offering
On April 25, 2014, we offered $900.0 million (the “Senior Notes Offering”) in aggregate principal amount of 6.25% senior notes due 2022 (the “Notes”) in a private placement to eligible purchasers under Rule 144A and Regulation S of the Securities Act, which resulted in net proceeds of $882.7 million after deducting estimated expenses and underwriting discounts and commissions of approximately $17.3 million. We used $301.8 million of the net proceeds to repay and retire our Second Lien Term Loan Facility, and the remainder of the proceeds will be used to fund a portion of our 2014 capital expenditure program.
Momentum Acquisition
On April 17, 2014, we completed an acquisition of certain gas gathering assets in eastern Washington and Greene Counties (the “Momentum Acquisition”) for aggregate consideration of approximately $110.0 million. The effective date for the Momentum Acquisition is March 1, 2014. We funded the acquisition with cash on hand.
The properties acquired in the Momentum Acquisition consist of a 28-mile, 6”-16” gathering system in eastern Washington County, Pennsylvania, and permits and rights of way in Washington and Greene Counties, Pennsylvania, necessary to construct an 18-mile, 30” gathering system connecting the northern system to the Texas Eastern pipeline. The northern system is supported by long-term contracts with acreage dedications covering approximately 20,000 acres from third parties. Once fully constructed, the acquired systems are expected to have an aggregate capacity of over 1 bcf of natural gas per day.
Third Amended and Restated Senior Secured Revolving Credit Facility
On April 10, 2014, we, as borrower, and Rice Drilling B, as predecessor borrower, entered into the Third Amended and Restated Credit Agreement (the “Third Amended and Restated Credit Agreement”). Among other
8
Table of Contents
Index to Financial Statements
things, in connection with the Third Amended and Restated Credit Agreement, Rice Drilling B assigned all of its rights and obligations under the Second Amended and Restated Credit Agreement to us, and we assumed all such rights and obligations as borrower under the Third Amended and Restated Credit Agreement. Furthermore, the Third Amended and Restated Credit Agreement (i) allowed for the Senior Notes Offering (described below) and (ii) provided that we would not incur an immediate reduction in our borrowing base under the credit facility as a result of the Senior Notes Offering.
Risk Factors
Investing in our common stock involves risks that include the speculative nature of oil and natural gas exploration, competition, volatile oil and natural gas prices and other material factors. For a discussion of these risks and other considerations that could negatively affect us, including risks related to this offering and our common stock, see “Risk Factors” and “Cautionary Statement Regarding Forward-Looking Statements.”
9
Table of Contents
Index to Financial Statements
Organizational Structure
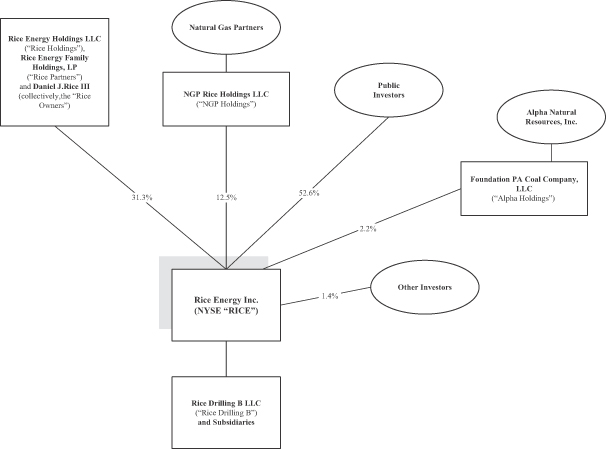
The chart below depicts our organization and ownership structure, after giving effect to this offering (excluding any exercise of the underwriters’ option to purchase additional shares).
Corporate Governance Developments
Upon the closing of this offering, Rice Holdings, Rice Partners, NGP Holdings and Alpha Natural Resources, Inc. will no longer control a majority of the voting power of our outstanding common stock, and we will no longer qualify as a “controlled company” for purposes of certain exemptions from the New York Stock Exchange (“NYSE”) listing standards. As a result, certain provisions of our amended and restated certificate of incorporation and our amended and restated bylaws will become effective upon the closing of this offering. See “Description of Capital Stock.”
Rice Drilling B was formed as a Delaware limited liability company on February 12, 2008 by members of the Rice family through Rice Partners. Natural Gas Partners, which was founded in 1988, is a family of private equity investment funds with aggregate committed capital under management since inception of $10 billion and was organized to make direct equity investments in the energy industry. Alpha Holdings is a wholly owned indirect subsidiary of Alpha Natural Resources, Inc., one of America’s premier coal suppliers operating in Northern and Central Appalachia and the Powder River Basin.
10
Table of Contents
Index to Financial Statements
Emerging Growth Company Status
We are an “emerging growth company” as defined in the Jumpstart Our Business Startups Act, or the “JOBS Act.” For as long as we are an emerging growth company, unlike other public companies that are not emerging growth companies under the JOBS Act, we are not required to:
| • | provide an auditor’s attestation report on management’s assessment of the effectiveness of our system of internal control over financial reporting pursuant to Section 404(b) of the Sarbanes-Oxley Act of 2002; |
| • | comply with any new requirements adopted by the Public Company Accounting Oversight Board, or the “PCAOB,” requiring mandatory audit firm rotation or a supplement to the auditor’s report in which the auditor would be required to provide additional information about the audit and the financial statements of the issuer; |
| • | provide certain disclosure regarding executive compensation required of larger public companies or hold shareholder advisory votes on executive compensation required by the Dodd-Frank Wall Street Reform and Consumer Protection Act (the “Dodd-Frank Act”); or |
| • | obtain shareholder approval of any golden parachute payments not previously approved. |
We will cease to be an “emerging growth company” upon the earliest of:
| • | the last day of the fiscal year in which we have $1.0 billion or more in annual revenues; |
| • | the date on which we become a “large accelerated filer” (the fiscal year-end on which the total market value of our common equity securities held by non-affiliates is $700 million or more as of June 30); |
| • | the date on which we issue more than $1.0 billion of non-convertible debt over a three-year period; or |
| • | the last day of the fiscal year following the fifth anniversary of our IPO. |
In addition, Section 107 of the JOBS Act provides that an emerging growth company can take advantage of the extended transition period provided in Section 7(a)(2)(B) of the Securities Act of 1933, as amended, or the “Securities Act,” for complying with new or revised accounting standards, but we have irrevocably opted out of the extended transition period and, as a result, we will adopt new or revised accounting standards on the relevant dates in which adoption of such standards is required for other public companies.
Corporate Information
Our principal executive offices are located at 171 Hillpointe Drive, Suite 301, Canonsburg, Pennsylvania 15317, and our telephone number is (724) 746-6720. Our website is www.riceenergy.com. Information contained on our website or any other website is not incorporated by reference herein and does not constitute a part of this prospectus.
11
Table of Contents
Index to Financial Statements
The Offering
| Shares of common stock offered by us |
7,500,000 shares. |
| Shares of common stock offered by the selling stockholders |
12,921,246 shares (or 15,984,433 shares, if the underwriters exercise in full their option to purchase additional shares). |
| Shares of common stock to be outstanding after the offering |
136,154,526 shares. |
| Option to purchase additional shares |
Certain of the selling stockholders have granted the underwriters a 30-day option to purchase up to an aggregate of 3,063,187 additional shares of our common stock. |
| Use of proceeds |
We expect to receive approximately $ million of net proceeds from the sale of the common stock offered by us after deducting underwriting discounts and commissions and estimated offering expenses payable by us. |
| We intend to use the net proceeds from this offering to fund a portion of the purchase price for our Greene County Acquisition, with the remainder to be funded with cash on hand. Please read “Use of Proceeds.” |
| This offering is not contingent on the completion of the Greene County Acquisition. In the event the Greene County Acquisition is not successfully completed we will use the net proceeds of this offering for general corporate purposes, including capital expenditures. |
| We will not receive any proceeds from the sale of shares of common stock by the selling stockholders. The selling stockholders are deemed under federal securities laws to be underwriters with respect to the common stock they may sell in connection with this offering. |
| Dividend policy |
We do not anticipate paying any cash dividends on our common stock. In addition, certain of our debt instruments place restrictions on our ability to pay cash dividends. See “Dividend Policy.” |
| Risk factors |
You should carefully read and consider the information set forth under the heading “Risk Factors” and all other information set forth in this prospectus before deciding to invest in our common stock. |
| Listing and trading symbol |
Our common stock is listed in the New York Stock Exchange (“NYSE”) under the symbol “RICE.” |
12
Table of Contents
Index to Financial Statements
SUMMARY HISTORICAL CONSOLIDATED AND UNAUDITED PRO FORMA FINANCIAL DATA
The following table shows summary unaudited pro forma financial data for the periods and as of the dates indicated. Our historical results are not necessarily indicative of future operating results. The summary financial data presented below are qualified in their entirety by reference to, and should be read in conjunction with, “Capitalization,” “Management’s Discussion and Analysis of Financial Condition and Results of Operations” and our consolidated historical and pro forma financial statements and related notes included elsewhere herein.
The summary unaudited pro forma consolidated statement of operations data for the year ended December 31, 2013 and three months ended March 31, 2014 has been prepared to give pro forma effect to (i) the completion of the corporate reorganization in connection with our IPO completed in January 2014, (ii) the Marcellus JV Buy-In and (iii) our IPO and the application of the net proceeds therefrom as if each had been completed as of January 1, 2013. The summary unaudited pro forma consolidated balance sheet data as of December 31, 2013 has been prepared to give pro forma effect to those transactions as if they had been completed as of December 31, 2013. Each of our IPO, the corporate reorganization in connection with our IPO and the Marcellus JV Buy-In was completed prior to March 31, 2014 and is thus fully reflected in our historical consolidated balance sheet as of such date. The summary unaudited pro forma consolidated statements of operations data do not give pro forma effect to this offering, the Momentum Acquisition, the Senior Notes Offering or the pending Greene County Acquisition. These data are subject and give effect to the assumptions and adjustments described in the notes accompanying the unaudited pro forma financial statements included elsewhere in this prospectus. The summary unaudited pro forma consolidated financial data are presented for informational purposes only and should not be considered indicative of actual results of operations that would have been achieved had the reorganization transactions and this offering been consummated on the dates indicated, and do not purport to be indicative of statements of financial position or results of operations as of any future date or for any future period.
| Rice Energy Inc. | ||||||||
| Pro Forma | ||||||||
| Year Ended December 31, 2013 |
Three Months Ended March 31, 2014 |
|||||||
| (in thousands, except per share data) | (unaudited) | |||||||
| Statement of Operations Data: | ||||||||
| Revenues: |
||||||||
| Natural gas sales |
$ | 178,524 | $ | 102,402 | ||||
| Other revenue |
757 | — | ||||||
|
|
|
|
|
|||||
| Total revenues |
179,281 | 102,402 | ||||||
| Operating expenses: |
||||||||
| Lease operating |
16,502 | 5,607 | ||||||
| Gathering, compression and transportation |
25,437 | 8,520 | ||||||
| Production taxes and impact fees |
2,887 | 708 | ||||||
| Exploration |
9,951 | 486 | ||||||
| Restricted unit expense |
32,906 | 73,802 | ||||||
| General and administrative |
20,209 | 11,593 | ||||||
| Depreciation, depletion and amortization |
71,886 | 28,363 | ||||||
| Write-down of abandoned leases |
146 | — | ||||||
| Loss from sale of interest in gas properties |
4,230 | — | ||||||
|
|
|
|
|
|||||
| Total operating expenses |
184,154 | 129,079 | ||||||
|
|
|
|
|
|||||
13
Table of Contents
Index to Financial Statements
| Rice Energy Inc. | ||||||||
| Pro Forma | ||||||||
| Year Ended December 31, 2013 |
Three Months Ended March 31, 2014 |
|||||||
| (in thousands, except per share data) | (unaudited) | |||||||
| Operating loss |
(4,873 | ) | (26,677 | ) | ||||
| Interest expense |
(16,422 | ) | (7,277 | ) | ||||
| Gain on purchase of Marcellus joint venture |
— | 200,923 | ||||||
| Other income (expense) |
(1,153 | ) | 602 | |||||
| Gain (loss) on derivative instruments |
10,238 | (32,571 | ) | |||||
| Amortization of deferred financing costs |
(5,394 | ) | (504 | ) | ||||
| Loss on extinguishment of debt |
(10,622 | ) | (143 | ) | ||||
| Write-off of deferred financing costs |
— | (836 | ) | |||||
| Equity in income of joint ventures |
90 | — | ||||||
|
|
|
|
|
|||||
| Loss before income taxes |
(28,136 | ) | 133,517 | |||||
| Income tax benefit |
11,674 | (9,375 | ) | |||||
|
|
|
|
|
|||||
| Net income (loss) |
$ | (16,462 | ) | $ | 124,142 | |||
|
|
|
|
|
|||||
| Balance sheet data (at period end): |
||||||||
| Cash |
$ | 347,011 | ||||||
| Total property and equipment, net |
1,054,414 | |||||||
| Total assets |
1,845,650 | |||||||
| Total debt |
311,942 | |||||||
| Total members’ capital |
1,134,241 | |||||||
| Net cash provided by (used in): |
||||||||
| Operating activities |
||||||||
| Investing activities |
||||||||
| Financing activities |
||||||||
| Other financial data (unaudited): |
||||||||
| Adjusted EBITDAX(1) |
$ | 107,773 | $ | 64,803 | ||||
| Earnings per share—basic |
(0.13 | ) | 1.00 | |||||
| Earnings per share—diluted |
(0.13 | ) | 0.99 | |||||
| (1) | Adjusted EBITDAX is a non-GAAP financial measure. For a definition of Adjusted EBITDAX and a reconciliation of Adjusted EBITDAX to net income (loss), see “—Non-GAAP Financial Measure” below. |
Non-GAAP Financial Measure
Adjusted EBITDAX is a supplemental non-GAAP financial measure that is used by management and external users of our consolidated financial statements, such as industry analysts, investors, lenders and rating agencies.
We define Adjusted EBITDAX as net income (loss) before interest expense or interest income; income taxes; write-down of abandoned leases; depreciation, depletion and amortization; amortization of deferred financing costs; equity in (income) loss in joint ventures; derivative fair value (gain) loss, excluding net cash receipts on settled derivative instruments; non-cash compensation expense; (gain) loss from sale of interest in gas properties; (gain) loss on acquisition; (gain) loss on extinguishment of debt; write-off of deferred financing costs and exploration expenses. Adjusted EBITDAX is not a measure of net income as determined by United States generally accepted accounting principles, or GAAP.
14
Table of Contents
Index to Financial Statements
Management believes Adjusted EBITDAX is useful because it allows them to more effectively evaluate our operating performance and compare the results of our operations from period to period and against our peers without regard to our financing methods or capital structure. We exclude the items listed above from net income in arriving at Adjusted EBITDAX because these amounts can vary substantially from company to company within our industry depending upon accounting methods and book values of assets, capital structures and the method by which the assets were acquired. Adjusted EBITDAX should not be considered as an alternative to, or more meaningful than, net income as determined in accordance with GAAP or as an indicator of our operating performance or liquidity. Certain items excluded from Adjusted EBITDAX are significant components in understanding and assessing a company’s financial performance, such as a company’s cost of capital and tax structure, as well as the historic costs of depreciable assets, none of which are components of Adjusted EBITDAX. Our computations of Adjusted EBITDAX may not be comparable to other similarly titled measures of other companies. We believe that Adjusted EBITDAX is a widely followed measure of operating performance and may also be used by investors to measure our ability to meet debt service requirements.
The following tables present a reconciliation of the non-GAAP financial measure of Adjusted EBITDAX to the GAAP financial measure of net income (loss).
| Rice Energy Inc. | ||||||||
| Pro Forma | ||||||||
| Year Ended December 31, 2013 |
Three Months Ended March 31, 2014 |
|||||||
| (in thousands) | (unaudited) | |||||||
| Adjusted EBITDAX reconciliation to net income (loss): |
||||||||
| Net income (loss) |
$ | (16,462 | ) | $ | 124,142 | |||
| Interest expense |
16,422 | 7,277 | ||||||
| Depreciation, depletion and amortization |
71,886 | 28,363 | ||||||
| Amortization of deferred financing costs |
5,394 | 504 | ||||||
| Equity in (income) loss of joint ventures |
(90 | ) | — | |||||
| Write-down of abandoned leases |
146 | — | ||||||
| Derivative fair value (gain) loss(1) |
(10,238 | ) | 32,571 | |||||
| Net cash receipts (payments) on settled derivative instruments(1) |
5,302 | (11,773 | ) | |||||
| Restricted unit expense |
32,906 | 73,802 | ||||||
| Income tax benefit |
(11,674 | ) | 9,375 | |||||
| Loss from sale of interest in gas properties |
4,230 | — | ||||||
| Gain on acquisition(2) |
— | (200,923 | ) | |||||
| Loss on extinguishment of debt |
— | 143 | ||||||
| Write-off of deferred financing costs |
— | 836 | ||||||
| Exploration expenses |
9,951 | 486 | ||||||
|
|
|
|
|
|||||
| Adjusted EBITDAX |
$ | 107,773 | $ | 64,803 | ||||
|
|
|
|
|
|||||
| (1) | The adjustments for the derivative fair value (gains) losses and net cash receipts on settled commodity derivative instruments have the effect of adjusting net income (loss) for changes in the fair value of derivative instruments, which are recognized at the end of each accounting period because we do not designate commodity derivative instruments as accounting hedges. This results in reflecting commodity derivative gains and losses within Adjusted EBITDAX on a cash basis during the period the derivatives settled. |
| (2) | Represents gain recognized in connection with Marcellus JV Buy-In. |
15
Table of Contents
Index to Financial Statements
SUMMARY PRO FORMA RESERVE AND OPERATING DATA
Summary Reserve Data
The following table summarizes our pro forma estimated proved reserves as of December 31, 2013, giving effect to our Marcellus JV Buy-In described under “—Initial Public Offering, Corporate Reorganization and Related Transactions—Marcellus JV Buy-In.” The estimated proved reserves as of December 31, 2013 are based on reports prepared by our and our Marcellus joint venture’s independent reserve engineers, NSAI. See “Business—Our Operations—Reserve Data—Preparation of Reserve Estimates” for definitions of proved reserves and the technologies and economic data used in their estimation.
The information in the following table does not give any effect to or reflect our commodity hedges. See “Business—Our Operations—Reserve Data” for more information about our reserves.
| Rice Energy Inc. Pro Forma(1) At December 31, |
||||
| 2013 | ||||
| (Unaudited) | ||||
| Estimated proved reserves—Natural gas (Bcf): |
||||
| Total estimated proved reserves |
602 | |||
| Total proved developed reserves |
250 | |||
| Proved developed producing reserves |
177 | |||
| Proved developed non-producing reserves |
73 | |||
| Proved undeveloped reserves |
352 | |||
| Percent developed reserves |
42 | % | ||
| (1) | Our estimated pro forma proved reserves were determined using a 12-month average price for natural gas. The prices used in our reserve reports yield weighted average wellhead prices, which are based on index prices and adjusted for energy content, transportation fees and regional price differentials. The index prices and the equivalent wellhead prices are shown in the table below. |
| Index Prices—Natural Gas (per MMBtu) |
Weighted Average Wellhead Prices— Natural Gas (per Mcf) |
|||||||
| December 31, 2013 |
3.67 | 3.90 | ||||||
16
Table of Contents
Index to Financial Statements
Production, Revenues and Price History
The following table sets forth information regarding production, revenues and realized prices, and production costs on a pro forma basis for the year ended December 31, 2013 and three months ended March 31, 2014.
| Rice Energy Inc. | ||||||||
| Pro Forma | ||||||||
| Year Ended December 31, 2013 |
Three Months Ended March 31, 2014 |
|||||||
| (unaudited) | ||||||||
| Natural gas sales (in thousands) |
$ | 178,525 | $ | 102,402 | ||||
| Production data (MMcf) (unaudited) |
45,881 | 18,801 | ||||||
| Average prices before effects of hedges per Mcf |
$ | 3.89 | 5.45 | |||||
| Average realized prices after effects of hedges per Mcf(1) |
$ | 4.01 | 4.82 | |||||
| Average costs per Mcf(2) |
||||||||
| Lease operating |
$ | 0.36 | 0.30 | |||||
| Gathering, compression and transportation |
0.55 | 0.45 | ||||||
| General and administrative |
0.44 | 0.62 | ||||||
| Depletion, depreciation and amortization |
1.57 | 1.51 | ||||||
| (1) | The effect of hedges includes realized gains and losses on commodity derivative transactions. |
| (2) | Does not include production taxes and impact fees. Please see “Management’s Discussion and Analysis of Financial Condition and Results of Operations—Principal Components of our Cost Structure.” |
17
Table of Contents
Index to Financial Statements
Investing in our common stock involves risks. You should carefully consider the information in this prospectus, including the matters addressed under “Cautionary Statement Regarding Forward-Looking Statements,” and the following risks before making an investment decision. The trading price of our common stock could decline due to any of these risks, and you may lose all or part of your investment.
Risks Related to the Greene County Acquisition
We may not be able to consummate our pending Greene County Acquisition, which could adversely affect our results of operations and cash flows.
The purchase agreement related to the pending Greene County Acquisition contains customary closing conditions. It is possible that one or more closing conditions may not be satisfied or, if not satisfied, that such condition may not be waived by the other party. If we are unable to consummate the pending Greene County Acquisition, we would not realize the expected benefits of the proposed acquisition.
There can be no assurance that the Greene County Acquisition will be completed within the anticipated time frame, or at all, or that the anticipated benefits of the Greene County Acquisition will be realized. In addition, the closing of the Greene County Acquisition is not conditioned on the closing of this offering, and this offering is not conditioned on the closing of the Greene County Acquisition.
We may be unable to make attractive acquisitions or successfully integrate acquired businesses, including the Greene County Acquisition, and any inability to do so may disrupt our business and hinder our ability to grow.
In the future we may make acquisitions of businesses that complement or expand our current business. However, we may not be able to identify attractive acquisition opportunities. Even if we do identify attractive acquisition opportunities, we may not be able to complete the acquisition or do so on commercially acceptable terms.
The success of any completed acquisition, including the Greene County Acquisition, will depend on our ability to integrate effectively the acquired business into our existing operations. The process of integrating acquired businesses may involve unforeseen difficulties and may require a disproportionate amount of our managerial and financial resources. In addition, possible future acquisitions may be larger and for purchase prices significantly higher than those paid for earlier acquisitions. No assurance can be given that we will be able to identify additional suitable acquisition opportunities, negotiate acceptable terms, obtain financing for acquisitions on acceptable terms or successfully acquire identified targets. Our failure to achieve consolidation savings, to integrate the acquired businesses and assets into our existing operations successfully or to minimize any unforeseen operational difficulties could have a material adverse effect on our financial condition and results of operations.
In addition, our revolving credit facility and the indenture governing our Notes impose certain limitations on our ability to enter into mergers or combination transactions. Our revolving credit facility and the indenture governing our Notes also limit our ability to incur certain indebtedness, which could indirectly limit our ability to engage in acquisitions of businesses.
18
Table of Contents
Index to Financial Statements
We may be subject to risks in connection with acquisitions of properties, such as the Greene County Acquisition.
The successful acquisition of producing and undeveloped properties, such as those acquired in connection with the Greene County Acquisition, requires an assessment of several factors, including:
| • | recoverable reserves; |
| • | future natural gas, NGL or oil prices and their applicable differentials; |
| • | operating costs; and |
| • | potential environmental and other liabilities. |
The accuracy of these assessments is inherently uncertain. For example, the acreage to be acquired in the Greene County Acquisition will be dedicated to Access Midstream Partners, and the fees for gas gathering services with respect to such acreage are subject to renegotiation. If we are unable to negotiate service fees in line with historical rates, we may not realize all of the expected benefits of the pending acquisition. In connection with these assessments, we perform a review of the subject properties that we believe to be generally consistent with industry practices. Our review may not reveal all existing or potential problems nor will it permit us to become sufficiently familiar with the properties to fully assess their deficiencies and capabilities. Inspections may not always be performed on every well, and environmental problems, such as groundwater contamination, are not necessarily observable even when an inspection is undertaken. Even when problems are identified, the seller may be unwilling or unable to provide effective contractual protection against all or part of the problems. We often are not entitled to contractual indemnification for environmental liabilities and acquire properties on an “as is” basis.
Properties we acquire may not produce as projected, and we may be unable to determine reserve potential, identify liabilities associated with the properties that we acquire or obtain protection from sellers against such liabilities.
Acquiring oil and natural gas properties requires us to assess reservoir and infrastructure characteristics, including recoverable reserves, development and operating costs and potential environmental and other liabilities. Such assessments are inexact and inherently uncertain. In connection with the assessments, we perform a review of the subject properties, but such a review will not reveal all existing or potential problems. In the course of our due diligence, we may not inspect every well or pipeline. We cannot necessarily observe structural and environmental problems, such as pipe corrosion, when an inspection is made. We may not be able to obtain contractual indemnities from the seller for liabilities created prior to our purchase of the property. We may be required to assume the risk of the physical condition of the properties in addition to the risk that the properties may not perform in accordance with our expectations.
Risks Related to Our Business
Natural gas, NGL and oil prices are volatile. A substantial or extended decline in commodity prices may adversely affect our business, financial condition or results of operations and our ability to meet our capital expenditure obligations and financial commitments.
The prices we receive for our natural gas production heavily influence, and to the extent we produce oil and NGLs in the future, the prices we receive for oil and NGL production will heavily influence, our revenue, operating results profitability, access to capital, future rate of growth and carrying value of our properties. Natural gas, NGLs and oil are commodities and, therefore, their prices are subject to wide fluctuations in response to relatively minor changes in supply and demand. Historically, the commodities market has been volatile. This market will likely continue to be volatile in the future. The prices we receive for our production,
19
Table of Contents
Index to Financial Statements
and the levels of our production, depend on numerous factors beyond our control. These factors include the following:
| • | worldwide and regional economic conditions affecting the global supply of and demand for natural gas, NGLs and oil; |
| • | the price and quantity of imports of foreign natural gas, including liquefied natural gas; |
| • | political conditions in or affecting other producing countries, including conflicts in the Middle East, Africa, South America and Russia; |
| • | the level of global exploration and production; |
| • | the level of global inventories; |
| • | prevailing prices on local price indexes in the areas in which we operate and expectations about future commodity prices; |
| • | the proximity, capacity, cost and availability of gathering and transportation facilities, and other factors that result in differentials to benchmark prices; |
| • | localized and global supply and demand fundamentals and transportation availability; |
| • | weather conditions and natural disasters; |
| • | technological advances affecting energy consumption; |
| • | the cost of exploring for, developing, producing and transporting reserves; |
| • | speculative trading in natural gas and crude oil derivative contracts; |
| • | risks associated with operating drilling rigs; |
| • | the price and availability of competitors’ supplies of natural gas and oil and alternative fuels; and |
| • | domestic, local and foreign governmental regulation and taxes. |
Furthermore, the worldwide financial and credit crisis in recent years has reduced the availability of liquidity and credit to fund the continuation and expansion of industrial business operations worldwide resulting in a slowdown in economic activity and recession in parts of the world. This has reduced worldwide demand for energy and resulted in lower natural gas, NGL and oil prices.
20
Table of Contents
Index to Financial Statements
In addition, substantially all of our natural gas production is sold to purchasers under contracts with market-based prices. The actual prices realized from the sale of natural gas differ from the quoted NYMEX Henry Hub price as a result of location differentials. Location differentials to NYMEX Henry Hub prices, also known as basis differentials, result from variances in regional natural gas prices compared to NYMEX Henry Hub prices as a result of regional supply and demand factors. We may experience differentials to NYMEX Henry Hub prices in the future, which may be material.
Lower commodity prices and negative increases in our differentials will reduce our cash flows and borrowing ability. We may be unable to obtain needed capital or financing on satisfactory terms, which could lead to a decline in our reserves as existing reserves are depleted. Lower commodity prices may also reduce the amount of natural gas, NGLs and oil that we can produce economically.
If commodity prices further decrease or our negative differentials further increase, a significant portion of our development and exploration projects could become uneconomic. This may result in our having to make significant downward adjustments to our estimated proved reserves. As a result, a substantial or extended decline in commodity prices or an increase in our negative differentials may materially and adversely affect our future business, financial condition, results of operations, liquidity or ability to finance planned capital expenditures.
Our development and exploration projects require substantial capital expenditures. We may be unable to obtain required capital or financing on satisfactory terms, which could lead to a decline in our natural gas reserves.
The natural gas industry is capital intensive. We make and expect to continue to make substantial capital expenditures for the development and acquisition of natural gas reserves. In 2014, we plan to invest $1,230.0 million in our operations (excluding acquisitions), including $430.0 million for drilling and completion in the Marcellus Shale, $150.0 million for drilling and completion in the Utica Shale, $385.0 million for leasehold acquisitions and $265.0 million for midstream infrastructure development. Our capital budget excludes acquisitions, other than leasehold acquisitions. We expect to fund our 2014 capital expenditures with cash generated by operations, borrowings under our revolving credit facility, a portion of the net proceeds of our IPO and the proceeds from our Senior Notes Offering. Our 2014 capital expenditure budget also assumes that the borrowing base under our revolving credit facility is increased during 2014. If our lenders do not increase our borrowing base, we may seek alternate debt financing or reduce our capital expenditures. In addition, a portion of our 2014 capital budget is projected to be financed with cash flows from operations derived from wells drilled on drilling locations not associated with proved reserves in our reserve reports. The failure to achieve projected production and cash flows from operations from such wells could result in a reduction to our 2014 capital budget. The actual amount and timing of our future capital expenditures may differ materially from our estimates as a result of, among other things, natural gas prices, actual drilling results, the availability of drilling rigs and other services and equipment, and regulatory, technological and competitive developments. A reduction in natural gas prices from current levels may result in a decrease in our actual capital expenditures, which would negatively impact our ability to grow production. We intend to finance our future capital expenditures primarily through cash flow from operations and through borrowings under our revolving credit facility; however, our financing needs may require us to alter or increase our capitalization substantially through the issuance of debt or equity securities or the sale of assets. The issuance of additional indebtedness would require that a portion of our cash flow from operations be used for the payment of interest and principal on our indebtedness, thereby reducing our ability to use cash flow from operations to fund working capital, capital expenditures and acquisitions.
Our cash flow from operations and access to capital are subject to a number of variables, including:
| • | our proved reserves; |
| • | the level of hydrocarbons we are able to produce from existing wells; |
| • | our access to, and the cost of accessing end markets for our production; |
| • | the prices at which our production is sold; |
21
Table of Contents
Index to Financial Statements
| • | our ability to acquire, locate and produce new reserves; |
| • | the levels of our operating expenses; and |
| • | our ability to borrow under our revolving credit facility. |
If our revenues or the borrowing base under our revolving credit facility decrease as a result of lower natural gas prices, operating difficulties, declines in reserves or for any other reason, we may have limited ability to obtain the capital necessary to sustain our operations at current levels. If additional capital is needed, we may not be able to obtain debt or equity financing on terms acceptable to us, if at all. If cash flow generated by our operations or available borrowings under our revolving credit facility are not sufficient to meet our capital requirements, the failure to obtain additional financing could result in a curtailment of our operations relating to development of our properties, which in turn could lead to a decline in our reserves and production, and could adversely affect our business, financial condition and results of operations.
Part of our strategy involves using some of the latest available horizontal drilling and completion techniques, which involve risks and uncertainties in their application.
Our operations involve utilizing some of the latest drilling and completion techniques as developed by us and our service providers. Risks that we face while drilling, including or as a result of the application of these techniques, include, but are not limited to, the following:
| • | effectively controlling the level of pressure flowing from particular wells; |
| • | landing our wellbore in the desired drilling zone; |
| • | staying in the desired drilling zone while drilling horizontally through the formation; |
| • | running our casing the entire length of the wellbore; and |
| • | being able to run tools and other equipment consistently through the horizontal wellbore. |
Risks that we face while completing our wells, including or as a result of the application of these techniques, include, but are not limited to, the following:
| • | the ability to fracture stimulate the planned number of stages; |
| • | the ability to run tools the entire length of the wellbore during completion operations; and |
| • | the ability to successfully clean out the wellbore after completion of the final fracture stimulation stage. |
Drilling for and producing natural gas are high-risk activities with many uncertainties that could result in a total loss of investment or otherwise adversely affect our business, financial condition or results of operations.
Our future financial condition and results of operations will depend on the success of our development and acquisition activities, which are subject to numerous risks beyond our control, including the risk that drilling will not result in commercially viable natural gas production or that we will not recover all or any portion of our investment in such wells or that various characteristics of the well will cause us to plug or abandon the well prior to producing in commercially viable quantities.
Our decisions to purchase, explore or develop prospects or properties will depend in part on the evaluation of data obtained through geophysical and geological analyses, production data and engineering studies, the results of which are often inconclusive or subject to varying interpretations. For a discussion of the uncertainty involved in these processes, see “—Reserve estimates depend on many assumptions that may turn out to be inaccurate. Any material inaccuracies in reserve estimates or underlying assumptions will materially affect the quantities and present value of our reserves.” In addition, our cost of drilling, completing and operating wells is often uncertain before drilling commences.
22
Table of Contents
Index to Financial Statements
Further, many factors may curtail, delay or cancel our scheduled drilling projects, including the following:
| • | delays imposed by or resulting from compliance with regulatory requirements including limitations resulting from wastewater disposal, discharge of greenhouse gases, and limitations on hydraulic fracturing; |
| • | pressure or irregularities in geological formations; |
| • | shortages of or delays in obtaining equipment and qualified personnel or in obtaining water for hydraulic fracturing activities; |
| • | equipment failures, accidents or other unexpected operational events; |
| • | lack of available gathering facilities or delays in construction of gathering facilities; |
| • | lack of available capacity on interconnecting transmission pipelines; |
| • | adverse weather conditions, such as blizzards and ice storms; |
| • | issues related to compliance with environmental regulations; |
| • | environmental hazards, such as natural gas leaks, oil spills, pipeline and tank ruptures, encountering naturally occurring radioactive materials, and unauthorized discharges of brine, well stimulation and completion fluids, toxic gases or other pollutants into the surface and subsurface environment; |
| • | declines in natural gas prices; |
| • | limited availability of financing at acceptable terms; |
| • | title problems; and |
| • | limitations in the market for natural gas. |
Any of these risks can cause substantial losses, including personal injury or loss of life, damage to or destruction of property, natural resources and equipment, pollution, environmental contamination or loss of wells and other regulatory penalties.
Our producing properties are concentrated in the Appalachian Basin, making us vulnerable to risks associated with operating in one major geographic area.
Our producing properties are geographically concentrated in the Marcellus Shale and Upper Devonian Shale formations in Washington and Greene Counties, Pennsylvania. As of December 31, 2013 and 2012, all of our total estimated proved reserves were attributable to properties located in this area. As a result of this concentration, we may be disproportionately exposed to the impact of regional supply and demand factors, delays or interruptions of production from wells in this area caused by governmental regulation, processing or transportation capacity constraints, market limitations, water shortages or other drought related conditions or interruption of the processing or transportation of oil, natural gas or NGLs and changes in regional and local political regimes and regulations. Such conditions could have a material adverse effect on our financial condition and results of operations. In addition, a number of areas within the Marcellus Shale and Utica Shale have historically been subject to mining operations. For example, third parties may engage in subsurface mining operations near or under our properties, which could cause subsidence or other damage to our properties, adversely impact our drilling or adversely impact our midstream activities or those on which we rely. In such
23
Table of Contents
Index to Financial Statements
event, our operations may be impaired or interrupted, and we may not be able to recover the costs incurred as a result of temporary shut-ins, the plugging and abandonment of any of our wells or the repair of our midstream facilities. Furthermore, the existence of mining operations near our properties could require coordination to avoid adverse impacts as a result of drilling and mining in close proximity. In connection with entering into the Marcellus JV Buy-In, we agreed to continue to acknowledge the dominance of mining by Alpha Natural Resources, Inc. within the area of mutual interest of our Marcellus joint venture. As such, in addition to coordinating with Alpha Holdings on, and in certain circumstances obtaining the prior approval of Alpha Holdings for, future drilling operations, we may also be required to take steps to assure the dominance of the mining operations of Alpha Natural Resources, Inc., including the plugging and abandonment of wells at the direction of Alpha Holdings upon two years notice. These restrictions on our operations, and any similar restrictions, can cause delays or interruptions or can prevent us from executing our business strategy, which could have a material adverse effect on our financial condition and results of operations. Due to the concentrated nature of our portfolio of natural gas properties, a number of our properties could experience any of the same conditions at the same time, resulting in a relatively greater impact on our results of operations than they might have on other companies that have a more diversified portfolio of properties.
We have been an early entrant into new or emerging plays. As a result, our initial drilling results in these areas may be less certain, and the value of our undeveloped acreage will decline if drilling results are unsuccessful.
We completed our first horizontal well in the Marcellus Shale in October 2010 and completed our first horizontal well in the Utica Shale in June 2014. While our costs to acquire undeveloped acreage in new or emerging plays have generally been less than those of later entrants into a developing play, our drilling results in these areas are more uncertain than drilling results in areas that are more developed and have a longer history of established production. Since new or emerging plays have limited or no production history, we are unable to use past drilling results in those areas to help predict our future drilling results. As a result, our cost of drilling, completing and operating wells in these areas may be higher than initially expected, and the value of our undeveloped acreage will decline if drilling results are unsuccessful. Additionally, we cannot assure you that all prospects will be economically viable or that we will not abandon our investments. For example, as a result of unexpected levels of pressure, in December 2013 we plugged and abandoned the first well we spud in the Utica Shale. We have since drilled and completed our second well in the Utica Shale and obtained an initial production test from this well in the second quarter of 2014. We cannot assure you that unproved property acquired by us or undeveloped acreage leased by us will be profitably developed, that wells drilled by us in prospects that we pursue will be productive or that we will recover all or any portion of our investment in such unproved property or wells.
During the term of the Utica Development Agreements, we will rely on Gulfport for the success of our project in the Southern Contract Area in Belmont County, Ohio, and we may not be able to maximize the value of our properties in the Southern Contract Area as we deem best because we are not in full control of this project.
During the term of the Utica Development Agreements, the success of our operation in the Southern Contract Area in Belmont County, Ohio, will depend in part on the ability of Gulfport to effectively exploit the acreage it operates under the Development Agreement. Please read “Business—Utica Shale—Development Agreement and Area of Mutual Interest Agreement.” Pursuant to the Development Agreement, we have designated Gulfport as the operator of our existing and future acreage in the Southern Contract Area. A failure or inability of Gulfport to adequately exploit the acreage it operates would have a significant impact on our results of operations. In addition, other than limitations set forth in the terms of the Development Agreement, we do not control the amount of capital that Gulfport may require for development of properties in the Southern Contract Area. Accordingly, we may be required to allocate capital to development of the Southern Contract Area at times when we otherwise would allocate capital to the Northern Contract Area, our Marcellus Shale acreage or elsewhere or otherwise be forced to terminate the Utica Development Agreements. Under any of these circumstances, our prospects for realization of the potential value of the oil, natural gas and NGL reserves
24
Table of Contents
Index to Financial Statements
associated with the Southern Contract Area could be adversely affected. Our lack of control may limit our ability to develop our properties in the manner we believe to be in our best interest.
Insufficient takeaway capacity in the Appalachian Basin could cause significant fluctuations in our realized natural gas prices.
The Appalachian Basin natural gas business environment has recently experienced periods in which production has surpassed local takeaway capacity, resulting in substantial discounts in the price received by producers such as us. Although additional Appalachian Basin takeaway capacity was added in 2013 and 2012, the existing and expected capacity may not be sufficient to keep pace with the increased production caused by accelerated drilling in the area. We expect that a significant portion of our production from the Utica Shale will be transported on pipelines that experience a differential to NYMEX Henry Hub prices. If we are unable to secure additional gathering and compression capacity and long-term firm takeaway capacity on major pipelines that are in existence or under construction in our core operating area to accommodate our growing production and to manage basis differentials, it could have a material adverse effect on our financial condition and results of operations.
We are required to pay fees to our service providers based on minimum volumes regardless of actual volume throughput.
We have various gas transportation service agreements in place, each with minimum volume delivery commitments. As of March 31, 2014, our average annual contractual firm transportation and firm sales obligations for 2014 (April through December), 2015 and 2016 were approximately 420,000 MMBtu/d, 820,000 MMBtu/d, and 920,000 MMBtu/d, respectively, which are in excess of our pro forma average daily gross operated production of approximately 318,000 MMBtu/d for March 2014. While we believe that our future natural gas volumes will be sufficient to satisfy the minimum requirements under our gas transportation services agreements based on our current production and our exploration and development plan, we can provide no such assurances that such volumes will be sufficient. We are obligated to pay fees on minimum volumes to our service providers regardless of actual volume throughput, which could be significant. If these fees on minimum volumes are substantial, we may not be able to generate sufficient cash to cover these obligations, which may require us to reduce or delay our planned investments and capital expenditures or seek alternative means of financing.
Restrictions in our existing and future debt agreements could limit our growth and our ability to engage in certain activities.
Our revolving credit facility and the indenture governing our Notes contain a number of significant covenants (in addition to covenants restricting the incurrence of additional indebtedness), including restrictive covenants that may limit our ability to, among other things:
| • | sell assets; |
| • | make loans to others; |
| • | make investments; |
| • | enter into mergers; |
| • | make certain payments; |
| • | hedge future production or interest rates; |
| • | incur liens; |
| • | engage in certain other transactions without the prior consent of the lenders; and |
| • | pay dividends. |
25
Table of Contents
Index to Financial Statements
In addition, our credit facilities and the indenture governing our Notes require us to maintain certain financial ratios or to reduce our indebtedness if we are unable to comply with such ratios. On certain occasions in the past we have not met these financial covenants. These restrictions may also limit our ability to obtain future financings to withstand a future downturn in our business or the economy in general, or to otherwise conduct necessary corporate activities. We may also be prevented from taking advantage of business opportunities that arise because of the limitations that the restrictive covenants under our credit facilities and our convertible debentures impose on us.
Any significant reduction in our borrowing base under our revolving credit facility as a result of the periodic borrowing base redeterminations or otherwise may negatively impact our ability to fund our operations.
Our revolving credit facility limits the amounts we can borrow up to a borrowing base amount, which the lenders, in their sole discretion, determine on a semi-annual basis based upon projected revenues from the natural gas properties securing our loan. The lenders can unilaterally adjust the borrowing base and the borrowings permitted to be outstanding under our revolving credit facility. Any increase in the borrowing base requires the consent of the lenders holding 100% of the commitments. If the requisite number of lenders do not agree to an increase, then the borrowing base will be the lowest borrowing base acceptable to such lenders. Outstanding borrowings in excess of the borrowing base must be repaid, or we must pledge other natural gas properties as additional collateral after applicable grace periods. We do not currently have any substantial unpledged properties, and we may not have the financial resources in the future to make mandatory principal prepayments required under our revolving credit facility. The borrowing base under our revolving credit facility as of June 30, 2014 is $385.0 million.
A breach of any covenant in our revolving credit facility would result in a default under such facility after any applicable grace periods. A default, if not waived, could result in acceleration of the indebtedness outstanding under such facility and in a default with respect to, and an acceleration of, the indebtedness outstanding under other debt agreements that include cross default provisions. The accelerated indebtedness would become immediately due and payable. If that occurs, we may not be able to make all of the required payments or borrow sufficient funds to refinance such indebtedness. Even if new financing were available at that time, it may not be on terms that are acceptable to us.
In certain circumstances we may have to purchase commodities on the open market or make cash payments under our hedging arrangements and these payments could be significant.
If our production is less than the volume commitments under our hedging arrangements, or if natural gas or oil prices exceed the price at which we have hedged our commodities, we may be obligated to make cash payments to our hedge counterparties or purchase the volume difference at market prices, which could, in certain circumstances, be significant. As of May 1, 2014, we had entered into hedging contracts covering approximately 57 Bcf (207 MMcf/d) of natural gas production for April 2014 through December 2014 at a weighted average index floor price of $4.06 per MMBtu. Furthermore, as of May 1, 2014, we had entered into hedging contracts covering approximately 59.1 Bcf (162 MMcf/d) of natural gas production for 2015 at a weighted average index floor price of $4.05 per MMBtu. If we have to purchase additional commodities on the open market or post cash collateral to meet our obligations under such arrangements, our cash otherwise available for use in our operations would be reduced.
Reserve estimates depend on many assumptions that may turn out to be inaccurate. Any material inaccuracies in reserve estimates or underlying assumptions will materially affect the quantities and present value of our reserves.
The process of estimating natural gas reserves is complex. It requires interpretations of available technical data and many assumptions, including assumptions relating to current and future economic conditions and commodity prices. Any significant inaccuracies in these interpretations or assumptions could materially affect the estimated quantities and present value of our reserves.
26
Table of Contents
Index to Financial Statements
In order to prepare reserve estimates, we must project production rates and timing of development expenditures. We must also analyze available geological, geophysical, production and engineering data. The extent, quality and reliability of this data can vary. The process also requires economic assumptions about matters such as natural gas prices, drilling and operating expenses, capital expenditures, taxes and availability of funds.
Actual future production, natural gas prices, revenues, taxes, development expenditures, operating expenses and quantities of recoverable natural gas reserves will vary from our estimates. As a substantial portion of our reserve estimates are made without the benefit of a lengthy production history, any significant variance from the above assumption could materially affect the estimated quantities and present value of our reserves. In addition, we may adjust reserve estimates to reflect production history, results of exploration and development, existing commodity prices and other factors, many of which are beyond our control.
You should not assume that the present value of future net revenues from our reserves is the current market value of our estimated natural gas reserves. We generally base the estimated discounted future net cash flows from reserves on prices and costs on the date of the estimate. Actual future prices and costs may differ materially from those used in the present value estimate.
Reserve estimates for fields that do not have a lengthy production history are less reliable than estimates for fields with lengthy production histories. Less production history may contribute to less accurate estimates of reserves, future production rates and the timing of development expenditures. Most of our producing wells have been operational for less than two years and estimated reserves vary substantially from well to well. Furthermore, the lack of operational history for horizontal wells in the Utica Shale may also contribute to the inaccuracy of future estimates of reserves and could result in our failing to achieve expected results in the play. A material and adverse variance of actual production, revenues and expenditures from those underlying reserve estimates or, in the case of the Utica Shale, management expectations, would have a material adverse effect on our business, financial condition, results of operations and cash flows.
Our gross drilling locations are scheduled out over many years, making them susceptible to uncertainties that could materially alter the occurrence or timing of their drilling. In addition, we may not be able to raise the substantial amount of capital that would be necessary to drill our drilling locations.
Our management team has specifically identified and scheduled certain well locations as an estimation of our future multi-year drilling activities on our existing acreage. These well locations represent a significant part of our growth strategy. Our ability to drill and develop these locations depends on a number of uncertainties, including natural gas and oil prices, the availability and cost of capital, drilling and production costs, availability of drilling services and equipment, drilling results, lease expirations, gathering system and pipeline transportation constraints, access to and availability of water sourcing and distribution systems, regulatory approvals and other factors. Because of these uncertain factors, we do not know if the numerous drilling locations we have identified will ever be drilled or if we will be able to produce natural gas or oil from these or any other drilling locations. In addition, unless production is established within the spacing units covering the undeveloped acres on which some of the potential locations are obtained, the leases for such acreage will expire. Further, certain of the horizontal wells we intend to drill in the future may require unitization with adjacent leaseholds controlled by third parties. If these third parties are unwilling to unitize such leaseholds with ours, this may limit the total locations we can drill. As such, our actual drilling activities may materially differ from those presently identified.
As of March 31, 2014, we had 1,313 gross (752 net) risked drilling locations. As a result of the limitations described above, we may be unable to drill many of our drilling locations. In addition, we will require significant additional capital over a prolonged period in order to pursue the development of these locations, and we may not be able to raise or generate the capital required to do so. Any drilling activities we are able to conduct on these potential locations may not be successful or result in our ability to add additional proved reserves to our overall proved reserves or may result in a downward revision of our estimated proved reserves, which could have a
27
Table of Contents
Index to Financial Statements
material adverse effect on our future business and results of operations. For more information on our drilling locations, see “Business—Our Operations—Reserve Data—Determination of Drilling Locations.”
Our acreage must be drilled before lease expiration, generally within three to five years, in order to hold the acreage by production. In a highly competitive market for acreage, failure to drill sufficient wells to hold acreage may result in a substantial lease renewal cost, or if renewal is not feasible, loss of our lease and prospective drilling opportunities.
Leases on our oil and natural gas properties typically have a term of three to five years, after which they expire unless, prior to expiration, production is established within the spacing units covering the undeveloped acres. As of December 31, 2013, on a pro forma basis, we had leases representing 1,054 undeveloped acres scheduled to expire in 2014, 2,365 undeveloped acres scheduled to expire in 2015, 4,132 undeveloped acres scheduled to expire in 2016, 35,639 undeveloped acres scheduled to expire in 2017 and 28,161 undeveloped acres scheduled to expire in 2018 and thereafter. The cost to renew such leases may increase significantly, and we may not be able to renew such leases on commercially reasonable terms or at all. Moreover, many of our leases require lessor consent to unitize, which may make it more difficult to hold our leases by production. Any reduction in our current drilling program, either through a reduction in capital expenditures or the unavailability of drilling rigs, could result in the loss of acreage through lease expirations. In addition, in order to hold our current leases scheduled to expire in 2014 and 2015, we will need to operate at least a one-rig program. We cannot assure you that we will have the liquidity to deploy rigs when needed, or that commodity prices will warrant operating such a drilling program. Our reserves and future production and, therefore, our future cash flow and income are highly dependent on successfully developing our undeveloped leasehold acreage and the loss of any leases could materially and adversely affect our ability to so develop such acreage.
The standardized measure of discounted future net cash flows from our proved reserves will not be the same as the current market value of our estimated oil and natural gas reserves.
You should not assume that the standardized measure of discounted future net cash flows from our proved reserves is the current market value of our estimated oil and natural gas reserves. In accordance with SEC requirements in effect at December 31, 2013, 2012 and 2011, we based the discounted future net cash flows from our proved reserves on the 12-month first-day-of-the-month oil and natural gas average prices without giving effect to derivative transactions. Actual future net cash flows from our oil and natural gas properties will be affected by factors such as:
| • | actual prices we receive for oil and natural gas; |
| • | actual cost of development and production expenditures; |
| • | the amount and timing of actual production; and |
| • | changes in governmental regulations or taxation. |
The timing of both our production and our incurrence of expenses in connection with the development and production of oil and natural gas properties will affect the timing and amount of actual future net revenues from proved reserves, and thus their actual present value. In addition, the 10% discount factor we use when calculating standardized measure may not be the most appropriate discount factor based on interest rates in effect from time to time and risks associated with us or the oil and natural gas industry in general. As a limited liability company, our predecessor was not subject to federal taxation. Accordingly, our standardized measure does not provide for federal corporate income taxes because taxable income was passed through to its members. As a corporation, we are treated as a taxable entity for federal income tax purposes and our future income taxes will be dependent on our future taxable income. Actual future prices and costs may differ materially from those used in the present value estimates included in this prospectus which could have a material effect on the value of our reserves.
28
Table of Contents
Index to Financial Statements
We may incur losses as a result of title defects in the properties in which we invest.
Leases in the Appalachian Basin are particularly vulnerable to title deficiencies due to the long history of land ownership in the area, resulting in extensive and complex chains of title. In the course of acquiring the rights to develop oil and natural gas, it is standard procedure for us and the lessor to execute a lease agreement with payment subject to title verification. In most cases, we incur the expense of retaining lawyers to verify the rightful owners of the oil and gas interests prior to payment of such lease bonus to the lessor. There is no certainty, however, that a lessor has valid title to its lease’s oil and gas interests. In those cases, such leases are generally voided and payment is not remitted to the lessor. As such, title failures may result in fewer net acres to us. Prior to the drilling of an oil or natural gas well, however, it is the normal practice in our industry for the person or company acting as the operator of the well to obtain a preliminary title review to ensure there are no obvious defects in title to the well. Frequently, as a result of such examinations, certain curative work must be done to correct defects in the marketability of the title, and such curative work entails expense. Our failure to cure any title defects may delay or prevent us from utilizing the associated mineral interest, which may adversely impact our ability in the future to increase production and reserves. Accordingly, undeveloped acreage has greater risk of title defects than developed acreage. If there are any title defects or defects in assignment of leasehold rights in properties in which we hold an interest, we will suffer a financial loss.
The development of our estimated proved undeveloped reserves may take longer and may require higher levels of capital expenditures than we anticipate. Therefore, our estimated proved undeveloped reserves may not be ultimately developed or produced.
As of December 31, 2013, approximately 58% of our total estimated proved reserves were classified as proved undeveloped. Our approximately 352 Bcf of pro forma estimated proved undeveloped reserves will require an estimated $313 million of development capital over the next five years. Development of these undeveloped reserves may take longer and require higher levels of capital expenditures than we anticipate. Delays in the development of our reserves, increases in costs to drill and develop such reserves, or decreases in commodity prices will reduce the PV-10 value of our estimated proved undeveloped reserves and future net revenues estimated for such reserves and may result in some projects becoming uneconomic. In addition, delays in the development of reserves could cause us to have to reclassify our proved undeveloped reserves as unproved reserves.
If commodity prices decrease to a level such that our future undiscounted cash flows from our properties are less than their carrying value for a significant period of time, we will be required to take write-downs of the carrying values of our properties.
Accounting rules require that we periodically review the carrying value of our properties for possible impairment. Based on specific market factors and circumstances at the time of prospective impairment reviews, and the continuing evaluation of development plans, production data, economics and other factors, we may be required to write down the carrying value of our properties. A writedown constitutes a non-cash charge to earnings. We may incur impairment charges in the future, which could have a material adverse effect on our results of operations for the periods in which such charges are taken.
Unless we replace our reserves with new reserves and develop those reserves, our reserves and production will decline, which would adversely affect our future cash flows and results of operations.
Producing natural gas reservoirs generally are characterized by declining production rates that vary depending upon reservoir characteristics and other factors. Unless we conduct successful ongoing development and exploration activities or continually acquire properties containing proved reserves, our proved reserves will decline as those reserves are produced. Our future natural gas reserves and production, and therefore our future cash flow and results of operations, are highly dependent on our success in efficiently developing and exploiting our current reserves and economically finding or acquiring additional recoverable reserves. We may not be able
29
Table of Contents
Index to Financial Statements
to develop, find or acquire sufficient additional reserves to replace our current and future production. If we are unable to replace our current and future production, the value of our reserves will decrease, and our business, financial condition and results of operations would be adversely affected.
Conservation measures and technological advances could reduce demand for oil and natural gas.
Fuel conservation measures, alternative fuel requirements, increasing consumer demand for alternatives to oil and natural gas, technological advances in fuel economy and energy generation devices could reduce demand for oil and natural gas. The impact of the changing demand for oil and gas services and products may have a material adverse effect on our business, financial condition, results of operations and cash flows.
Our derivative activities could result in financial losses or could reduce our earnings.
To achieve more predictable cash flows and reduce our exposure to adverse fluctuations in the prices of natural gas, we enter into derivative instrument contracts for a significant portion of our natural gas production, including fixed-price swaps. As of May 1, 2014, we had entered into hedging contracts covering approximately 57 Bcf (207 MMcf/d) of natural gas production for April 2014 through December 2014 at a weighted average index floor price of $4.06 per MMBtu. Furthermore, as of May 1, 2014, we had entered into hedging contracts covering approximately 59.1 Bcf (162 MMcf/d) of natural gas production for 2015 at a weighted average index floor price of $4.05 per MMBtu. Accordingly, our earnings may fluctuate significantly as a result of changes in fair value of our derivative instruments.
Derivative instruments also expose us to the risk of financial loss in some circumstances, including when:
| • | production is less than the volume covered by the derivative instruments; |
| • | the counterparty to the derivative instrument defaults on its contractual obligations; |
| • | there is an increase in the differential between the underlying price in the derivative instrument and actual prices received; or |
| • | there are issues with regard to legal enforceability of such instruments. |
The use of derivatives may, in some cases, require the posting of cash collateral with counterparties. If we enter into derivative instruments that require cash collateral and commodity prices or interest rates change in a manner adverse to us, our cash otherwise available for use in our operations would be reduced which could limit our ability to make future capital expenditures and make payments on our indebtedness, and which could also limit the size of our borrowing base. Future collateral requirements will depend on arrangements with our counterparties, highly volatile oil and natural gas prices and interest rates.
Our hedging transactions expose us to risk of financial loss if a counterparty fails to perform under a derivative contract. Disruptions in the financial markets could lead to sudden decreases in a counterparty’s liquidity, which could make them unable to perform under the terms of the derivative contract and we may not be able to realize the benefit of the derivative contract. As of May 1, 2014, the estimated fair value of our commodity derivative contracts was approximately $4.0 million. Any default by the counterparties to these derivative contracts, Wells Fargo Bank N.A. and Bank of Montreal, when they become due would have a material adverse effect on our financial condition and results of operations. In addition to the counterparties above at December 31, 2013, subsequent to December 31, 2013, we also executed hedging transactions with Barclays Bank PLC.
In addition, derivative arrangements could limit the benefit we would receive from increases in the prices for natural gas, which could also have an adverse effect on our financial condition.
30
Table of Contents
Index to Financial Statements
The inability of our significant customers to meet their obligations to us may adversely affect our financial results.
In addition to credit risk related to receivables from commodity derivative contracts, our principal exposures to credit risk are through joint interest receivables ($15.5 million at March 31, 2014) and the sale of our natural gas production ($46.9 million in receivables as of March 31, 2014), which we market to two natural gas marketing companies. Joint interest receivables arise from billing entities who own partial interest in the wells we operate. These entities participate in our wells primarily based on their ownership in leased properties on which we wish to drill. We can do very little to choose who participates in our wells. We are also subject to credit risk due to concentration of our natural gas receivables with two natural gas marketing companies. The largest purchaser of our natural gas during the three months ended March 31, 2014 represented approximately 92% of our total sales. We do not require our customers to post collateral. The inability or failure of our significant customers to meet their obligations to us or their insolvency or liquidation may adversely affect our financial results.
Our operations are subject to governmental laws and regulations relating to the protection of the environment, which may expose us to significant costs and liabilities that could exceed current expectations.
Substantial costs, liabilities, delays and other significant issues could arise from environmental laws and regulations inherent in drilling and well completion, gathering, transportation, and storage, and we may incur substantial costs and liabilities in the performance of these types of operations. Our operations are subject to extensive federal, regional, state and local laws and regulations governing environmental protection, the discharge of materials into the environment and the security of chemical and industrial facilities. These laws include:
| • | Clean Air Act (“CAA”) and analogous state law, which impose obligations related to air emissions; |
| • | Clean Water Act (“CWA”), and analogous state law, which regulate discharge of wastewaters and storm water from some of our facilities into state and federal waters, including wetlands; |
| • | Comprehensive Environmental Response, Compensation, and Liability Act (“CERCLA”), and analogous state law, which regulate the cleanup of hazardous substances that may have been released at properties currently or previously owned or operated by us or locations to which we have sent wastes for disposal; |
| • | Resource Conservation and Recovery Act (“RCRA”), and analogous state law, which impose requirements for the handling and disposal of any solid and hazardous waste from our facilities; |
| • | National Environmental Policy Act (“NEPA”), which requires federal agencies to study likely environmental impacts of a proposed federal action before it is approved, such as drilling on federal lands; |
| • | Safe Drinking Water Act (“SDWA”), and analogous state law, which restrict the disposal, treatment or release of water produced or used during oil and gas development; |
| • | Endangered Species Act (“ESA”), and analogous state law, which seek to ensure that activities do not jeopardize endangered or threatened animals and plant species, nor destroy or modify the critical habitat of such species; and |
| • | Oil Pollution Act (“OPA”) of 1990, which requires oil storage facilities and vessels to submit to the federal government plans detailing how they will respond to large discharges, requires updates to technology and equipment, regulates above ground storage tanks and sets forth liability for spills by responsible parties. |
Various governmental authorities, including, for example, the U.S. Environmental Protection Agency (“EPA”), the U.S. Department of the Interior, the Bureau of Indian Affairs and analogous state agencies and tribal governments, have the power to enforce compliance with these laws and regulations and the permits issued under them, oftentimes requiring difficult and costly actions. Failure to comply with these laws, regulations and permits may result in the assessment of administrative, civil and/or criminal fines and penalties and liability for non-compliance, the imposition of remedial obligations, costs of corrective action, cleanup or restoration, compensation for personal injury, property damage or other losses, the imposition of stricter conditions on or
31
Table of Contents
Index to Financial Statements
revocation of permits, the issuance of injunctions or declaratory relief limiting or preventing some or all of our operations, delays in granting permits and cancellation of leases.
There is inherent risk of the incurrence of environmental costs and liabilities in our business, some of which may be material, due to the handling of our products as they are gathered, transported, processed and stored, air emissions related to our operations, historical industry operations, and water and waste disposal practices. Joint and several, strict liability may be incurred, without regard to fault, under certain environmental laws and regulations, including CERCLA, RCRA and analogous state laws, for the remediation of contaminated areas and in connection with spills or releases of natural gas, oil and wastes on, under, or from our properties and facilities. Private parties may have the right to pursue legal actions to enforce compliance as well as to seek damages for non-compliance with environmental laws and regulations or for personal injury or property damage arising from our operations. Some sites at which we operate may be located near current or former third-party oil and natural gas operations or facilities, and there is a risk that contamination has migrated from those sites to ours. In addition, increasingly strict laws, regulations and enforcement policies could materially increase our compliance costs and the cost of any remediation that may become necessary. Our insurance may not cover all environmental risks and costs or may not provide sufficient coverage if an environmental claim is made against us.
The EPA’s National Enforcement Initiatives for 2014 to 2016 includes “Assuring Energy Extraction Sector Compliance with Environmental Laws.” According to the EPA’s website, “some techniques for natural gas extraction pose a significant risk to public health and the environment.” To address these concerns, the EPA’s goal is to “address incidences of noncompliance from natural gas extraction and production activities that may cause or contribute to significant harm to public health and/or the environment.” This initiative could involve a large-scale investigation of our facilities and processes, and could lead to potential enforcement actions, penalties or injunctive relief against us.
We are generally responsible for all liabilities associated with the environmental condition of our facilities and assets, whether acquired or developed, regardless of when the liabilities arose and whether they are known or unknown. In connection with certain acquisitions and divestitures, we could acquire, or be required to provide indemnification against, environmental liabilities that could expose us to material losses, which may not be covered by insurance. In addition, the steps we could be required to take to bring certain facilities into compliance could be prohibitively expensive, and we might be required to shut down, divest or alter the operation of those facilities, which might cause us to incur losses.
We make assumptions and develop expectations about possible expenditures related to environmental conditions based on current laws and regulations and current interpretations of those laws and regulations. If the interpretation of laws or regulations, or the laws and regulations themselves, change, our assumptions may change, and new capital costs may be incurred to comply with such changes. In addition, new environmental laws and regulations might adversely affect our products and activities, including drilling, processing, storage and transportation, as well as waste management and air emissions. For instance, federal and state agencies could impose additional safety requirements, any of which could affect our profitability. Further, new environmental laws and regulations might adversely affect our customers, which in turn could affect our profitability.
Changes in laws or government regulations regarding hydraulic fracturing could increase our costs of doing business, limit the areas in which we can operate and reduce our oil and natural gas production, which could adversely impact our business.
Hydraulic fracturing is an important and common practice that is used to stimulate production of natural gas and/or oil from dense subsurface rock formations. Hydraulic fracturing involves the injection of water, sand or alternative proppant and chemicals under pressure into target geological formations to fracture the surrounding rock and stimulate production. We regularly use hydraulic fracturing as part of our operations. Recently, there has been increased public concern regarding alleged potential impacts to the environment due to hydraulic fracturing, and proposals have been made to enact separate federal, state and local legislation that would increase the regulatory burden imposed on hydraulic fracturing. The SDWA regulates the underground injection of
32
Table of Contents
Index to Financial Statements
substances through the Underground Injection Control (“UIC”) program and exempts hydraulic fracturing from the definition of “underground injection”. However, Congress has from time to time considered legislation that would amend the SDWA to repeal the exemption for hydraulic fracturing from the definition of “underground injection” and require federal permitting and regulatory control of hydraulic fracturing, as well as require disclosure of the chemical constituents of the fluids used in the fracturing process. The U.S. Congress may consider similar SDWA legislation in the future.
In February 2014, the EPA asserted federal regulatory authority under the SDWA’s UIC program over hydraulic fracturing involving diesel additives, and requested comments in May 2014 on a proposal to require disclosure of chemical ingredients in hydraulic fracturing fluids under the Toxic Substances Control Act. Because EPA’s Advanced Notice of Proposed Rulemaking did not propose any actual regulation, it is unclear how any federal disclosure requirements that add to any applicable state disclosure requirements already in effect may affect our operations. Further, on October 21, 2011, the EPA announced its intention to propose federal CWA regulations governing wastewater discharges from hydraulic fracturing and certain other natural gas operations. In addition, the U.S. Department of the Interior published a Supplemental Notice of Proposed Rulemaking on May 16, 2013 that would update existing regulation of hydraulic fracturing activities on federal and Indian lands, including requirements for chemical disclosure, well bore integrity and handling of flowback water. Studies by the EPA and other federal agencies are underway that focus on the environmental aspects of hydraulic fracturing activities, with draft reports expected for public comment and peer review in late 2014. These studies could spur further regulation. Additional regulations adopted at the federal or state level could result in permitting delays and cost increases.
Presently, hydraulic fracturing is regulated primarily at the state level, typically by state oil and natural gas commissions and similar agencies. Along with several other states, Pennsylvania and Ohio (where we conduct operations) have adopted laws and proposed regulations that require oil and natural gas operators to disclose chemical ingredients and water volumes used to hydraulically fracture wells, in addition to more stringent well construction and monitoring requirements. The chemical ingredient information is generally available to the public via online databases, and this may bring more public scrutiny to hydraulic fracturing operations. In addition, local governments may also adopt ordinances within their jurisdictions regulating the time, place and manner of drilling activities in general or hydraulic fracturing activities in particular or prohibit the performance of well drilling in general or hydraulic fracturing, in particular. In Pennsylvania, although the legislature passed legislation to make regulation of drilling uniform throughout the state, the Pennsylvania Supreme Court in Robinson Township v. Commonwealth of Pennsylvania struck down portions of that legislation. Following this decision, local governments in Pennsylvania may adopt ordinances regulating drilling and hydraulic fracturing activities, especially within residential areas. If new or more stringent federal, state, or local legal restrictions relating to the hydraulic fracturing process are adopted in areas where we operate, we could incur potentially significant added costs to comply with such requirements, experience delays or curtailment in the pursuit of exploration, development, or production activities, and perhaps even be precluded from drilling wells.
Restrictions on our ability to obtain, use, manage or dispose of water may have an adverse effect on our operations.
Water is an essential component of oil and natural gas production during the drilling, and in particular, hydraulic fracturing, process. Our inability to locate sufficient amounts of water, or dispose of or recycle water used in our exploration and production operations, could adversely impact our operations.
Moreover, the imposition of new environmental initiatives and regulations could include restrictions on our ability to conduct certain operations such as hydraulic fracturing or disposal of waste, including, but not limited to, produced water, drilling fluids and other wastes associated with the exploration, development or production of natural gas. The CWA and similar state laws impose restrictions and strict controls on the discharge of produced waters and other natural gas and oil waste where such discharges could affect surface or ground waters. For example, state and federal regulations prohibit the discharge of produced water and sand, drilling fluids, drill cuttings and certain other substances related to the natural gas and oil industry into coastal waters. We must
33
Table of Contents
Index to Financial Statements
obtain permits for certain discharges into waters and wetlands and for construction activities that may affect regulated water resources. The EPA has also adopted regulations requiring certain natural gas and oil exploration and production facilities to obtain permits for storm water discharges. The CWA and similar state laws provide for civil, criminal and/or administrative penalties for any unauthorized discharges of pollutants, reportable quantities of oil and other hazardous substances. Moreover, sending wastewater to publicly-owned treatment works in Pennsylvania and Ohio requires certain levels of pretreatment that may effectively prohibit such disposal, and our continued ability to use injection wells as a disposal option not only will depend on federal or state regulations, but also on whether available injection wells have sufficient storage capacities. Compliance with current and future federal, state and local environmental regulations and permit requirements governing the withdrawal, storage and use of surface water or groundwater necessary for hydraulic fracturing of wells may increase our operating costs and cause delays, interruptions or termination of our operations, the extent of which cannot be accurately predicted.
We are subject to risks associated with climate change.
Climate change, the costs that may be associated with its effects and the regulation of greenhouse gases (“GHGs”) have the potential to affect our business in many ways, including increasing the costs to provide our products and services, reducing the demand for and consumption of our products and services (due to change in both costs and weather patterns), and the economic health of the regions in which we operate, all of which can create financial risks. In addition, legislative and regulatory responses related to GHGs and climate change may increase our operating costs. The U.S. Congress has previously considered legislation related to GHG emissions. There have also been international efforts seeking legally binding reductions in emissions of GHGs. In addition, increased public awareness and concern may result in more state, regional and/or federal requirements to reduce or mitigate GHG emissions. For example, in June 2013, the Obama Administration announced its Climate Action Plan, which, among other things, directs federal agencies to develop a strategy for the reduction of methane emissions, including emissions from the oil and gas sector.
In September 2009, the EPA finalized a mandatory GHG reporting rule that requires large sources of GHG emissions to monitor, maintain records on, and annually report their GHG emissions beginning January 1, 2010. The rule applies to large facilities emitting 25,000 metric tons or more of carbon dioxide-equivalent (CO2e) emissions per year and to most upstream suppliers of fossil fuels, as well as manufacturers of vehicles and engines. Subsequently, in November 2010, the EPA issued GHG monitoring and reporting regulations that went into effect on December 30, 2010, specifically for oil and natural gas facilities, including onshore and offshore oil and natural gas production facilities that emit 25,000 metric tons or more of CO2e per year. The rule required reporting of GHG emissions by regulated facilities to the EPA by March 2012 for emissions during 2011 and annually thereafter. We are required to report our GHG emissions to the EPA each year in March under this rule. The EPA also issued a final rule that makes certain stationary sources and newer modification projects subject to permitting requirements for GHG emissions, beginning in 2011, under the CAA. However, in June 2014, the U.S. Supreme Court, in UARG v. EPA, limited the application of the GHG permitting requirements under the Prevention of Significant Deterioration and Title V permitting programs to sources that would otherwise need permits based on the emission of conventional pollutants.
Federal and state regulatory agencies can impose administrative, civil and/or criminal penalties for non-compliance with air permits or other requirements of the CAA and associated state laws and regulations. In addition, the passage of any federal or state climate change laws or regulations in the future could result in increased costs to (i) operate and maintain our facilities, (ii) install new emission controls on our facilities and (iii) administer and manage any GHG emissions program. If we are unable to recover or pass through a significant level of our costs related to complying with climate change regulatory requirements imposed on us, it could have a material adverse effect on our results of operations and financial condition. To the extent financial markets view climate change and GHG emissions as a financial risk, this could negatively impact our cost of and access to capital. Legislation or regulations that may be adopted to address climate change could also affect the markets for our products by making our products more or less desirable than competing sources of energy.
34
Table of Contents
Index to Financial Statements
We may incur substantial losses and be subject to substantial liability claims as a result of our operations. Additionally, we may not be insured for, or our insurance may be inadequate to protect us against, these risks.
Our natural gas exploration and production activities are subject to all of the operating risks associated with drilling for and producing natural gas, including the possibility of:
| • | environmental hazards, such as uncontrollable releases of oil, natural gas, brine, well fluids, toxic gas or other pollution into the environment, including groundwater, air and shoreline contamination; |
| • | abnormally pressured formations; |
| • | mechanical difficulties, such as stuck oilfield drilling and service tools and casing collapse; |
| • | fires, explosions and ruptures of pipelines; |
| • | personal injuries and death; |
| • | natural disasters; and |
| • | terrorist attacks targeting natural gas and oil related facilities and infrastructure. |
Any of these risks could adversely affect our ability to conduct operations or result in substantial loss to us as a result of claims for:
| • | injury or loss of life; |
| • | damage to and destruction of property, natural resources and equipment; |
| • | pollution and other environmental damage; |
| • | regulatory investigations and penalties; |
| • | suspension of our operations; and |
| • | repair and remediation costs. |
In accordance with what we believe to be customary industry practice, we maintain insurance against some, but not all, of our business risks. Our insurance may not be adequate to cover any losses or liabilities we may suffer. Also, insurance may no longer be available to us or, if it is, its availability may be at premium levels that do not justify its purchase. The occurrence of a significant uninsured claim, a claim in excess of the insurance coverage limits maintained by us or a claim at a time when we are not able to obtain liability insurance could have a material adverse effect on our ability to conduct normal business operations and on our financial condition, results of operations or cash flows. In addition, we may not be able to secure additional insurance or bonding that might be required by new governmental regulations. This may cause us to restrict our operations, which might severely impact our financial condition. We may also be liable for environmental damage caused by previous owners of properties purchased by us, which liabilities may not be covered by insurance.
Since hydraulic fracturing activities are a large part of our operations, they are covered by our insurance against claims made for bodily injury, property damage and clean-up costs stemming from a sudden and accidental pollution event. However, we may not have coverage if we are unaware of the pollution event and unable to report the “occurrence” to our insurance company within the time frame required under our insurance policy. We have no coverage for gradual, long-term pollution events. In addition, these policies do not provide coverage for all liabilities, and we cannot assure you that the insurance coverage will be adequate to cover claims that may arise, or that we will be able to maintain adequate insurance at rates we consider reasonable. A loss not fully covered by insurance could have a material adverse effect on our financial condition, results of operations and cash flows.
We may elect not to obtain insurance for any or all of these risks if we believe that the cost of available insurance is excessive relative to the risks presented. In addition, pollution and environmental risks generally are not fully insurable. The occurrence of an event that is not fully covered by insurance could have a material adverse effect on our business, financial condition and results of operations.
35
Table of Contents
Index to Financial Statements
Properties that we decide to drill may not yield natural gas, NGLs or oil in commercially viable quantities.
Properties that we decide to drill that do not yield natural gas, NGLs or oil in commercially viable quantities will adversely affect our results of operations and financial condition. Our project areas are in various stages of development, ranging from project areas with current drilling or production activity to project areas that consist of recently acquired leasehold acreage or that have limited drilling or production history. If the wells in the process of being completed do not produce sufficient revenues to return a profit or if we drill dry holes in the future, our business may be materially affected. In addition, there is no way to predict in advance of drilling and testing whether any particular prospect will yield natural gas, NGLs or oil in sufficient quantities to recover drilling or completion costs or to be economically viable. The use of micro-seismic data and other technologies and the study of producing fields in the same area will not enable us to know conclusively prior to drilling whether natural gas, NGLs or oil will be present or, if present, whether natural gas, NGLs or oil will be present in commercial quantities. We cannot assure you that the analogies we draw from available data from other wells, more fully explored prospects or producing fields will be applicable to our drilling prospects. Further, our drilling operations may be curtailed, delayed or cancelled as a result of numerous factors, including:
| • | unexpected drilling conditions; |
| • | title problems; |
| • | pressure or lost circulation in formations; |
| • | equipment failure or accidents; |
| • | adverse weather conditions; |
| • | compliance with environmental and other governmental or contractual requirements; and |
| • | increase in the cost of, shortages or delays in the availability of, electricity, supplies, materials, drilling or workover rigs, equipment and services. |
Market conditions or operational impediments may hinder our access to natural gas, NGL or oil markets or delay our production.
Market conditions or the unavailability of satisfactory natural gas, NGL or oil transportation arrangements may hinder our access to markets or delay our production. The availability of a ready market for our production depends on a number of factors, including the demand for and supply of natural gas, NGLs or oil and the proximity of reserves to pipelines and terminal facilities. Our ability to market our production depends in substantial part on the availability and capacity of gathering systems, pipelines and processing facilities owned and operated by third parties. Our failure to obtain such services on acceptable terms could materially harm our business. We may be required to shut in wells due to lack of a market or inadequacy or unavailability of natural gas, NGL or oil pipeline or gathering system capacity. In addition, if quality specifications for the third-party pipelines with which we connect change so as to restrict our ability to transport product, our access to markets could be impeded. If our production becomes shut in for any of these or other reasons, we would be unable to realize revenue from those wells until other arrangements were made to deliver the products to market.
We are subject to complex federal, state, local and other laws and regulations that could adversely affect the cost, manner or feasibility of conducting our operations or expose us to significant liabilities.
Our natural gas exploration, production and transportation operations are subject to complex and stringent federal, state and local laws and regulations. In order to conduct our operations in compliance with these laws and regulations, we must obtain and maintain numerous permits, approvals and certificates from various federal, state and local governmental authorities. We may incur substantial costs in order to maintain compliance with these existing laws and regulations and the permits and other approvals issued thereunder. In addition, our costs of compliance may increase or operational delays may occur if existing laws and regulations are revised or reinterpreted, or if new laws and regulations become applicable to our operations. Failure to comply with such laws and regulations, including any evolving interpretation and enforcement by governmental authorities, could
36
Table of Contents
Index to Financial Statements
have a material adverse effect on our business, financial condition and results of operations. Also, we might not be able to obtain or maintain all required environmental regulatory approvals for our operations. If there is a delay in obtaining any required environmental regulatory approvals, or if we fail to obtain and comply with them, the operation or construction of our facilities could be prevented or become subject to additional costs.
In addition, new or additional regulations or permitting requirements, new interpretations of requirements or changes in our operations could also trigger the need for Environmental Assessments or more detailed Environmental Impact Statements under NEPA and analogous state laws, as well as litigation over the adequacy of those reviews, which could result in increased costs or delays of, or denial of rights to conduct, our development programs. Such potential regulations could increase our operating costs, reduce our liquidity, delay or halt our operations or otherwise alter the way we conduct our business, which could in turn have a material adverse effect on our business, financial condition and results of operations. Further, the discharges of oil, natural gas, NGLs and other pollutants into the air, soil or water may give rise to significant liabilities on our part to the government and third parties. See “Business—Regulation of Environmental and Occupational Safety and Health Matters” for a further description of laws and regulations that affect us.
The unavailability or high cost of additional drilling rigs, equipment, supplies, personnel and oilfield services could adversely affect our ability to execute our exploration and development plans within our budget and on a timely basis.
The demand for qualified and experienced field personnel to drill wells and conduct field operations, geologists, geophysicists, engineers and other professionals in the oil and natural gas industry can fluctuate significantly, often in correlation with natural gas and oil prices, causing periodic shortages. We intend to continue our four-rig drilling program in the Marcellus Shale and two-rig drilling program in the Utica Shale; however, certain of the rigs performing work for us do so on a well-by-well basis and can refuse to provide such services at the conclusion of drilling on the current well. Historically, there have been shortages of drilling and workover rigs, pipe and other equipment as demand for rigs and equipment has increased along with the number of wells being drilled. We cannot predict whether these conditions will exist in the future and, if so, what their timing and duration will be. Such shortages could delay or cause us to incur significant expenditures that are not provided for in our capital budget, which could have a material adverse effect on our business, financial condition or results of operations.
A change in the jurisdictional characterization of some of our assets by federal, state or local regulatory agencies or a change in policy by those agencies may result in increased regulation of our assets, which may cause our revenues to decline and operating expenses to increase.
Section 1(b) of the Natural Gas Act of 1938, (“NGA”), exempts natural gas gathering facilities from regulation by the Federal Energy Regulatory Commission (“FERC”), as a natural gas company under the NGA. We believe that the natural gas pipelines in our gathering systems meet the traditional tests FERC has used to establish a pipeline’s status as a gatherer not subject to regulation as a natural gas company. However, the distinction between FERC-regulated transmission services and federally unregulated gathering services is the subject of ongoing litigation, so the classification and regulation of our gathering facilities are subject to change based on future determinations by FERC, the courts or Congress. If the FERC were to consider the status of an individual facility and determine that the facility and/or services provided by it are not exempt from FERC regulation, the rates for, and terms and conditions of services provided by such facility would be subject to regulation by the FERC. Such regulation could decrease revenues, increase operating costs, and depending upon the facility in question, could adversely affect our results of operations and cash flows. In addition, if any of our facilities were found to have provided services or otherwise operated in violation of the NGA, this could result in the imposition of civil penalties as well as a requirement to disgorge charges collected for such service in excess of the cost-based rate established by the FERC.
State regulation of gathering facilities generally includes various safety, environmental and, in some circumstances, nondiscriminatory take requirements and complaint-based rate regulation. We cannot predict
37
Table of Contents
Index to Financial Statements
what new or different regulations federal and state regulatory agencies may adopt, or what effect subsequent regulation may have on our activities. Such regulations may have a material adverse effect on our financial condition, result of operations and cash flows.
Should we fail to comply with all applicable FERC administered statutes, rules, regulations and orders, we could be subject to substantial penalties and fines.
Under the Energy Policy Act of 2005, or EPAct 2005, FERC has civil penalty authority under the NGA to impose penalties for current violations of up to $1 million per day for each violation and disgorgement of profits associated with any violation. While our systems have not been regulated by FERC as a natural gas company under the NGA, we are required to report aggregate volumes of natural gas purchased or sold at wholesale to the extent such transactions utilize, contribute to, or may contribute to the formation of price indices. In addition, Congress may enact legislation or FERC may adopt regulations that may subject certain of our otherwise non-FERC jurisdictional facilities to further regulation. Failure to comply with those regulations in the future could subject us to civil penalty liability.
Competition in the natural gas industry is intense, making it more difficult for us to acquire properties, market natural gas and secure trained personnel.
Our ability to acquire additional prospects and to find and develop reserves in the future will depend on our ability to evaluate and select suitable properties and to consummate transactions in a highly competitive environment for acquiring properties, marketing natural gas and securing trained personnel. Also, there is substantial competition for capital available for investment in the oil and natural gas industry. Many of our competitors possess and employ financial, technical and personnel resources substantially greater than ours. Those companies may be able to pay more for productive natural gas properties and exploratory prospects and to evaluate, bid for and purchase a greater number of properties and prospects than our financial or personnel resources permit. In addition, other companies may be able to offer better compensation packages to attract and retain qualified personnel than we are able to offer. The cost to attract and retain qualified personnel has increased over the past three years due to competition and may increase substantially in the future. We may not be able to compete successfully in the future in acquiring prospective reserves, developing reserves, marketing hydrocarbons, attracting and retaining quality personnel and raising additional capital, which could have a material adverse effect on our business.
The loss of senior management or technical personnel could adversely affect operations.
We depend on the services of our senior management and technical personnel. We do not maintain, nor do we plan to obtain, any insurance against the loss of any of these individuals. The loss of the services of our senior management or technical personnel could have a material adverse effect on our business, financial condition and results of operations.
We are susceptible to the potential difficulties associated with rapid growth and expansion and have a limited operating history.
We have grown rapidly over the last several years and more than doubled our employee workforce during 2013. Our management believes that our future success depends on our ability to manage the rapid growth that we have experienced and the demands from increased responsibility on management personnel. The following factors could present difficulties:
| • | increased responsibilities for our executive level personnel; |
| • | increased administrative burden; |
| • | increased capital requirements; and |
| • | increased organizational challenges common to large, expansive operations. |
38
Table of Contents
Index to Financial Statements
Our operating results could be adversely affected if we do not successfully manage these potential difficulties. The historical financial information included herein is not necessarily indicative of the results that may be realized in the future. In addition, our operating history is limited and the results from our current producing wells are not necessarily indicative of success from our future drilling operations. We began development of our properties in 2010 with a two-rig drilling program. Recently, we expanded our development operations and are currently managing a four-rig drilling program. As a result, there is only limited historical financial and operating information available upon which to base your evaluation of our performance.
Seasonal weather conditions and regulations adversely affect our ability to conduct drilling activities in some of the areas where we operate.
Natural gas operations in our operating areas can be adversely affected by seasonal weather conditions and regulations designed to protect various wildlife. This limits our ability to operate in those areas and can intensify competition during those months for drilling rigs, oilfield equipment, services, supplies and qualified personnel, which may lead to periodic shortages. These constraints and the resulting shortages or high costs could delay our operations and materially increase our operating and capital costs.
Increases in interest rates could adversely affect our business.
Our business and operating results can be harmed by factors such as the availability, terms of and cost of capital, increases in interest rates or a reduction in credit rating. These changes could cause our cost of doing business to increase, limit our ability to pursue acquisition opportunities, reduce cash flow used for drilling and place us at a competitive disadvantage. Recent and continuing disruptions and volatility in the global financial markets may lead to a contraction in credit availability impacting our ability to finance our operations. We require continued access to capital. A significant reduction in cash flows from operations or the availability of credit could materially and adversely affect our ability to achieve our planned growth and operating results.
The enactment of derivatives legislation, and the promulgation of regulations pursuant thereto, could have an adverse effect on our ability to use derivative instruments to hedge risks associated with our business.
The Dodd-Frank Act, enacted on July 21, 2010, establishes federal oversight and regulation of the over-the-counter derivatives market and entities, such as us, that participate in that market. The Dodd-Frank Act requires the Commodities Futures Trading Commission (“CFTC”) and the SEC to promulgate rules and regulations implementing the Dodd-Frank Act. Although the CFTC has finalized some regulations, including critical rulemakings on the definition of “swap,” “swap dealer,” and “major swap participant”, others remain to be finalized and it is not possible at this time to predict when this will be accomplished.
The Dodd-Frank Act authorized the CFTC to establish rules and regulations setting position limits for certain futures and option contracts in the major energy markets and for swaps that are their economic equivalents. The CFTC’s initial position limits rules were vacated by the U.S. District Court for the District of Columbia in September 2012. However, on November 5, 2013, the CFTC proposed new rules that would place limits on positions in certain core futures and equivalent swaps contracts for or linked to certain physical commodities, subject to exceptions for certain bona fide hedging transactions. As these new position limit rules are not yet final, the impact of those provisions on us is uncertain at this time.
The CFTC has designated certain interest rate swaps and credit default swaps for mandatory clearing. The CFTC has not yet proposed rules designating any other classes of swaps, including physical commodity swaps, for mandatory clearing. Although we expect to qualify for the end-user exception from the mandatory clearing and trade execution requirements for swaps entered to hedge its commercial risks, the application of the mandatory clearing and trade execution requirements to other market participants, such as swap dealers, may change the cost and availability of the swaps that we use for hedging. In addition, for uncleared swaps, the CFTC or federal banking regulators may require end-users to enter into credit support documentation and/or post initial and variation margin. Posting of collateral could impact liquidity and reduce our cash available for capital
39
Table of Contents
Index to Financial Statements
expenditures, therefore reducing our ability to execute hedges to reduce risk and protect cash flows. The proposed margin rules are not yet final, and therefore the impact of those provisions to us is uncertain at this time.
The Dodd-Frank Act and regulations may also require the counterparties to our derivative instruments to spin off some of their derivatives activities to separate entities, which may not be as creditworthy as the current counterparties. The Dodd-Frank Act and regulations could significantly increase the cost of derivative contracts, materially alter the terms of derivative contracts, reduce the availability of derivatives to protect against risks we encounter, and reduce our ability to monetize or restructure our existing derivative contracts. If we reduce our use of derivatives as a result of the Dodd-Frank Act and regulations, our results of operations may become more volatile and our cash flows may be less predictable, which could adversely affect our ability to plan for and fund capital expenditures.
Finally, the Dodd-Frank Act was intended, in part, to reduce the volatility of oil and natural gas prices, which some legislators attributed to speculative trading in derivatives and commodity instruments related to oil and natural gas. Our revenues could therefore be adversely affected if a consequence of the Dodd-Frank Act and regulations is lower commodity prices.
Any of these consequences could have a material and adverse effect on us, our financial condition or our results of operations.
In February 2012, the state legislature of Pennsylvania passed a new natural gas impact fee in Pennsylvania. The legislation imposes an annual fee on natural gas and oil operators for each well drilled for a period of fifteen years. The fee is on a sliding scale set by the Public Utility Commission and is based on two factors: changes in the Consumer Price Index and the average NYMEX natural gas prices from the last day of each month. There can be no assurance that the impact fee will remain as currently structured or that new or additional taxes will not be imposed.
Certain federal income tax deductions currently available with respect to natural gas and oil exploration and development may be eliminated, and additional state taxes on natural gas extraction may be imposed, as a result of future legislation.
The Fiscal Year 2015 Budget proposed by the President recommends the elimination of certain key U.S. federal income tax incentives currently available to oil and gas exploration and production companies, and legislation has been introduced in Congress that would implement many of these proposals. Such changes include, but are not limited to: (i) the repeal of the percentage depletion allowance for oil and gas properties; (ii) the elimination of current deductions for intangible drilling and development costs; (iii) the elimination of the deduction for certain U.S. production activities for oil and gas production; and (iv) an extension of the amortization period for certain geological and geophysical expenditures. It is unclear, however, whether any such changes will be enacted or how soon such changes could be effective.
The passage of this legislation or any other similar change in U.S. federal income tax law could eliminate or postpone certain tax deductions that are currently available with respect to natural gas and oil exploration and development, and any such change could negatively affect our financial condition and results of operations.
In February 2012, the state legislature of Pennsylvania passed a new natural gas impact fee in Pennsylvania. The legislation imposes an annual fee on natural gas and oil operators for each well drilled for a period of fifteen years. The fee is on a sliding scale set by the Public Utility Commission and is based on two factors: changes in the Consumer Price Index and the average NYMEX natural gas prices from the last day of each month. There can be no assurance that the impact fee will remain as currently structured or that new or additional taxes will not be imposed. In addition, there is currently no severance tax imposed on natural gas or oil in Pennsylvania. However, it is possible that a severance tax could be proposed and implemented in the coming years, which would negatively affect our future cash flows and financial condition.
40
Table of Contents
Index to Financial Statements
In February 2013, the governor of the state of Ohio proposed a plan to enact new severance taxes in fiscal 2014 and 2015. However, the Ohio State Senate did not include a severance tax increase in the version of the budget bill that it passed on June 7, 2013. The possibility remains that the severance tax increase on horizontal wells will resurface during compromise talks on the budget.
Risks Related to the Offering and our Common Stock
The requirements of being a public company, including compliance with the reporting requirements of the Exchange Act and the requirements of the Sarbanes-Oxley Act, may strain our resources, increase our costs and distract management.
We completed our IPO in January 2014. As a public company, we incur significant legal, accounting and other expenses that we did not incur as a private company. We also incur costs associated with our public company reporting requirements and with corporate governance requirements, including requirements under the Sarbanes-Oxley Act of 2002, as well as rules implemented by the SEC and the Financial Industry Regulatory Authority. These rules and regulations will increase our legal and financial compliance costs and make some activities more time-consuming and costly, and we expect that these costs may increase further after we are no longer an “emerging growth company.” These rules and regulations make it more difficult and more expensive for us to obtain director and officer liability insurance and we may be required to accept reduced policy limits and coverage or incur substantially higher costs to obtain the same or similar coverage. As a result, it may be more difficult for us to attract and retain qualified individuals to serve on our board of directors or as executive officers.
However, for as long as we remain an “emerging growth company” as defined in the JOBS Act, we intend to take advantage of certain exemptions from various reporting requirements that are applicable to other public companies that are not emerging growth companies, including, but not limited to, not being required to comply with the auditor attestation requirements of Section 404 of the Sarbanes-Oxley Act, reduced disclosure obligations regarding executive compensation in our periodic reports and proxy statements, and exemptions from the requirements of holding a nonbinding advisory vote on executive compensation and stockholder approval of any golden parachute payments not previously approved.
We will remain an emerging growth company for up to five years, although if the market value of our common stock that is held by non-affiliates exceeds $700 million as of any June 30 before that time, we would cease to be an “emerging growth company” as of the following December 31.
After we are no longer an “emerging growth company,” we expect to incur significant additional expenses and devote substantial management effort toward ensuring compliance with those requirements applicable to companies that are not emerging growth companies.
In connection with past audits and reviews of our financial statements and those of our Marcellus joint venture, our independent registered public accounting firms identified and reported adjustments to management. Certain of such adjustments were deemed to be the result of internal control deficiencies that constituted a material weakness in internal controls over financial reporting. If we fail to establish and maintain effective internal control over financial reporting, our ability to accurately report our financial results could be adversely affected.
Prior to the completion of our IPO, we were a private company with limited accounting personnel to adequately execute our accounting processes and other supervisory resources with which to address our internal control over financial reporting. In addition, our Marcellus joint venture previously relied on our accounting personnel for its accounting processes. Historically, we and our Marcellus joint venture had not maintained effective internal control environments in that the design and execution of such controls had not consistently resulted in effective review and supervision by individuals with financial reporting oversight roles. The lack of adequate staffing levels resulted in insufficient time spent on review and approval of certain information used to prepare the financial statements of us and our Marcellus joint venture. We concluded that these control
41
Table of Contents
Index to Financial Statements
deficiencies constituted material weaknesses in our control environment for the year ended December 31, 2012. A material weakness is a control deficiency, or a combination of control deficiencies, in internal control over financial reporting, such that there is a reasonable possibility that a material misstatement of our annual or interim financial statements will not be prevented or detected on a timely basis. The control deficiencies described above, at varying degrees of severity, contributed to the material weaknesses in the control environment as further described in “Management’s Discussion and Analysis of Financial Condition and Results of Operations—Material Weaknesses in Internal Control over Financial Reporting.”
To address these control deficiencies, we have hired additional accounting and financial reporting staff, implemented additional analysis and reconciliation procedures and increased the levels of review and approval. Additionally, we have begun taking steps to comprehensively document and analyze our system of internal control over financial reporting in preparation for our first management report on internal control over financial reporting in connection with our annual report for the year ending December 31, 2014. Due to the recent implementation of these changes to our control environment, management continues to evaluate the design and effectiveness of these control changes in connection with its ongoing evaluation, review, formalization and testing of our internal control environment over the remainder of 2014. We will not complete our review until the second half of 2014 and we cannot predict the outcome of our review at this time. Based upon the status of our review, we and our independent auditors have concluded that the material weakness previously identified had not been remediated as of December 31, 2013. During the course of the review, we may identify additional control deficiencies, which could give rise to significant deficiencies and other material weaknesses in addition to the material weakness previously identified. Our remediation efforts may not enable us to remedy or avoid material weaknesses or significant deficiencies in the future.
For the year ended December 31, 2013, we were not required to comply with the SEC’s rules implementing Section 404 of the Sarbanes Oxley Act of 2002, which require a formal assessment of the effectiveness of our internal control over financial reporting. As a public company, we are required to comply with the SEC’s rules implementing Section 302 of the Sarbanes Oxley Act of 2002, which require our management to certify financial and other information in our quarterly and annual reports and provide an annual management report on the effectiveness of our internal control over financial reporting. Though we will be required to disclose material changes made to our internal controls and procedures on a quarterly basis, we will not be required to make our first annual assessment of our internal control over financial reporting pursuant to Section 404 until the year following our first annual report required to be filed with the SEC. To comply with the requirements of being a publicly traded company, we have upgraded our systems, including information technology, implemented additional financial and management controls, reporting systems and procedures and hired additional accounting and finance staff. Furthermore, while we generally must comply with Section 404 of the Sarbanes Oxley Act of 2002 for our fiscal year ending December 31, 2014, we are not required to have our independent registered public accounting firm attest to the effectiveness of our internal controls until our first annual report subsequent to our ceasing to be an “emerging growth company” within the meaning of Section 2(a)(19) of the Securities Act. Accordingly, we may not be required to have our independent registered public accounting firm attest to the effectiveness of our internal controls until our annual report for the fiscal year ending December 31, 2019. We can provide no assurance that our independent registered public accounting firm will be satisfied with the level at which our controls are documented, designed, or operating at the time it issues its report.
Effective internal controls are necessary for us to provide reliable financial reports, prevent fraud and operate successfully as a public company. If we cannot provide reliable financial reports or prevent fraud, our reputation and operating results would be harmed. We cannot be certain that our efforts to develop and maintain our internal controls will be successful, that we will be able to maintain adequate controls over our financial processes and reporting in the future or that we will be able to comply with our obligations under Section 404 of the Sarbanes Oxley Act of 2002. Any failure to develop or maintain effective internal controls, or difficulties encountered in implementing or improving our internal controls, could harm our operating results or cause us to fail to meet our reporting obligations. Ineffective internal controls could also cause investors to lose confidence in our reported financial information, which would likely have a negative effect on the trading price of our shares
42
Table of Contents
Index to Financial Statements
of common stock. company. If we cannot provide reliable financial reports or prevent fraud, our reputation and operating results would be harmed. We cannot be certain that our efforts to develop and maintain our internal controls will be successful, that we will be able to maintain adequate controls over our financial processes and reporting in the future or that we will be able to comply with our obligations under Section 404 of the Sarbanes Oxley Act of 2002. Any failure to develop or maintain effective internal controls, or difficulties encountered in implementing or improving our internal controls, could harm our operating results or cause us to fail to meet our reporting obligations. Ineffective internal controls could also cause investors to lose confidence in our reported financial information, which would likely have a negative effect on the trading price of our shares of common stock.
Following this offering, we will no longer be a “controlled company” under the meaning of the NYSE rules and, as a result, will no longer qualify for exemptions from certain corporate governance requirements. We may have difficulties complying with NYSE rules relating to the composition of our board of directors.
We are listed on the NYSE and are therefore subject to the NYSE’s corporate governance rules. As a result of this offering, we will no longer be a “controlled company” within the meaning of the NYSE corporate governance standards. Pursuant to the requirements of the NYSE rules, within one year after the completion of this offering, our Compensation Committee and Nominating and Corporate Governance Committee must be composed entirely of “independent directors” (as defined by the NYSE rules), and a majority of the directors on our board must be independent. Our board of directors currently consists of eight directors. During the phase-in period granted by the NYSE rules, our stockholders will not have the same protections afforded to stockholders of companies that are subject to all NYSE corporate governance rules.
We intend to comply with these NYSE rules upon ceasing to be a “controlled company.” However, there can be no assurance that we will be able to attract and retain the number of independent directors needed to comply with NYSE rules during the phase-in period for compliance.
Rice Holdings, Rice Partners and NGP Holdings collectively hold a substantial portion of our common stock.
Upon completion of this offering, Rice Holdings, Rice Partners and NGP Holdings will hold approximately 14.9%, 14.7% and 12.5% of our common stock, respectively. As such, Rice Holdings, Rice Partners and NGP Holdings may exert substantial influence on the election of the members of our board of directors and thereby control our management and affairs. In addition, they are able to similarly exert influence upon the outcome of all matters requiring stockholder approval, including mergers and other material transactions, and may be able to cause or prevent a change in the composition of our board of directors or a change in control of our company that could deprive our stockholders of an opportunity to receive a premium for their common stock as part of a sale of our company. The existence of significant stockholders may also have the effect of deterring hostile takeovers, delaying or preventing changes in control or changes in management, or limiting the ability of our other stockholders to approve transactions that they may deem to be in the best interests of our company.
So long as Rice Holdings, Rice Partners and NGP Holdings continue to control a significant amount of our common stock, each will continue to be able to strongly influence all matters requiring stockholder approval, regardless of whether or not other stockholders believe that a potential transaction is in their own best interests. In any of these matters, the interests of Rice Holdings, Rice Partners and NGP Holdings may differ or conflict with the interests of our other stockholders. Moreover, this concentration of stock ownership may also adversely affect the trading price of our common stock to the extent investors perceive a disadvantage in owning stock of a company with a controlling stockholder.
The stockholders’ agreement entered into in connection with our IPO permits our principal stockholders to designate a majority of the members of our board of directors.
In connection with our IPO, we entered into a stockholders’ agreement with Rice Holdings, Rice Partners, NGP Holdings and Alpha Natural Resources, Inc., pursuant to which Rice Holdings, NGP Holdings and Alpha
43
Table of Contents
Index to Financial Statements
Natural Resources, Inc. have certain rights relative to designated director nominees and agreed to vote their shares of common stock in accordance with the stockholders’ agreement, including as it relates to the election of directors.
Conflicts of interest could arise in the future between us and one or more of our sponsors concerning among other things, potential competitive business activities or business opportunities. Any actual or perceived conflicts of interest could have an adverse impact on the trading price of our common stock.
Our sponsors include other participants in the energy industry, including Natural Gas Partners, affiliates of Daniel J. Rice III (the Lead Portfolio Manager in the energy division at GRT Capital Partners) and Alpha Natural Resources Inc. Certain of our sponsors and/or their affiliates make investments in the U.S. oil and gas industry from time to time. As a result, our sponsors and/or their affiliates may, from time to time, acquire interests in businesses that directly or indirectly compete with our business, as well as businesses that are significant existing or potential customers. In certain circumstances, they may acquire or seek to acquire assets that we seek to acquire and, as a result, those acquisition opportunities may not be available to us or may be more expensive for us to pursue. Under our certificate of incorporation, certain of our sponsors and/or one or more of their respective affiliates are permitted to engage in business activities or invest in or acquire businesses which may compete with our business or do business with any client of ours.
Our amended and restated certificate of incorporation and amended and restated bylaws, as well as Delaware law, contain provisions that could discourage acquisition bids or merger proposals, which may adversely affect the market price of our common stock.
Our amended and restated certificate of incorporation authorizes our board of directors to issue preferred stock without stockholder approval. If our board of directors elects to issue preferred stock, it could be more difficult for a third party to acquire us. In addition, some provisions of our amended and restated certificate of incorporation and amended and restated bylaws could make it more difficult for a third party to acquire control of us, even if the change of control would be beneficial to our stockholders, including:
| • | limitations on the removal of directors; |
| • | limitations on the ability of our stockholders to call special meetings; |
| • | establishing advance notice provisions for stockholder proposals and nominations for elections to the board of directors to be acted upon at meetings of stockholders; |
| • | providing that the board of directors is expressly authorized to adopt, or to alter or repeal our bylaws; and |
| • | establishing advance notice and certain information requirements for nominations for election to our board of directors or for proposing matters that can be acted upon by stockholders at stockholder meetings. |
We do not intend to pay dividends on our common stock, and our credit facilities and our indenture governing the Notes place certain restrictions on our ability to do so. Consequently, your only opportunity to achieve a return on your investment is if the price of our common stock appreciates.
We do not plan to declare dividends on shares of our common stock in the foreseeable future. Additionally, our credit facilities and our indenture governing the Notes place certain restrictions on our ability to pay cash dividends. Consequently, your only opportunity to achieve a return on your investment in us will be if you sell your common stock at a price greater than you paid for it. There is no guarantee that the price of our common stock that will prevail in the market will ever exceed the price that you pay in this offering.
44
Table of Contents
Index to Financial Statements
Future sales of our common stock in the public market could reduce our stock price, and any additional capital raised by us through the sale of equity or convertible securities may dilute your ownership in us.
We may sell additional shares of common stock in subsequent public offerings. We may also issue additional shares of common stock or convertible securities. After the completion of this offering, we will have 136,154,256 outstanding shares of common stock. This number includes 20,421,246 shares that we and the selling shareholders are selling in this offering and 3,063,187 additional shares that certain of the selling stockholders may sell in this offering if the underwriters’ option to purchase additional shares is fully exercised, which may be resold immediately in the public market. Certain of our employees are subject to restrictions on the sale of their shares for 180 days after the date of our IPO; however, after such period, and subject to compliance with the Securities Act or exemptions therefrom, these employees may sell such shares into the public market. See “Shares Eligible for Future Sale” and “Certain Relationships and Related Party Transactions—Registration Rights.”
Subject to the satisfaction of vesting conditions, the expiration of lock-up agreements and the requirements of Rule 144, shares registered under our registration statement on Form S-8 filed on January 29, 2014 relating to our equity incentive plan are available for resale immediately in the public market without restriction.
We cannot predict the size of future issuances of our common stock or securities convertible into common stock or the effect, if any, that future issuances and sales of shares of our common stock will have on the market price of our common stock. Sales of substantial amounts of our common stock (including shares issued in connection with an acquisition), or the perception that such sales could occur, may adversely affect prevailing market prices of our common stock.
The underwriters of this offering may waive or release parties to the lock-up agreements entered into in connection with this offering, which could adversely affect the price of our common stock.
We, the Rice Owners, NGP Holdings, Alpha Holdings and all of our directors and executive officers have entered into lock-up agreements with respect to their common stock, pursuant to which they are subject to certain resale restrictions for a period of 90 days following the effectiveness date of the registration statement of which this prospectus forms a part. Goldman, Sachs & Co., at any time and without notice, may release all or any portion of the common stock subject to the foregoing lock-up agreements. If the restrictions under the lock-up agreements are waived, then common stock will be available for sale into the public markets, which could cause the market price of our common stock to decline and impair our ability to raise capital.
For as long as we are an emerging growth company, we will not be required to comply with certain reporting requirements, including those relating to accounting standards and disclosure about our executive compensation, that apply to other public companies.
In April 2012, President Obama signed into law the JOBS Act. We are classified as an “emerging growth company” under the JOBS Act. For as long as we are an emerging growth company, which may be up to five full fiscal years, unlike other public companies, we will not be required to, among other things, (1) provide an auditor’s attestation report on management’s assessment of the effectiveness of our system of internal control over financial reporting pursuant to Section 404(b) of the Sarbanes-Oxley Act, (2) comply with any new requirements adopted by the PCAOB requiring mandatory audit firm rotation or a supplement to the auditor’s report in which the auditor would be required to provide additional information about the audit and the financial statements of the issuer, (3) provide certain disclosure regarding executive compensation required of larger public companies or (4) hold nonbinding advisory votes on executive compensation. We will remain an emerging growth company for up to five years, although we will lose that status sooner if we have more than $1.0 billion of revenues in a fiscal year, have more than $700 million in market value of our common stock held by non-affiliates, or issue more than $1.0 billion of non-convertible debt over a three-year period.
45
Table of Contents
Index to Financial Statements
We may issue preferred stock whose terms could adversely affect the voting power or value of our common stock.
Our certificate of incorporation authorizes us to issue, without the approval of our stockholders, one or more classes or series of preferred stock having such designations, preferences, limitations and relative rights, including preferences over our common stock respecting dividends and distributions, as our board of directors may determine. The terms of one or more classes or series of preferred stock could adversely impact the voting power or value of our common stock. For example, we might grant holders of preferred stock the right to elect some number of our directors in all events or on the happening of specified events or the right to veto specified transactions. Similarly, the repurchase or redemption rights or liquidation preferences we might assign to holders of preferred stock could affect the residual value of the common stock.
If securities or industry analysts do not publish research or reports about our business, if they adversely change their recommendations regarding our common stock or if our operating results do not meet their expectations, our stock price could decline.
The trading market for our common stock is influenced by the research and reports that industry or securities analysts publish about us or our business. If one or more of these analysts cease coverage of our company or fail to publish reports on us regularly, we could lose visibility in the financial markets, which in turn could cause our stock price or trading volume to decline. Moreover, if one or more of the analysts who cover our company downgrades our common stock or if our operating results do not meet their expectations, our stock price could decline.
Our amended and restated certificate of incorporation designates the Court of Chancery of the State of Delaware as the sole and exclusive forum for certain types of actions and proceedings that may be initiated by our stockholders, which could limit our stockholders’ ability to obtain a favorable judicial forum for disputes with us or our directors, officers, employees or agents.
Our amended and restated certificate of incorporation provides that unless we consent in writing to the selection of an alternative forum, the Court of Chancery of the State of Delaware will, to the fullest extent permitted by applicable law, be the sole and exclusive forum for (i) any derivative action or proceeding brought on our behalf, (ii) any action asserting a claim of breach of a fiduciary duty owed by any of our directors, officers, employees or agents to us or our stockholders, (iii) any action asserting a claim arising pursuant to any provision of the Delaware General Corporation Law (the “DGCL”), our amended and restated certificate of incorporation or our bylaws, or (iv) any action asserting a claim against us that is governed by the internal affairs doctrine, in each such case subject to such Court of Chancery having personal jurisdiction over the indispensable parties named as defendants therein. Any person or entity purchasing or otherwise acquiring any interest in shares of our capital stock will be deemed to have notice of, and consented to, the provisions of our amended and restated certificate of incorporation described in the preceding sentence. This choice of forum provision may limit a stockholder’s ability to bring a claim in a judicial forum that it finds favorable for disputes with us or our directors, officers, employees or agents, which may discourage such lawsuits against us and such persons. Alternatively, if a court were to find these provisions of our amended and restated certificate of incorporation inapplicable to, or unenforceable in respect of, one or more of the specified types of actions or proceedings, we may incur additional costs associated with resolving such matters in other jurisdictions, which could adversely affect our business, financial condition or results of operations.
46
Table of Contents
Index to Financial Statements
CAUTIONARY STATEMENT REGARDING FORWARD-LOOKING STATEMENTS
The information in this prospectus includes “forward-looking statements.” All statements, other than statements of historical fact included in this prospectus, regarding our strategy, future operations, financial position, estimated revenues and income/losses, projected costs, prospects, plans and objectives of management are forward-looking statements. When used in this prospectus, the words “could,” “believe,” “anticipate,” “intend,” “estimate,” “expect,” “project” and similar expressions are intended to identify forward-looking statements, although not all forward-looking statements contain such identifying words. These forward-looking statements are based on our current expectations and assumptions about future events and are based on currently available information as to the outcome and timing of future events. When considering forward-looking statements, you should keep in mind the risk factors and other cautionary statements described under the heading “Risk Factors” included in this prospectus. These forward-looking statements are based on management’s current belief, based on currently available information, as to the outcome and timing of future events.
Forward-looking statements may include statements about our:
| • | business strategy; |
| • | reserves; |
| • | financial strategy, liquidity and capital required for our development program; |
| • | realized natural gas, NGL and oil prices; |
| • | timing and amount of future production of natural gas, NGLs and oil; |
| • | hedging strategy and results; |
| • | future drilling plans; |
| • | competition and government regulations; |
| • | pending legal or environmental matters; |
| • | marketing of natural gas, NGLs and oil; |
| • | leasehold or business acquisitions; |
| • | costs of developing our properties and conducting our gathering and other midstream operations; |
| • | general economic conditions; |
| • | credit markets; |
| • | uncertainty regarding our future operating results; and |
| • | plans, objectives, expectations and intentions contained in this prospectus that are not historical. |
We caution you that these forward-looking statements are subject to all of the risks and uncertainties, most of which are difficult to predict and many of which are beyond our control, incident to the exploration for and development, production, gathering and sale of natural gas, NGLs and oil. These risks include, but are not limited to, commodity price volatility; inflation, lack of availability of drilling and production equipment and services; environmental risks; drilling and other operating risks; regulatory changes; the uncertainty inherent in estimating natural gas reserves and in projecting future rates of production, cash flow and access to capital; the timing of development expenditures; and the other risks described under “Risk Factors” in this prospectus.
Reserve engineering is a process of estimating underground accumulations of natural gas, NGLs and oil that cannot be measured in an exact way. The accuracy of any reserve estimate depends on the quality of available data, the interpretation of such data and price and cost assumptions made by reserve engineers. In addition, the results of drilling, testing and production activities may justify revisions of estimates that were made previously.
47
Table of Contents
Index to Financial Statements
If significant, such revisions could change the schedule of any further production and development drilling. Accordingly, reserve estimates may differ significantly from the quantities of natural gas, and NGLs and oil that are ultimately recovered.
Should one or more of the risks or uncertainties described in this prospectus occur, or should underlying assumptions prove incorrect, our actual results and plans could differ materially from those expressed in any forward-looking statements.
All forward-looking statements, expressed or implied, included in this prospectus are expressly qualified in their entirety by this cautionary statement. This cautionary statement should also be considered in connection with any subsequent written or oral forward-looking statements that we or persons acting on our behalf may issue.
Except as otherwise required by applicable law, we disclaim any duty to update any forward-looking statements, all of which are expressly qualified by the statements in this section, to reflect events or circumstances after the date of this prospectus.
48
Table of Contents
Index to Financial Statements
We expect to receive approximately $ million of net proceeds from the sale of the common stock offered by us after deducting underwriting discounts and commissions and estimated offering expenses payable by us. We will not receive any proceeds from the sale of shares held by the selling stockholders.
We intend to use the net proceeds from this offering to fund a portion of the purchase price for our Greene County Acquisition, with the remainder to be funded with cash on hand.
This offering is not contingent on the completion of the Greene County Acquisition. In the event the Greene County Acquisition is not successfully completed we will use the net proceeds of this offering for general corporate purposes, including capital expenditures.
49
Table of Contents
Index to Financial Statements
MARKET PRICE OF OUR COMMON STOCK
Our common stock began trading on the NYSE under the symbol “RICE” on January 24, 2014. Prior to that, there was no public market for our common stock. The table below sets forth, for the periods indicated, the high and low sales prices per share of our common stock since January 24, 2014.
| High | Low | |||||||
| Third Quarter (through July 3, 2014) |
$ | 30.57 | $ | 28.78 | ||||
| Second Quarter |
$ | 34.34 | $ | 25.80 | ||||
| First Quarter(1) |
$ | 28.07 | $ | 20.78 | ||||
| (1) | For the period from January 24, 2014 through March 31, 2014. |
On July 3, 2014, the closing price of our common stock was $29.09 per share. As of June 30, 2014, we had approximately 71 holders of record of our common stock. This number excludes owners for whom common stock may be held in “street” name.
50
Table of Contents
Index to Financial Statements
We do not anticipate declaring or paying any cash dividends to holders of our common stock in the foreseeable future. We currently intend to retain future earnings, if any, to finance the growth of our business. Our future dividend policy is within the discretion of our board of directors and will depend upon then-existing conditions, including our results of operations, financial condition, capital requirements, investment opportunities, statutory restrictions on our ability to pay dividends and other factors our board of directors may deem relevant. In addition, certain of our debt instruments place restrictions on our ability to pay cash dividends.
51
Table of Contents
Index to Financial Statements
The following table sets forth our cash and cash equivalents and capitalization as of March 31, 2014:
| • | on an actual basis; |
| • | on an as adjusted basis to give effect to (i) the completion of the Momentum Acquisition funded with cash on hand and (ii) the completion of the Senior Notes Offering and the use of proceeds therefrom; and |
| • | on an as further adjusted basis to give effect to the issuance and sale of common units in this offering and the application of the net proceeds therefrom as set forth under “Use of Proceeds.” Pending such use, the net proceeds from this offering are shown as increasing cash and cash equivalents. |
This table should be read in conjunction with, and is qualified in its entirety by reference to, “Use of Proceeds” and our historical audited and unaudited consolidated financial statements and the accompanying notes appearing elsewhere in this prospectus.
| As of March 31, 2014 | ||||||||||
| Rice Energy Inc. | ||||||||||
| Actual | As Adjusted | As Further Adjusted | ||||||||
| (unaudited) | ||||||||||
| (in thousands) | ||||||||||
| Cash and cash equivalents(1) |
$ | 228,669 | $ | 705,500 | ||||||
| Long-term debt, including current maturities: |
||||||||||
| Revolving credit facility(2) |
— | — | ||||||||
| Second lien term loan(3) |
293,280 | — | ||||||||
| 6.25% Senior Notes due 2022 |
— | 900,000 | ||||||||
| Other |
10,647 | 10,647 | ||||||||
|
|
|
|
|
| ||||||
| Total debt |
303,927 | 910,647 | ||||||||
| Shareholders’ equity: |
||||||||||
| Common stock, $0.01 par value; 650,000,000 shares authorized, 128,211,999 shares issued and outstanding |
1,282 | 1,282 | ||||||||
| Additional paid-in capital |
1,130,233 | 1,130,233 | ||||||||
| Accumulated earnings |
64,346 | 50,836 | ||||||||
|
|
|
|
|
| ||||||
| Total shareholders’ equity |
1,195,861 | 1,182,351 | ||||||||
|
|
|
|
|
| ||||||
| Total capitalization |
$ | 1,499,788 | $ | 2,092,998 | ||||||
|
|
|
|
|
| ||||||
| (1) | Does not give effect to the Greene County Acquisition, which we will fund, in part, with approximately $ in cash. Please see “Prospectus Summary—Recent Developments—Western Greene County Acquisition.” As of May 31, 2014, we had cash on hand of approximately $526.9 million. |
| (2) | As of May 31, 2014, we had no outstanding borrowings under our revolving credit facility and $71.5 million of outstanding letters of credit. |
| (3) | On April 25, 2014, we used $301.8 million in net proceeds from our Senior Notes Offering to repay and retire the facility. |
52
Table of Contents
Index to Financial Statements
SELECTED HISTORICAL CONSOLIDATED AND UNAUDITED PRO FORMA FINANCIAL DATA
The following table shows selected historical consolidated financial data of Rice Drilling B, our accounting predecessor, and Rice Energy Inc. and the summary unaudited pro forma financial data for the periods and as of the dates indicated. Our historical results are not necessarily indicative of future operating results. The selected financial data presented below are qualified in their entirety by reference to, and should be read in conjunction with, “Capitalization,” “Management’s Discussion and Analysis of Financial Condition and Results of Operations” and our consolidated financial statements and related notes included elsewhere herein.
The selected historical consolidated financial data as of and for the years ended December 31, 2011, 2012 and 2013 are derived from the audited consolidated financial statements of Rice Drilling B included elsewhere in this prospectus. The summary historical statement of operations data for the three months ended March 31, 2014 and the historical balance sheet data as of March 31, 2014 are derived from the unaudited consolidated financial statements of Rice Energy Inc. included elsewhere in this prospectus. The selected historical statement of operations data for the three months ended March 31, 2013 are derived from the unaudited consolidated financial statements of Rice Drilling B included elsewhere in this prospectus. The selected historical unaudited historical consolidated interim financial data has been prepared on a consistent basis with the audited consolidated financial statements of Rice Drilling B. In the opinion of management, such selected unaudited historical consolidated financial interim data reflects all adjustments (consisting of normal and recurring accruals) considered necessary to present our financial position for the periods presented. The results of operations for the interim periods are not necessarily indicative of the results that may be expected for the full year because of the impact of fluctuations in prices received from oil and natural gas, natural production declines, the uncertainty of exploration and development drilling results and other factors.
The summary unaudited pro forma consolidated statements of operations data for the year ended December 31, 2013 and three months ended March 31, 2014 has been prepared to give pro forma effect to (i) the completion of the corporate reorganization in connection with our IPO completed in January 2014, (ii) the Marcellus JV Buy-In and (iii) our IPO and the application of the net proceeds therefrom as if each had been completed as of January 1, 2013. The summary unaudited pro forma consolidated balance sheet data as of December 31, 2013 has been prepared to give pro forma effect to those transactions as if they had been completed as of December 31, 2013. Each of our IPO, the corporate reorganization in connection with our IPO and the Marcellus JV Buy-In was completed prior to March 31, 2014 and is thus fully reflected in our historical consolidated balance sheet as of such date. The summary unaudited pro forma consolidated statements of operations data do not give pro forma effect to the Momentum Acquisition, the Senior Notes Offering or the pending Greene County Acquisition. These data are subject and give effect to the assumptions and adjustments described in the notes accompanying the unaudited pro forma financial statements included elsewhere in this prospectus. The summary unaudited pro forma consolidated financial data are presented for informational purposes only and should not be considered indicative of actual results of operations that would have been achieved had the reorganization transactions and this offering been consummated on the dates indicated, and do not purport to be indicative of statements of financial position or results of operations as of any future date or for any future period.
53
Table of Contents
Index to Financial Statements
| Rice Drilling B | Rice Energy Inc. | Rice Energy Inc. Pro Forma |
||||||||||||||||||||||||||
| Year Ended December 31, | Three Months Ended March 31, |
Year Ended December 31, 2013 |
Three Months Ended March 31, 2014 |
|||||||||||||||||||||||||
| 2011 | 2012 | 2013 | 2013 | 2014 | ||||||||||||||||||||||||
| (in thousands, except per share data) | (unaudited) | |||||||||||||||||||||||||||
| Statement of operations data: |
||||||||||||||||||||||||||||
| Revenues: |
||||||||||||||||||||||||||||
| Natural gas sales |
$ | 13,972 | $ | 26,743 | $ | 87,847 | $ | 13,049 | $ | 90,466 | $ | 178,524 | $ | 102,402 | ||||||||||||||
| Other revenue |
— | 457 | 757 | 184 | — | 757 | — | |||||||||||||||||||||
|
|
|
|
|
|
|
|
|
|
|
|
|
|
|
|||||||||||||||
| Total revenues |
13,972 | 27,200 | 88,604 | 13,233 | 90,466 | 179,281 | 102,402 | |||||||||||||||||||||
| Operating expenses: |
||||||||||||||||||||||||||||
| Lease operating |
1,617 | 3,688 | 8,309 | 1,236 | 5,187 | 16,502 | 5,607 | |||||||||||||||||||||
| Gathering, compression and transportation |
540 | 3,754 | 9,774 | 1,528 | 7,130 | 25,437 | 8,520 | |||||||||||||||||||||
| Production taxes and impact fees |
— | 1,382 | 1,629 | 169 | 639 | 2,887 | 708 | |||||||||||||||||||||
| Exploration |
660 | 3,275 | 9,951 | 898 | 486 | 9,951 | 486 | |||||||||||||||||||||
| Restricted unit expense |
170 | — | 32,906 | — | 73,802 | 32,906 | 73,802 | |||||||||||||||||||||
| General and administrative |
5,208 | 7,599 | 16,953 | 1,743 | 11,521 | 20,209 | 11,593 | |||||||||||||||||||||
| Depreciation, depletion and amortization |
5,981 | 14,149 | 32,815 | 5,131 | 25,507 | 71,886 | 28,363 | |||||||||||||||||||||
| Write-down of abandoned leases |
109 | 2,253 | — | — | — | 146 | — | |||||||||||||||||||||
| Loss (Gain) from sale of interest in gas properties |
(1,478 | ) | — | 4,230 | — | — | 4,230 | — | ||||||||||||||||||||
|
|
|
|
|
|
|
|
|
|
|
|
|
|
|
|||||||||||||||
| Total expenses |
12,807 | 36,100 | 116,567 | 10,705 | 124,272 | 184,154 | 129,079 | |||||||||||||||||||||
|
|
|
|
|
|
|
|
|
|
|
|
|
|
|
|||||||||||||||
| Operating loss |
1,165 | (8,900 | ) | (27,963 | ) | 2,528 | (33,806 | ) | (4,873 | ) | (26,677 | ) | ||||||||||||||||
| Interest expense |
(531 | ) | (3,487 | ) | (17,915 | ) | (1,915 | ) | (7,042 | ) | (16,422 | ) | (7,277 | ) | ||||||||||||||
| Gain on purchase of Marcellus joint venture |
— | 203,579 | 200,923 | |||||||||||||||||||||||||
| Other income (expense) |
161 | 112 | (357 | ) | 248 | 602 | (1,153 | ) | 602 | |||||||||||||||||||
| Gain (loss) on derivative instruments |
574 | (1,381 | ) | 6,891 | (4,993 | ) | (20,380 | ) | 10,238 | (32,571 | ) | |||||||||||||||||
| Amortization of deferred financing costs |
(2,675 | ) | (7,220 | ) | (5,230 | ) | (1,865 | ) | (489 | ) | (5,394 | ) | (504 | ) | ||||||||||||||
| Loss on extinguishment of debt |
— | — | (10,622 | ) | — | (143 | ) | (10,622 | ) | (143 | ) | |||||||||||||||||
| Write-off of deferred financing costs |
— | (836 | ) | (836 | ) | |||||||||||||||||||||||
| Equity in income (loss) of joint ventures |
370 | 1,532 | 19,420 | (778 | ) | (2,656 | ) | 90 | — | |||||||||||||||||||
|
|
|
|
|
|
|
|
|
|
|
|
|
|
|
|||||||||||||||
| Gain (loss) before income taxes |
(936 | ) | (19,344 | ) | (35,776 | ) | (6,775 | ) | 138,829 | (28,136 | ) | 133,517 | ||||||||||||||||
| Income tax benefit |
— | — | — | — | (9,375 | ) | 11,674 | (9,375 | ) | |||||||||||||||||||
|
|
|
|
|
|
|
|
|
|
|
|
|
|
|
|||||||||||||||
| Net gain (loss) |
$ | (936 | ) | $ | (19,344 | ) | $ | (35,776 | ) | (6,775 | ) | $ | 129,454 | $ | (16,462 | ) | $ | 124,142 | ||||||||||
|
|
|
|
|
|
|
|
|
|
|
|
|
|
|
|||||||||||||||
| Balance sheet data (at period end): |
||||||||||||||||||||||||||||
| Cash |
$ | 4,389 | $ | 8,547 | $ | 31,612 | $ | 228,669 | $ | 347,011 | ||||||||||||||||||
| Total property and equipment, net |
150,646 | 273,640 | 734,331 | 1,229,230 | 1,054,414 | |||||||||||||||||||||||
| Total assets |
190,240 | 344,971 | 879,810 | 1,888,743 | 1,845,650 | |||||||||||||||||||||||
| Total debt |
107,795 | 149,320 | 426,942 | 303,927 | 311,942 | |||||||||||||||||||||||
| Total members’ / stockholders’ capital |
46,821 | 138,191 | 298,647 | 1,195,861 | 1,134,241 | |||||||||||||||||||||||
| Net cash provided by (used in): |
||||||||||||||||||||||||||||
| Operating activities |
$ | 5,131 | $ | (3,014 | ) | $ | 33,672 | $ | 9,565 | $ | 35,544 | |||||||||||||||||
| Investing activities |
(79,245 | ) | (119,973 | ) | (458,595 | ) | (27,623 | ) | (251,290 | ) | ||||||||||||||||||
| Financing activities |
73,447 | 127,145 | 447,988 | 21,933 | 412,803 | |||||||||||||||||||||||
| Other financial data (unaudited): |
||||||||||||||||||||||||||||
| Adjusted EBITDAX(1) |
$ | 107,773 | $ | 64,803 | ||||||||||||||||||||||||
| Earnings per share—basic |
(0.13 | ) | 1.00 | |||||||||||||||||||||||||
| Earnings per share—diluted |
(0.13 | ) | 0.99 | |||||||||||||||||||||||||
| (1) | Adjusted EBITDAX is a non-GAAP financial measure. For a definition of Adjusted EBITDAX and a reconciliation of Adjusted EBITDAX to net income (loss), see “Prospectus Summary—Non-GAAP Financial Measure.” |
54
Table of Contents
Index to Financial Statements
MANAGEMENT’S DISCUSSION AND ANALYSIS OF FINANCIAL CONDITION
AND RESULTS OF OPERATIONS
The following discussion and analysis of our financial condition and results of operations should be read in conjunction with our consolidated financial statements and related notes appearing elsewhere in this prospectus. The following discussion contains “forward-looking statements” that reflect our future plans, estimates, beliefs and expected performance. We caution that assumptions, expectations, projections, intentions, or beliefs about future events may, and often do, vary from actual results and the differences can be material. Some of the key factors which could cause actual results to vary from our expectations include changes in natural gas prices, the timing of planned capital expenditures, availability of acquisitions, uncertainties in estimating proved reserves and forecasting production results, operational factors affecting the commencement or maintenance of producing wells, the condition of the capital markets generally, as well as our ability to access them, and uncertainties regarding environmental regulations or litigation and other legal or regulatory developments affecting our business, as well as those factors discussed below and elsewhere in this prospectus, all of which are difficult to predict. In light of these risks, uncertainties and assumptions, the forward-looking events discussed may not occur. See “Cautionary Statement Regarding Forward-Looking Statements.” Also, see the risk factors and other cautionary statements described under the heading “Risk Factors” included elsewhere in this prospectus. We do not undertake any obligation to publicly update any forward-looking statements except as otherwise required by applicable law.
On January 29, 2014, in connection with the closing of our IPO, we (i) completed our corporate reorganization and (ii) consummated our Marcellus JV Buy-In, each as described under “Prospectus Summary—Initial Public Offering, Corporate Reorganization and Related Transactions.” As such, information presented in “Management’s Discussion and Analysis of Financial Condition and Results of Operations” for the period from January 1, 2014 through January 29, 2014, as contained within the three months ended March 31, 2014, for the three months ended March 31, 2013 and for the years ended December 31, 2013 and 2012 pertain to the historical financial statements and results of operations of Rice Drilling B, our accounting predecessor, which reflects the 50% equity investment in our Marcellus joint venture owned by Rice Drilling B prior to January 29, 2014. Unless otherwise indicated, the information presented in “Management’s Discussion and Analysis of Financial Condition and Results of Operations” does not give pro forma effect to the completion of the corporate reorganization in connection with our IPO completed in January 2014 and the consummation of the Marcellus JV Buy-In.
Overview
We are an independent natural gas and oil company engaged in the acquisition, exploration and development of natural gas and oil properties in the Appalachian Basin. We are focused on creating shareholder value by identifying and assembling a portfolio of low-risk assets with attractive economic profiles and leveraging our technical and managerial expertise to deliver industry-leading results. We strive to be an early entrant into the core of a shale play by identifying what we believe to be the core of the play and aggressively executing our acquisition strategy to establish a largely contiguous acreage position.
As of March 31, 2014, we held approximately 43,978 net acres in the southwestern core of the Marcellus Shale, primarily in Washington County, Pennsylvania. We established our Marcellus Shale acreage position through a combination of largely contiguous acreage acquisitions in 2009 and 2010 and through numerous bolt-on acreage acquisitions. In 2012, we acquired approximately 33,499 of our 46,700 net acres in the southeastern core of the Utica Shale, primarily in Belmont County, Ohio. We believe this area to be the core of the Utica Shale based on publicly available drilling results. We operate all of our acreage in the Marcellus Shale and a majority of our acreage in the Utica Shale.
Since completing our first horizontal well in October 2010, our pro forma average net daily production has grown approximately 105 times to 209 MMcf/d for the first quarter of 2014. We brought four net horizontal
55
Table of Contents
Index to Financial Statements
Marcellus wells online during the first quarter of 2014. As of March 31, 2014, we had 1,313 gross (752 net) risked drilling locations, consisting of 349 gross (325 net) in the Marcellus Shale, 753 gross (233 net) in the Utica Shale and 211 gross (194 net) in the Upper Devonian Shale.
As of December 31, 2013, our pro forma estimated proved reserves were 602 Bcf, all of which were in southwestern Pennsylvania, with 42% proved developed and 100% natural gas.
Factors That Significantly Affect Our Financial Condition and Results of Operations
We derive substantially all of our revenues from the sale of natural gas that is produced from our interests in properties located in the Marcellus Shale. In the coming years, we expect to derive an increasing amount of our revenues from the sale of natural gas and, in a more limited amount, NGLs, that are produced from our interests in properties located in the Utica Shale. Our revenues, cash flow from operations and future growth depend substantially on factors beyond our control, such as economic, political and regulatory developments and competition from other sources of energy. Natural gas prices have historically been volatile and may fluctuate widely in the future due to a variety of factors, including but not limited to, prevailing economic conditions, supply and demand of hydrocarbons in the marketplace and geopolitical events such as wars or natural disasters. In the future, we will also be subject to fluctuations in oil and NGL prices. Sustained periods of low natural gas prices could materially and adversely affect our financial condition, our results of operations, the quantities of natural gas that we can economically produce and our ability to access capital.
We use commodity derivative instruments, such as swaps, puts and collars, to manage and reduce price volatility and other market risks associated with our natural gas production. These arrangements are structured to reduce our exposure to commodity price decreases, but they can also limit the benefit we might otherwise receive from commodity price increases. Our risk management activity is accomplished through over-the-counter commodity derivative contracts with large financial institutions. We use a combination of fixed price natural gas swaps; zero cost collars and deferred puts for which we receive a fixed price (via either swap price, floor of collar or put price) for future production in exchange for a payment of the variable market price received at the time future production is sold. The prices contained in these derivative contracts are based on NYMEX Henry Hub prices. The NYMEX Henry Hub price of natural gas is a widely used benchmark for the pricing of natural gas in the United States. The actual prices realized from the sale of natural gas differ from the quoted NYMEX Henry Hub price as a result of location differentials. Location differentials to NYMEX Henry Hub prices, also known as basis differential, result from variances in regional natural gas prices compared to NYMEX Henry Hub prices as a result of regional supply and demand factors. During the fourth quarter of 2013 we began hedging basis differentials associated with our natural gas production. We elected not to designate our current portfolio of commodity derivative contracts as hedges for accounting purposes. Therefore, changes in fair value of these derivative instruments are recognized in earnings.
Like other businesses engaged in the exploration and production of oil and natural gas, we face the challenge of natural production declines. As initial reservoir pressures are depleted, oil and natural gas production from a given well naturally decreases. Thus, a natural gas exploration and production company depletes part of its asset base with each unit of natural gas it produces. We attempt to overcome this natural decline by drilling to find additional reserves and acquiring more reserves than we produce. Our future growth will depend on our ability to enhance production levels from our existing reserves and to continue to add reserves in excess of production in a cost effective manner. Our ability to make capital expenditures to increase production from our existing reserves and to add reserves through drilling is dependent on our capital resources and can be limited by many factors, including our ability to access capital in a cost effective manner and to timely obtain drilling permits and regulatory approvals.
Our financial condition and results of operations, including the growth of production, cash flows and reserves, are driven by several factors, including:
| • | success in drilling new wells; |
56
Table of Contents
Index to Financial Statements
| • | natural gas prices; |
| • | our access to, and the cost of accessing end markets for our production; |
| • | the availability of attractive acquisition opportunities and our ability to execute them; |
| • | the amount of capital we invest in the leasing and development of our properties; |
| • | facility or equipment availability and unexpected downtime; |
| • | delays imposed by or resulting from compliance with regulatory requirements; and |
| • | the rate at which production volumes on our wells naturally decline. |
Factors That Significantly Affect Comparability of Our Financial Condition and Results of Operations
Our historical financial condition and results of operations for the periods presented may not be comparable, either from period to period or going forward, for the following reasons:
Public Company Expenses. As a result of our IPO, we will incur direct, incremental general and administrative (“G&A”) expenses as a result of being a publicly traded company, including, but not limited to, costs associated with annual and quarterly reports to stockholders, tax return preparation, independent auditor fees, investor relations activities, registrar and transfer agent fees, incremental director and officer liability insurance costs and independent director compensation.
Corporate Reorganization and Marcellus JV Buy-In. Information presented in “Management’s Discussion and Analysis of Financial Condition and Results of Operations” for the period from January 1, 2014 through January 29, 2014, as contained within the three months ended March 31, 2014, for the three months ended March 31, 2013 and for the years ended December 31, 2013 and 2012 pertain to the historical financial statements and results of operations of Rice Drilling B, our accounting predecessor, which reflects the 50% equity investment in our Marcellus joint venture owned by Rice Drilling B prior to January 29, 2014. As a result, the historical financial data may not give you an accurate indication of what our actual results would have been had the IPO, the corporate reorganization and the Marcellus JV Buy-In been completed at the beginning of the periods presented or of what our future results of operations are likely to be. For example, concurrently with the closing of our IPO, we acquired Alpha Holdings’ 50% interest in our Marcellus joint venture and, as a result, for periods following January 29, 2014, the complete results of operations of our Marcellus joint venture are consolidated into our results of operations, as opposed to periods prior to January 29, 2014, for which the results of operations of our Marcellus joint venture are not consolidated, but rather reflected as equity in income (loss) from our 50% equity investment therein.
Income Taxes. Although we are a corporation under the Internal Revenue Code subject to federal income taxes at a statutory rate of 35% of pretax earnings, we did not report any income tax benefit or expense for periods prior to the consummation of our IPO. Rice Drilling B, our accounting predecessor, is a limited liability company not subject to federal income taxes. However, in connection with the closing of the IPO, as a result of our corporate reorganization, we became a corporation subject to federal income tax and, as such, our future income taxes will be dependent upon our future taxable income. The change in tax status required the recognition of a deferred tax asset or liability for the initial temporary differences at the time of the change in status. Because we anticipate that our deductions primarily related to intangible drilling costs (“IDCs”) will exceed 2014 earnings, we expect to generate significant net operating loss assets and deferred tax liabilities. The resulting deferred tax liability of approximately $164.5 million was recorded in equity at the date of IPO. No current tax expense was recorded as of the date of the change in status. For periods following completion of the IPO, we began recording a federal income tax liability associated with our status as a corporation.
Increased Drilling Activity. We brought four net horizontal Marcellus wells online during the first quarter of 2014 and expect to bring 33 net horizontal Marcellus wells online during the remainder of 2014. From 2010 through June 2013, we ran a two-rig drilling program. In June 2013, we began operating a four-rig drilling
57
Table of Contents
Index to Financial Statements
program (consisting of two tophole rigs and two horizontal rigs) on our Marcellus Shale properties. In the first quarter of 2014, we increased to a six-rig drilling program (consisting of three tophole rigs and three horizontal rigs), two of which are operating in the Utica Shale. We expect to continue to operate a six-rig drilling program through the remainder of 2014. We expect our future drilling activity will become increasingly weighted towards the development of our Utica Shale acreage. The costs and production associated with the wells we expect to drill in the Utica Shale may differ substantially from those we have historically drilled in the Marcellus Shale.
Financing Arrangements. In April 2013, we entered into our $300.0 million Second Lien Term Loan Facility agreement (“Second Lien Term Loan Facility”). Net proceeds of our Second Lien Term Loan Facility of $288.3 million after offering fees and expenses were used to repay existing debt of $176.1 million and to partially fund the acquisition of approximately 33,499 net acres in the Utica Shale in Belmont County, Ohio. As of March 31, 2014, Rice Drilling B had a balance of $293.3 million relating to the Second Lien Term Loan Facility, which includes borrowings outstanding of $297.0 million less a discount of $3.7 million.
In April 2013, we entered into our $500.0 million Senior Secured Revolving Credit Facility (“Senior Secured Revolving Credit Facility”). Concurrently with the closing of our IPO, on January 29, 2014, the Senior Secured Revolving Credit Facility was amended to, among other things, allow for the corporate reorganization that was completed simultaneously with the closing of the IPO, add us as a guarantor, increase the maximum commitment amount to $1.5 billion, increase the borrowing base to $350.0 million as a result of the Marcellus JV Buy-In and lower the interest rate owed on amounts borrowed under the Senior Secured Revolving Credit Facility. We used a portion of the net proceeds of the IPO to repay $115.0 million of borrowings under our Senior Secured Revolving Credit Facility and $75.4 million of borrowings outstanding under the revolving credit facility of our Marcellus joint venture. As of March 31, 2014, the borrowing base under our Senior Secured Revolving Credit Facility was $350.0 million with no borrowings outstanding and $71.3 million of letters of credit outstanding. Availability under the revolving credit facility was $278.7 million as of March 31, 2014.
On April 25, 2014, we issued $900.0 million (our “Senior Notes Offering”) of 6.25% senior notes due 2022 (the “Notes”) in a private placement to eligible purchasers under Rule 144A and Regulation S of the Securities Act, which resulted in net proceeds to us of $882.7 million after deducting estimated expenses and underwriting discounts and commissions of approximately $17.3 million. We used $301.8 million of the net proceeds to repay and retire the Second Lien Term Loan Facility. Concurrently with the Senior Notes Offering, we, as borrower, and Rice Drilling B, as predecessor borrower, amended the Senior Secured Revolving Credit Facility (“Amended Credit Agreement”) to, among other things, assign all of Rice Drilling B’s rights and obligations under the Senior Secured Revolving Credit Facility to us, and we assumed all such rights and obligations as borrower under the Amended Credit Agreement.
During the first quarter of 2014, our capital expenditures were financed with proceeds from the IPO and net cash provided by operating activities. In the future, we may incur additional indebtedness to fund our acquisition and development activities. Please read “Capital Resources and Liquidity—Debt Agreements” below for additional discussion of our financing arrangements.
Sources of Revenues
Our revenues are derived from the sale of natural gas and do not include the effects of derivatives. Our revenues may vary significantly from period to period as a result of changes in volumes of production sold or changes in commodity prices.
58
Table of Contents
Index to Financial Statements
NYMEX Henry Hub prompt month contract prices are widely-used benchmarks in the pricing of natural gas. The following table provides the high and low prices for NYMEX Henry Hub prompt month contract prices and our differential to the average of those benchmark prices for the periods indicated.
| Year Ended December 31, |
Three Months Ended March 31, |
|||||||||||||||||||
| 2013(1) | 2012(1) | 2011(1) | 2014(2) | 2013(2) | ||||||||||||||||
| NYMEX Henry Hub High |
$ | 4.46 | $ | 3.90 | $ | 4.85 | $ | 7.94 | $ | 4.09 | ||||||||||
| NYMEX Henry Hub Low |
3.11 | 1.91 | 2.99 | 3.96 | 3.08 | |||||||||||||||
| Differential to Average NYMEX Henry Hub |
(0.01 | ) | 0.08 | (0.12 | ) | 0.15 | 0.11 | |||||||||||||
| (1) | Differential is calculated by comparing the average NYMEX Henry Hub price to our volume weighted average realized price per MMBtu, including our proportionate 50% share of the volumes sold by our Marcellus joint venture. |
| (2) | Differential is calculated by comparing the average NYMEX Henry Hub price to our volume weighted average realized price per MMBtu before hedges, including 50% of the volumes sold by our Marcellus joint venture for the period from January 1, 2014 through January 28, 2014, contained within the three months ended March 31, 2014 and for the three months ended March 31, 2013. The remainder of the three months ended March 31, 2014 reflect (i) the completion of the corporate reorganization in connection with our initial public offering and (ii) the consummation of the Marcellus JV Buy-In, each on January 29, 2014 |
We sell a substantial majority of our production to a single natural gas marketer, Sequent Energy Management, LP (“Sequent”). For the year ended December 31, 2013, sales to Sequent and Dominion Field Services (“Dominion”) represented 94% and 6% of our total sales, respectively. For the three months ended March 31, 2014, sales to Sequent represented 92% of our total sales. If our natural gas marketers decided to stop purchasing natural gas from us, our revenues could decline and our operating results and financial condition could be harmed. Although a substantial portion of production is purchased by these major customers, we do not believe the loss of one or both customers would have a material adverse effect on our business, as other customers or markets would be accessible to us.
Principal Components of our Cost Structure
| • | Lease operating expense. These are the day to day operating costs incurred to maintain production of our natural gas producing wells. Such costs include produced water disposal, maintenance and repairs. Cost levels for these expenses can vary based on supply and demand for oilfield services. |
| • | Gathering, compression and transportation. These are costs incurred to bring natural gas to the market. Such costs include the costs to operate and maintain our low- and high-pressure gathering and compression systems as well as fees paid to third parties who operate low- and high-pressure gathering systems that transport our natural gas. We often enter into firm transportation contracts that secure takeaway capacity that includes minimum volume commitments, the cost for which is included in these expenses. |
| • | Production taxes and impact fees. Pennsylvania imposes an annual impact fee on each producing shale well for a period of 15 years. Ohio imposes a production tax which is based upon annual production. As we expand our operations into the Utica Shale in Ohio, the proportion of our production and producing wells from each state may change over time and, as a result, the proportion of our production taxes and impact fees will vary depending on our quantities produced from the Utica Shale, the number of producing shale wells in Pennsylvania, and the applicable production tax rates and impact fees then in effect. |
| • | Exploration expense. These include geological and geophysical costs, seismic costs, delay rental payments and costs incurred in the development of an unsuccessful exploratory well. |
59
Table of Contents
Index to Financial Statements
| • | General and administrative expense. We expect that we will incur additional general and administrative expenses as a result of being a publicly-traded company. Please see “—Factors That Significantly Affect Comparability of Our Financial Condition and Results of Operations—Public Company Expenses.” In addition, certain of our employees hold incentive units in Rice Holdings and NGP Holdings that entitle the holder to a portion of distributions by Rice Holdings and NGP Holdings. While any such distributions did not and will not involve any cash payment by us, we recognized non-cash compensation expense of $73.8 million during the first quarter of 2014. As of March 31, 2014, the unrecognized compensation expense related to such incentive units is approximately $93.7 million, which will be recognized over the remaining expected service period. |
| • | Depreciation, depletion and amortization. Depreciation, depletion and amortization (“DD&A”) includes the systematic expensing of the capitalized costs incurred to acquire, explore and develop natural gas. As a “successful efforts” company, we capitalize all costs associated with our acquisition and development efforts and all successful exploration efforts and allocate these costs to each unit of production using the units of production method. |
| • | Write-down of abandoned leases. These write-downs include the cost of expensing certain lease acquisition costs associated with properties that we no longer expect to drill. |
| • | Interest expense. We have financed a portion of our working capital requirements and property acquisitions with borrowings under our revolving credit facility and term loan. As a result, we incur interest expense that is affected by the level of drilling, completion and acquisition activities, as well as fluctuations in interest rates and our financing decisions. We also incur interest expense on our convertible debentures. We will likely continue to incur significant interest expense as we continue to grow. To date, we have not entered into any interest rate hedging arrangements to mitigate the effects of interest rate changes. Additionally, we capitalized $8.0 million, $7.7 million and $5.4 million of interest expense for the years ended December 31, 2013, 2012 and 2011, respectively. |
| • | Derivative fair value loss (gain). We utilize commodity derivative contracts to reduce our exposure to fluctuations in the price of natural gas. We recognize gains and losses associated with our open commodity derivative contracts as commodity prices and the associated fair value of our commodity derivative contracts change. The commodity derivative contracts we have in place are not designated as hedges for accounting purposes. Consequently, these commodity derivative contracts are recorded at fair value at each balance sheet date with changes in fair value recognized as a gain or loss in our results of operations. Cash flow is only impacted to the extent the actual settlements under the contracts result in making a payment to or receiving a payment from the counterparty. |
| • | Equity in income (loss) of joint ventures. This line item represents our proportionate share of earnings and losses from our equity method investments, including our Marcellus joint venture. Concurrently with the closing of our IPO, we acquired Alpha Holdings’ 50% interest in our Marcellus joint venture and, as a result, for periods following the completion of our IPO, the results of operations of our Marcellus joint venture will be included in our results of operations. |
| • | Income tax expense. Rice Drilling B, our accounting predecessor, is a limited liability company not subject to federal income taxes. Accordingly, no provision for federal income taxes has been provided for in our historical results of operations because taxable income was passed through to Rice Drilling B’s members. Although we are a corporation under the Internal Revenue Code, subject to federal income taxes at a statutory rate of 35% of pretax earnings, we did not report any income tax benefit or expense until the consummation of our IPO. Based on our deductions primarily related to IDCs that are expected to exceed 2014 earnings, we expect to generate significant net operating loss deferred tax assets and deferred tax liabilities. We may report and pay state income or franchise taxes in periods where our IDC deductions do not exceed our taxable income or where state income or franchise taxes are determined on another basis. |
60
Table of Contents
Index to Financial Statements
How We Evaluate Our Operations
In evaluating our financial results, we focus on production, revenues, per unit cash production costs, G&A and our Adjusted EBITDAX. We define Adjusted EBITDAX as net income (loss) before interest expense or interest income; income taxes; write-down of abandoned leases; impairments; DD&A; amortization of deferred financing costs; equity in (income) loss in joint ventures; derivative fair value (gain) loss, excluding net cash receipts on settled derivative instruments; non-cash compensation expense; (gain) loss from sale of interest in gas properties; (gain) loss on acquisition; (gain) loss on extinguishment of debt; write-off of deferred financing costs and exploration expenses. Adjusted EBITDAX is not a measure of net income as determined by United States generally accepted accounting principles, or GAAP. For a reconciliation of Adjusted EBITDAX to net income (loss), see “Prospectus Summary—Summary Historical Consolidated and Unaudited Pro Forma Financial Data—Non-GAAP Financial Measure.”
Management believes that the presentation of our Adjusted EBITDAX provides information useful in assessing our financial condition and results of operations and that Adjusted EBITDAX is a widely accepted financial indicator of a company’s results of operations.
Adjusted EBITDAX may not be comparable to similarly titled measures used by other companies and should be considered in conjunction with net income (loss) and other performance measures prepared in accordance with GAAP, such as operating income or cash flows from operating activities. Adjusted EBITDAX has important limitations as an analytical tool because it excludes certain items that affect net income (loss) attributable to common stockholders. Adjusted EBITDAX should not be considered in isolation or as a substitute for an analysis of our results as reported under GAAP.
We also evaluate our rates of return on invested capital in our wells. We believe the quality of our assets combined with our technical and managerial expertise can generate attractive rates of return as we develop our core acreage position in the Marcellus and Utica Shales. Additionally, by focusing on concentrated acreage positions, we can build and own centralized midstream infrastructure, including low- and high-pressure gathering lines, compression facilities and water pipeline systems, which enable us to reduce reliance on third-party operators, minimize costs and increase our returns.
We measure the expected return of our wells based on EUR and the related costs of acquisition, development and production. As of March 31, 2014, we had drilled and brought online 41 gross horizontal Marcellus wells with lateral lengths ranging from 2,444 feet to 9,147 feet and averaging 5,764 feet. Our EUR from our 37 producing wells at December 31, 2013, as estimated by our independent reserve engineer, NSAI, and normalized for each 1,000 feet of horizontal lateral, range from 1.2 Bcf per 1,000 feet to 3.0 Bcf per 1,000 feet, with an average of 1.9 Bcf per 1,000 feet.
Pro Forma Results of Operations
Three Months Ended March 31, 2014
Below are some highlights of our pro forma financial and operating results for the three months ended March 31, 2014:
| • | Our natural gas sales were $102.4 million in the three months ended March 31, 2014. |
| • | Our production volumes were 18,801 million cubic feet (“MMcf”) in the three months ended March 31, 2014. |
| • | Our per unit cash production costs were $0.79 per thousand cubic feet (“Mcf”) in the three months ended March 31, 2014. |
| • | Our general and administrative expenses were $11.6 million in the three months ended March 31, 2014. |
61
Table of Contents
Index to Financial Statements
The following tables set forth selected pro forma financial and operating data for the three months ended March 31, 2014:
| Pro Forma Rice Energy Inc. |
||||
| Three Months Ended March 31, 2014 |
||||
| Natural gas sales (in thousands): |
$ | 102,402 | ||
| Production data (MMcf): |
18,801 | |||
| Average prices before effects of hedges per Mcf: |
$ | 5.45 | ||
| Average realized prices after effects of hedges per Mcf(1): |
$ | 4.82 | ||
| Average costs per Mcf: |
||||
| Lease operating |
$ | 0.30 | ||
| Gathering, compression and transportation |
0.45 | |||
| Production taxes and impact fees |
0.04 | |||
| General and administrative |
0.62 | |||
| Depreciation, depletion and amortization |
1.51 | |||
| (1) | The effect of hedges includes realized gains and losses on commodity derivative transactions. |
| Three Months Ended March 31, 2014 | ||||||||||||||||
| Rice Energy Inc. | Consolidation of Marcellus JV Pro Forma Adjustments |
Reorganization and Offering Pro Forma Adjustments |
Pro Forma | |||||||||||||
| (in thousands) | ||||||||||||||||
| Revenues: |
||||||||||||||||
| Natural gas sales |
$ | 90,466 | $ | 11,936 | $ | — | $ | 102,402 | ||||||||
|
|
|
|
|
|
|
|
|
|||||||||
| Total revenues |
90,466 | 11,936 | — | 102,402 | ||||||||||||
| Operating expenses: |
||||||||||||||||
| Lease operating |
5,187 | 420 | — | 5,607 | ||||||||||||
| Gathering, compression and transportation |
7,130 | 1,390 | — | 8,520 | ||||||||||||
| Production taxes and impact fees |
639 | 69 | — | 708 | ||||||||||||
| Exploration |
486 | — | — | 486 | ||||||||||||
| Incentive unit expense |
73,802 | — | — | 73,802 | ||||||||||||
| General and administrative |
11,521 | 72 | — | 11,593 | ||||||||||||
| Depreciation, depletion and amortization |
25,507 | 2,856 | — | 28,363 | ||||||||||||
|
|
|
|
|
|
|
|
|
|||||||||
| Total operating expenses |
124,272 | 4,807 | — | 129,079 | ||||||||||||
|
|
|
|
|
|
|
|
|
|||||||||
| Operating income (loss) |
(33,806 | ) | 7,129 | — | (26,677 | ) | ||||||||||
| Interest expense |
(7,042 | ) | (235 | ) | — | (7,277 | ) | |||||||||
| Gain on purchase of Marcellus joint venture |
203,579 | — | (2,656 | ) | 200,923 | |||||||||||
| Other income |
602 | — | — | 602 | ||||||||||||
| Loss on derivative instruments |
(20,380 | ) | (12,191 | ) | — | (32,571 | ) | |||||||||
| Amortization of deferred financing costs |
(489 | ) | (15 | ) | — | (504 | ) | |||||||||
| Loss on extinguishment of debt |
(143 | ) | — | — | (143 | ) | ||||||||||
| Write-off of deferred financing costs |
(836 | ) | — | — | (836 | ) | ||||||||||
| Equity in income (loss) of joint ventures |
(2,656 | ) | — | 2,656 | — | |||||||||||
|
|
|
|
|
|
|
|
|
|||||||||
| Income (loss) before income taxes |
138,829 | (5,312 | ) | — | 133,517 | |||||||||||
| Income tax expense |
(9,375 | ) | — | — | (9,375 | ) | ||||||||||
|
|
|
|
|
|
|
|
|
|||||||||
| Net income (loss) |
$ | 129,454 | $ | (5,312 | ) | $ | — | $ | 124,142 | |||||||
|
|
|
|
|
|
|
|
|
|||||||||
62
Table of Contents
Index to Financial Statements
Historical Results of Operations
Three Months Ended March 31, 2014 Compared to Three Months Ended March 31, 2013
Below are some highlights of our financial and operating results for the three months ended March 31, 2014:
| • | Our natural gas sales were $90.5 million in the three months ended March 31, 2014 compared to $13.0 million in the three months ended March 31, 2013. |
| • | Our production volumes were 16,390 MMcf in the three months ended March 31, 2014 compared to 3,454 MMcf in the three months ended March 31, 2013. |
| • | Our per unit cash production costs were $0.80 per Mcf in the three months ended March 31, 2014 compared to $0.85 per Mcf in the three months ended March 31, 2013. |
| • | Our G&A expenses were $11.5 million in the three months ended March 31, 2014 compared to $1.7 million for the three months ended March 31, 2013. |
The following tables set forth selected operating and financial data for the three months ended March 31, 2014 compared to the three months ended March 31, 2013:
| Rice Energy Inc. | Rice Drilling B(1) | Amount of Change |
||||||||||
| Three Months Ended March 31, | ||||||||||||
| 2014 | 2013 | |||||||||||
| Natural gas sales (in thousands): |
$ | 90,466 | $ | 13,049 | 77,417 | |||||||
| Production data (MMcf): |
16,390 | 3,454 | 12,936 | |||||||||
| Average prices before effects of hedges per Mcf: |
$ | 5.52 | $ | 3.78 | 1.74 | |||||||
| Average realized prices after effects of hedges per Mcf(2): |
$ | 4.84 | $ | 3.72 | 1.12 | |||||||
| Average costs per Mcf: |
||||||||||||
| Lease operating |
$ | 0.32 | $ | 0.36 | (0.04 | ) | ||||||
| Gathering, compression and transportation |
0.44 | 0.44 | — | |||||||||
| Production taxes and impact fees |
0.04 | 0.05 | (0.01 | ) | ||||||||
| General and administrative |
0.70 | 0.51 | 0.19 | |||||||||
| Depreciation, depletion and amortization |
1.56 | 1.49 | 0.07 | |||||||||
| (1) | Amounts presented for periods prior to January 29, 2014 pertain to Rice Drilling B, our accounting predecessor, which reflects the 50% equity investment in our Marcellus joint venture owned by Rice Drilling B prior to January 29, 2014. Amounts presented for the remainder of the three months ended March 31, 2014, reflects (i) the completion of the corporate reorganization in connection with our initial public offering and (ii) the consummation of the Marcellus JV Buy-In, each on January 29, 2014. |
63
Table of Contents
Index to Financial Statements
| (2) | The effect of hedges includes realized gains and losses on commodity derivative transactions. |
| Rice Energy Inc. | Rice Drilling B | Amount of Change |
||||||||||
| Three Months Ended March 31, | ||||||||||||
| 2014 | 2013 | |||||||||||
| (in thousands) | ||||||||||||
| Revenues: |
||||||||||||
| Natural gas sales |
$ | 90,466 | $ | 13,049 | 77,417 | |||||||
| Other revenue |
— | 184 | (184 | ) | ||||||||
| Total revenues |
90,466 | 13,233 | 77,233 | |||||||||
| Operating expenses: |
||||||||||||
| Lease operating |
5,187 | 1,236 | 3,951 | |||||||||
| Gathering, compression and transportation |
7,130 | 1,528 | 5,602 | |||||||||
| Production taxes and impact fees |
639 | 169 | 470 | |||||||||
| Exploration |
486 | 898 | (412 | ) | ||||||||
| Incentive unit expense |
73,802 | — | 73,802 | |||||||||
| General and administrative |
11,521 | 1,743 | 9,778 | |||||||||
| Depreciation, depletion and amortization |
25,507 | 5,131 | 20,376 | |||||||||
|
|
|
|
|
|
|
|||||||
| Total operating expenses |
124,272 | 10,705 | 113,567 | |||||||||
|
|
|
|
|
|
|
|||||||
| Operating income (loss) |
(33,806 | ) | 2,528 | (36,334 | ) | |||||||
| Interest expense |
(7,042 | ) | (1,915 | ) | (5,127 | ) | ||||||
| Gain on purchase of Marcellus joint venture |
203,579 | — | 203,579 | |||||||||
| Other income |
602 | 248 | 354 | |||||||||
| Loss on derivative instruments |
(20,380 | ) | (4,993 | ) | (15,387 | ) | ||||||
| Amortization of deferred financing costs |
(489 | ) | (1,865 | ) | 1,376 | |||||||
| Loss on extinguishment of debt |
(143 | ) | — | (143 | ) | |||||||
| Write-off of deferred financing costs |
(836 | ) | — | (836 | ) | |||||||
| Equity in loss of joint ventures |
(2,656 | ) | (778 | ) | (1,878 | ) | ||||||
|
|
|
|
|
|
|
|||||||
| Income (loss) before income taxes |
138,829 | (6,775 | ) | 145,604 | ||||||||
| Income tax expense |
(9,375 | ) | — | (9,375 | ) | |||||||
|
|
|
|
|
|
|
|||||||
| Net income (loss) |
$ | 129,454 | $ | (6,775 | ) | 136,229 | ||||||
|
|
|
|
|
|
|
|||||||
| Earnings (loss) per share—basic |
$ | 1.04 | $ | (0.05 | ) | 1.09 | ||||||
| Earnings (loss) per share—diluted |
$ | 1.03 | $ | (0.05 | ) | 1.08 | ||||||
Natural gas sales revenues. The $77.4 million increase in natural gas sales was a result of an increase in production in the first quarter of 2014 compared to the first quarter of 2013. The increase in production was a result of increased drilling and completion activity in Washington County, Pennsylvania. In addition, average prices before the effect of hedges increased in 2014 compared to 2013.
Lease operating expenses. The $4.0 million increase in lease operating expenses is attributable to higher production during 2014. However, lease operating expenses per unit of production decreased due to improved efficiencies, primarily more producing wells per pad and lower fixed costs per well.
Gathering, compression and transportation. The $5.6 million increase in gathering, compression and transportation expenses is primarily attributable to increased firm transportation contracts in the first quarter of 2014 compared to the first quarter of 2013.
Incentive unit expense. The $73.8 million increase in incentive unit expense was due to the payment by Daniel J. Rice III of approximately $3.4 million related to his incentive unit burden, payment by NGP Holdings of approximately $4.4 million related to payments made at IPO due to the New Tier I payout multiple being achieved and approximately $66.0 million of non-cash compensation expense related to those units still outstanding, relating to the service period from date of grant through March 31, 2014.
64
Table of Contents
Index to Financial Statements
G&A. The $9.8 million increase was primarily attributable to the additions of personnel to support our growth activities.
DD&A. The $20.4 million increase was a result of an increase in production and higher capitalized costs in the first quarter of 2014 compared to 2013. The increase in capitalized costs is consistent with our expanded drilling program and increased production during the period.
Interest expense. The $5.1 million increase was a result of higher levels of average borrowings outstanding during the first quarter of 2014 in order to fund our drilling programs.
Gain on purchase of Marcellus joint venture. The $203.6 million gain on acquisition in the first quarter of 2014 was attributable to the Marcellus JV Buy-In transaction. As a result of our acquiring the remaining ownership in our Marcellus joint venture, we are required to remeasure our equity investment at fair value, which resulted in a non-recurring gain of approximately $203.6 million during the three months ended March 31, 2014.
Loss on derivative instruments. The $20.4 million loss on derivative contracts in the first quarter of 2014 was due to an increase in underlying commodity prices, comprised of $9.2 million in unrealized losses and $11.2 million of cash payments on settlement of maturing contracts. In the first quarter of 2013, the $5.0 million loss was comprised of $4.8 million in unrealized losses and $0.2 million of cash payments made on settlement of maturing contracts. The increased loss in the first quarter of 2014 as compared to 2013 was attributable to an increase in market prices accompanied by a greater hedged volume of our natural gas production.
Year Ended December 31, 2013 Compared to Year Ended December 31, 2012
Below are some highlights of our financial and operating results for the year ended December 31, 2013:
| • | Our production volumes, including our 50% share of the production in our Marcellus joint venture, increased 164% to 34,438 MMcf in the year ended December 31, 2013 compared to 13,065 MMcf in the year ended December 31, 2012. |
| • | Our natural gas sales increased 229% to $87.8 million in the year ended December 31, 2013 compared to $26.7 million in the year ended December 31, 2012. |
| • | Our per unit cash production costs decreased 15% to $1.60 per Mcf in the year ended December 31, 2013 compared to $1.88 per Mcf in the year ended December 31, 2012. Cash production costs include amounts paid for Pennsylvania impact fees of $0.07 per Mcf and $0.16 per Mcf for the year ended December 31, 2013 and December 31, 2012, respectively. Pennsylvania began assessing an impact fee on wells spud in the first quarter of 2012 and retroactively assessed fees for wells spud prior to 2012. Of the $0.16 per Mcf incurred in the year ended December 31, 2012, approximately $0.07 per Mcf relates to charges assessed by the state of Pennsylvania for wells spud prior to 2012. The remaining $0.09 relates to wells spud in 2012. |
| • | Our general and administrative expenses increased 123% to $17.0 million in the year ended December 31, 2013 compared to $7.6 million for the year ended December 31, 2012. |
65
Table of Contents
Index to Financial Statements
The following tables set forth selected operating and financial data for the year ended December 31, 2013 compared to the year ended December 31, 2012:
| Rice Drilling B | Amount of Change |
|||||||||||
| For the Year Ended December 31, |
||||||||||||
| 2013 | 2012 | |||||||||||
| (in thousands) | ||||||||||||
| Revenues: |
||||||||||||
| Natural gas sales |
$ | 87,847 | $ | 26,743 | $ | 61,104 | ||||||
| Other revenue |
757 | 457 | 300 | |||||||||
|
|
|
|
|
|
|
|||||||
| Total revenues |
88,604 | 27,200 | 61,404 | |||||||||
| Operating expenses: |
||||||||||||
| Lease operating |
8,309 | 3,688 | 4,621 | |||||||||
| Gathering, compression and transportation |
9,774 | 3,754 | 6,020 | |||||||||
| Production taxes and impact fees |
1,629 | 1,382 | 247 | |||||||||
| Exploration |
9,951 | 3,275 | 6,676 | |||||||||
| Restricted unit expense |
32,906 | — | 32,906 | |||||||||
| General and administrative |
16,953 | 7,599 | 9,354 | |||||||||
| Depreciation, depletion and amortization |
32,815 | 14,149 | 18,666 | |||||||||
| Write-down of abandoned leases |
— | 2,253 | (2,253 | ) | ||||||||
| Loss from sale of interest in gas properties |
4,230 | — | 4,230 | |||||||||
| Total operating expenses |
116,567 | 36,100 | 80,467 | |||||||||
|
|
|
|
|
|
|
|||||||
| Operating loss |
(27,963 | ) | (8,900 | ) | (19,063 | ) | ||||||
|
|
|
|
|
|
|
|||||||
| Other income (expense): |
||||||||||||
| Interest expense |
(17,915 | ) | (3,487 | ) | (14,428 | ) | ||||||
| Other income (expense) |
(357 | ) | 112 | (469 | ) | |||||||
| Gain (loss) on derivative instruments |
6,891 | (1,381 | ) | 8,272 | ||||||||
| Amortization of deferred financing costs |
(5,230 | ) | (7,220 | ) | 1,990 | |||||||
| Loss on extinguishment of debt |
(10,622 | ) | — | (10,622 | ) | |||||||
| Equity in income of joint ventures |
19,420 | 1,532 | 17,888 | |||||||||
|
|
|
|
|
|
|
|||||||
| Total other income (expense) |
(7,813 | ) | (10,444 | ) | 2,631 | |||||||
|
|
|
|
|
|
|
|||||||
| Net loss |
$ | (35,776 | ) | $ | (19,344 | ) | $ | (16,432 | ) | |||
|
|
|
|
|
|
|
|||||||
| Natural gas sales (in thousands): |
||||||||||||
| Rice Drilling B |
$ | 87,847 | $ | 26,743 | 61,104 | |||||||
| Marcellus joint venture(1) |
45,339 | 13,142 | 32,197 | |||||||||
| Production data (MMcf): |
||||||||||||
| Rice Drilling B |
22,995 | 8,769 | 14,226 | |||||||||
| Marcellus joint venture(1) |
11,443 | 4,296 | 7,147 | |||||||||
| Average prices before effects of hedges per Mcf: |
||||||||||||
| Rice Drilling B |
3.82 | 3.05 | 0.77 | |||||||||
| Marcellus joint venture |
3.96 | 3.06 | 0.90 | |||||||||
| Average realized prices after effects of hedges per Mcf(2): |
||||||||||||
| Rice Drilling B |
3.85 | 3.15 | 0.70 | |||||||||
| Marcellus joint venture |
4.16 | 3.07 | 1.09 | |||||||||
| Average costs per Mcf: |
||||||||||||
| Rice Drilling B |
||||||||||||
| Lease operating |
0.36 | 0.42 | (0.06 | ) | ||||||||
| Gathering, compression and transportation |
0.43 | 0.43 | ||||||||||
| General and administrative |
0.74 | 0.87 | (0.13 | ) | ||||||||
| Depletion, depreciation and amortization |
1.43 | 1.61 | (0.18 | ) | ||||||||
| Marcellus joint venture: |
||||||||||||
| Lease operating |
0.36 | 0.39 | (0.03 | ) | ||||||||
| Gathering, compression and transportation |
0.68 | 0.78 | (0.10 | ) | ||||||||
| General and administrative |
0.14 | 0.24 | (0.10 | ) | ||||||||
| Depletion, depreciation and amortization |
1.09 | 1.10 | (0.01 | ) | ||||||||
66
Table of Contents
Index to Financial Statements
| (1) | Amounts presented for our Marcellus joint venture give effect to our 50% equity investment therein during the periods presented. |
| (2) | The effect of hedges includes realized gains and losses on commodity derivative transactions. |
Natural gas sales revenues. The $61.1 million increase was a result of an increase in production of 14,226 MMcf in 2013 compared to the prior year. The increase in production was a result of increased drilling and completion activity in Washington County, Pennsylvania. In addition, average prices before the effect of hedges increased from $3.05 per Mcf in 2012 to $3.82 per Mcf in 2013.
Lease operating expenses. The $4.6 million increase in lease operating expenses is attributable to higher production during 2013. However, lease operating expenses per unit of production decreased due to having more wells in early stages of production in 2013 as compared to 2012.
Gathering, compression and transportation. The $6.0 million increase in gathering, compression and transportation expenses is primarily attributable to increased production. The cost per Mcf of these expenses increased during 2013 primarily as a result of increased utilization of firm transportation.
Restricted unit expense. The $32.9 million increase in restricted unit expense relates to an increase in the fair value of the units during 2013. For a description of the restricted units, please see Note 9 to the audited consolidated financial statements of our predecessor. In connection with our IPO, the restricted units were exchanged for shares of our common stock. Accordingly, we will not recognize such restricted unit expense subsequent to the exchange.
G&A. The $9.4 million increase was primarily attributable to the additions of personnel to support our growth activities.
DD&A. The $18.7 million increase was a result of higher average capitalized costs in 2013 compared to the prior year. The increase in capitalized costs is consistent with our expanded drilling program and increased production during the period.
Write-down of abandoned leases. The $2.3 million write-down in 2012 was attributable to our abandonment of certain leases that are outside our core areas of drilling focus.
Exploration expense. The $6.7 million increase in 2013 was primarily the result of the $8.1 million write-off of costs associated with the abandonment of the Bigfoot 7H in the fourth quarter of 2013.
(Gain) loss from sale of interest in gas properties. The $4.2 million loss from sale of interest in gas properties was attributable to the sale of interests in noncore assets in Lycoming County, Pennsylvania.
Gain (loss) on derivative instruments. The $6.9 million gain on derivatives contracts in 2013 was comprised of $6.2 million in unrealized gains and $0.7 million of cash receipts received on settlement of maturing contracts. In 2012, the $1.4 million loss was comprised of $2.3 million in unrealized losses and $0.9 million of cash receipts received on settlement of maturing contracts. The gain in 2013 was due to a decrease in market prices after we executed significant derivative contracts.
Interest expense. The $14.4 million increase was a result of higher levels of average borrowings outstanding during 2013 in order to fund our drilling programs.
Loss on extinguishment of debt. The $10.6 million loss on extinguishment of debt in 2013 was attributable to our repurchasing $53.1 million of outstanding convertible debentures, resulting in a put premium of $10.6 million being paid in accordance with the terms thereof.
67
Table of Contents
Index to Financial Statements
Equity in income (loss) of joint ventures. The $17.9 million increase was primarily a result of operations at our Marcellus joint venture. Approximately $1.7 million of the increased income from our Marcellus joint venture was attributable to net realized gains associated with its hedging program. Substantially all of the remaining increase in income was due to higher revenues, attributable to increased production volumes resulting from the execution of our Marcellus joint venture’s drilling program.
Year Ended December 31, 2012 Compared to Year Ended December 31, 2011
Below are some highlights of our financial and operating results for the year ended December 31, 2012:
| • | Our production volumes, including our 50% share of the production in our Marcellus joint venture, increased 219% to 13,065 MMcf in the year ended December 31, 2012 compared to 4,089 MMcf in the year ended December 31, 2011. |
| • | Our natural gas sales increased 91% to $26.7 million in the year ended December 31, 2012 compared to $14.0 million in the year ended December 31, 2011. |
| • | Our per unit cash production costs decreased 14% to $1.88 per Mcf in the year ended December 31, 2012 compared to $2.18 per Mcf in the year ended December 31, 2011. Cash production costs include amounts paid for Pennsylvania impact fees of $0.16 per Mcf for year ended December 31, 2012. Pennsylvania began assessing an impact fee in the first quarter of 2012 and retroactively assessed fees for wells spud prior to 2012. Of the $0.16 per Mcf incurred in the year ended December 31, 2012, approximately $0.07 per Mcf relates to charges assessed by the state of Pennsylvania for wells spud prior to 2012. The remaining $0.09 relates to wells spud in 2012. |
| • | Our total operating expenses increased 180% to $43.3 million in the year ended December 31, 2012 compared to $15.5 million in the year ended December 31, 2011. This increase was generally in line with our increase in revenue resulting from the execution of our drilling program. |
68
Table of Contents
Index to Financial Statements
The following table sets forth selected operating and financial data for the year ended December 31, 2012 compared to the year ended December 31, 2011:
| Rice Drilling B | Amount of Change |
|||||||||||
| For the Year Ended December 31, |
||||||||||||
| 2012 | 2011 | |||||||||||
| (in thousands) | ||||||||||||
| Revenues: |
||||||||||||
| Natural gas sales |
$ | 26,743 | $ | 13,972 | $ | 12,771 | ||||||
| Other revenue |
457 | 457 | ||||||||||
|
|
|
|
|
|
|
|||||||
| Total revenues |
27,200 | 13,972 | 13,228 | |||||||||
| Operating expenses: |
||||||||||||
| Lease operating |
3,688 | 1,617 | 2,071 | |||||||||
| Gathering, compression and transportation |
3,754 | 540 | 3,214 | |||||||||
| Production taxes and impact fees |
1,382 | — | 1,382 | |||||||||
| Exploration |
3,275 | 660 | 2,615 | |||||||||
| Restricted unit expense |
— | 170 | (170 | ) | ||||||||
| General and administrative |
7,599 | 5,208 | 2,391 | |||||||||
| Depreciation, depletion and amortization |
14,149 | 5,981 | 8,168 | |||||||||
| Write-down of abandoned leases |
2,253 | 109 | 2,144 | |||||||||
| Gain from sale of interest in gas properties |
— | (1,478 | ) | 1,478 | ||||||||
|
|
|
|
|
|
|
|||||||
| Total operating expenses |
36,100 | 12,807 | 23,293 | |||||||||
|
|
|
|
|
|
|
|||||||
| Operating income (loss) |
(8,900 | ) | 1,165 | (10,065 | ) | |||||||
|
|
|
|
|
|
|
|||||||
| Other income (expense): |
||||||||||||
| Interest expense |
(3,487 | ) | (531 | ) | (2,956 | ) | ||||||
| Other income |
112 | 161 | (49 | ) | ||||||||
| Amortization of deferred financing costs |
(7,220 | ) | (2,675 | ) | (4,545 | ) | ||||||
| Gain (loss) on derivative instruments |
(1,381 | ) | 574 | (1,955 | ) | |||||||
| Equity in income of joint ventures |
1,532 | 370 | 1,162 | |||||||||
|
|
|
|
|
|
|
|||||||
| Total other income (expenses) |
(10,444 | ) | (2,101 | ) | (8,343 | ) | ||||||
|
|
|
|
|
|
|
|||||||
| Net loss |
$ | (19,344 | ) | $ | (936 | ) | $ | (18,408 | ) | |||
|
|
|
|
|
|
|
|||||||
| Natural gas sales (in thousands): |
||||||||||||
| Rice Drilling B |
$ | 26,743 | $ | 13,972 | $ | 12,771 | ||||||
| Marcellus joint venture(1) |
13,142 | 2,872 | 10,270 | |||||||||
| Production data (MMcf): |
||||||||||||
| Rice Drilling B |
8,769 | 3,392 | 5,377 | |||||||||
| Marcellus joint venture(1) |
4,296 | 697 | 3,599 | |||||||||
| Average prices before effects of hedges per Mcf: |
||||||||||||
| Rice Drilling B |
3.05 | 4.12 | (1.07 | ) | ||||||||
| Marcellus joint venture |
3.06 | 4.12 | (1.06 | ) | ||||||||
| Average realized prices after effects of hedges per Mcf(2): |
||||||||||||
| Rice Drilling B |
3.15 | 4.29 | (1.14 | ) | ||||||||
| Marcellus joint venture |
3.07 | 4.12 | (1.05 | ) | ||||||||
| Average costs per Mcf: |
||||||||||||
| Rice Drilling B |
||||||||||||
| Lease operating |
0.42 | 0.48 | (0.06 | ) | ||||||||
| Gathering, compression and transportation |
0.43 | 0.16 | 0.27 | |||||||||
| General and administrative |
0.87 | 1.54 | (0.67 | ) | ||||||||
| Depletion, depreciation and amortization |
1.61 | 1.76 | (0.15 | ) | ||||||||
| Marcellus joint venture: |
||||||||||||
| Lease operating |
0.39 | 0.51 | (0.12 | ) | ||||||||
| Gathering, compression and transportation |
0.78 | 0.04 | 0.74 | |||||||||
| General and administrative |
0.24 | 0.26 | (0.02 | ) | ||||||||
| Depletion, depreciation and amortization |
1.10 | 1.57 | (0.47 | ) | ||||||||
69
Table of Contents
Index to Financial Statements
| (1) | Amounts presented for our Marcellus joint venture give effect to our 50% equity investment therein during the period presented. |
| (2) | The effect of hedges includes realized gains and losses on commodity derivative transactions. |
Natural gas sales revenues. The $12.8 million increase was a result of an increase in production of 5,377 MMcf in 2012 compared to the prior year, partially offset by a 26% decrease in average prices before the effect of hedges. The increase in production was a result of a significant acceleration of our drilling and completion program.
Lease operating expenses. The $2.1 million increase in lease operating expenses is generally consistent with the increase in production volumes in 2012 compared to 2011.
Gathering, compression and transportation. Of the $3.2 million increase, $2.4 million is attributable to our purchase of firm transportation to transport our produced natural gas to the markets where it is sold. The firm transportation commitment was made in anticipation of increasing production volumes, which resulted in increased utilization of this firm transportation throughout 2012 and into 2013. The remaining increase in gathering, compression and transportation is due to overall higher production volumes in 2012 compared to 2011.
G&A. The increase of $2.4 million was primarily attributable to the addition of personnel to support our growth activities.
DD&A. The increase of $8.2 million was a result of higher average capitalized costs in 2012 compared to 2011. The increase in capitalized costs is consistent with our expanded drilling program and increased production during the period.
Amortization of deferred financing costs. The increase of $4.5 million was a result of the amendment to our Marcellus joint venture’s credit agreement (“Wells Fargo Credit Facility”) with Wells Fargo Bank, N.A. (“Wells Fargo”) during the 2012 period in order to fund our drilling programs.
Write-down of abandoned leases. The $2.3 million write-off in 2012 was attributable to our abandonment of certain leases that are outside our core areas of drilling focus.
Gain from sale of interest in gas properties. In 2011, we recognized a gain related to the sale of a 50% working interest in certain gas properties in the Marcellus Shale.
Gain (loss) on derivative instruments. The $1.4 million loss on derivatives contracts in 2012 was comprised of $2.3 million in unrealized losses and $0.9 million of cash payments received on settlement of maturing contracts. In 2011, the $0.6 million gain was represented by cash payments received on settlement of maturing contracts.
Interest expense. The increase of $3.0 million was primarily attributable to higher levels of average borrowings outstanding during the 2012 period in order to fund our drilling programs.
Equity in income (loss) of joint ventures. The increase of $1.2 million was primarily a result of an increase in operating income attributable to higher production volumes of our Marcellus joint venture.
Capital Resources and Liquidity
Our primary sources of liquidity have been the proceeds from our IPO, equity contributions from our sponsors, borrowings under Rice Drilling B’s Second Lien Term Loan Facility and net proceeds from the sale of Rice Drilling B’s convertible debentures. We also completed our Senior Notes Offering in April 2014. Our primary use of capital has been the acquisition and development of natural gas properties. As we pursue reserve
70
Table of Contents
Index to Financial Statements
and production growth, we monitor which capital resources, including equity and debt financings, are available to us to meet our future financial obligations, planned capital expenditure activities and liquidity requirements. We also expect to fund a portion of these requirements with cash flow from operations as we continue to bring additional production online.
Our future success in growing proved reserves and production will be highly dependent on the capital resources available to us. In 2014, we plan to invest $1,230.0 million in our operations (excluding acquisitions), including $430.0 million for drilling and completion in the Marcellus Shale, $150.0 million for drilling and completion in the Utica Shale, $385.0 million for leasehold acquisitions and $265.0 million for midstream infrastructure development. This represents a 96% increase over our $629.0 million pro forma 2013 capital expenditures. Without giving pro forma effect to the Marcellus JV Buy-In, our 2013 capital budget was $578.0 million. We expect to fund our 2014 capital expenditures with cash generated by operations, borrowings under our revolving credit facility, a portion of the net proceeds of our IPO and the proceeds from our Senior Notes Offering. A portion of our 2014 capital budget is projected to be financed with cash flows from operations derived from wells drilled on drilling locations not associated with proved reserves in our December 31, 2013 reserve report. The failure to achieve projected production and cash flows from operations from such wells could result in a reduction to our 2014 capital budget. Our 2014 capital budget may be further adjusted as business conditions warrant. The amount, timing and allocation of capital expenditures is largely discretionary and within our control. If natural gas prices decline to levels below our acceptable levels, or costs increase to levels above our acceptable levels, we could choose to defer a significant portion of our budgeted capital expenditures until later periods to achieve the desired balance between sources and uses of liquidity and prioritize capital projects that we believe will have the highest expected rates of return and potential to generate near-term cash flow. We routinely monitor and adjust our capital expenditures in response to changes in commodity prices, availability of financing, drilling and acquisition costs, industry conditions, the timing of regulatory approvals, the availability of rigs, success or lack of success in drilling activities, contractual obligations, internally generated cash flow and other factors both within and outside our control.
We believe that operating cash flows, available borrowings under our revolving Senior Secured Revolving Credit Facility, the proceeds from our Senior Notes Offering and the proceeds from our IPO should be sufficient to meet our cash requirements, including normal operating needs, debt service obligations, capital expenditures, and commitments and contingencies. However, to the extent that we consider market conditions favorable, we may access the capital markets to raise capital from time to time to fund acquisitions, pay down our revolving Senior Secured Revolving Credit Facility and for general working capital purposes.
See “—Debt Agreements” below for additional details on our outstanding borrowings and available liquidity under our various financing arrangements.
Cash Flow Provided by Operating Activities
Net cash provided by operating activities was $35.5 million for the three months ended March 31, 2014, compared to $9.6 million of net cash used in operating activities for the three months ended March 31, 2013. The change in operating cash flow was primarily the result of higher production in the first quarter of 2014 at a higher realized gas price, along with decreases in per unit production costs.
Net cash provided by operating activities was $33.7 million for the year ended December 31, 2013, compared to $3.0 million of net cash used in operating activities for the year ended December 31, 2012. The change in operating cash flow was primarily the result of a $2.2 million increase in net income before DD&A; $17.9 million of which was attributable to undistributed earnings from our Marcellus joint venture and changes in working capital.
For the year ended 2012, net cash used in operating activities was $3.0 million compared to net cash provided by operating activities of $5.1 million for the year ended December 31, 2011. The decrease in cash flow from operations for the year ended December 31, 2012 compared to 2011 was primarily due to an approximate $4.7 million change in working capital items.
71
Table of Contents
Index to Financial Statements
Cash Flow Used In Investing Activities
During the three months ended March 31, 2014 and 2013, cash flows used in investing activities were $251.3 million and $27.6 million, respectively, primarily related to our capital expenditures for drilling, development and acquisition costs. In addition, the acquisition of our Marcellus Shale joint venture resulted in a net cash outflow of $82.8 million.
During the years ended December 31, 2013 and 2012, cash flows used in investing activities were $458.6 million and $120.0 million, respectively, primarily related to our capital expenditures for drilling, development and acquisition costs. In addition, we made a $10.0 million investment in our Marcellus Shale joint venture during the year ended December 31, 2012.
During the years ended December 31, 2012 and 2011, cash flows used in investing activities were $120.0 million and $79.2 million, respectively, primarily related to our capital expenditures for drilling, development and acquisition costs, net of sales proceeds. Nearly all of our investments in unconsolidated joint ventures of $10.0 million and $15.2 million for the years ended December 31, 2012 and 2011 related to our Marcellus joint venture.
Cash Flow Provided By Financing Activities
Net cash provided by financing activities of $412.8 million during the three months ended March 31, 2014 was primarily the result of the proceeds from our initial public offering, net of offering costs and offset by repayments of debt. Net cash provided by financing activities of $21.9 million during the three months ended March 31, 2013 was primarily related to borrowings under our credit facility, net of purchase of restricted units.
Net cash provided by financing activities of $448.0 million during the year ended December 31, 2013 was primarily the result of debt borrowings net of repayments that are more fully described in “Debt Agreements” below. In addition, we received capital contributions from our members of $196.0 million and $96.8 million during the years ended December 31, 2013 and 2012, respectively.
Net cash provided by financing activities of $127.1 million during the year ended December 31, 2012 was primarily attributable to capital contributions from our members and net borrowings under debt agreements that are further described in “Debt Agreements” below. Net cash provided by financing activities of $73.4 million during the year ended December 31, 2011 was primarily the result of debt borrowings net of repayments.
Debt Agreements
6.25% Senior Notes Due 2022
On April 25, 2014, we offered $900.0 million in aggregate principal amounts of the Notes due 2022 in a private placement to eligible purchasers under Rule 144A and Regulation S of the Securities Act, which resulted in net proceeds to us of $882.7 million after deducting estimated expenses and underwriting discounts and commissions of approximately $17.3 million. We used $301.8 million of the net proceeds to repay and retire the Second Lien Term Loan Facility and expect to use the remainder to fund our capital expenditure plan. The indenture governing the Notes restricts our ability and the ability of certain of our subsidiaries to incur or guarantee additional debt or issue certain types of preferred stock; pay dividends capital stock or redeem, repurchase or retire our capital stock or subordinated debt; make certain investments; incur liens; enter into transactions with affiliates; merge or consolidate with another company; transfer and sell assets; and create unrestricted subsidiaries. These covenants are subject to a number of important exceptions and qualifications detailed in the indenture governing the Notes.
72
Table of Contents
Index to Financial Statements
Senior Secured Revolving Credit Facility
Concurrently with our Senior Notes Offering, we, as borrower, and Rice Drilling B, as predecessor borrower, entered into the Amended Credit Agreement to, among other things, assign all of the rights and obligations of Rice Drilling B under its Senior Secured Revolving Credit Facility to us, and we assumed all such rights and obligations as borrower under the Amended Credit Agreement. Furthermore, the Amended Credit Agreement (i) allowed for the Senior Notes Offering and (ii) provided that we did not incur an immediate reduction in the borrowing base under the Senior Secured Revolving Credit Facility as a result of the Senior Notes Offering (though the borrowing base will be redetermined within approximately 30 days after the Senior Notes Offering) and, as such, the borrowing base under the Amended Credit Agreement immediately following the Senior Notes Offering remains at $350.0 million until the next redetermination of the borrowing base. The Amended Credit Agreement also extends the maturity date of the Senior Secured Revolving Credit Facility from April 25, 2018 to January 29, 2019.
The Amended Credit Agreement is secured by liens on at least 80% of the proved oil and gas reserves of us and our subsidiaries (other than any subsidiary that is designated as an unrestricted subsidiary), as well as significant unproved acreage and substantially all of the personal property of us and such restricted subsidiaries, and the Amended Credit Agreement is guaranteed by such restricted subsidiaries. The Amended Credit Agreement contains restrictive covenants that limit the ability of us and our restricted subsidiaries to, among other things:
| • | incur additional indebtedness; |
| • | sell assets; |
| • | make loans to others; |
| • | make investments; |
| • | enter into mergers; |
| • | make or declare dividends; |
| • | hedge future production or interest rates; |
| • | incur liens; and |
| • | engage in certain other transactions without the prior consent of the lenders. |
The Amended Credit Agreement also requires us to maintain certain financial ratios, which are measured at the end of each calendar quarter, beginning March 31, 2014:
| • | a current ratio, which is the ratio of consolidated current assets (including unused commitments under the Amended Credit Agreement and excluding non-cash derivative assets) to consolidated current liabilities (excluding current maturities under the Amended Credit Agreement and non-cash derivative liabilities), of not less than 1.0 to 1.0; and |
| • | a minimum interest coverage ratio, which is the ratio of consolidated EBITDAX (as such term is defined in the Amended Credit Agreement) based on the trailing twelve month period to consolidated interest expense, of not less than 2.5 to 1.0. |
We were in compliance with such covenants and ratios as of March 31, 2014.
Second Lien Term Loan Facility
On April 25, 2013, Rice Drilling B entered into a Second Lien Term Loan Facility with Barclays Bank PLC, as administrative agent, and a syndicate of lenders in an aggregate principal amount of $300.0 million. Rice Drilling B estimated the discount on issuance of this instrument based upon an estimate of market rates at the inception of the instrument and recorded a discount of $4.5 million. The discount was being amortized over the
73
Table of Contents
Index to Financial Statements
life of the note using an effective interest rate of 0.284% using the effective yield method. As of March 31, 2014, Rice Drilling B had a balance of $293.3 million relating to the Second Lien Term Loan Facility, this includes borrowings outstanding of $297.0 million less a discount of $3.7 million. On April 25, 2014, we used a portion of the net proceeds from our Senior Notes Offering to repay and retire the Second Lien Term Loan Facility, in the amount of $301.8 million. The $301.8 million included the outstanding principal balance of $297.0 million, a prepayment premium in the amount of approximately $3.0 million, and all accrued but unpaid interest.
Convertible Debentures
In June of 2011, Rice Drilling B sold $60.0 million of its 12% Senior Subordinated Convertible Debentures due 2014 (the “Debentures”) in a private placement to certain accredited investors as defined in Rule 501 of Regulation D. The Debentures accrued interest at 12% per year payable monthly in arrears by the 15th day of the month and mature on July 31, 2014 (“Maturity Date”). The Debentures were Rice Drilling B’s unsecured senior obligations and ranked equally with all of Rice Drilling B’s then-current and future senior unsecured indebtedness.
In connection with the IPO, the Debentures and warrants of Rice Drilling B were amended to become convertible or exercisable for shares of our common stock. On February 28, 2014, Rice Drilling B issued a redemption notice on the remaining Debentures, which set a redemption date of March 28, 2014. Prior to the redemption date, $6.6 million of the Debentures were converted into 570,945 shares of Rice Energy Inc. common stock. The remaining principal balance of $0.3 million was not converted and is recorded as an accrued liability as of March 31, 2014 in the amount of $0.4 million, including the 50% premium of $0.1 million, and will be paid upon request from holders of the remaining Debentures. The premium of $0.1 million was recorded to expense in the three months ended March 31, 2014. As the principal amount of the Debentures outstanding has been reduced to zero, Rice Drilling B is no longer required to maintain restricted cash or comply with the restrictive covenants which apply thereto.
Commodity Hedging Activities
Our primary market risk exposure is in the prices we receive for our natural gas production. Realized pricing is primarily driven by the spot regional market prices applicable to our U.S. natural gas production. Pricing for natural gas production has been volatile and unpredictable for several years, and we expect this volatility to continue in the future. The prices we receive for production depend on many factors outside of our control, including volatility in the differences between product prices at sales points and the applicable index price.
To mitigate the potential negative impact on our cash flow caused by changes in oil and natural gas prices, we have entered into financial commodity derivative contracts in the form of swaps, zero cost collars, calls, puts and basis swaps to ensure that we receive minimum prices for a portion of our future oil and natural gas production when management believes that favorable future prices can be secured. We typically hedge the NYMEX Henry Hub price for natural gas. The Amended Credit Agreement adjusted our hedging limitation. In the prior Senior Secured Revolving Credit Facility agreement, we were permitted to hedge volumes based on a percentage of expected production from proved reserve volumes. We are now permitted to hedge the greater of (i) the percentage of internally forecasted production (Column A) and (ii) the percentage of proved reserve volumes (Column B) according to the table below.
| Months next succeeding the time as of which compliance is measured |
Column A | Column B | ||||||
| Months 1 through 12 |
75 | % | 85 | % | ||||
| Months 13 through 24 |
50 | % | 85 | % | ||||
| Months 25 through 36 |
40 | % | 85 | % | ||||
| Months 37 through 48 |
25 | % | 65 | % | ||||
| Months 49 through 60 |
15 | % | 65 | % | ||||
74
Table of Contents
Index to Financial Statements
Our hedging activities are intended to support natural gas prices at targeted levels and to manage our exposure to natural gas price fluctuations. The counterparty is required to make a payment to us for the difference between the floor price specified in the contract and the settlement price, which is based on market prices on the settlement date, if the settlement price is below the floor price. We are required to make a payment to the counterparty for the difference between the ceiling price and the settlement price if the ceiling price is below the settlement price. These contracts may include price swaps whereby we will receive a fixed price for our production and pay a variable market price to the contract counterparty and zero cost collars that set a floor and ceiling price for the hedged production. For a description of our commodity derivative contracts, please see Note 11 to the consolidated financial statements of Rice Drilling B as of and for the year ended December 31, 2013 included elsewhere in this this prospectus.
By using derivative instruments to hedge exposures to changes in commodity prices, we expose ourselves to the credit risk of our counterparties. Credit risk is the potential failure of the counterparty to perform under the terms of the derivative contract. When the fair value of a derivative contract is positive, the counterparty is expected to owe us, which creates credit risk. To minimize the credit risk in derivative instruments, it is our policy to enter into derivative contracts only with counterparties that are creditworthy financial institutions deemed by management as competent and competitive market makers. The creditworthiness of our counterparties is subject to periodic review. We have derivative instruments in place with three different counterparties. As of March 31, 2014, our contracts with Wells Fargo Bank N.A. accounted for 64% of the net fair market value of our derivative assets. We believe Wells Fargo Bank N.A. is an acceptable credit risk. We are not required to provide credit support or collateral to Wells Fargo Bank N.A. under current contracts, nor are they required to provide credit support or collateral to us. As of March 31, 2014 and December 31, 2013, we did not have any past due receivables from counterparties.
Contractual obligations. A summary of our contractual obligations as of December 31, 2013 is provided in the following table, which does not reflect our IPO, our Senior Notes Offering or the respective uses of proceeds therefrom.
| Payments due by period | ||||||||||||||||||||||||||||
| For the Year Ended December 31, | ||||||||||||||||||||||||||||
| 2014 | 2015 | 2016 | 2017 | 2018 | Thereafter | Total | ||||||||||||||||||||||
| (in thousands) | ||||||||||||||||||||||||||||
| Revolving Credit Facility(1) |
$ | — | $ | — | $ | — | $ | — | $ | 115,000 | $ | — | $ | 115,000 | ||||||||||||||
| Term Loan Facility(1) |
3,000 | 3,000 | 3,000 | 3,000 | 285,750 | — | 297,750 | |||||||||||||||||||||
| Convertible Debentures(2) |
7,372 | — | — | — | — | — | 7,372 | |||||||||||||||||||||
| NPI Note |
8,500 | — | — | — | — | — | 8,500 | |||||||||||||||||||||
| Drilling rig commitments(3) |
11,732 | 9,707 | — | — | — | — | 21,439 | |||||||||||||||||||||
| Gathering and firm transportation |
28,327 | 52,072 | 65,557 | 65,420 | 63,968 | 361,842 | 637,186 | |||||||||||||||||||||
| Asset retirement obligations(4) |
— | — | — | — | — | 11,725 | 11,725 | |||||||||||||||||||||
| Other |
3,360 | 2,205 | 1,396 | 1,302 | 898 | 352 | 9,513 | |||||||||||||||||||||
|
|
|
|
|
|
|
|
|
|
|
|
|
|
|
|||||||||||||||
| Total |
$ | 62,291 | $ | 66,984 | $ | 69,953 | $ | 69,722 | $ | 465,616 | $ | 373,919 | $ | 1,108,485 | ||||||||||||||
|
|
|
|
|
|
|
|
|
|
|
|
|
|
|
|||||||||||||||
| (1) | Includes outstanding principal amounts at December 31, 2013. This table does not include future commitment fees, amortization of deferred financing costs, interest expense or other fees on these facilities because they are floating rate instruments and we cannot determine with accuracy the timing of future loan advances, repayments or future interest rates to be charged. |
| (2) | Includes accrued interest and put premium for each period through maturity. From July 31, 2013 through August 20, 2013, any holder of convertible debentures had the right to cause us to repurchase all or any portion of the convertible debentures it owned at 100% of the portion of the principal amount of the convertible debentures as to which the right was being exercised, plus a premium of 20%. During this period, we repurchased $53.1 million of outstanding convertible debentures and paid a put premium of $10.6 million in accordance with the terms of the convertible debentures. |
75
Table of Contents
Index to Financial Statements
| (3) | As of December 31, 2013, we had two horizontal drilling rigs under contract. One of these contracts expires in 2014. A third rig, which we took delivery of in February 2014, expires in 2015. Any other rig performing work for us is doing so on a well-by-well basis and therefore can be released without penalty at the conclusion of drilling on the current well. These types of drilling obligations have not been included in the table above. The values in the table represent the gross amounts that we are committed to pay. However, we will record in our financials our proportionate share based on our working interest. |
| (4) | Represents gross retirement costs with no discounting impact. |
Material Weakness in Internal Control over Financial Reporting
Prior to the completion of our IPO, we were a private company with limited accounting personnel to adequately execute our accounting processes and other supervisory resources with which to address our internal control over financial reporting. In addition, our Marcellus joint venture historically relied on our accounting personnel for its accounting processes. We and our Marcellus joint venture had not maintained effective control environments in that the design and execution of our controls had not consistently resulted in effective review and supervision by individuals with financial reporting oversight roles. The lack of adequate staffing levels resulted in insufficient time spent on review and approval of certain information used to prepare the financial statements of us and our Marcellus joint venture. We concluded that these control deficiencies constituted a material weakness in our control environment and in the control environment of our Marcellus joint venture. A material weakness is a control deficiency, or a combination of control deficiencies, in internal control over financial reporting, such that there is a reasonable possibility that a material misstatement of our annual or interim financial statements will not be prevented or detected on a timely basis.
In 2011, we and our Marcellus joint venture did not maintain effective controls to ensure proper close processes, formal account reconciliations and technical accounting matter resolution and documentation. In 2012, we and our Marcellus joint venture did not maintain effective controls to ensure proper staffing and supervisory review. For each of these periods, effective controls were not adequately designed or consistently operating to ensure that key computations were properly reviewed before the amounts were recorded in our accounting records. The above identified control deficiencies resulted in audit adjustments to our consolidated financial statements during 2011 and 2012.
To address these control deficiencies, we have implemented additional analysis and reconciliation procedures and increased the levels of review and approval. In addition, we have hired 20 additional accounting and financial reporting staff to complement our historical accounting staff of four individuals as of December 31, 2012. These hires were made to allow for additional preparation and review time during our monthly accounting close process. Additionally, we have begun taking steps to comprehensively document and analyze our system of internal control over financial reporting in preparation for our first management report on internal control over financial reporting required in connection with our annual report for the year ended December 31, 2014. Although remediation efforts are still in progress, we believe the implementation of these changes has substantially improved our control environment as evidenced by the timely filing of this Annual Report on Form 10-K for the year ended December 31, 2013 and a significant decrease in audit adjustments as compared to prior periods. None of these audit adjustments were deemed material.
Due to the recent implementation of these changes to our control environment, management will continue to evaluate the design and effectiveness of these control changes in connection with its ongoing evaluation, documentation, review, formalization and testing of our internal control environment over the remainder of 2014. We will not complete our review until the second half of 2014 and we cannot predict the outcome of our review at this time. Based upon the status of our review, we and our independent auditors have concluded that the material weakness had not been fully remediated as of March 31, 2014.
During the course of the review, we may identify additional control deficiencies, which could give rise to significant deficiencies and other material weaknesses in addition to the material weakness previously identified. Our remediation efforts may not enable us to remedy or avoid material weaknesses or significant deficiencies in the future.
76
Table of Contents
Index to Financial Statements
Critical Accounting Policies and Estimates
The discussion and analysis of our financial condition and results of operations are based upon our consolidated financial statements, which have been prepared in accordance with accounting principles generally accepted in the United States. The preparation of our financial statements requires us to make estimates and assumptions that affect the reported amounts of assets, liabilities, revenues and expenses and related disclosure of contingent assets and liabilities. Certain accounting policies involve judgments and uncertainties to such an extent that there is reasonable likelihood that materially different amounts could have been reported under different conditions, or if different assumptions had been used. We evaluate our estimates and assumptions on a regular basis. We base our estimates on historical experience and various other assumptions that are believed to be reasonable under the circumstances, the results of which form the basis for making judgments about the carrying values of assets and liabilities that are not readily apparent from other sources. Actual results may differ from these estimates and assumptions used in preparation of our consolidated financial statements. See Note 1 of the notes to the audited consolidated financial statements for an expanded discussion of our significant accounting policies and estimates made by management.
Incentive units
We recognize non-cash compensation expense for incentive units awarded to certain of our employees by NGP Holdings and Rice Holdings. In connection with our IPO and related corporate reorganization, the holders of incentive units in Rice Appalachia contributed their incentive units to Rice Holdings and NGP Holdings in return for substantially similar incentive units in such entities. This resulted in the incentive units being deemed to have been modified, and the performance conditions were considered to be probable of occurring. Therefore, their fair values were measured and compensation expense from the date of initial grant through March 31, 2014 has been recognized in the three months ended March 31, 2014.
It is currently expected that the NGP Holdings incentive units will be satisfied in cash and the Rice Holdings incentive units will be satisfied in shares of our common stock held by Rice Holdings. As a result of these different manners of payment satisfaction, the incentive units are accounted for differently, with the NGP Holdings incentive units being accounted for liability awards and the Rice Holdings incentive units being accounted for as equity awards. For the NGP Holdings incentive units, for the three months ended March 31, 2014, the fair value was measured as of March 31, 2014. For future reporting periods, the fair value used to determine the applicable compensation expense will be re-measured at each reporting period. For the Rice Holdings incentive units, the fair value of the incentive units was measured as of January 29, 2014, the date of modification. This fair value will underlie compensation expense charges for future reporting periods.
Determination of the fair value of the awards requires judgments and estimates regarding, among other things, the appropriate methodologies to follow in valuing the incentive units and the related inputs required by those valuation methodologies. The fair values underlying the compensation expense for both types of incentive units were estimated using a Monte Carlo simulation. The Monte Carlo simulation projected the share price for our common stock using the expected volatility, the risk free rate and other variables. The service period, which began on the date of grant and continues through final distribution, has been estimated primarily based upon our assumptions regarding the timing and size of secondary offerings of shares of our common stock by NGP Holdings and/or other liquidity events.
Future results of operations for any particular quarterly or annual period could be materially affected by changes in the Company’s assumptions. Any change in inputs or number of inputs to this calculation could impact the valuation and thus the non-cash compensation expense recognized. See Note 9 to our Condensed Consolidated Financial Statements for the three months ended March 31, 2014 included elsewhere in this prospectus for additional information. Non-cash compensation expenses related to the incentive units is included in incentive unit expense within the Consolidated Statement of Operations.
77
Table of Contents
Index to Financial Statements
Income taxes
At the date of IPO, we indirectly owned 100% of Rice Drilling B and its subsidiaries. Rice Drilling B was a limited liability company not subject to federal income taxes before IPO. However, in connection with the closing of the IPO, as a result of our corporate reorganization, we became a corporation subject to federal income tax and, as such, our future income taxes will be dependent upon our future taxable income. The change in tax status requires the recognition of a deferred tax asset or liability for the initial temporary differences at the time of the change in status. The resulting deferred tax liability of approximately $164.5 million was recorded in equity at the date of the completion of the IPO as it represents a transaction among shareholders.
Income taxes are accounted for under the asset and liability method, which requires recognition of deferred tax assets and liabilities for the expected future tax consequences of events that have been included in the financial statements. Under this method, deferred tax assets and liabilities are determined based on the differences between the financial statements and tax basis of assets and liabilities using enacted tax rates in effect for the year in which differences are expected to be recovered or settled pursuant to the provisions of ASC 740-Income Taxes. The effect of a change in tax rates on deferred tax assets and liabilities is recognized in income in the period that includes the enactment date.
We will record a valuation allowance if it is deemed more likely than not that all or a portion of its deferred income tax assets will not be realized. In addition, income tax rules and regulations are subject to interpretation and the application of those rules and regulations require judgment by us and may be challenged by the taxation authorities. We follow ASC 740-10-25, which requires the use of a two-step approach for recognizing and measuring tax benefits taken or expected to be taken in a tax return and disclosures regarding uncertainties in income tax positions. Only tax positions that meet the more likely than not recognition threshold are recognized.
Business Combinations
For acquisitions of working interests that are accounted for as business combinations, the results of operations are included in the Consolidated Statement of Operations from the date of acquisition. Purchase prices are allocated to assets acquired based on their estimated fair values at the time of acquisition. Fair value is the price that would be received to sell an asset or would be paid to transfer a liability in an orderly transaction between market participants at the measurement date. The fair value measurement is based on the assumptions of market participants and not those of the reporting entity. Therefore, entity-specific intentions do not impact the measurement of fair value. The fair value of natural gas properties is determined using a risk-adjusted after-tax discounted cash flow analysis based upon significant inputs including: 1) gas prices, 2) projections of estimated quantities of natural gas reserves, including those classified as proved, probable and possible, 3) projections of future rates of production, 4) timing and amount of future development and operating costs, 5) projected reserve recovery factors, and 6) weighted average cost of capital.
Revenue Recognition
Sales of natural gas are recognized when natural gas has been delivered to a custody transfer point, persuasive evidence of a sales arrangement exists, the rights and responsibility of ownership pass to the purchaser upon delivery, collection of revenue from the sale is reasonably assured, and the sales price is fixed or determinable. Natural gas is sold by us under contract with our natural gas marketers. Pricing provisions are tied to the Platts Gas Daily market prices.
Investments in Joint Ventures
We account for our oilfield service company joint venture investment and for periods prior to the completion of the Marcellus JV Buy-In accounted for our Marcellus joint venture investment, under the equity method of accounting as we have significant influence, but not control, over the joint ventures.
78
Table of Contents
Index to Financial Statements
Under the equity method of accounting, investments are carried at cost, adjusted for our proportionate share of the undistributed earnings or losses and reduced for any distributions from the investment. We also evaluate our equity method investments for potential impairment whenever events or changes in circumstances indicate that there is an other-than-temporary decline in value of the investment. Such events may include sustained operating losses by the investee or long-term negative changes in the investee’s industry. These indicators were not present, and as a result, we did not recognize any impairment charges related to our equity method investments for any of the periods presented in the consolidated financial statements.
Gas Properties
We use the successful efforts method of accounting for gas-producing activities. Costs to acquire mineral interests in gas properties and to drill and equip exploratory wells that result in proved reserves are capitalized. Costs to drill exploratory wells that do not identify proved reserves as well as geological and geophysical costs and costs of carrying and retaining unproved properties are expensed.
Unproved gas properties that are individually significant are periodically assessed for impairment of value, and a loss is recognized at the time of impairment by providing an impairment allowance. Capitalized costs of producing gas properties and support equipment directly related to such properties, after considering estimated residual salvage values, are depreciated and depleted by the units of production method. Support equipment and other property and equipment not directly related to gas properties are depreciated over their estimated useful lives.
Management’s estimates of proved reserves are based on quantities of natural gas that engineering and geological analysis demonstrates, with reasonable certainty, to be recoverable from established reservoirs in the future under current operating and economic conditions. External engineers prepare the annual reserve and economic evaluation of all properties on a well-by-well basis. Additionally, we adjust natural gas reserves for major well rework or abandonment during the year as needed. The process of estimating and evaluating natural gas reserves is complex, requiring significant decisions in the evaluation of available geological, geophysical, engineering, and economic data. The data for a given property may also change substantially over time as a result of numerous factors, including additional development activity, evolving production history and a continual reassessment of the viability of production under changing economic conditions. As a result, revisions in existing reserve estimates occur from time to time. Although every reasonable effort is made to ensure that reserve estimates represent our most accurate assessments possible, the subjective decisions and variances in available data for various properties increase the likelihood of significant changes in these estimates over time. Because estimates of reserves significantly affect our DD&A expense, a change in our estimated reserves could have a material effect on our net income or loss.
On the sale of an entire interest in an unproved property for cash, a gain or loss on the sale is recognized, taking into consideration the amount of any recorded impairment if the property had been assessed individually. If a partial interest in an unproved property is sold, the amount received is treated as a reduction of the cost of the interest retained unless the proceeds received are in excess of the cost basis which would result in gain on sale.
Asset Retirement Obligations
We record the fair value of a legal liability for an asset retirement obligation in the period in which it is incurred. For gas properties, this is the period in which a gas well is acquired or drilled. Our retirement obligations relate to the abandonment of gas-producing facilities and include costs to reclaim drilling sites and dismantle and relocate or dispose of gathering systems, wells, and related structures. Estimates are based on historical experience in plugging and abandoning wells and estimated remaining lives of those wells based on reserve estimates.
When a new liability is recorded, we capitalize the costs of the liability by increasing the carrying amount of the related long-lived asset. To the extent future revisions to assumptions impact the present value of the existing asset retirement obligation a corresponding adjustment is made to the natural gas and oil property balance. For
79
Table of Contents
Index to Financial Statements
example, as we analyze actual plugging and abandonment information, we may revise our estimate of current costs, the assumed annual inflation of the costs and/or the assumed productive lives of our wells. The liability is accreted to its present value each period and the capitalized cost is depreciated over the units of production basis.
Equity Incentives
We have entered into certain compensation arrangements with employees and, in limited cases, consultants. These arrangements have resulted in certain of the awards contained within the arrangements being accounted for as equity awards whereas other awards do not have the characteristics of equity and accordingly are not accounted for as such. These compensation arrangements require us to estimate the fair value of such arrangements. Management established an estimated fair value for issued units based upon an income approach prior to December 31, 2013. At December 31, 2013, in connection with our IPO, a market approach was used. Certain of the compensation arrangements contain performance conditions that need to be achieved in order for vesting in the arrangements to occur. We routinely monitor these performance conditions in order to determine if compensation expense is required to be recorded in the consolidated financial statements.
Depletion
Capitalized amounts attributable to proved oil and gas properties are depleted by the unit-of-production method over proved reserves. Depletion of the costs of wells and related equipment and facilities, including capitalized asset retirement costs, is computed using proved developed reserves. The reserve base used to calculate DD&A for leasehold acquisition costs and the cost to acquire proved properties is the sum of proved developed reserves and proved undeveloped reserves.
Quantitative and Qualitative Disclosures about Market Risk
The primary objective of the following information is to provide forward-looking quantitative and qualitative information about our potential exposure to market risk. The term “market risk” refers to the risk of loss arising from adverse changes in oil and natural gas prices and interest rates. The disclosures are not meant to be precise indicators of expected future losses, but rather indicators of reasonably possible losses. This forward-looking information provides indicators of how we view and manage our ongoing market risk exposures. All of our market risk sensitive instruments were entered into for hedging purposes, rather than for speculative trading.
Commodity Price Risk and Hedges
For a discussion of how we use financial commodity derivative contracts to mitigate some of the potential negative impact on our cash flow caused by changes in natural gas prices, see “Management’s Discussion and Analysis of Financial Condition and Results of Operations—Commodity Hedging Activities.”
Interest Rate Risks
On April 25, 2013, Rice Drilling B entered into the Second Lien Term Loan Facility with a syndicate of banks. As of March 31, 2014, Rice Drilling B had borrowings outstanding under its Second Lien Term Loan Facility of $293.3 million which bore interest at a floating rate. The interest rate on this indebtedness as of March 31, 2014 was approximately 8.5%. Interest is payable in arrears at the end of each quarter and on the maturity date. Rice Drilling B has a choice of borrowing in Eurodollars or at the base rate. Eurodollar loans bear interest at a rate per annum equal to LIBOR plus 725 basis points with a minimum LIBOR rate of 1.25%. Base rate loans bear interest at a rate per annum equal to the greatest of (i) 2.25%, (ii) the agent bank’s reference rate, (iii) the federal funds effective rate plus 50 basis points and (iv) the rate for one month Eurodollar loans plus 100 basis points, plus 625 basis points. As of March 31, 2014, the 90-day LIBOR rate was approximately 0.23%, which is 1.02% lower than the minimum LIBOR rate on the Second Lien Term Loan Facility. Accordingly, a 100 basis point increase in the LIBOR rate would not materially change our interest expense. Based on the outstanding balance on the Second Lien Term Loan Facility as of March 31, 2014 a 100 basis point increase in
80
Table of Contents
Index to Financial Statements
the LIBOR rate beyond the minimum LIBOR rate of 1.25% would increase interest expense by $2.9 million per year. On April 25, 2014, we used a portion of the net proceeds from our Senior Notes Offering to repay and retire the Second Lien Term Loan Facility in the amount of $301.8 million.
As of March 31, 2014, we had no borrowings and approximately $71.3 million in letters of credit outstanding under our Senior Secured Revolving Credit Facility. Concurrently with the closing of our IPO, we amended our Senior Secured Revolving Credit Facility to, among other things, increase the maximum commitment amount to $1.5 billion and lower the interest rate owed on amounts borrowed under the Senior Secured Revolving Credit Facility. After giving effect to the amendment, the borrowing base under our Senior Secured Revolving Credit Facility was increased to $350.0 million as a result of the Marcellus JV Buy-In. As of March 31, 2014, we had availability under our Senior Secured Revolving Credit Facility of approximately $278.7 million. We have a choice of borrowing in Eurodollars or at the base rate. Eurodollar loans bear interest at a rate per annum equal to LIBOR plus an applicable margin ranging from 150 to 250 basis points following the closing of our IPO, depending on the percentage of our borrowing base utilized. Base rate loans bear interest at a rate per annum equal to the greatest of (i) the agent bank’s reference rate, (ii) the federal funds effective rate plus 50 basis points and (iii) the rate for one month Eurodollar loans plus 100 basis points, plus an applicable margin ranging from 50 to 150 basis points following the closing of our IPO as a result of the Marcellus JV Buy-In, depending on the percentage of our borrowing base utilized. The interest rate did not change under the Amended Credit Agreement.
As of March 31, 2014, we did not have any derivatives in place to mitigate the effects of interest rate risk. We may implement an interest rate hedging strategy in the future.
Counterparty and Customer Credit Risk
Our principal exposures to credit risk are through joint interest receivables ($15.5 million as of March 31, 2014) and the sale of our natural gas production ($46.9 million in receivables as of March 31, 2014), which we market to two natural gas marketing companies. Joint interest receivables arise from billing entities who own partial interest in the wells we operate. These entities participate in our wells primarily based on their ownership in leases on which we wish to drill. We can do very little to choose who participates in our wells. We are also subject to credit risk due to concentration of our natural gas receivables with two natural gas marketing companies. We do not require our customers to post collateral. The inability or failure of our significant customers to meet their obligations to us or their insolvency or liquidation may adversely affect our financial results.
Off-Balance Sheet Arrangements
As of March 31, 2014, we did not have any off-balance sheet arrangements.
81
Table of Contents
Index to Financial Statements
We are an independent natural gas and oil company engaged in the acquisition, exploration and development of natural gas and oil properties in the Appalachian Basin. We are focused on creating shareholder value by identifying and assembling a portfolio of low-risk assets with attractive economic profiles and leveraging our technical and managerial expertise to deliver industry-leading results. We strive to be an early entrant into the core of a shale play by identifying what we believe to be the core of the play and aggressively executing our acquisition strategy to establish a largely contiguous acreage position. We believe we were an early identifier of the core of both the Marcellus Shale in southwestern Pennsylvania and the Utica Shale in southeastern Ohio.
All of our current and planned development is located in what we believe to be the core of the Marcellus and Utica Shales. The Marcellus Shale is one of the most prolific unconventional resource plays in the United States, and we believe the Utica Shale, based on initial drilling results, is a premier North American shale play. Together, these resource plays offer what we believe to be among the highest rate of return wells in North America. As of March 31, 2014, we held approximately 43,978 net acres in the southwestern core of the Marcellus Shale, primarily in Washington County, Pennsylvania. We established our Marcellus Shale acreage position through a combination of largely contiguous acreage acquisitions in 2009 and 2010 and through numerous bolt-on acreage acquisitions. In 2012, we acquired approximately 33,499 of our 46,700 net acres in the southeastern core of the Utica Shale, primarily in Belmont County, Ohio. We believe this area to be the core of the Utica Shale based on publicly available drilling results. We operate all of our acreage in the Marcellus Shale and a majority of our acreage in the Utica Shale.
Since completing our first horizontal well in the fourth quarter of 2010, our pro forma average net daily production has grown approximately 105 times to 209 MMcf/d for the first quarter of 2014. Substantially all of our production through the first quarter of 2014 has been dry gas attributable to our operations in the Marcellus Shale. Prior to the second quarter of 2013, we ran a two-rig drilling program focused on delineating and defining the boundaries of our Marcellus Shale acreage position. In the second quarter of 2013, we shifted our operational focus from exploration to development, commencing a four-rig drilling program consisting of two rigs specifically for drilling the tophole sections of our horizontal wells and two rigs specifically for drilling the curve and lateral sections of our horizontal wells. In the first quarter of 2014, we increased to a six-rig drilling program (consisting of three tophole rigs and three horizontal rigs), two of which are operating in the Utica Shale. We expect to continue to operate a six-rig drilling program through the remainder of 2014. The following chart shows our pro forma average net daily production for each quarter since completing our first horizontal well in the Marcellus Shale.
82
Table of Contents
Index to Financial Statements
As of March 31, 2014, we had drilled and completed 41 horizontal Marcellus wells with lateral lengths ranging from 2,444 feet to 9,147 feet and averaging 5,764 feet. Our estimated ultimate recoveries (“EUR”) from our 37 producing wells at December 31, 2013, as estimated by our independent reserve engineer, NSAI, and normalized for each 1,000 feet of horizontal lateral, range from 1.2 Bcf per 1,000 feet to 3.0 Bcf per 1,000 feet, with an average of 1.9 Bcf per 1,000 feet. As of March 31, 2014, we had 349 gross (325 net) risked drilling locations in the Marcellus Shale. Additionally, we have drilled and completed three Upper Devonian horizontal wells on our Marcellus Shale acreage. Based on our Upper Devonian wells and those of other operators in the vicinity of our acreage as well as other geologic data, we estimate that substantially all of our Marcellus Shale acreage in Southwestern Pennsylvania is prospective for the slightly shallower Upper Devonian Shale. As of March 31, 2014, we had 211 gross (194 net) risked drilling locations in the Upper Devonian Shale.
For the Utica Shale, we applied the same shale analysis and acquisition strategy that we developed and employed in the Marcellus Shale to acquire our acreage. In June 2014 we completed our first Utica well, the Bigfoot 9H, which tested at a stabilized rate of 41.7 MMcf/d. Please see “—Recent Developments—Bigfoot 9H Test Results.” Our delineation operations are being conducted with a two-rig drilling program (one tophole rig and one horizontal rig). We intend to maintain this two-rig drilling program in the Utica Shale through 2014. In 2015, we intend to transition to a primarily development-focused strategy in the Utica Shale. As of March 31, 2014, we had 753 gross (233 net) risked drilling locations in the Utica Shale.
As of December 31, 2013, our pro forma estimated proved reserves were 602 Bcf, all of which were in southwestern Pennsylvania, with 42% proved developed and 100% natural gas. In 2014, we plan to invest $1,230.0 million in our operations (excluding acquisitions) as follows:
| • | $430.0 million for drilling and completion in the Marcellus Shale; |
| • | $150.0 million for drilling and completion in the Utica Shale; |
| • | $385.0 million for leasehold acquisitions; and |
| • | $265.0 million for midstream infrastructure development. |
83
Table of Contents
Index to Financial Statements
This represents a 96% increase over our $629.0 million pro forma 2013 capital expenditures. Please see “Management’s Discussion and Analysis of Financial Condition and Results of Operations—Capital Resources and Liquidity.” The following table provides a summary of our net acreage, average working interest, producing wells, risked drilling locations and projected 2014 net wells online as of March 31, 2014:
| Net Acreage |
Average Working Interest |
Producing Wells |
Risked Drilling Locations(1) |
2014 Projected Net Wells Online |
||||||||||||||||||||||||
| Gross | Net | Gross | Net | |||||||||||||||||||||||||
| Marcellus Shale(2) |
43,978 | 95 | % | 41 | 38 | 349 | 325 | 37 | ||||||||||||||||||||
| Utica Shale(3) |
46,700 | 96 | % | — | — | 753 | 233 | 7 | (4) | |||||||||||||||||||
| Upper Devonian Shale(5) |
— | — | 3 | 3 | 211 | 194 | — | |||||||||||||||||||||
|
|
|
|
|
|
|
|
|
|
|
|
|
|
|
|||||||||||||||
| Total(5) |
90,678 | — | 44 | 41 | 1,313 | 752 | 44 | |||||||||||||||||||||
|
|
|
|
|
|
|
|
|
|
|
|
|
|
|
|||||||||||||||
| (1) | Based on our reserve reports as of December 31, 2013, we had 44 gross (39 net) locations in the Marcellus Shale associated with proved undeveloped reserves and 13 gross (12 net) locations in the Marcellus Shale associated with proved developed not producing reserves. Please see “Business—Our Operations—Reserve Data—Determination of Drilling Locations” for more information regarding the process and criteria through which these drilling locations were identified. The drilling locations on which we actually drill will depend on the availability of capital, regulatory approval, commodity prices, costs, actual drilling results and other factors. Please see “Risk Factors—Risks Related to Our Business—Our gross drilling locations are scheduled out over many years, making them susceptible to uncertainties that could materially alter the occurrence or timing of their drilling. In addition, we may not be able to raise the substantial amount of capital that would be necessary to drill our drilling locations.” |
| (2) | Excludes non-strategic properties consisting of 548 net acres in Fayette and Tioga Counties, Pennsylvania. Includes 1,338 net acres that were included as a leasehold payable on our balance sheet as of March 31, 2014. |
| (3) | Utica Shale risked drilling locations gives effect to our projected 31% working interest in the Utica Shale after applying unitization and participating interest assumptions described under “Business—Our Operations—Reserve Data—Determination of Drilling Locations.” |
| (4) | Includes wells to be drilled by Gulfport Energy Corporation. Please see “—Utica Shale—Development Agreement and Area of Mutual Interest Agreement.” |
| (5) | Approximately 39,020 gross (36,932 net) acres in the Marcellus Shale is also prospective for the Upper Devonian Shale. The Upper Devonian and the Marcellus Shale are stacked formations within the same geographic footprint. |
Our Properties
The Appalachian Basin, which covers over 185,000 square miles in portions of Kentucky, Tennessee, Virginia, West Virginia, Ohio, Pennsylvania and New York, is considered a highly attractive energy resource producing region with a long history of oil, natural gas and coal production. More importantly, the Appalachian Basin is strategically located near the high energy demand markets of the northeast United States, which has historically resulted in higher realized sales prices due to the reduced transportation costs a purchaser must incur to transport commodities to end users. Over the past five years, the focus of many producers has shifted from the younger, shallower conventional sandstone and carbonate reservoirs to the older, deeper Marcellus Shale and the newly emerging Utica Shale plays, which has driven Appalachian basin production growth.
Marcellus Shale
The Devonian-aged Marcellus Shale is an unconventional reservoir that produces natural gas, NGLs and oil and is the largest unconventional natural gas field in the U.S. The productive limits of the Marcellus Shale cover over 90,000 square miles within Pennsylvania, West Virginia, Ohio and New York. The Marcellus Shale is a
84
Table of Contents
Index to Financial Statements
black, organic-rich shale deposit generally productive at depths between 6,000 to 10,000 feet. Production from the brittle, natural gas-charged shale reservoir is best derived from hydraulically fractured horizontal wellbores that exceed 2,000 feet in lateral length and involve multi-stage fracture stimulations.
In addition, we believe substantially all of our acreage is prospective for the Upper Devonian Shale, which is a black, organic rich shale comprised of the Geneseo Shale, Middlesex Shale and Rhinestreet Shale and is at shallower depths than the Marcellus Shale formation. In Washington and Greene Counties, Pennsylvania, the Upper Devonian Shale and Marcellus Shale are separated by the Tully Limestone which is approximately 30 feet thick in this area. We have drilled and completed three wells in the Upper Devonian Shale and confirmed the presence of the Upper Devonian Shale formation in each of our Marcellus Shale wells drilled as of March 31, 2014.
We have experienced virtually no geologic complexity in our drilling activities through December 31, 2013, which has resulted in a fairly predictable band of expected recoveries per 1,000 feet of lateral length on our wells. We completed 9 gross (9 net) horizontal Marcellus Shale wells in 2012 and 22 gross (19.9 net) horizontal Marcellus Shale wells in 2013. As of March 31, 2014, we had a total of 41 gross (38.0 net) producing wells in the Marcellus Shale. As of March 31, 2014, we had 349 gross (325 net) pro forma identified Marcellus drilling locations.
For the quarter ended March 31, 2014, we had average pro forma net daily production of 209 MMcf/d. As of March 31, 2014, we had four rigs operating in the Marcellus Shale (two tophole rigs and two horizontal rigs), two rigs operating in the Utica Shale (one tophole rig and one horizontal rig).
The following table provides a summary of our current gross and net acreage by county in Pennsylvania on a pro forma basis as of March 31, 2014.
| County |
Gross Acres | Net Acres | ||||||
| Core Southwestern Pennsylvania: |
||||||||
| Washington |
29,103 | 27,525 | ||||||
| Greene |
16,341 | 15,708 | ||||||
| Allegheny |
197 | 197 | ||||||
|
|
|
|
|
|||||
| Total |
45,641 | 43,430 | ||||||
| Other(1) |
548 | 548 | ||||||
|
|
|
|
|
|||||
| Total |
46,189 | 43,978 | ||||||
|
|
|
|
|
|||||
| (1) | Our other acreage within the Marcellus Shale is located in Fayette and Tioga Counties, Pennsylvania. |
In December 2013, we sold all of our Lycoming County acreage (100% non-operated) and related assets to a third party in exchange for $7.0 million. There was no production or net proved reserves attributable to the interests sold. We incurred a loss of $4.2 million in the fourth quarter of 2013 as a result of this transaction.
Utica Shale
The Ordovician-aged Utica Shale is an unconventional reservoir underlying the Marcellus Shale. The productive limits of the Utica Shale cover over 80,000 square miles within Ohio, Pennsylvania, West Virginia and New York. The Utica Shale is an organic-rich continuous black shale, with most production occurring at vertical depths between 7,000 to 10,000 feet. To date, the rich and dry gas windows of the southern Utica Shale play with BTUs ranging from 1,050 to 1,250 have yielded the strongest well results. We estimate that approximately 20% of our Utica acreage is in this rich gas window, with BTUs ranging from 1,100 to 1,200, and the remaining 80% is in the dry gas window. The richest and thickest concentration of organic-carbon content is present within the Point Pleasant Shale layer of the Lower Utica formation. The Point Pleasant Shale is our primary targeted development play of the Utica Shale.
85
Table of Contents
Index to Financial Statements
As of March 31, 2014, we owned 46,700 net acres in the core of the Utica Shale and expect to add to our sizeable land position. The proximity of our Utica acreage position to our operations in the Marcellus Shale allows us to capitalize on operating and midstream synergies. As of March 31, 2014, we had approximately 753 gross (233 net) risked drilling locations in the Utica Shale.
The following table provides a summary of our current gross and net acreage by county in Ohio as of March 31, 2014.
| County |
Gross Acres | Net Acres | ||||||
| Belmont |
44,208 | 44,208 | ||||||
| Guernsey |
3,899 | 1,727 | ||||||
| Harrison |
764 | 764 | ||||||
|
|
|
|
|
|||||
| Total |
48,872 | 46,700 | ||||||
|
|
|
|
|
|||||
| (1) | Excludes Gulfport’s acreage covered by our Development Agreement and AMI Agreement. |
In October 2013, we commenced drilling our initial Utica well, the Bigfoot 7H, in Belmont County, Ohio. In December 2013, after drilling approximately 1,200 feet of the lateral section within the Point Pleasant formation, the well unexpectedly began flowing gas with higher than anticipated bottomhole pressures. We employed certain steps, including increasing our drilling mud weight, that successfully controlled the gas flow. However, certain uncased sections in the vertical portions of the wellbore were compromised by the higher mud weight, which ultimately inhibited our efforts to stabilize the gas flow and pressures. We elected to plug the Bigfoot 7H in late December 2013 and drilled a new horizontal well adjacent to the Bigfoot 7H with reconfigured mud and intermediate casing designs to better manage higher anticipated pressures and gas flows. We wrote off approximately $8.1 million of exploratory costs associated with the drilling of the Bigfoot 7H in the fourth quarter of 2013.
On June 2, 2014, we announced the production test results of our first operated Utica Shale well, the Bigfoot 9H. After five days of flowback, the Bigfoot 9H stabilized at a rate of 41.7 MMcf/d of gas on a 33/64” choke with flowing casing pressures of 5850 psi. Based upon a gas composition analysis, the heat content is 1086 Btu and therefore will not require processing. We own an approximate 93% working interest in the well, which has an effective lateral length of 6,957 feet and was completed with 40 frac stages. First production from the Bigfoot 9H well was delivered into sales in late June 2014. In addition, in June 2014, we drilled and cased our second and third Utica Shale wells, the Blue Thunder 10H and 12H. We are in the process of completing both of these wells, each with lateral lengths of approximately 9,000 feet.
We believe that the production test results obtained on the Bigfoot 9H indicate a highly permeable and porous Point Pleasant formation. However, these pressures may not be an indicator of the production amounts to be expected from future Utica wells. In addition, we may experience further difficulties drilling and completing Utica wells. Please read “Risk Factors—Risks Related to Our Business—We have been an early entrant into new or emerging plays. As a result, our drilling results in these areas are uncertain, and the value of our undeveloped acreage will decline if drilling results are unsuccessful.”
Development Agreement and Area of Mutual Interest Agreement
On October 14, 2013, we entered into a Development Agreement and AMI Agreement with Gulfport covering approximately 50,000 aggregate net acres in the Utica Shale in Belmont County, Ohio. We refer to these agreements as our “Utica Development Agreements.” Pursuant to the Utica Development Agreements, we have an approximately 68.80% participating interest in the Northern Contract Area and an approximately 42.63% participating interest in the Southern Contract Area, each within Belmont County, Ohio. The remaining participating interests are held by Gulfport. The participating interests of us and Gulfport in each of the Northern and Southern Contract Areas approximate our current relative acreage positions in each area.
86
Table of Contents
Index to Financial Statements
Pursuant to the Development Agreement, we are named the operator (or Gulfport will agree to vote in favor of our operatorship) of drilling units located in the Northern Contract Area, and Gulfport is named the operator (or we will agree to vote in favor of its operatorship) of drilling units located in the Southern Contract Area. Upon development of a well on the subject acreage, we and Gulfport will convey to one another, pursuant to a cross conveyance, a working interest percentage equal to the amount of the underlying working interest multiplied by the applicable participating interest. For example, upon development of a well:
| • | Assuming an aggregate 90% working interest is held by us and/or Gulfport in the Northern Contract Area, we and Gulfport will make cross conveyances to one another such that we hold an approximately 61.92% working interest (representing 68.80% of 90%) and Gulfport holds an approximately 28.08% (representing 31.20% of 90%) working interest in the drilling unit; and |
| • | Assuming an aggregate 90% working interest is held by us and/or Gulfport in the Southern Contract Area, we and Gulfport will make cross conveyances to one another such that we hold an approximate 38.37% working interest (representing 42.63% of 90%) and Gulfport holds an approximate 51.63% (representing 57.37% of 90%) working interest in the drilling unit. |
As a result of the Development Agreement, as of December 31, 2013, we are the operator of approximately 27,000 aggregate net acres in the Northern Contract Area, and Gulfport is the operator of approximately 23,000 aggregate net acres in the Southern Contract Area. In addition, as wells are developed in the respective contract area, our average working interests in the Utica Shale will decrease as the applicable participating interests are applied to the developed wells.
Each quarter during the term of the Development Agreement, we and Gulfport will establish a work program and budget detailing the proposed exploration and development to be performed in the Northern and Southern Contract Areas, respectively, for the following year. The number of horizontal wells proposed to be drilled in each of the Northern Contract Area and Southern Contract Area is limited by the Development Agreement as follows: in 2014, between eight and 40 wells; in 2015, between eight and 50 wells; and thereafter, unlimited.
Pursuant to the AMI Agreement, each party has the right to participate at the level of its applicable participating interest in any acquisition by the other party of working interests or leases acquired within the AMIs. Unless a party elects not to participate therein upon notice by the other party, the subject working interest or lease will be governed by the Development Agreement.
The Utica Development Agreements have terms of ten years and are terminable upon 90 days’ notice by either party; provided that, with respect to interests included within a drilling unit, such interests shall remain subject to the applicable joint operating agreement and we and Gulfport shall remain operators of drilling units located in the Northern Contract Area and Southern Contract Area, respectively, following such termination.
Operating Data
The following table provides certain operational data related to our proved developed producing Marcellus wells as of March 31, 2013. We are the operator of each of these wells.
| Wells Turned Into Sales |
Average Wells per Rig Move |
Average Lateral Length (Feet) |
Periodic Flow Rates (MMcf/d)(1) | D&C ($/Foot)(2) |
||||||||||||||||||||||||||||
| Year(s) |
0-90 | 91-180 | 181-360 | 361-720 | ||||||||||||||||||||||||||||
| 2010-2011 |
6 | 1.4 | 3,281 | 5.5 | 6.0 | 4.4 | 2.7 | $ | 2,341 | |||||||||||||||||||||||
| 2012 |
9 | 2.0 | 5,731 | 9.0 | 10.0 | 6.8 | N/A | 1,609 | ||||||||||||||||||||||||
| 2013 |
22 | 2.1 | 6,286 | 11.1 | 10.3 | 9.2 | N/A | 1,461 | ||||||||||||||||||||||||
| 1Q 2014 |
4 | 4.0 | 6,691 | 12.7 | N/A | N/A | N/A | 1,231 | ||||||||||||||||||||||||
|
|
|
|
|
|
|
|
|
|
|
|
|
|
|
|
|
|||||||||||||||||
| Total |
41 | 2.0 | 5,764 | 10.0 | 9.4 | 6.4 | 2.7 | $ | 1,600 | |||||||||||||||||||||||
|
|
|
|
|
|
|
|
|
|
|
|
|
|
|
|
|
|||||||||||||||||
87
Table of Contents
Index to Financial Statements
| (1) | Based on production data through May 1, 2014. |
| (2) | Development and completion (“D&C”) costs are shown gross of our working interest’s proportionate share. |
Midstream Operations
Our exploration and development activities are supported by our operated natural gas low- and high-pressure gathering, compression and transportation assets, as well as by third-party arrangements. Unlike many producing basins in the United States, certain portions of the Appalachian Basin do not have sufficient midstream infrastructure to support the existing and expected increasing levels of production. Actively managing these midstream operations enhances our ability to obtain the necessary takeaway capacity for our production.
We maintain a strong commitment to developing the necessary midstream infrastructure to support our drilling schedule and production growth. We seek to accomplish this goal through a combination of internal asset developments and contractual relationships with third-party midstream service providers. We have invested in building low- and high-pressure gathering lines and water pipeline systems. We will continue to invest in our midstream infrastructure, as it allows us to optimize our gathering and takeaway capacity to support our expected-production growth, affords us more control over the direction and planning of our drilling schedule and has historically lowered our operating costs. In 2014, we estimate we will spend a total of approximately $265.0 million on midstream infrastructure development (excluding amounts paid in connection with the Momentum Acquisition).
As of December 31, 2013, we owned and operated 27 miles of high-pressure gathering pipelines on our Marcellus Shale acreage in Washington County, Pennsylvania. Due to the high flow rates and flowing tubing pressures experienced with our Marcellus wells, none of our wells requires nor utilizes artificial lift or compression.
Our midstream infrastructure in Pennsylvania also includes 33 miles of high-density polyethylene pipelines connected to multiple freshwater impoundments for transporting water to our well completion operations. We commenced construction of this system in 2010 and first utilized the system during the completion of our second horizontal Marcellus well. Since then, we have continued to expand this system and, as of December 31, 2013, this system has been utilized for the completion on substantially all of our Marcellus wells. We will continue to expand this system as our well development progresses and we estimate substantially all of our risked drilling locations in the Marcellus will be connectable to this system. This system delivers year-round water supply, lessens water handling costs and decreases water truck traffic on local roadways. The cost savings associated with sourcing our water through this system, when compared to wells completed with water sourced only by truck, is approximately $500,000 per horizontal well.
On February 12, 2014, we entered into a purchase and sale agreement with M3 to acquire certain gas gathering assets in eastern Washington and Greene Counties, Pennsylvania, for aggregate consideration of approximately $110.0 million in cash. Please see “—Recent Developments—Momentum Acquisition.”
Transportation and Takeaway Capacity
As of March 31, 2014, our average annual contractual firm transportation and firm sales obligations for 2014 (April through December), 2015 and 2016 were approximately 420,000 MMBtu/d, 820,000 MMBtu/d, and 920,000 MMBtu/d, respectively, which are in excess of our pro forma average daily gross operated production of approximately 318,000 MMBtu/d for March 2014. These amounts include approximately 115,000 MMBtu/d of firm sales contracted with a third party through October 2017, subject to annual renewal. Under firm transportation contracts, we are obligated to deliver minimum daily volumes or pay fees for any deficiencies in deliveries. We continue to actively identify and evaluate additional takeaway capacity to facilitate production growth in our Appalachian Basin position.
88
Table of Contents
Index to Financial Statements
Business Strategies
Our objective is to create shareholder value by identifying and assembling a portfolio of low-risk assets with attractive economic profiles and leveraging our technical and managerial expertise to deliver industry-leading results. We seek to achieve this objective by executing the following strategies:
| • | Pursue High-Graded Core Shale Acreage as an Early Entrant. Our acreage acquisition strategy has been predicated on our belief that core acreage provides superior production, ultimate recoveries and returns on investment. We leverage our technical expertise and analyze third-party data to be an early entrant into the core of a shale play. We develop an internally generated geologic model and then study publicly available third-party data, including well results and drilling and completion reports, to confirm our geologic model and define the core acreage position of a play. Once we believe that we have identified the core location, we aggressively execute on our acquisition strategy to establish a largely contiguous acreage position. By virtue of this strategy, we eliminate the need for large exploration programs requiring significant time and capital, and instead pursue areas that have been substantially de-risked, or high-graded, by our competitors. We have applied the expertise and approach that we employed in the Marcellus Shale to the Utica Shale, and we believe we will be able to achieve similar results. |
| • | Target Contiguous Acreage Positions in Prolific Unconventional Resource Plays. We will seek to continue to expand on our success in targeting contiguous acreage positions within the core of the Marcellus and Utica Shales. We believe a concentrated acreage position requires fewer wells and inherently less capital to define the geologic properties across the play and allows us to optimize our wellbore economics. As of March 31, 2014, we had drilled and completed 41 horizontal Marcellus wells, several of which have tested the outer boundaries of our Marcellus acreage position. Additionally, as a result of optimizing our wellbore design with a limited number of wells, we believe our ability to transition from exploration drilling to development drilling in the Marcellus Shale was accomplished with less capital invested than our peers. We intend to replicate this strategy in the Utica Shale. |
| • | Aggressively Develop Leasehold Positions to Economically Grow Production, Cash Flow and Reserves. We intend to continue to aggressively drill and develop our portfolio of 1,313 gross (752 net) pro forma risked drilling locations as of March 31, 2014 with a goal of growing production, cash flow and reserves in an economically-efficient manner. In the first quarter of 2014, we increased to a six-rig drilling program (consisting of three tophole rigs and three horizontal rigs), two of which are operating in the Utica Shale. We expect to continue to operate a six-rig drilling program through the remainder of 2014. In executing our development strategy, we intend to leverage our operational control and the expertise of our technical team to deliver attractive production and cash flow growth. As the operator of a substantial majority of our acreage in the Marcellus and Utica Shales, we are able to manage (i) the timing and level of our capital spending, (ii) our exploration and development drilling strategies and (iii) our operating costs. We will seek to optimize our wellbore economics through a meticulous focus on rig efficiency, wellbore accuracy and completion design and execution. We believe that the combination of our operational control and technical expertise will allow us to build on our track record of superior production, cash flow and reserve growth. |
| • | Maximize Pipeline Takeaway Capacity to Facilitate Production Growth. We maintain a strong commitment to construct, acquire and control the midstream infrastructure necessary to meet our production growth. We will also continue to enter into long-term firm transportation arrangements with third party midstream operators to ensure our access to market. We believe our commitment to midstream infrastructure allows us to commercialize our production more quickly and provides us with a competitive advantage in acquiring bolt-on acreage. |
Competitive Strengths
We possess a number of competitive strengths that we believe will allow us to successfully execute our business strategies:
| • | Large, Contiguous Positions Concentrated in the Core of the Marcellus and Utica Shales. We own extensive and contiguous acreage positions in the core of two of the premier North American shale plays. |
89
Table of Contents
Index to Financial Statements
| We believe we were an early identifier of both the Marcellus Shale core in southwestern Pennsylvania and the Utica Shale core, primarily in Belmont County, Ohio, which allowed us to acquire concentrated acreage positions. Our core position and contiguous acreage in the Marcellus Shale have allowed us to delineate our position as well as produce industry-leading well results, as our wells have some of the highest initial production rates and EURs in the Marcellus Shale. Through a consolidated approach, we are able to increase rig efficiency, turning wells into sales faster, and de-risk our acreage position more efficiently. Additionally, to service our concentrated acreage positions, we construct and acquire water and midstream infrastructure, which enable us to reduce reliance on third party operators, minimize costs and increase our returns. This has been a strength in the Marcellus Shale and we believe our position in the Utica Shale will allow us to achieve similar results. |
| • | Multi-Year, Low-Risk Development Drilling Inventory. Our drilling inventory as of March 31, 2014 consisted of 1,313 gross (752 net) risked drilling locations, with 349 gross (325 net), 753 gross (233 net) and 211 gross (194 net) risked drilling locations in the Marcellus Shale, Utica Shale and Upper Devonian Shale, respectively. We believe that we and other operators in the area have substantially delineated and de-risked our contiguous acreage position in the southwestern core of the Marcellus Shale. As of March 31, 2014, we have drilled and completed 41 wells on our Marcellus Shale acreage with a 100% success rate. In June 2014 we completed our first Utica well, the Bigfoot 9H, which tested at a stabilized rate of 41.7 MMcf/d. Please see “—Recent Developments—Bigfoot 9H Test Results.” |
| • | Expertise in Unconventional Resource Plays and Technology. We have assembled a strong technical staff of shale petroleum engineers and shale geologists that have extensive experience in horizontal drilling, operating multi-rig development programs and using advanced drilling technology. We have been early adopters of new oilfield services and techniques for drilling (including rotary steerable tools) and completions (including reduced-length frac stages). In the Marcellus Shale as of March 31, 2014, we have completed 41 gross horizontal wells totaling approximately 236,000 lateral feet. We have realized improvements in our drilling efficiency over time and we are now drilling lateral sections approximately 50% longer in approximately half the time as it has taken us historically. Our average horizontal lateral drilled in 2011 was 4,733 feet and took 13.0 days to drill from kickoff to total depth. Our average horizontal lateral drilled in 2013 was 7,700 feet and took 5.8 days to drill from kickoff to total depth. Our operating proficiency has also led to increased wellbore accuracy, completion design efficiencies and has yielded top tier production results as reflected in the fact that out of approximately 550 producing horizontal Marcellus Shale wells in Washington County, Pennsylvania, we drilled and completed the top two and four of the top six wells in terms of cumulative production through June 30, 2013, as reported by Pennsylvania’s oil and gas department. Further, we are able to enhance our wellbore economics through multi-well pad drilling (one to nine wells per rig move) and long laterals targeting 6,000 to 10,000 feet. |
| • | Successful Infill Leasing Program. We have increased our acreage position in the core of the Marcellus Shale through bolt-on leases in the same targeted area. This strategy has allowed us to acquire acreage that provides additional drilling locations and/or adds horizontal feet to future wells. By implementing this strategy, we have grown our Marcellus Shale acreage position in Washington County from our initial acquisition of 642 net acres in 2009 to 43,978 net acres as of March 31, 2014. We have replicated this strategy successfully in the Utica Shale in Belmont County as well, leasing an additional 13,201 net acres as of March 31, 2014 since our initial acquisition of approximately 33,499 net acres in November 2012. We intend to continue to focus our near-term leasing program on Greene and Washington Counties in Pennsylvania and on Belmont County in Ohio, with the strategy of using bolt-on leases to acquire acreage that immediately increases our drilling locations and/or drillable horizontal feet. |
| • | Access to Committed Takeaway Capacity. Our gas gathering pipeline system is currently designed to handle up to approximately 1.5 Bcf/d in the aggregate and, as of March 31, 2014, has an operating capacity of approximately 620 MMcf/d in the aggregate. This system connects our producing wells to multiple interstate transmission and other third-party pipelines. We plan to continue to build out our Pennsylvania gathering system congruent with our future development plans. We plan to replicate our strategy of constructing and controlling our own midstream system in Ohio and expect to have our gathering system in |
90
Table of Contents
Index to Financial Statements
| Belmont County substantially complete by the second quarter of 2015. We believe our commitment to constructing and controlling midstream assets allows us to efficiently bring wells online, mitigates the risk of unplanned shut-ins and creates pricing and transportation optionality by connecting to multiple interstate pipelines. To further ensure the deliverability of our Utica Shale production, we have entered into a precedent agreement for 175,000 MMBtu/d firm transportation on the Rockies Express Pipeline beginning in June 2015 for a term of 20 years, which will provide us with greater access to Gulf Coast and Midwest markets. With this capacity, our firm transportation and firm sales portfolio will cover approximately 818,000 MMBtu/d in 2015 and 921,000 MMBtu/d in 2016. By securing firm transportation and firm sales contracts, we are better able to accommodate our growing production and manage basis differentials. |
| • | Significant Liquidity and Active Hedging Program. As of March 31, 2014, we had cash on hand of approximately $228.7 million and as of May 31, 2014, we had availability under our revolving credit facility of approximately $313.5 million. We believe this liquidity, along with our cash flow from operations, is sufficient to execute our current capital program. Additionally, our hedging program mitigates commodity price volatility and protects our future cash flows. We review our hedge position on an ongoing basis, taking into account our current and forecasted production volumes and commodity prices. As of May 1, 2014, we had entered into hedging contracts covering approximately 57 Bcf (207 MMcf/d) of natural gas production for April 2014 through December 2014 at a weighted average index floor price of $4.06 per MMBtu. Furthermore, as of May 1, 2014, we had entered into hedging contracts covering approximately 59.1 Bcf (162 MMcf/d) of natural gas production for 2015 at a weighted average index floor price of $4.05 per MMBtu. |
| • | Proven and Stockholder-Aligned Management Team. Our management team possesses extensive oil and natural gas acquisition, exploration and development expertise in shale plays. For a discussion of our management’s experience, please read “Management.” Our Chief Executive Officer, Chief Operating Officer, Vice President of Exploration & Geology and Vice President of Drilling have worked for us since we drilled our first horizontal Marcellus well. Our management team includes certain members of the Rice family (the founders of Rice Partners) who, along with other members of the management team, are also highly aligned with stockholders through a 31.3% economic interest in us after giving effect to this offering. In addition, our management team has a significant indirect economic interest in us through their ownership of incentive units in the form of interests in Rice Holdings and NGP Holdings. The value of these incentive units may increase over time, without diluting public investors, if our stock price appreciates in the future. For additional information regarding our incentive units, please read “Executive Compensation—Narrative Description to the Summary Compensation Table for the 2013 Fiscal Year—Long-Term Incentive Compensation.” We believe that our management team’s direct and indirect ownership interest in us will provide significant incentives to grow the value of our business. |
Initial Public Offering, Corporate Reorganization and Related Transactions
Initial Public Offering
On January 29, 2014, we completed our initial public offering (“IPO”) of 50,000,000 shares of our $0.01 par value common stock, which included 30,000,000 shares sold by us, 14,000,000 shares sold by NGP Holdings, the selling stockholder in our IPO and 6,000,000 shares subject to an option granted to the underwriters by the selling stockholder.
The net proceeds of our IPO, based on the public offering price of $21.00 per share, were approximately $993.5 million, which resulted in net proceeds to us of $593.6 million after deducting expenses and underwriting discounts and commissions of approximately $36.4 million and net proceeds to the selling stockholders of approximately $399.0 million after deducting underwriting discounts of approximately $21.0 million. We did not receive any proceeds from the sale of the shares by the selling stockholder. A portion of the net proceeds from our IPO were used to repay all outstanding borrowings under the revolving credit facility of our Marcellus joint venture, to make a $100.0 million payment to Alpha Holdings in partial consideration for the Marcellus JV Buy-In and to repay all outstanding borrowings under our revolving credit facility. The remainder of the net proceeds from our IPO are being used to fund a portion of our capital expenditure plan.
91
Table of Contents
Index to Financial Statements
Corporate Reorganization
A corporate reorganization occurred concurrently with the completion of our IPO on January 29, 2014. As a part of this corporate reorganization, we acquired all of the outstanding membership interests in Rice Appalachia in exchange for shares of our common stock. Our business continues to be conducted through Rice Drilling B, as a wholly owned subsidiary. As of January 29, 2014, upon (a) the completion of the IPO, (b) the issuance of (i) 43,452,550 shares of common stock to NGP Holdings, (ii) 20,300,923 shares of common stock to Rice Holdings, (iii) 2,356,844 shares of common stock to Daniel J. Rice III, (iv) 20,000,000 shares of common stock to Rice Partners, (v) 160,831 shares of common stock to the persons holding incentive units representing interests in Rice Appalachia and (vi) 1,728,852 shares of common stock to the members of Rice Drilling B (other than Rice Appalachia), each of which were issued by us in connection with the closing of the IPO, and (c) the issuance of 9,523,810 shares of common stock to Alpha Holdings in connection with the completion of the Marcellus JV Buy-In described below under “—Marcellus JV Buy-In,” we had 127,523,810 shares of common stock outstanding.
Marcellus JV Buy-In
On January 29, 2014, in connection with the closing of the IPO and pursuant to the Transaction Agreement between us and Alpha Holdings dated as of December 6, 2013 (the “Transaction Agreement”), we completed our acquisition of Alpha Holdings’ 50% interest in our Marcellus joint venture in exchange for total consideration of $322 million, consisting of $100 million of cash and our issuance to Alpha Holdings of 9,523,810 shares of our common stock.
Recent Developments
Western Greene County Acquisition
On July 7, 2014, we announced our signing of a definitive purchase and sale agreement to acquire approximately 22,000 net acres and 12 developed Marcellus wells in western Greene County, Pennsylvania, from Chesapeake Appalachia, L.L.C. and its partners for approximately $336 million (the “Greene County Acquisition”). We expect to close the transaction in August 2014, subject to customary closing conditions, with an effective date of February 1, 2014.
Upon completion of the Greene County Acquisition, the acquired properties are expected to:
| • | represent a 24% increase in our aggregate net acreage position and a 50% increase in our net acreage position in the core of the Marcellus Shale in southwestern Pennsylvania, each as of March 31, 2014; |
| • | add approximately 152 risked (190 unrisked) net drilling locations with an assumed 7,000’ average lateral length, representing a 47% increase to our Marcellus inventory of 325 net risked locations as of March 31, 2014; |
| • | be 100% operated (average 95% working interest) with anticipated production being 1,080-1,100 BTU gas; and |
| • | add 20 MMcf/d current net production from seven producing wells, with five additional wells in progress. |
The acquired acreage will be dedicated to Access Midstream Partners. While the terms of the gas gathering agreement remain subject to negotiation, we expect the service fees will remain in line with historical rates of $0.45 per MMBtu for gathering and $0.12 per MMBtu for compression.
This offering is not contingent on the successful completion of the Greene County Acquisition. There can be no assurance that the Greene County Acquisition will close in the anticipated time frame or at all, or that we will realize the expected benefit from the Greene County Acquisition. See “Risk Factors—Risks Related to the Greene County Acquisition.”
92
Table of Contents
Index to Financial Statements
Utica Update
On June 2, 2014, we announced the production test results of our first operated Utica Shale well, the Bigfoot 9H. After five days of flowback, the Bigfoot 9H stabilized at a rate of 41.7 MMcf/d of gas on a 33/64” choke with flowing casing pressures of 5850 psi. Based upon a gas composition analysis, the heat content is 1086 Btu and therefore will not require processing. We own an approximate 93% working interest in the well, which has an effective lateral length of 6,957 feet and was completed with 40 frac stages. First production from the Bigfoot 9H well was delivered into sales in late June 2014. In addition, in June 2014, we drilled and cased our second and third Utica Shale wells, the Blue Thunder 10H and 12H. We are in the process of completing both of these wells, each with lateral lengths of approximately 9,000 feet.
Senior Notes Offering
On April 25, 2014, we offered $900.0 million (the “Senior Notes Offering”) in aggregate principal amount of 6.25% senior notes due 2022 (the “Notes”) in a private placement to eligible purchasers under Rule 144A and Regulation S of the Securities Act, which resulted in net proceeds of $882.7 million after deducting estimated expenses and underwriting discounts and commissions of approximately $17.3 million. We used $301.8 million of the net proceeds to repay and retire our Second Lien Term Loan Facility, and the remainder of the proceeds will be used to fund a portion of our 2014 capital expenditure program.
Momentum Acquisition
On April 17, 2014, we completed an acquisition of certain gas gathering assets in eastern Washington and Greene Counties (the “Momentum Acquisition”) for aggregate consideration of approximately $110.0 million. The effective date for the Momentum Acquisition is March 1, 2014. We funded the acquisition with cash on hand.
The properties acquired in the Momentum Acquisition consist of a 28-mile, 6”-16” gathering system in eastern Washington County, Pennsylvania, and permits and rights of way in Washington and Greene Counties, Pennsylvania, necessary to construct an 18-mile, 30” gathering system connecting the northern system to the Texas Eastern pipeline. The northern system is supported by long-term contracts with acreage dedications covering approximately 20,000 acres from third parties. Once fully constructed, the acquired systems are expected to have an aggregate capacity of over 1 bcf of natural gas per day.
Third Amended and Restated Senior Secured Revolving Credit Facility
On April 10, 2014, we, as borrower, and Rice Drilling B, as predecessor borrower, entered into the Third Amended and Restated Credit Agreement (the “Third Amended and Restated Credit Agreement”). Among other things, in connection with the Third Amended and Restated Credit Agreement, Rice Drilling B assigned all of its rights and obligations under the Second Amended and Restated Credit Agreement to us, and we assumed all such rights and obligations as borrower under the Third Amended and Restated Credit Agreement. Furthermore, the Third Amended and Restated Credit Agreement (i) allowed for the Senior Notes Offering (described below) and (ii) provided that we would not incur an immediate reduction in our borrowing base under the credit facility as a result of the Senior Notes Offering.
Our Operations
Reserve Data
The information with respect to our estimated reserves presented below has been prepared in accordance with the rules and regulations of the SEC.
93
Table of Contents
Index to Financial Statements
Reserves Presentation
Our estimated proved reserves and PV-10 as of December 31, 2013 and 2012 are based on evaluations prepared by our independent reserve engineers, NSAI. Copies of the summary reports of NSAI with respect to our reserves as of December 31, 2013 are filed as exhibits to this prospectus. See “—Preparation of Reserve Estimates” for definitions of proved reserves and the technologies and economic data used in their estimation.
The following table summarizes our historical and pro forma estimated proved reserves and related PV-10 at December 31, 2013 and 2012.
| Natural Gas | ||||||||||||||||||||||||
| Estimated Net Reserves (Bcf)(1) | ||||||||||||||||||||||||
| As of December 31, 2013 | As of December 31, 2012 | |||||||||||||||||||||||
| Rice Energy Inc. Pro Forma |
Rice Drilling B |
Marcellus Joint Venture(2) |
Rice Energy Inc. Pro Forma |
Rice Drilling B |
Marcellus Joint Venture(2) |
|||||||||||||||||||
| Estimated Proved Reserves: |
||||||||||||||||||||||||
| Total proved reserves |
602 | 382 | 110 | 561 | 304 | 128 | ||||||||||||||||||
| Total proved developed reserves |
250 | 144 | 53 | 131 | 61 | 35 | ||||||||||||||||||
| Total proved developed producing reserves |
177 | 91 | 43 | 101 | 57 | 22 | ||||||||||||||||||
| Total proved developed non-producing reserves |
73 | 53 | 10 | 30 | 4 | 13 | ||||||||||||||||||
| Total proved undeveloped reserves |
352 | 238 | 57 | 430 | 243 | 93 | ||||||||||||||||||
| Percent proved developed |
42 | % | 38 | % | 48 | % | 23 | % | 20 | % | 27 | % | ||||||||||||
| PV-10 of proved reserves (in millions)(3) |
$ | 709 | $ | 417 | $ | 146 | $ | 245 | $ | 102 | $ | 71 | ||||||||||||
| (1) | Our historical and pro forma estimated proved reserves, PV-10 and standardized measure were determined using a 12-month average price for natural gas. The prices used in our reserve reports yield weighted average wellhead prices, which are based on index prices and adjusted for energy content, transportation fees and regional price differentials. The index prices and the equivalent wellhead prices are shown in the table below. |
| Index Prices—Natural Gas (per MMBtu) |
Weighted Average Wellhead Prices— Natural Gas (per Mcf) |
|||||||||||||||||||||||
| Rice Energy Inc. Pro Forma |
Rice Drilling B |
Marcellus Joint Venture(2) |
Rice Energy Inc. Pro Forma |
Rice Drilling B |
Marcellus Joint Venture(2) |
|||||||||||||||||||
| December 31, 2013 |
3.67 | 3.67 | 3.67 | 3.90 | 3.91 | 3.90 | ||||||||||||||||||
| December 31, 2012 |
2.76 | 2.76 | 2.76 | 2.85 | 2.86 | 2.84 | ||||||||||||||||||
| (2) | Amounts presented for our Marcellus joint venture give effect to our 50% equity investment in our Marcellus joint venture. |
| (3) | PV-10 is a non-GAAP financial measure and generally differs from standardized measure, the most directly comparable GAAP financial measure, because it does not include the effects of income taxes on future net revenues. However, the respective historical PV-10s and standardized measures of us and our Marcellus joint venture are equivalent because as of December 31, 2013 and 2012, we and our Marcellus joint venture were not subject to entity level taxation. Accordingly, no provision for federal or state corporate income taxes has been provided because taxable income is passed through to our respective equity holders. However, in connection with the closing of our IPO, as a result of our corporate reorganization, we became a corporation subject to federal income tax and, as such, our future income taxes will be dependent upon our future taxable income. We estimate that our pro forma standardized measure, our historical standardized measure and the historical standardized measure for our Marcellus joint venture as of December 31, 2013, would have been approximately $444 million, $269 million and $175 million, respectively, as adjusted to give effect to the present value of approximately $265 million, $148 million and $117 million, respectively, |
94
Table of Contents
Index to Financial Statements
| of future income taxes as a result of our being treated as a corporation for federal income tax purposes. We estimate that our pro forma standardized measure, our historical standardized measure and the historical standardized measure for our Marcellus joint venture as of December 31, 2012, would have been approximately $163 million, $67 million and $96 million, respectively, as adjusted to give effect to the present value of approximately $84 million, $37 million and $47 million, respectively, of future income taxes as a result of our being treated as a corporation for federal income tax purposes. Neither PV-10 nor standardized measure represents an estimate of the fair market value of our natural gas properties. We and others in the industry use PV-10 as a measure to compare the relative size and value of proved reserves held by companies without regard to the specific tax characteristics of such entities. |
Proved Undeveloped Reserves
Proved undeveloped reserves are included in the previous table of total proved reserves. The following table summarizes the changes in the estimated historical and pro forma proved undeveloped reserves of us and our Marcellus joint venture during 2013 and 2012 (in MMcf):
| Rice Energy Inc. Pro Forma |
Rice Drilling B |
Marcellus joint venture(1) |
||||||||||
| Proved undeveloped reserves, December 31, 2011 |
294,857 | 207,599 | 43,629 | |||||||||
| Conversions into proved developed reserves |
(33,908 | ) | (15,120 | ) | (9,394 | ) | ||||||
| Extensions |
330,851 | 164,561 | 83,145 | |||||||||
| Price revisions |
(162,543 | ) | (113,993 | ) | (24,275 | ) | ||||||
|
|
|
|
|
|
|
|||||||
| Proved undeveloped reserves, December 31, 2012 |
429,257 | 243,047 | 93,105 | |||||||||
| Conversions into proved developed reserves |
(156,136 | ) | (79,266 | ) | (38,435 | ) | ||||||
| Extensions |
105,366 | 65,744 | 19,811 | |||||||||
| Price revisions |
(25,510 | ) | 8,826 | (17,168 | ) | |||||||
|
|
|
|
|
|
|
|||||||
| Proved undeveloped reserves, December 31, 2013 |
352,977 | 238,351 | 57,313 | |||||||||
|
|
|
|
|
|
|
|||||||
| (1) | Amounts presented for our Marcellus joint venture give effect to our 50% equity investment in our Marcellus joint venture. |
During 2013, on a pro forma basis, extensions, discoveries, and other additions of 105,366 MMcf proved undeveloped reserves were added through the drillbit in the Marcellus Shale. The negative revision was primarily due to four Marcellus joint venture wells being removed from our current development plan. During 2012, on a pro forma basis, extensions, discoveries, and other additions of 330,851 MMcf proved undeveloped reserves were added through the drillbit in the Marcellus Shale. Downward price revisions resulted in a reduction of proved undeveloped reserves by 162,543 MMcf.
During 2013, on a pro forma basis, we incurred costs of approximately $156.0 million to convert 156,136 MMcf of proved undeveloped reserves to proved developed reserves. During 2012, on a pro forma basis, we incurred costs of approximately $36.0 million to convert 33,908 MMcf of proved undeveloped reserves to proved developed reserves. Estimated future development costs relating to the development of our proved undeveloped reserves as of December 31, 2013 on a pro forma basis are approximately $313.0 million over the next five years, which we expect to finance through proceeds from our IPO, cash flow from operations, borrowings under our revolving credit facility and other sources of capital financing. Our drilling programs are focused on proving our undeveloped leasehold acreage through delineation drilling. While we will continue to drill leasehold delineation wells and build on our current leasehold position, we will also focus on drilling our proved undeveloped reserves. Based on our reserve reports as of December 31, 2013, we had 44 gross (39 net) pro forma locations in the Marcellus Shale associated with proved undeveloped reserves and 13 gross (12 net) locations in the Marcellus Shale associated with proved developed not producing reserves. All of our proved undeveloped reserves are expected to be developed over the next five years. See “Risk Factors—Risks Related to
95
Table of Contents
Index to Financial Statements
Our Business—The development of our estimated proved undeveloped reserves may take longer and may require higher levels of capital expenditures than we anticipate. Therefore, our estimated proved undeveloped reserves may not be ultimately developed or produced.”
Preparation of Reserve Estimates
Our pro forma reserve estimates as of December 31, 2013 and 2012 included in this prospectus were based on evaluations prepared by the independent petroleum engineering firm of NSAI in accordance with Standards Pertaining to the Estimating and Auditing of Oil and Gas Reserves Information promulgated by the Society of Petroleum Evaluation Engineers and definitions and guidelines established by the SEC. Our independent reserve engineers were selected for their historical experience and geographic expertise in engineering unconventional resources.
Proved reserves are reserves which, by analysis of geoscience and engineering data, can be estimated with reasonable certainty to be economically producible from a given date forward from known reservoirs under existing economic conditions, operating methods and government regulations prior to the time at which contracts providing the right to operate expires, unless evidence indicates that renewal is reasonably certain. The term “reasonable certainty” implies a high degree of confidence that the quantities of oil or natural gas actually recovered will equal or exceed the estimate. The technical and economic data used in the estimation of our proved reserves include, but are not limited to, well logs, geologic maps, well-test data, production data (including flow rates), well data (including lateral lengths), historical price and cost information, and property ownership interests. Our independent reserve engineers use this technical data, together with standard engineering and geoscience methods, or a combination of methods, including performance analysis, volumetric analysis and analogy. The proved developed reserves and EURs per well are estimated using performance analysis and volumetric analysis. The estimates of the proved developed reserves and EURs for each developed well are used to estimate the proved undeveloped reserves for each proved undeveloped location (utilizing type curves, statistical analysis, and analogy). Proved undeveloped locations that are more than one offset from a proved developed well utilized reliable technologies to confirm reasonable certainty. The reliable technologies that were utilized in estimating these reserves include log data, performance data, log cross sections, seismic data, core data, and statistical analysis.
Internal Controls
We maintain an internal staff of petroleum engineers and geoscience professionals who work closely with our independent reserve engineers to ensure the integrity, accuracy and timeliness of data furnished to NSAI in their reserves estimation process. Ryan I. Kanto, our Vice President of Operations, is the technical person primarily responsible for overseeing the preparation of our reserve estimates. He has substantial industry experience with positions of increasing responsibility in engineering and evaluations. Throughout each fiscal year, our technical team meets with representatives of our independent reserve engineers to review properties and discuss methods and assumptions used in preparation of the proved reserves estimates. While we have no formal committee specifically designated to review reserves reporting and the reserves estimation process, a preliminary copy of the reserve report is reviewed by our senior management with representatives of our independent reserve engineers and internal technical staff.
Qualifications of Responsible Technical Persons
Ryan I. Kanto joined Rice Energy in June 2011 and serves as our Vice President of Operations. Prior to Rice Energy, Mr. Kanto worked at EnCana Oil & Gas (USA) Inc. from June 2007 to May 2011. During this time he served as a facilities engineer in the Deep Bossier from June 2007 to January 2008, a reservoir engineer in the Barnett Shale until February 2009, and completion engineer in the Haynesville Shale until his departure. Mr. Kanto has bachelors degrees in Chemical Engineering and Engineering Management from the University of Arizona and has significant experience in unconventional shale gas plays.
96
Table of Contents
Index to Financial Statements
Our proved reserve estimates shown herein at December 31, 2013 and 2012 and the proved reserve estimates shown herein for our Marcellus joint venture have been independently prepared by NSAI, a worldwide leader of petroleum property analysis for industry and financial organizations and government agencies. NSAI was founded in 1961 and performs consulting petroleum engineering services under the Texas Board of Professional Engineers Registration No. F-2699. Within NSAI, the technical person primarily responsible for preparing the estimates set forth in the NSAI letters, each of which is filed as an exhibit to this registration statement, was Richard B. Talley, Jr., Vice President, Team Leader, and a consulting petroleum engineer. Mr. Talley is a Registered Professional Engineer in the State of Texas (License No. 102425). Mr. Talley joined NSAI in 2004 after serving as a Senior Engineer at ExxonMobil Production Company. Mr. Talley’s areas of specific expertise include probabilistic assessment of exploration prospects and new discoveries, estimation of oil and gas reserves, and workovers and completions. Mr. Talley received an MBA degree from Tulane University in 2001 and a BS degree in Mechanical Engineering from University of Oklahoma in 1998. Mr. Talley meets or exceeds the education, training and experience requirements set forth in the Standards Pertaining to the Estimating and Auditing of Oil and Gas Reserves Information promulgated by the Society of Petroleum Engineers; he is proficient in judiciously applying industry standard practices to engineering and geoscience evaluations as well as applying SEC and other industry reserve definitions and guidelines.
Determination of Drilling Locations
Our gross (net) drilling locations are those drilling locations identified by management based on the following criteria:
| • | Drillable Locations—These are mapped locations that our Vice President of Exploration & Geology has deemed to have a high likelihood as being drilled or are currently in development but have not yet commenced production. With respect to our Pennsylvania acreage, we had 224 gross (200 net) pro forma drillable Marcellus locations and 134 gross (117 net) pro forma drillable Upper Devonian locations as of December 31, 2013. With respect to our Ohio acreage, as of December 31, 2013, we had 637 gross (192 net) drillable Utica locations, all of which are located within the contract areas covered by our Development Agreement and AMI Agreement with Gulfport. |
| • | Estimated Locations—These remaining estimated locations are calculated by taking our total acreage, less acreage that is producing or included in drillable locations, and dividing such amount by our expected well spacing to arrive at our unrisked estimated locations which is then multiplied by a risking factor. We assume these Marcellus locations have 6,000 foot laterals and 600 foot spacing between Marcellus wells which yields approximately 80 acre spacing. We assume these Upper Devonian locations have 6,000 foot laterals and 1,000 foot spacing between Upper Devonian wells which yields approximately 140 acre spacing. We assume these Utica locations have 8,000 foot laterals and 600 foot spacing between Utica wells which yields approximately 110 acre spacing. With respect to our Pennsylvania acreage, we multiply our unrisked estimated Marcellus and Upper Devonian locations by a risking factor of 50% to arrive at total risked estimated locations. As a result, we had 125 gross (125 net) pro forma estimated risked Marcellus locations and 77 gross (77 net) pro forma estimated risked Upper Devonian locations as of December 31, 2013. With respect to our Ohio acreage, we multiply our unrisked estimated locations by a risking factor of approximately 37% to arrive at total risked estimated locations. We then apply our assumed working interest for such location, calculated by applying the impact of assumed unitization on the underlying working interest as well as, in the case of locations within the AMI with Gulfport, the applicable participating interest. As a result, as of December 31, 2013, we had 116 gross (41 net) estimated risked Utica locations. Estimated locations include ununitized locations that have been risked (50% in the Marcellus, 37% in the Utica) to take into account the risk of forming drilling units. |
| • | Net Unrisked Locations—Consist of Drillable Locations and Estimated Locations without applying our risking factor. We assume 450 net unrisked Marcellus locations (200 pro forma net drillable Marcellus locations and 250 pro forma net estimated unrisked Marcellus locations). We assume 304 net unrisked Utica locations (192 pro forma net drillable Utica locations and 112 net estimated unrisked Utica locations). |
97
Table of Contents
Index to Financial Statements
| • | Net Risked Locations—Consist of Drillable Locations and Estimated Locations. We assume 325 net risked Marcellus locations (200 pro forma net drillable Marcellus locations and 125 pro forma net estimated risked Marcellus locations). We assume 233 net risked Utica locations (192 pro forma net drillable Utica locations and 41 net estimated risked Utica locations). |
Production, Revenues and Price History
Natural gas, NGLs, and oil are commodities; therefore, the price that we receive for our production is largely a function of market supply and demand. While demand for natural gas in the United States has increased dramatically since 2000, natural gas and NGL supplies have also increased significantly as a result of horizontal drilling and fracture stimulation technologies which have been used to find and recover large amounts of oil and natural gas from various shale formations throughout the United States. Demand is impacted by general economic conditions, weather and other seasonal conditions. Over or under supply of natural gas can result in substantial price volatility. Historically, commodity prices have been volatile, and we expect that volatility to continue in the future. A substantial or extended decline in natural gas prices or poor drilling results could have a material adverse effect on our financial position, results of operations, cash flows, quantities of natural gas reserves that may be economically produced and our ability to access capital markets. See “Risk Factors—Risks Related to Our Business—Natural gas, NGL and oil prices are volatile. A substantial or extended decline in natural gas prices may adversely affect our business, financial condition or results of operations and our ability to meet our capital expenditure obligations and financial commitments.”
98
Table of Contents
Index to Financial Statements
The following table sets forth information regarding production, revenues and realized prices and production costs on a historical basis for the years ended December 31, 2013, 2012 and 2011, for us and our Marcellus joint venture on a standalone basis and on a pro forma basis for the year ended December 31, 2013. Amounts shown for our Marcellus joint venture give effect to the 50% equity investment we held therein as of December 31, 2013. For additional information on price calculations, see information set forth in “Management’s Discussion and Analysis of Financial Condition and Results of Operations.”
| For the Year Ended December 31, | ||||||||||||
| 2013 | 2012 | 2011 | ||||||||||
| Natural gas sales (in thousands): |
||||||||||||
| Pro Forma Rice Energy Inc. |
$ | 178,525 | ||||||||||
| Rice Drilling B |
87,847 | $ | 26,743 | $ | 13,972 | |||||||
| Marcellus joint venture |
45,339 | 13,142 | 2,872 | |||||||||
| Production data (MMcf): |
||||||||||||
| Pro Forma Rice Energy Inc. |
45,881 | |||||||||||
| Rice Drilling B |
22,995 | 8,769 | 3,392 | |||||||||
| Marcellus joint venture |
11,443 | 4,296 | 697 | |||||||||
| Average prices before effects of hedges per Mcf: |
||||||||||||
| Pro Forma Rice Energy Inc. |
$ | 3.89 | ||||||||||
| Rice Drilling B |
3.82 | $ | 3.05 | $ | 4.12 | |||||||
| Marcellus joint venture |
3.96 | 3.06 | 4.12 | |||||||||
| Average realized prices after effects of hedges per Mcf(1): |
||||||||||||
| Pro Forma Rice Energy Inc. |
$ | 4.01 | ||||||||||
| Rice Drilling B |
3.85 | $ | 3.15 | $ | 4.29 | |||||||
| Marcellus joint venture |
4.16 | 3.07 | 4.12 | |||||||||
| Average costs per Mcf(2): |
||||||||||||
| Pro Forma Rice Energy Inc.: |
||||||||||||
| Lease operating |
$ | 0.36 | ||||||||||
| Gathering, compression and transportation |
0.55 | |||||||||||
| General and administrative |
0.44 | |||||||||||
| Depletion, depreciation and amortization |
1.57 | |||||||||||
| Rice Drilling B: |
||||||||||||
| Lease operating |
$ | 0.36 | $ | 0.42 | $ | 0.48 | ||||||
| Gathering, compression and transportation |
0.43 | 0.43 | 0.16 | |||||||||
| General and administrative |
0.74 | 0.87 | 1.54 | |||||||||
| Depletion, depreciation and amortization |
1.43 | 1.61 | 1.76 | |||||||||
| Marcellus joint venture: |
||||||||||||
| Lease operating |
$ | 0.36 | $ | 0.39 | $ | 0.51 | ||||||
| Gathering, compression and transportation |
0.68 | 0.78 | 0.04 | |||||||||
| General and administrative |
0.14 | 0.24 | 0.26 | |||||||||
| Depletion, depreciation and amortization |
1.09 | 1.10 | 1.57 | |||||||||
| (1) | The effect of hedges includes realized gains and losses on commodity derivative transactions. |
| (2) | Does not include production taxes and impact fees. Please see “Management’s Discussion and Analysis of Financial Condition and Results of Operations—Principal Components of our Cost Structure.” |
Productive Wells
As of March 31, 2014, we had a total of 41 gross (38.0 net) producing wells in the Marcellus Shale. We did not have interests in any wells producing oil or NGLs as of March 31, 2014.
99
Table of Contents
Index to Financial Statements
Acreage
The following table sets forth certain information regarding the pro forma total developed and undeveloped acreage in which we owned an interest as of March 31, 2014. Approximately 51% of our Marcellus acreage and none of our Utica acreage was held by production at March 31, 2014. Acreage related to royalty, overriding royalty and other similar interests is excluded from this table.
| Developed Acres | Undeveloped Acres | Total Acres | ||||||||||||||||||||||
| Basin |
Gross | Net | Gross | Net | Gross | Net | ||||||||||||||||||
| Marcellus |
4,518 | 4,066 | 41,671 | 39,912 | 46,189 | 43,978 | ||||||||||||||||||
| Utica |
129 | 120 | 48,743 | 46,580 | 48,872 | 46,700 | ||||||||||||||||||
|
|
|
|
|
|
|
|
|
|
|
|
|
|||||||||||||
| Total |
4,646 | 4,186 | 90,414 | 86,492 | 95,061 | 90,678 | ||||||||||||||||||
|
|
|
|
|
|
|
|
|
|
|
|
|
|||||||||||||
Undeveloped Acreage Expirations
The following table sets forth the number of pro forma total undeveloped acres as of March 31, 2014 that will expire in 2014, 2015, 2016, 2017 and 2018 and thereafter unless production is established within the spacing units covering the acreage prior to the expiration dates or unless such leasehold rights are extended or renewed. We have not attributed any PUD reserves to acreage for which the expiration date precedes the scheduled date for PUD drilling. In addition, we do not anticipate material delay rental or lease extension payments in connection with such acreage.
| Basin |
2014 | 2015 | 2016 | 2017 | 2018+ | |||||||||||||||
| Marcellus—Southwestern Pennsylvania Core |
1,054 | 2,365 | 2,485 | 2,622 | 12,915 | |||||||||||||||
| Utica |
— | — | 397 | 33,017 | 13,286 | |||||||||||||||
|
|
|
|
|
|
|
|
|
|
|
|||||||||||
| Total |
1,054 | 2,365 | 2,882 | 35,639 | 26,201 | |||||||||||||||
|
|
|
|
|
|
|
|
|
|
|
|||||||||||
Drilling Activity
The following table describes our drilling activity on our acreage during the years ended December 31, 2013, 2012 and 2011 on a pro forma basis:
| Productive Wells | Dry Wells | Total | ||||||||||||||||||||||
| Gross | Net | Gross | Net | Gross | Net | |||||||||||||||||||
| 2013 |
23.0 | 20.9 | — | — | 23.0 | 20.9 | ||||||||||||||||||
| 2012 |
10.0 | 10.0 | — | — | 10.0 | 10.0 | ||||||||||||||||||
| 2011 |
6.0 | 5.5 | — | — | 6.0 | 5.5 | ||||||||||||||||||
During 2013, we began drilling our Bigfoot 7H well, our first exploratory well in the Utica Shale. Please see “—Utica Shale.” We drilled no exploratory wells during 2012 or 2011.
Major Customers
For the year ended December 31, 2013, sales to Sequent and Dominion represented 94% and 6% of our total sales, respectively, on a pro forma basis. For the year ended December 31, 2012, sales to Sequent accounted for 100% of our total sales. Although a substantial portion of production is purchased by these major customers, we do not believe the loss of one or both customers would have a material adverse effect on our business, as other customers or markets would be accessible to us. However, if we lose one or both of these customers, there is no guarantee that we will be able to enter into an agreement with a new customer which is as favorable as our current agreements.
100
Table of Contents
Index to Financial Statements
Title to Properties
In the course of acquiring the rights to develop oil and natural gas, it is standard procedure for us and the lessor to execute a lease agreement with payment subject to title verification. In most cases, we incur the expense of retaining lawyers to verify the rightful owners of the oil and gas interests prior to payment of such lease bonus to the lessor. There is no certainty, however, that a lessor has valid title to its lease’s oil and gas interests. In those cases, such leases are generally voided and payment is not remitted to the lessor. As such, title failures may result in fewer net acres to us. As is customary in the industry, in the case of undeveloped properties, often cursory investigation of record title is made at the time of lease acquisition. Investigations are made before the consummation of an acquisition of producing properties and before commencement of drilling operations on undeveloped properties. Individual properties may be subject to burdens that we believe do not materially interfere with the use or affect the value of the properties. Burdens on properties may include:
| • | customary royalty interests; |
| • | liens incident to operating agreements and for current taxes; |
| • | obligations or duties under applicable laws; |
| • | development obligations under natural gas leases; or |
| • | net profits interests. |
Seasonality
Demand for natural gas generally decreases during the spring and fall months and increases during the summer and winter months. However, seasonal anomalies such as mild winters or mild summers sometimes lessen this fluctuation. In addition, certain natural gas users utilize natural gas storage facilities and purchase some of their anticipated winter requirements during the summer. This can also lessen seasonal demand fluctuations. These seasonal anomalies can increase competition for equipment, supplies and personnel during the spring and summer months, which could lead to shortages and increase costs or delay our operations.
Competition
The oil and natural gas industry is intensely competitive, and we compete with other companies in our industry that have greater resources than we do. Many of these companies not only explore for and produce natural gas, but also carry on refining operations and market petroleum and other products on a regional, national or worldwide basis. These companies may be able to pay more for productive natural gas properties and exploratory prospects or define, evaluate, bid for and purchase a greater number of properties and prospects than our financial or human resources permit and may be able to expend greater resources to attract and maintain industry personnel. In addition, these companies may have a greater ability to continue exploration activities during periods of low natural gas market prices. Our larger competitors may be able to absorb the burden of existing, and any changes to, federal, state and local laws and regulations more easily than we can, which would adversely affect our competitive position. Our ability to acquire additional properties and to discover reserves in the future will be dependent upon our ability to evaluate and select suitable properties and to consummate transactions in a highly competitive environment. In addition, because we have fewer financial and human resources than many companies in our industry, we may be at a disadvantage in bidding for exploratory prospects and producing natural gas properties.
Regulation of the Oil and Natural Gas Industry
Our operations are substantially affected by federal, state and local laws and regulations. In particular, natural gas production and related operations are, or have been, subject to price controls, taxes and numerous other laws and regulations. All of the jurisdictions in which we own or operate producing natural gas and oil properties have statutory provisions regulating the exploration for and production of natural gas and oil, including provisions related to permits for the drilling of wells, bonding requirements to drill or operate wells,
101
Table of Contents
Index to Financial Statements
the location of wells, the method of drilling and casing wells, the surface use and restoration of properties upon which wells are drilled, sourcing and disposal of water used in the drilling and completion process, and the abandonment of wells. Our operations are also subject to various conservation laws and regulations. These include the regulation of the size of drilling and spacing units or proration units, the number of wells which may be drilled in an area, and the unitization or pooling of crude oil or natural gas wells, as well as regulations that generally prohibit the venting or flaring of natural gas, and impose certain requirements regarding the ratability or fair apportionment of production from fields and individual wells.
Failure to comply with applicable laws and regulations can result in substantial penalties. The regulatory burden on the industry increases the cost of doing business and affects profitability. Although we believe we are in substantial compliance with all applicable laws and regulations, such laws and regulations are frequently amended or reinterpreted. Therefore, we are unable to predict the future costs or impact of compliance. Additional proposals and proceedings that affect the natural gas industry are regularly considered by Congress, the states, the FERC, and the courts. We cannot predict when or whether any such proposals may become effective.
We believe we are in substantial compliance with currently applicable laws and regulations and that continued substantial compliance with existing requirements will not have a material adverse effect on our financial position, cash flows or results of operations. However, current regulatory requirements may change, currently unforeseen environmental incidents may occur or past non-compliance with environmental laws or regulations may be discovered.
Regulation of Production of Natural Gas and Oil
The production of natural gas and oil is subject to regulation under a wide range of local, state and federal statutes, rules, orders and regulations. Federal, state and local statutes and regulations require permits for drilling operations, drilling bonds and reports concerning operations. All of the states in which we own and operate properties have regulations governing conservation matters, including provisions for the unitization or pooling of natural gas and oil properties, the establishment of maximum allowable rates of production from natural gas and oil wells, the regulation of well spacing or density, and plugging and abandonment of wells. The effect of these regulations is to limit the amount of natural gas and oil that we can produce from our wells and to limit the number of wells or the locations at which we can drill, although we can apply for exceptions to such regulations or to have reductions in well spacing or density. Moreover, each state generally imposes a production or severance tax with respect to the production and sale of oil, natural gas and NGLs within its jurisdiction.
We own interests in properties located onshore in two U.S. states. These states regulate drilling and operating activities by requiring, among other things, permits for the drilling of wells, maintaining bonding requirements in order to drill or operate wells, and regulating the location of wells, the method of drilling and casing wells, the surface use and restoration of properties upon which wells are drilled and the plugging and abandonment of wells. The laws of these states also govern a number of environmental and conservation matters, including the handling and disposing or discharge of waste materials, the size of drilling and spacing units or proration units and the density of wells that may be drilled, unitization and pooling of oil and gas properties and establishment of maximum rates of production from oil and gas wells. Some states have the power to prorate production to the market demand for oil and gas.
The failure to comply with these rules and regulations can result in substantial penalties. Our competitors in the oil and natural gas industry are subject to the same regulatory requirements and restrictions that affect our operations.
Regulation of Transportation and Sales of Natural Gas
Historically, the transportation and sale for resale of natural gas in interstate commerce have been regulated by agencies of the U.S. federal government, primarily FERC. FERC regulates interstate natural gas transportation rates and service conditions, which affects the marketing of natural gas that we produce, as well as the revenues
102
Table of Contents
Index to Financial Statements
we receive for sales of our natural gas. Since 1985, FERC has endeavored to make natural gas transportation more accessible to natural gas buyers and sellers on an open and non-discriminatory basis. FERC has stated that open access policies are necessary to improve the competitive structure of the interstate natural gas pipeline industry and to create a regulatory framework that will put natural gas sellers into more direct contractual relations with natural gas buyers by, among other things, unbundling the sale of natural gas from the sale of transportation and storage services.
In the past, the federal government has regulated the prices at which natural gas could be sold. While sales by producers of natural gas can currently be made at uncontrolled market prices, Congress could reenact price controls in the future. Deregulation of wellhead natural gas sales began with the enactment of the Natural Gas Policy Act, or NGPA, and culminated in adoption of the Natural Gas Wellhead Decontrol Act which removed controls affecting wellhead sales of natural gas effective January 1, 1993. The transportation and sale for resale of natural gas in interstate commerce is regulated primarily under the Natural Gas Act, or NGA, and by regulations and orders promulgated under the NGA by FERC. In certain limited circumstances, intrastate transportation and wholesale sales of natural gas may also be affected directly or indirectly by laws enacted by Congress and by FERC regulations.
Beginning in 1992, FERC issued a series of orders to implement its open access policies. As a result, the interstate pipelines’ traditional role as wholesalers of natural gas has been greatly reduced and replaced by a structure under which pipelines provide transportation and storage service on an open access basis to others who buy and sell natural gas. Although FERC’s orders do not directly regulate natural gas producers, they are intended to foster increased competition within all phases of the natural gas industry.
The Energy Policy Act of 2005, or EPAct 2005, is a comprehensive compilation of tax incentives, authorized appropriations for grants and guaranteed loans and significant changes to the statutory policy that affects all segments of the energy industry. Among other matters, the EPAct 2005 amends the NGA to add an anti-market manipulation provision which makes it unlawful for any entity to engage in prohibited behavior to be prescribed by FERC, and furthermore provides FERC with additional civil penalty authority. The EPAct 2005 provides FERC with the power to assess civil penalties of up to $1,000,000 per day for violations of the NGA and increases FERC’s civil penalty authority under the NGPA from $5,000 per violation per day to $1,000,000 per violation per day. The civil penalty provisions are applicable to entities that engage in the sale of natural gas for resale in interstate commerce. On January 19, 2006, FERC issued Order No. 670, a rule implementing the anti-market manipulation provision of the EPAct 2005. The rules make it unlawful: (1) in connection with the purchase or sale of natural gas subject to the jurisdiction of FERC, or the purchase or sale of transportation services subject to the jurisdiction of FERC, for any entity, directly or indirectly, to use or employ any device, scheme or artifice to defraud; (2) to make any untrue statement of material fact or omit to make any such statement necessary to make the statements made not misleading; or (3) to engage in any act or practice that operates as a fraud or deceit upon any person. The anti-market manipulation rule does not apply to activities that relate only to intrastate or other non-jurisdictional sales or gathering, but does apply to activities of gas pipelines and storage companies that provide interstate services, as well as otherwise non-jurisdictional entities to the extent the activities are conducted “in connection with” gas sales, purchases or transportation subject to FERC jurisdiction, which now includes the annual reporting requirements under Order 704.
On December 26, 2007, FERC issued Order 704, a final rule on the annual natural gas transaction reporting requirements, as amended by subsequent orders on rehearing. Under Order 704, wholesale buyers and sellers of more than 2.2 million MMBtu of physical natural gas in the previous calendar year, including natural gas gatherers and marketers, are now required to report, on May 1 of each year, aggregate volumes of natural gas purchased or sold at wholesale in the prior calendar year to the extent such transactions utilize, contribute to, or may contribute to the formation of price indices. It is the responsibility of the reporting entity to determine which individual transactions should be reported based on the guidance of Order 704. Order 704 also requires market participants to indicate whether they report prices to any index publishers, and if so, whether their reporting complies with FERC’s policy statement on price reporting.
103
Table of Contents
Index to Financial Statements
We cannot accurately predict whether FERC’s actions will achieve the goal of increasing competition in markets in which our natural gas is sold. Additional proposals and proceedings that might affect the natural gas industry are pending before FERC and the courts. The natural gas industry historically has been very heavily regulated. Therefore, we cannot provide any assurance that the less stringent regulatory approach recently established by FERC will continue. However, we do not believe that any action taken will affect us in a way that materially differs from the way it affects other natural gas producers.
Gathering service, which occurs upstream of jurisdictional transmission services, is regulated by the states onshore and in state waters. Although its policy is still in flux, FERC has reclassified certain jurisdictional transmission facilities as non-jurisdictional gathering facilities, which has the tendency to increase our costs of getting gas to point of sale locations. State regulation of natural gas gathering facilities generally include various safety, environmental and, in some circumstances, nondiscriminatory-take requirements. Although such regulation has not generally been affirmatively applied by state agencies, natural gas gathering may receive greater regulatory scrutiny in the future.
Section 1(b) of the NGA exempts natural gas gathering facilities from regulation by FERC as a natural gas company under the NGA. We believe that the natural gas pipelines in our gathering systems meet the traditional tests FERC has used to establish a pipeline’s status as a gatherer not subject to regulation as a natural gas company. However, the distinction between FERC-regulated transmission services and federally unregulated gathering services is the subject of ongoing litigation, so the classification and regulation of our gathering facilities are subject to change based on future determinations by FERC, the courts or Congress.
Our sales of natural gas are also subject to requirements under the Commodity Exchange Act, or CEA, and regulations promulgated thereunder by the Commodity Futures Trading Commission, or CFTC. The CEA prohibits any person from manipulating or attempting to manipulate the price of any commodity in interstate commerce or futures on such commodity. The CEA also prohibits knowingly delivering or causing to be delivered false or misleading or knowingly inaccurate reports concerning market information or conditions that affect or tend to affect the price of a commodity.
Intrastate natural gas transportation is also subject to regulation by state regulatory agencies. The basis for intrastate regulation of natural gas transportation and the degree of regulatory oversight and scrutiny given to intrastate natural gas pipeline rates and services varies from state to state. Insofar as such regulation within a particular state will generally affect all intrastate natural gas shippers within the state on a comparable basis, we believe that the regulation of similarly situated intrastate natural gas transportation in any states in which we operate and ship natural gas on an intrastate basis will not affect our operations in any way that is of material difference from those of our competitors. Like the regulation of interstate transportation rates, the regulation of intrastate transportation rates affects the marketing of natural gas that we produce, as well as the revenues we receive for sales of our natural gas.
Changes in law and to FERC policies and regulations may adversely affect the availability and reliability of firm and/or interruptible transportation service on interstate pipelines, and we cannot predict what future action FERC will take. We do not believe, however, that any regulatory changes will affect us in a way that materially differs from the way they will affect other natural gas producers, gatherers and marketers with which we compete.
Regulation of Pipeline Safety and Maintenance
We are subject to regulation by the Pipeline and Hazardous Materials Safety Administration, or PHMSA, of the Department of Transportation, or the DOT, pursuant to the Natural Gas Pipeline Safety Act of 1968, or the NGPSA, and the Pipeline Safety Improvement Act of 2002, or the PSIA, which was reauthorized and amended by the Pipeline Inspection, Protection, Enforcement and Safety Act of 2006. The NGPSA regulates safety requirements in the design, construction, operation and maintenance of gas pipeline facilities, while the PSIA establishes mandatory inspections for all U.S. oil and natural gas transportation pipelines and some gathering
104
Table of Contents
Index to Financial Statements
lines in high-consequence areas. The PHMSA has developed regulations implementing the PSIA that require transportation pipeline operators to implement integrity management programs, including more frequent inspections and other measures to ensure pipeline safety in “high consequence areas,” such as high population areas, areas unusually sensitive to environmental damage and commercially navigable waterways.
On January 3, 2012, the Pipeline Safety, Regulatory Certainty, and Job Creation Act of 2011, or the Pipeline Safety Act, was signed into law. In addition to reauthorizing the PSIA through 2015, the Pipeline Safety Act expanded the DOT’s authority under the PSIA and requires the DOT to evaluate whether integrity management programs should be expanded beyond high consequence areas, authorizes the DOT to promulgate regulations requiring the use of automatic and remote-controlled shut-off valves for new or replaced pipelines, and requires the DOT to promulgate regulations requiring the use of excess flow values where feasible. Any new or amended pipeline safety regulations may require us to incur additional capital expenditures and may increase our operating costs. We cannot predict what future action the DOT will take, but we do not believe that any regulatory changes will affect us in a way that materially differs from the way they will affect other natural gas gatherers with which we compete.
States are largely preempted by federal law from regulating pipeline safety for interstate lines but most are certified by the DOT to assume responsibility for enforcing federal intrastate pipeline regulations and inspection of intrastate pipelines. In practice, because states can adopt stricter standards for intrastate pipelines than those imposed by the federal government for interstate lines, states vary considerably in their authority and capacity to address pipeline safety. We do not anticipate any significant difficulty in complying with applicable state laws and regulations. Our natural gas pipelines have continuous inspection and compliance programs designed to keep facilities in compliance with pipeline safety requirements.
Regulation of Environmental and Occupational Safety and Health Matters
General
Our operations are subject to numerous federal, state and local laws and regulations governing the discharge of materials into the environment or otherwise relating to environmental protection. Applicable U.S. federal environmental laws include, but are not limited to, the Comprehensive Environmental Response, Compensation, and Liability Act (“CERCLA”), the Clean Water Act (“CWA”) and the Clean Air Act (“CAA”). These laws and regulations govern environmental cleanup standards, require permits for air emissions, water discharges, underground injection, solid and hazardous waste disposal and set environmental compliance criteria. In addition, state and local laws and regulations set forth specific standards for drilling wells, the maintenance of bonding requirements in order to drill or operate wells, the spacing and location of wells, the method of drilling and casing wells, the surface use and restoration of properties upon which wells are drilled, the plugging and abandoning of wells, and the prevention and cleanup of pollutants and other matters. We maintain insurance against costs of clean-up operations, but we are not fully insured against all such risks. Additionally, Congress and federal and state agencies frequently revise environmental laws and regulations, and any changes that result in delay or more stringent and costly permitting, waste handling, disposal and clean-up requirements for the oil and gas industry could have a significant impact on our operating costs. Although future environmental obligations are not expected to have a material impact on the results of our operations or financial condition, there can be no assurance that future developments, such as increasingly stringent environmental laws or enforcement thereof, will not cause us to incur material environmental liabilities or costs.
Public and regulatory scrutiny of the energy industry has resulted in increased environmental regulation and enforcement being either proposed or implemented. For example, EPA’s 2014 – 2016 National Enforcement Initiatives include “Assuring Energy Extraction Sector Compliance with Environmental Laws.” According to the EPA’s website, “some techniques for natural gas extraction pose a significant risk to public health and the environment.” To address these concerns, the EPA’s goal is to “address incidences of noncompliance from natural gas extraction and production activities that may cause or contribute to significant harm to public health
105
Table of Contents
Index to Financial Statements
and/or the environment.” The EPA has emphasized that this initiative will be focused on those areas of the country where energy extraction activities are concentrated, and the focus and nature of the enforcement activities will vary with the type of activity and the related pollution problem presented. This initiative could involve a large scale investigation of our facilities and processes, and could lead to potential enforcement actions, penalties or injunctive relief against us.
Failure to comply with these laws and regulations may result in the assessment of administrative, civil and criminal fines and penalties and the imposition of injunctive or declaratory relief. Accidental releases or spills may occur in the course of our operations, and we cannot be sure that we will not incur significant costs and liabilities as a result of such releases or spills, including any third-party claims for damage to property, natural resources or persons. Although we believe that we are in substantial compliance with applicable environmental laws and regulations and that continued compliance with existing requirements will not have a material adverse impact on us, there can be no assurance that this will continue in the future.
Hazardous Substances and Wastes
CERCLA, also known as “Superfund,” imposes joint and several liability, without regard to fault or the legality of the original conduct, on certain classes of persons that are considered to be potentially responsible for the release of a “hazardous substance” into the environment. These persons include the current and past owners or operators of the site or sites where the release occurred, and companies that transported or disposed or arranged for the transport or disposal of the hazardous substances found at the site. Persons who are or were responsible for releases of hazardous substances under CERCLA and any state analogs, such as Pennsylvania’s Hazardous Sites Cleanup Act, may be subject to joint and several liability for the costs of cleaning up the hazardous substances that have been released into the environment, for the costs of certain health studies and for damages to natural resources, and it is not uncommon for neighboring landowners and other third parties to file corresponding common law claims for personal injury and property damage allegedly caused by the hazardous substances released into the environment. While petroleum and crude oil fractions are not considered hazardous substances under CERCLA and its analogs because of the so-called “petroleum exclusion,” adulterated petroleum products containing other hazardous substances have been treated as hazardous substances in the past, and governmental agencies or third parties may seek to hold us responsible for all or part of the costs to clean up sites at which such hazardous substances have been deposited.
RCRA and analogous state laws and regulations regulate the generation, transportation, treatment, storage, disposal and cleanup of “hazardous wastes” and the disposal of non-hazardous wastes. RCRA specifically excludes from the definition of hazardous waste “drilling fluids, produced waters and other wastes associated with the exploration, development or production of crude oil, natural gas or geothermal energy.” Instead, these wastes are regulated under RCRA’s less stringent non-hazardous solid waste provisions, state laws or other federal laws. However, legislation has been proposed from time to time that could reclassify certain natural gas and oil exploration and production wastes as “hazardous wastes,” which would make the reclassified wastes subject to much more stringent handling, disposal and clean-up requirements. If such legislation were to be enacted, it could have a significant impact on our operating costs, as well as the natural gas and oil industry in general. Moreover, some ordinary industrial wastes which we generate, such as paint wastes, waste solvents, laboratory wastes and waste oils, may be regulated as hazardous wastes.
In addition, current and future regulations governing the handling and disposal of Naturally Occurring Radioactive Materials (“NORM”) may affect our operations. For example, the Pennsylvania Department of Environmental Protection has asked operators to identify technologically enhanced NORM (“TENORM”) in their processes, such as hydraulic fracturing sand. Local landfills only accept such waste when it meets their TENORM permit standards. Similarly, the Ohio Department of Health and the Ohio Environmental Protection Agency regulate the disposal of TENORM in Ohio. As a result, we may have to locate out-of-state landfills to accept TENORM waste from time to time, potentially increasing our disposal costs.
106
Table of Contents
Index to Financial Statements
Some of our leases may have had prior owners who commenced exploration and production of natural gas and oil operations on these sites. Although we have utilized operating and disposal practices that were standard in the industry at the time, hydrocarbons or other wastes may have been disposed of or released on or under the properties owned or leased by us on or under other locations where such wastes have been taken for disposal. In addition, a portion of these properties may have been operated by third parties whose waste management and disposal practices were not under our control. These properties and the wastes disposed thereon may be subject to CERCLA, RCRA, and/or analogous state laws. Under such laws, we could be required to remove or remediate previously disposed wastes (including waste disposed of or released by prior owners or operators) or property contamination (including groundwater contamination by prior owners or operators), or to perform remedial plugging or closure operations to prevent future contamination.
Regulation of Well Completion and Stimulation
Hydraulic fracturing and similar techniques are important and common practices we use to stimulate production of oil and gas. Hydraulic fracturing involves the injection of water, sand and trace chemicals under pressure into underground oil and gas bearing rock formations to create or enlarge fractures and stimulate the flow of oil and gas into the oil and gas production well. Although these stimulation techniques have been safely utilized for decades, numerous federal and state agencies and certain local governments seek to further regulate them.
In February 2014, the EPA asserted regulatory authority over hydraulic fracturing involving diesel additives under the Safe Drinking Water Act’s (“SDWA”) Underground Injection Control (“UIC”) Program, and requested comments in May 2014 on a proposal to require disclosure of chemical ingredients in hydraulic fracturing fluids under the Toxic Substances Control Act. In May 2013, the Bureau of Land Management proposed rules governing hydraulic fracturing on federal and Indian oil and gas leases that would require public disclosure of chemicals used, confirmation that wells used in hydraulic fracturing operations meet defined construction standards, and development of plans for managing water that flows back to the surface. In addition, studies by EPA and other federal agencies are underway that focus on environmental aspects of hydraulic fracturing activities, with draft reports expected for public comment and peer review in late 2014. These studies could spur further regulation. Additional regulations adopted at the federal level could result in permitting delays and cost increases.
Waste Discharges
The CWA and its state analogs and regulations impose restrictions and strict controls with respect to the discharge of pollutants, including spills and leaks of oil and other substances, into waters of the United States and state waters. The discharge of pollutants into regulated waters is prohibited, except in accordance with the terms of a permit or waiver issued by the EPA or an analogous state agency. The CWA and regulations implemented thereunder also prohibit the discharge of dredge and fill material into regulated waters, including jurisdictional wetlands, unless authorized by an appropriately issued permit. Obtaining these permits may delay our development of oil and natural gas projects and associated facilities. The CWA and analogous state laws require individual permits or coverage under general permits for discharges of storm water runoff from certain types of facilities. In addition, federal spill prevention, control and countermeasure requirements require appropriate containment berms and similar structures to help prevent the contamination of navigable waters by a petroleum hydrocarbon tank spill, rupture or leak. Federal and state regulatory agencies can impose administrative, civil and/or criminal penalties as well as other enforcement mechanisms for non-compliance with discharge permits or other requirements of the CWA and analogous state laws and regulations. The imposition of new or additional regulations could further limit or prohibit our ability to manage or dispose of wastewater, including produced water, drilling and completion fluids and other wastes associated with our operations.
107
Table of Contents
Index to Financial Statements
Air Emissions
The CAA and its state analogs and regulations restrict the emission of various air pollutants from many sources, including oil and gas operations, through the issuance of permits and the imposition of various pre-construction, monitoring and reporting requirements. New facilities may be required to obtain permits before construction can begin, and existing facilities may be required to obtain additional permits and incur capital costs in order to remain in compliance. In addition, the EPA has developed more stringent regulations governing emissions of toxic air pollutants and greenhouse gases (“GHG”), which may increase the costs of compliance for some facilities.
Some of our producing wells and associated facilities are subject to restrictive emission limitations and permitting requirements for volatile organic compounds (“VOCs”), particulate matter (“PM”), nitrogen oxides (“NOx”) and other air pollutants. In 2012, the EPA issued federal regulations affecting our operations under the New Source Performance Standards provisions (Subpart OOOO) and expanded regulations under the National Emission Standards for Hazardous Air Pollutants, although implementation of some of the more rigorous requirements is not required until 2015. Also in 2012, seven states sued the EPA to compel the agency to make a determination as to whether standards of performance limiting methane emissions from oil and gas sources is appropriate and, if so, to promulgate performance standards for methane emissions from existing oil and gas sources. In April 2014, the EPA released a set of five white papers analyzing methane emissions from the industry, and, based on responses received, is expected to determine by fall 2014 whether to issue a rule governing methane emissions from the oil and gas industry. If we are unable to comply with air pollution regulations or to obtain permits for emissions associated with our operations, we could be required to forego construction, modification or certain operations. These regulations may also increase compliance costs for some facilities we own or operate, and result in administrative, civil and/or criminal penalties for non-compliance. Obtaining permits may delay the development of our oil and natural gas projects, including the construction and operation of facilities.
Oil Pollution Act
The Oil Pollution Act of 1990 (“OPA”) and regulations thereunder impose a variety of requirements on “responsible parties” related to the prevention of oil spills and liability for damages resulting from such spills in United States waters. A “responsible party” includes the owner or operator of an onshore facility, pipeline or vessel, or the lessee or permittee of the area in which an offshore facility is located. The OPA assigns strict liability to each responsible party for oil cleanup costs and a variety of public and private damages arising from an oil spill in waters of the United States. While liability limits apply in some circumstances, a party cannot take advantage of liability limits if the spill was caused by gross negligence or willful misconduct or resulted from violation of a federal safety, construction or operating regulation. If the party fails to report a spill or to cooperate fully in the cleanup, liability limits likewise do not apply. Few defenses exist to the liability imposed by the OPA. The OPA imposes ongoing requirements on a responsible party, including the preparation of oil spill response plans and proof of financial responsibility to cover environmental cleanup and restoration costs that could be incurred in connection with an oil spill.
National Environmental Policy Act
Oil and natural gas exploration and production activities on federal lands are subject to the National Environmental Policy Act (“NEPA”). NEPA requires federal agencies, including the Department of Interior and its Bureau of Land Management, to evaluate major agency actions having the potential to significantly impact the environment. The process involves the preparation of either an Environmental Assessment or a more detailed Environmental Impact Statement depending on whether the specific circumstances surrounding the proposed federal action will have a significant impact on the human environment. The NEPA process involves public input through comments which can alter the nature of a proposed project either by limiting the scope of the project or requiring resource-specific mitigation. NEPA decisions can be appealed through the court system by process participants. This process may result in delaying the permitting and development of projects, increase costs and, in certain instances, could result in the cancellation of existing leases.
108
Table of Contents
Index to Financial Statements
Endangered Species Act and Migratory Bird Treaty Act
The Endangered Species Act (“ESA”) restricts activities that may affect endangered or threatened species or their habitats. Similar protections are offered to migratory birds under the Migratory Bird Treaty Act (“MBTA”). The U.S. Fish and Wildlife Service and state agencies may designate critical or suitable habitat areas that they believe are necessary for the survival of threatened or endangered species. Such a designation could materially restrict use of or access to federal, state and private lands and could delay or prohibit oil and gas development. While some of our operations may be located in areas that are designated as habitats for endangered or threatened species or that may attract migratory birds, we believe that we are in substantial compliance with the ESA, MBTA and similar statutes, and we are not aware of any proposed ESA listings that will materially affect our operations. However, the designation of previously unidentified endangered or threatened species, or critical or suitable habitat, could cause us to incur additional costs or become subject to operating restrictions or bans in the affected states.
Abandonment, Decommissioning and Remediation Requirements
Federal, state and local laws and regulations provide detailed requirements for the abandonment of wells, the closure or decommissioning of production and transportation facilities and the environmental restoration of sites where operations have ceased. These regulations can impose significant costs related to (i) plugging, abandonment and restoration of facilities, (ii) cleanup costs and compensation for property damage due to releases or discharges, and (iii) penalties imposed for releases or non-compliance with applicable laws and regulations. As is customary in the oil and natural gas industry, we typically have contractually assumed, and may assume in the future, certain obligations relating to plugging and abandonment, cleanup, and other environmental costs in connection with our acquisition of operating interests in oil and gas fields, and these costs can be significant.
Climate Change Legislation and Greenhouse Gas Regulations
A number of federal, state and regional efforts have emerged that seek to track or reduce emissions of GHG. The EPA has adopted regulations that restrict GHG emissions under existing provisions of the CAA and rules requiring certain operations, including onshore and offshore oil and natural gas production facilities, to monitor and report GHG emissions on an annual basis. If we are unable to recover or pass through a significant portion of our costs related to complying with current and future regulations relating to climate change and GHGs, it could materially affect our operations and financial condition. To the extent financial markets view climate change and GHG emissions as a financial risk, this could negatively impact our cost of, and access to, capital. Future legislation or regulations adopted to address climate change could also make our products more or less desirable than competing sources of energy.
Safe Drinking Water Act
The SDWA, the UIC program and comparable state provisions regulate the disposal, treatment or release of water produced or used during oil and gas development and the drilling and operation of water disposal wells and fluid injection wells to enhance recovery of hydrocarbons. Subsurface emplacement of fluids (including disposal wells or enhanced oil recovery) is governed by federal or state regulatory authorities that, in some cases, includes the state oil and gas regulatory authority or the state’s environmental authority. Permits are required to drill wells for water disposal or for fluid injection in enhanced oil recovery, and casing integrity must be periodically monitored to ensure the casing is adequate to prevent fluids from migrating outside of targeted zones. Non-compliance with regulations or groundwater contamination by oil and natural gas drilling operations may result in fines, penalties, and/or remediation costs, among other enforcement mechanisms under the SDWA and analogous state laws. In addition, landowners and other parties may assert claims for personal injury, alternative water supplies, property damage and other claims. These regulations and attendant liabilities may increase operating costs for some facilities. Furthermore, in response to alleged seismic events near underground injection
109
Table of Contents
Index to Financial Statements
wells used for the disposal of oil and gas-related wastewaters, some agencies have imposed moratoria on the use of such injection wells. If new regulatory initiatives are implemented that restrict or prohibit the use of underground injection wells in areas where we rely upon the use of such wells in our operations, our costs to operate may significantly increase.
Worker Safety
The Occupational Safety and Health Act (“OSHA”) and any analogous state laws regulate the protection of the safety and health of workers. The OSHA hazard communication standard requires maintenance of information about hazardous materials used or produced in operations and provision of such information to employees. Other OSHA standards regulate specific worker safety aspects of our operations. Failure to comply with OSHA requirements can lead to the imposition of penalties.
Employees
As of March 31, 2014, we had 177 full-time employees. Our future success will depend partially on our ability to attract, retain and motivate qualified personnel. We are not a party to any collective bargaining agreements and have not experienced any strikes or work stoppages. We utilize the services of independent contractors to perform various field and other services.
Legal Proceedings
Although we may, from time to time, be involved in litigation and claims arising out of our operations in the normal course of business, we are not a party to any material legal proceedings. In addition, we are not aware of any material legal or governmental proceedings against us, or contemplated to be brought against us.
110
Table of Contents
Index to Financial Statements
The following table sets forth the names, ages and titles of our directors and executive officers as of July 1, 2014.
| Name |
Age | Position with Rice Energy | ||||
| Daniel J. Rice IV |
33 | Director, Chief Executive Officer | ||||
| Toby Z. Rice |
32 | Director, President and Chief Operating Officer | ||||
| Derek A. Rice |
29 | Vice President of Exploration & Geology | ||||
| Grayson T. Lisenby |
28 | Vice President and Chief Financial Officer | ||||
| James W. Rogers |
34 | Vice President, Chief Accounting & Administrative Officer, Treasurer | ||||
| William E. Jordan |
34 | Vice President, General Counsel and Corporate Secretary | ||||
| Robert F. Vagt |
67 | Director (Chairman) | ||||
| Daniel J. Rice III |
62 | Director | ||||
| Scott A. Gieselman |
51 | Director | ||||
| Chris G. Carter |
35 | Director | ||||
| James W. Christmas |
66 | Director | ||||
| Kevin S. Crutchfield |
53 | Director | ||||
Set forth below is the description of the background of our directors and executive officers. References to positions held at Rice Energy include positions held at Rice Drilling B prior to our corporate reorganization.
Daniel J. Rice IV has served as a member of our board of directors and our Chief Executive Officer since October 2013. Mr. Rice joined Rice Partners in October 2008 and served as the Vice President and Chief Financial Officer of Rice Energy from October 2008 through October 2012. From October 2012 through September 2013, Mr. Rice served as the Chief Operating Officer of Rice Energy. Prior to joining Rice Energy, he served as an investment banker for Tudor Pickering Holt & Co., LLC, an integrated energy investment bank in Houston, Texas, from February 2008 to October 2008. Prior to his employment at Tudor Pickering Holt, he served as a senior analyst of corporate planning for Transocean Inc., responsible for mergers and acquisitions and business development, from March 2005 to February 2008. He was appointed Chief Executive Officer in October 2013. Daniel J. Rice IV holds a BS in Finance from Bryant University. He is the son of Daniel J. Rice III and the brother of Toby Rice and Derek Rice.
The board believes that Mr. Rice’s considerable financial and operational experience brings important and valuable skills to the board of directors.
Toby Z. Rice has served as our President and Chief Operating Officer since October 2013. Mr. Rice joined Rice Partners in February 2007 and later joined Rice Energy as its President and Chief Executive Officer when it was formed in February 2008 through September 2013. He has also served as a Manager of Rice Energy since its formation. From September 2005 until March 2008, he also served as founder and president of ZFT LLC, a consulting company specializing in the application of new hydraulic fracturing technologies for unconventional shale and tight sandstone reservoirs. Toby Rice was appointed to his current role in October 2013. He holds a BS in Chemistry from Rollins College and is the son of Daniel J. Rice III and the brother of Daniel J. Rice IV and Derek Rice.
The board believes that Mr. Rice’s considerable operational experience brings important and valuable skills to the board of directors.
Derek A. Rice has served as Rice Energy’s Vice President of Exploration & Geology since 2009 and is responsible for geologic and geophysical interpretations. Prior to joining Rice Partners and Rice Energy in August 2009, from June 2007 to September 2007 and from June 2008 until September 2008, he worked as a wellbore geologist for a large oilfield service company, where he analyzed the Marcellus, Haynesville, and Barnett shales. Derek Rice holds a BS in geological sciences from Tufts University and a MS in geology from the University of Houston. He is the son of Daniel J. Rice III and the brother of Daniel J. Rice IV and Toby Rice.
111
Table of Contents
Index to Financial Statements
Grayson T. Lisenby has served as our Vice President and Chief Financial Officer since October 2013. Mr. Lisenby joined Rice Energy in February 2013, initially serving as our Vice President of Finance. Prior to joining Rice Energy, Mr. Lisenby was an investment professional at Natural Gas Partners from July 2011 to January 2013 and concentrated on transaction analysis and execution as well as the monitoring of active portfolio companies. Mr. Lisenby was involved in NGP’s original $100 million investment into Rice Energy and spent a significant amount of his time monitoring and advising the company during his tenure at Natural Gas Partners. Prior to his employment at NGP, he served an investment banker for Barclays Capital Inc.’s energy group in Houston from August 2009 to July 2011. Mr. Lisenby holds a BBA in Finance from the University of Texas, where he was a member of the Business Honors Program.
James W. Rogers has served as our Vice President, Chief Accounting & Administrative Officer and Treasurer, since October 2013. Mr. Rogers joined Rice Energy in April 2011 as Controller and subsequently served as our Vice President and Chief Accounting Officer from January 2012 through October 2012 and our Chief Financial Officer from November 2012 through September 2013. Prior to joining Rice Energy, Mr. Rogers served as a Financial Specialist with EQT Corporation, working in the Corporate Accounting Group, from May 2010 to March 2011. Prior to EQT, Mr. Rogers served as an assurance manager for Ernst & Young in their Pittsburgh office from September 2007 to April 2010. He began his career in 2002 as an auditor with PricewaterhouseCoopers LLP, in its Pittsburgh office. Mr. Rogers is a certified public accountant in the state of Pennsylvania and holds a BSBA in accounting from the University of Pittsburgh. He is also a member of the AICPA.
William E. Jordan has served as our Vice President, General Counsel and Corporate Secretary since January 2014. From September 2005 through December 2013, Mr. Jordan practiced corporate law at Vinson & Elkins L.L.P., representing public and private companies in capital markets offerings and mergers and acquisitions, primarily in the oil and natural gas industry. He is a graduate of Davidson College with a BA in Mathematics and a graduate of the Duke University School of Law with a Doctor of Jurisprudence degree.
Robert F. Vagt has served as the chairman of our board of directors since January 2014. Mr. Vagt has served as a member of the board of directors of Kinder Morgan, Inc. since May 2012, where he serves as a member of the audit committee. Mr. Vagt has served as a member of the board of directors of El Paso Corporation from May 2005 until June 2012, where he was a member of the compensation and health, safety and environmental committees. From January 2008 until January 2014, Mr. Vagt was also the President of The Heinz Endowments. Prior to his tenure at The Heinz Endowments, Mr. Vagt served as President of Davidson College from July 1997 to August 2007. Mr. Vagt served as President and Chief Operating Officer of Seagull Energy Corporation from 1996 to 1997. From 1992 to 1996, he served as President, Chairman and Chief Executive Officer of Global Natural Resources. Mr. Vagt served as President and Chief Operating Officer of Adobe Resources Corporation from 1989 to 1992. Prior to 1989, he served in various positions with Adobe Resources Corporation and its predecessor entities.
The board believes that Mr. Vagt’s professional background in both the public and private sectors make him an important advisor and member of our board of directors. Mr. Vagt brings to the board operations and management expertise in both the public and private sectors. In addition, Mr. Vagt provides the board with a welcomed diversity of perspective gained from service as President of The Heinz Endowments, as well as from service as the president of an independent liberal arts college.
Daniel J. Rice III has served as a member of our board of directors since October 2013. He has also served as Managing General Partner of Rice Partners. Since January 2013, Mr. Rice has served as Lead Portfolio Manager for GRT Capital’s energy division. From 2005 to December 2012, Mr. Rice served as a Managing Director and Portfolio Manager for BlackRock, Inc. and was a member of BlackRock, Inc.’s Global Resources team, responsible for Small Cap and All Cap Energy funds. Prior to joining BlackRock, Inc. in 2005, he was a Senior Vice President and Portfolio Manager at State Street Research & Management, responsible for the Small Cap Energy and All Cap Energy Global Resources Funds. Prior to joining State Street Research in 1984, he was
112
Table of Contents
Index to Financial Statements
a Vice President and Portfolio Manager with Fred Alger Management. Earlier in his career, Mr. Rice was a Vice President and Analyst with EF Hutton and an Analyst with Loomis Sayles and Co. He began his career in 1975 as an auditor with Price Waterhouse & Co. He earned a BS degree from Bates College in 1973 and an MBA degree from New York University in 1975. Mr. Rice has more than 30 years of experience in the oil and gas industry. He is the father of Toby Rice, Daniel J. Rice IV and Derek Rice.
The board believes that Mr. Rice’s considerable financial and energy investing experience brings important and valuable skills to the board of directors.
Scott A. Gieselman has served as a member of our board of directors since April 2013. Mr. Gieselman has been a managing director of Natural Gas Partners since April 2007. From 1988 to April 2007, Mr. Gieselman worked in various positions in the investment banking energy group of Goldman, Sachs & Co., where he became a partner in 2002. Mr. Gieselman received a BS from the Boston College Carroll School of Management in 1985 and a MBA from the Boston College Carroll Graduate School of Management in 1988.
The board believes that Mr. Gieselman’s considerable financial and energy investment banking experience, as well as his experience on the boards of numerous private energy companies, bring important and valuable skills to the board of directors.
Chris G. Carter has served as a member of our board of directors since October 2013. Mr. Carter is a managing director of Natural Gas Partners. Prior to joining Natural Gas Partners in 2004, Mr. Carter was an analyst with Deutsche Bank’s Energy Investment Banking group in Houston, where he focused on financing and merger and acquisition transactions in the oil and gas and oilfield services industries. Mr. Carter received a B.B.A. and an M.P.A. in Accounting, summa cum laude, in 2002 from the University of Texas, where he was a member of the Business Honors Program. He received an M.B.A. in 2008 from Stanford University, where he graduated as an Arjay Miller Scholar.
The board believes that Mr. Carter’s considerable financial and energy investing experience, as well as his experience on the boards of numerous private energy companies, bring important and valuable skills to the board of directors.
James W. Christmas has served as a member of our board of directors since January 2014. Mr. Christmas has served as a member of the board of directors of Halcón Resources Corporation since February 2012. Mr. Christmas began serving as a director of Petrohawk Energy Corporation in July 2006, effective upon the merger of KCS Energy, Inc. (“KCS”) into Petrohawk. He continued to serve as a director, and as Vice Chairman of the Board of Directors, for Petrohawk until BHP Billiton acquired all of Petrohawk in August 2011. He also served on the audit committee and the Nominating and Corporate Governance Committee. Currently, Mr. Christmas serves as a member of the Board of Directors of Petrohawk, a wholly-owned subsidiary of BHP Billiton, and as chair of the Financial Reporting Committee of such board. He also serves on the Advisory Board of the Tobin School of Business of St. John’s University and as a member of the board of directors of a private oil and gas company. He served as President and Chief Executive Officer of KCS from 1988 until April 2003 and Chairman of the Board and Chief Executive Officer of KCS until its merger into Petrohawk. Mr. Christmas was a Certified Public Accountant in New York and was with Arthur Andersen & Co. from 1970 until 1978 before leaving to join National Utilities & Industries (“NUI”), a diversified energy company, as Vice President and Controller. He remained with NUI until 1988, when NUI spun out its unregulated activities that ultimately became part of KCS. As an auditor and audit manager, controller and in his role as CEO of KCS, Mr. Christmas was directly or indirectly responsible for financial reporting and compliance with SEC regulations, and as such has extensive experience in reviewing and evaluating financial reports, as well as in evaluating executive and board performance and in recruiting directors.
The board believes that Mr. Christmas’s prior experience as an executive and director and his past audit, accounting and financial reporting experience provide significant contributions to our board of directors.
113
Table of Contents
Index to Financial Statements
Kevin S. Crutchfield has served as a member of our board of directors since January 2014. Mr. Crutchfield has served as the chairman of the board of directors (since May 2012) and chief executive officer (since July 2009) of Alpha Natural Resources, Inc., an international supplier of metallurgical and thermal coal. He has been with Alpha since its formation in 2003, serving as executive vice-president from November 2004 to January 2007, president from January 2007 to July 2009, and as a director since November 2007. Mr. Crutchfield is a 25-year coal industry veteran with technical, operating and executive management experience. He is currently the vice chairman of the National Mining Association and the American Coalition for Clean Coal Electricity. Prior to joining Alpha, Mr. Crutchfield was vice president of El Paso Corporation and president of Coastal Coal Company, an affiliate of El Paso. He previously served as president of AMVEST Corporation and held executive positions at AEI Resources, Inc., including president and chief executive officer. Earlier in his career, he held senior management positions at Pittston Coal Company and Cyprus Australia Coal Company, including a period in Australia as chairman of Cyprus Australia Coal Company. Mr. Crutchfield also serves on the board of directors of Coeur d’Alene Mines Corporation and previously served on the board of directors at King Pharmaceuticals, Inc. from February 2010 until the first quarter of 2011, when he resigned in connection with the acquisition of King Pharmaceuticals by Pfizer.
The board believes that Mr. Crutchfield’s prior experience in corporate leadership, financial and operational management, government and regulatory oversight, health and safety management, and industry expertise through his various executive roles in global natural resource businesses, in addition to experience in public company board leadership provide significant contributions to our board of directors.
Board of Directors
Our board of directors currently consists of eight members: Robert F. Vagt (Chairman), Daniel J. Rice IV, Toby Z. Rice, Daniel J. Rice III, Scott A. Gieselman, Chris G. Carter, James W. Christmas and Kevin S. Crutchfield.
In connection with the closing of our IPO, we entered into a stockholders’ agreement with Rice Holdings, Rice Partners, NGP Holdings and Alpha Natural Resources, Inc. Please see “Certain Relationships and Related Transactions.” Pursuant to the stockholders’ agreement, we and our principal stockholders agreed to appoint individuals designated by the principal stockholders to our board of directors and nominate such persons for election at each annual meeting of our stockholders.
We expect to add another independent director to our board of directors and audit committee within one year of the initial listing of our common stock on the NYSE. Our board has reviewed the independence of our current directors using the independence standards of the NYSE and, based on this review, determined that Messrs. Gieselman, Carter, Vagt and Christmas are independent within the meaning of the NYSE listing standards currently in effect. As a result, we expect that our board of directors will consist of nine members within one year of the initial listing of our common stock on the NYSE, five of whom will be independent.
In evaluating director candidates, we assess whether a candidate possesses the integrity, judgment, knowledge, experience, skills and expertise that are likely to enhance the board’s ability to manage and direct our affairs and business, including, when applicable, to enhance the ability of the committees of the board to fulfill their duties. Our directors hold office until the earlier of their death, resignation, retirement, disqualification or removal or until their successors have been duly elected and qualified.
Our directors are divided into three classes serving staggered three-year terms. Class I, Class II and Class III directors serve until our annual meetings of stockholders in 2015, 2016 and 2017, respectively. Messrs. Daniel J. Rice IV, Carter and Christmas are assigned to Class I, Messrs. Toby Z. Rice, Crutchfield and Vagt are assigned to Class II and Messrs. Daniel J. Rice III and Gieselman are assigned to Class III. At each annual meeting of stockholders, directors will be elected to succeed the class of directors whose terms have expired. This classification of our board of directors could have the effect of increasing the length of time necessary to change the composition of a majority of the board of directors. In general, at least two annual meetings of stockholders will be necessary for stockholders to effect a change in a majority of the members of the board of directors.
114
Table of Contents
Index to Financial Statements
Status as a Controlled Company
Because Rice Holdings, Rice Partners, NGP Holdings and Alpha Natural Resources, Inc. collectively beneficially own a majority of our outstanding common stock following the completion of our IPO and are deemed a group as a result of the stockholders’ agreement entered into in connection with the closing of our IPO, we are a controlled company under NYSE corporate governance standards. A controlled company need not comply with NYSE corporate governance rules that require its board of directors to have a majority of independent directors and independent compensation and nominating and governance committees.
While these exemptions will apply to us as long as we remain a controlled company, we expect that our board of directors will nonetheless consist of a majority of independent directors within the meaning of the NYSE listing standards currently in effect within one year of the initial listing of our common stock on the NYSE.
Upon the closing of this offering, Rice Holdings, Rice Partners, NGP Holdings and Alpha Natural Resources, Inc. will no longer control a majority of the voting power of our outstanding common stock, and we will no longer qualify as a controlled company for purposes of NYSE corporate governance standards. As a result, we will be required to have a majority independent nominating and governance committee within 90 days of the closing of this offering and a fully independent nominating and governance committee within one year of the closing of this offering.
Committees of the Board of Directors
We have an audit committee, a compensation committee, a nominating and corporate governance committee and a health, safety & environmental committee of our board of directors, and we may form such other committees as the board of directors shall determine from time to time in the future. Each of the standing committees of the board of directors has the composition and responsibilities described below.
Audit Committee
Rules implemented by the NYSE and SEC require us to have an audit committee comprised of at least three directors who meet the independence and experience standards established by the NYSE and the Exchange Act, subject to transitional relief during the one-year period following the initial listing of our common stock on the NYSE. Our audit committee consists of Messrs. Christmas (Chair) and Vagt, each of whom is independent under the rules of the SEC. Subsequent to the transitional period, we will comply with the requirement to have three independent directors on our audit committee. As required by the rules of the SEC and listing standards of the NYSE, the audit committee consists solely of independent directors. Our board has determined that Mr. Christmas satisfies the definition of “audit committee financial expert.”
This committee oversees, reviews, acts on and reports on various auditing and accounting matters to our board of directors, including: the selection of our independent accountants, the scope of our annual audits, fees to be paid to the independent accountants, the performance of our independent accountants and our accounting practices. In addition, the audit committee oversees our compliance programs relating to legal and regulatory requirements. We have an audit committee charter defining the committee’s primary duties in a manner consistent with the rules of the SEC and applicable stock exchange or market standards. A copy of our audit committee charter is posted on our website at http://investors.riceenergy.com/committee-charters.
Compensation Committee
Our compensation committee establishes salaries, incentives and other forms of compensation for officers and other employees. Our compensation committee also administers our incentive compensation and benefit plans. Our compensation committee charter defines the committee’s primary duties in a manner consistent with
115
Table of Contents
Index to Financial Statements
the rules of the SEC and applicable stock exchange or market standards. Our compensation committee consists of Messrs. Vagt (Chair), Christmas and Carter, each of whom is independent under the rules of the NYSE. A copy of our compensation committee charter is posted on our website at http://investors.riceenergy.com/committee-charters.
Nominating and Corporate Governance Committee
Because we are a controlled company within the meaning of the NYSE corporate governance standards, we are not required to have a nominating and governance committee composed entirely of independent directors. However, we have a nominating and corporate governance committee, which identifies, evaluates and recommends qualified nominees to serve on our board of directors, develops and oversees our internal corporate governance processes and maintains a management succession plan. Our nominating and corporate governance committee charter defines the committee’s primary duties in a manner consistent with the rules of the SEC and applicable stock exchange or market standards. Our nominating and governance committee consists of Messrs. Gieselman (Chair), Daniel J. Rice III and Daniel J. Rice IV. A copy of our nominating and corporate governance committee charter is posted on our website at http://investors.riceenergy.com/committee-charters.
Health, Safety and Environmental Committee
We have a health, safety and environmental committee. This committee assists the board in fulfilling its risk oversight responsibilities relating to health, safety and environmental-related matters, including environmental regulations, health and safety initiatives and accountabilities, and crisis response. Our health, safety and environmental committee consists of Messrs. Toby Z. Rice (Chair), Vagt and Crutchfield.
Compensation Committee Interlocks and Insider Participation
None of our executive officers serve on the board of directors or compensation committee of a company that has an executive officer that serves on our board or compensation committee. No member of our board is an executive officer of a company in which one of our executive officers serves as a member of the board of directors or compensation committee of that company.
Code of Business Conduct and Ethics
Our board of directors has adopted a code of business conduct and ethics applicable to our employees, directors and officers, in accordance with applicable U.S. federal securities laws and the corporate governance rules of the NYSE. Any waiver of this code may be made only by our board of directors and will be promptly disclosed as required by applicable U.S. federal securities laws and the corporate governance rules of the NYSE.
Corporate Governance Guidelines
Our board of directors believes that sound governance practices and policies provide an important framework to assist it in fulfilling its duty to stockholders. Our Corporate Governance Guidelines cover the following principal subjects:
| • | Role and functions of the board of directors |
| • | Qualifications and independence of directors |
| • | Size of the board of directors and director selection process |
| • | Committee functions and independence of committee members |
| • | Meetings of non-employee directors |
| • | Self-evaluation |
116
Table of Contents
Index to Financial Statements
| • | Ethics and conflicts of interest (a copy of the current “Code of Business Conduct and Ethics” is posted on the our website at http://investors.riceenergy.com/codeofconduct) |
| • | Compensation of the board of directors |
| • | Succession planning |
| • | Access to senior management and to independent advisors |
| • | New director orientation |
| • | Continuing education |
The “Corporate Governance Guidelines” are posted on the our website at http://investors.riceenergy.com/corporate-governance. The Corporate Governance Guidelines will be reviewed periodically and as necessary by our nominating and governance committee, and any proposed additions to or amendments of the Corporate Governance Guidelines will be presented to the board of directors for its approval.
The NYSE has adopted rules that require listed companies to adopt governance guidelines covering certain matters. We believe that the Corporate Governance Guidelines comply with the NYSE rules.
117
Table of Contents
Index to Financial Statements
Named Executive Officers
For fiscal year 2013, our Named Executive Officers were as follows. Please see “Management” for a description of our current executive officers, including historical roles held by our 2013 Named Executive Officers.
| Daniel J. Rice IV |
Chief Executive Officer/Vice President and Chief Operating Officer(1) | |
| Toby Z. Rice |
President and Chief Operating Officer/Chief Executive Officer(2) | |
| Grayson T. Lisenby |
Vice President and Chief Financial Officer/Vice President of Finance(3) | |
| James W. Rogers |
Vice President and Chief Accounting & Administrative Officer, Treasurer/Vice President and Chief Financial Officer(4) |
| (1) | Mr. Daniel J. Rice IV’s role with our company changed during 2013. In 2013, he served as our Vice President and Chief Operating Officer from January through September and thereafter as our Chief Executive Officer. |
| (2) | Mr. Toby Z. Rice’s role with our company changed during 2013. In 2013, he served as our Chief Executive Officer from January through September and thereafter as our President and Chief Operating Officer. |
| (3) | Mr. Lisenby’s role with our company changed during 2013. Mr. Lisenby joined our company in February 2013, initially serving as our Vice President of Finance through September. Thereafter, Mr. Lisenby served as our Vice President and Chief Financial Officer. |
| (4) | Mr. Rogers’s role with our company changed during 2013. In 2013, he served as our Vice President and Chief Financial Officer from January through September and thereafter as our Vice President and Chief Accounting & Administrative Officer, Treasurer. |
Summary Compensation Table
The following table summarizes, with respect to our Named Executive Officers, information relating to the compensation earned for services rendered in all capacities during the fiscal year ended December 31, 2013.
| Name and Principal Position |
Year | Salary ($) |
Bonus (1)($) |
Non-Equity Incentive Plan Compensation ($)(2) |
All Other Compensation ($)(3) |
Total ($) |
||||||||||||||||||
| Daniel J. Rice, IV |
2013 | $ | 110,000 | $ | 65,000 | $ | — | $ | 2,200 | $ | 177,200 | |||||||||||||
| (CEO/VP and COO) |
||||||||||||||||||||||||
| Toby Z. Rice |
2013 | $ | 110,000 | $ | 65,000 | $ | — | $ | 3,850 | $ | 178,850 | |||||||||||||
| (President and COO/CEO) |
||||||||||||||||||||||||
| Grayson T. Lisenby |
2013 | $ | 126,389 | $ | 145,000 | $ | — | $ | 108 | $ | 271,497 | |||||||||||||
| (VP CFO/VP of Finance) |
||||||||||||||||||||||||
| James W. Rogers |
2013 | $ | 149,063 | $ | 126,750 | $ | — | $ | — | $ | 275,813 | |||||||||||||
| (VP and Chief Accounting and Administrative Officer, Treasurer/VP and CFO) |
||||||||||||||||||||||||
| (1) | The amounts in this column represent the aggregate amount of annual discretionary cash bonuses paid to our Named Executive Officers for fiscal year 2013 performance. |
| (2) | As discussed more fully below in the “Long Term Incentive Compensation” section of the narrative accompanying this table, each of the Named Executive Officers holds outstanding Incentive Units that are not classified as equity for accounting purposes. However, because satisfaction of the performance conditions related to these awards is not probable, no amounts have been treated as earned in 2013 for purposes of this table. |
| (3) | Amounts reported in the “All Other Compensation” column reflect company matching contributions to the Named Executive Officers’ 401(k) plan retirement accounts. |
118
Table of Contents
Index to Financial Statements
Narrative Description to the Summary Compensation Table for the 2013 Fiscal Year
In connection with our IPO, we engaged Alvarez & Marsal (“A&M”), a global professional services firm, as our compensation consultant to provide recommendations regarding our compensation arrangements. The following discussion describes the elements of our 2013 executive compensation program.
Base Salary
Each Named Executive Officer’s base salary is a fixed component of compensation for each year for performing specific job duties and functions. Prior to our IPO, an informal compensation committee comprised of Messers. D. Rice IV, T. Rice, and D. Rice III (collectively, the “Committee”) established the annual base salary rate for each of the Named Executive Officers at a level necessary to retain the individual’s services and reviewed base salaries on an annual basis at the end of each year, with adjustments implemented at the beginning of the next year. The Committee historically made adjustments to the base salary rates of the Named Executive Officers upon consideration of any factors that it deemed relevant, including but not limited to: (a) any increase or decrease in the executive’s responsibilities, (b) the executive’s job performance, and (c) the level of compensation paid to executives of other companies with which we compete for executive talent, as estimated based on publicly available information and the experience of members of the Committee. Notwithstanding the foregoing, under the Limited Liability Company Agreement of Rice Appalachia, dated January 25, 2012, as amended from time to time (the “REA LLC Agreement”), annual compensation and benefits (except for Incentive Units granted by Rice Appalachia’s Board of Managers under the REA LLC Agreement) for our Named Executive Officers historically required the approval of Natural Gas Partners, except to extent that such annual salaries did not exceed $150,000 for each of Messrs. T. Rice and D. Rice IV. Such requirement was eliminated with the amendment of the REA LLC Agreement in connection with our IPO.
In connection with our IPO, the Committee analyzed the appropriateness of the base salary for each of our Named Executive Officers in light of the base salaries of other executives in the peer group that we identified with the assistance of A&M, both on a stand-alone basis and as a component of total compensation. This review resulted in the establishment of the following annual base salaries for each of our Named Executive Officers, effective upon the IPO: $400,000 for each of Messrs. D. Rice IV and T. Rice and $300,000 for each of Messrs. Lisenby and Rogers. After further analysis, in May of 2014 our new compensation committee increased Messrs. Lisenby and Rogers’ base salaries to $400,000 and $350,000, respectively.
Annual Cash Bonus
Prior to the IPO, annual cash bonus awards for Messers. T. Rice and D. Rice IV were discretionary awards awarded by the Committee at the end of each fiscal year. The determination of the amount of these discretionary cash bonus awards, if any, was made based on an overall assessment of our company’s performance in light of overall market conditions, along with these Named Executive Officers’ individual performance, for the fiscal year, and was not based on any one or more specific performance objective or criteria.
The amount of annual bonus for Messrs. Lisenby and Rogers for 2013 was determined under a separate award program that applies to certain of our key employees. This program is administered under the Rice Energy Management Bonus Plan (the “Bonus Plan”), as established in January 2010 and amended from time to time. Under the Bonus Plan, for 2013, a targeted bonus amount expressed as a percentage of annual base salary was established for each of Messrs. Lisenby and Rogers. The determination of the amount of annual bonus payable for 2013 for each of Messrs. Lisenby and Rogers was made in the discretion of the Committee. In making this determination, the Committee historically considered each participating employee’s targeted bonus award amount (expressed as a percentage of the employee’s base salary) and the employee’s individual performance and contributions during the year, including his completion of job-specific duties, but the Committee retained full discretion to pay less than or more than the individual’s targeted bonus award amount. Due to our strong performance in 2013 and the contributions of Messrs. Lisenby and Rogers thereto, these two executives were awarded the full amount of their targeted bonus of $145,000, and $126,750, respectively.
119
Table of Contents
Index to Financial Statements
We intend to continue to provide annual incentive cash bonuses under the Rice Energy Inc. Long-Term Incentive Plan (the “LTIP”) to reward achievement of financial or operational goals so that total compensation reflects actual company and individual performance. In May 2014, our new compensation committee established performance goals under the LTIP to be used in determining the cash bonuses that may become payable for the 2014 performance period.
Long-Term Incentive Compensation
Incentive Units
Prior to our IPO, the only long-term incentives offered to our Named Executive Officers were through grants of Incentive Units, which were profits interests representing an interest in the future profits (once a certain level of proceeds has been generated) of our predecessor parent entity Rice Appalachia and granted pursuant to the REA LLC Agreement. These profits interests (the “REA Incentive Units”) represented interests in Rice Appalachia that had no value for tax purposes on the date of grant and were designed to gain value only after the underlying assets had realized a certain level of growth and return to those individuals who hold certain classes of Rice Appalachia’s equity. The REA Incentive Units were intended to provide the holders with the ability to benefit from the growth in our operations and business. In connection with our IPO and the related corporate reorganization, the Named Executive Officers (and other REA Incentive Unit holders) contributed their REA Incentive Units (except for those related to the incentive burden attributable to Mr. Daniel J. Rice III) to Rice Holdings and NGP Holdings in return for substantially similar incentive units in such entities.
In 2013, each of the Named Executive Officers held outstanding REA Incentive Units granted pursuant to the REA LLC Agreement. The profits interest awards were divided into seven tiered classes as follows: Legacy Tier I Units, Legacy Tier II Units, Legacy Tier III Units, New Tier I Units, New Tier II Units, New Tier III Units, and New Tier IV Units. A potential payout for each tier would have occurred only after a specified level of cumulative cash distributions had been received by Natural Gas Partners. Legacy Tier I Units were designed to vest in three equal annual installments, with such annual vesting occurring on the anniversaries of the grant date and with pro-rata monthly vesting between these annual anniversary dates. Legacy Tier II Units and Legacy Tier III Units would each have vested only upon the payment threshold established for that tier (described below). New Tier I Units and New Tier II Units were designed to vest in five equal annual installments on each anniversary of the grant date of such awards and with pro-rata monthly vesting between these annual anniversary dates. New Tier III Units and New Tier IV Units would each have vested only upon the payment threshold established for that tier (described below). In addition to the time-based vesting that applied to the Legacy Tier I Units, New Tier I Units, and New Tier II Units, such awards were also subject to accelerated vesting in full upon the occurrence of a “Fundamental Change” (as defined in the REA LLC Agreement and described below).
The difference between a vested and unvested unit was that once a unit vested, the executive would retain all vested profits interest awards as non-voting interests, unless such executive’s employment was terminated for “Cause” (as defined below) or voluntarily resigns. All profits interest awards that had not vested according to their original vesting schedule at the time an executive’s employment was terminated for any reason would be forfeited without payment. If we terminated an executive for Cause, or the executive voluntarily terminated his or her employment, all vested profits interest awards would also be forfeited at the time of the termination. If distributions were made with respect to a tier of these profits interest awards, both vested and unvested units (to the extent not previously forfeited) would receive the distributions and the holder of such units would be entitled to keep any such distributions regardless of whether the units were subsequently forfeited.
Under the REA LLC Agreement, the Legacy Tier I, Legacy Tier II and Legacy Tier III Units were entitled to 10%, 10% and 10%, respectively, of distributions to members only after Natural Gas Partners had received cumulative distributions in respect of their membership interests equal to two times, three times and four times, respectively, of the cumulative capital contributions made prior to April 18, 2013. The New Tier I Units and New Tier II Units were entitled to 20% and 5%, respectively, of distributions to members only after Natural Gas Partners had received cumulative distributions in respect of their membership interests equal to their cumulative capital
120
Table of Contents
Index to Financial Statements
contributions made on or after April 18, 2013, multiplied by (1.08)n and (1.20)n, respectively, where “n” was equal to a weighted average capital contribution factor determined as of the dates of the distributions. The New Tier III Units and New Tier IV Units were entitled to 5% and 5%, respectively, of distributions to members only after Natural Gas Partners had received cumulative distributions in respect of their membership interests equal to two times and 2.5 times, respectively, their cumulative capital contributions made on or after April 18, 2013.
As used in the paragraphs above, a “capital contribution” to Rice Appalachia generally means, for any member thereof, the dollar amount of any cash and the fair market value of any property contributed to Rice Appalachia.
A termination for “Cause” would have generally occurred upon the individual’s (i) conviction of, or plea of nolo contendere to, any felony or crime causing substantial harm to us or our affiliates or involving acts of theft, fraud, embezzlement, moral turpitude or similar conduct; (ii) repeated intoxication by alcohol or drugs during the performance of the individual’s duties in a manner that materially and adversely affects the individual’s performance of such duties; (iii) malfeasance in the conduct of the individual’s duties; (iv) violation of any voting or transfer restriction agreement or a confidentiality and noncompete agreement that the individual has executed with us; and (v) failure to perform the duties of the individual’s service relationship with us or our affiliates, or failure to follow or comply with the reasonable and lawful written directives of our board of managers or the board of an affiliate employing or engaging the service of such individual, as applicable.
A “Fundamental Change” was generally deemed to have occurred when Rice Appalachia entered into any merger or consolidation with another entity, the outstanding interests in the company were sold or exchanged, or Rice Appalachia sold, leased, exchanged, or licensed all or substantially all of its assets, in each case other than with or to a related entity and only if Rice Appalachia’s existing board members did not continue to constitute at least a majority of the members of the board of the surviving or acquiring entity immediately following the transaction. A Fundamental Change was also deemed to have occurred if any single person or entity (or groups of such related persons or entities) purchased or acquired the right to vote or dispose of the company’s securities in an amount representing 50% or more of the total voting power of all the then outstanding voting securities of Rice Appalachia unless such transaction has been approved by Rice Appalachia’s board of managers (provided that no capital contribution by certain Natural Gas Partners entities shall constitute a Fundamental Change). Our IPO, and the related corporate reorganization did not constitute a Fundamental Change.
Prior to our IPO, no tier of the profits interest awards had received a payout. Since no amount of the outstanding REA Incentive Units held by our Named Executive Officers had been earned (as the performance conditions related to payout were not probable of occurring) as of December 31, 2013 and the awards were not accounted for under Financial Accounting Standards Board Accounting Standards Topic 718 (“FASB ASC Topic 718”), the value of these profits interests had not been included in our Summary Compensation Table. In connection with our corporate reorganization, approximately 160,831 shares of our common stock were issued to certain of the incentive holders in exchange for the portion of their REA Incentive Units related to the incentive burden attributable to Mr. Daniel J. Rice III. In connection with our IPO, in the first quarter of 2014, we recognized a non-cash compensation expense of $3.4 million. Also, in connection with our IPO, in the first quarter of 2014, certain incentive units granted by NGP Holdings to certain members of management triggered the pre-determined payout criteria, resulting in a cash payment of $4.4 million. This resulted in additional non-cash compensation expense.
In connection with our IPO and the related corporate reorganization, the Named Executive Officers (and other REA Incentive Unit holders) contributed their REA Incentive Units (except for those related to the incentive burden attributable to Mr. Daniel J. Rice III) to Rice Holdings and NGP Holdings in return for substantially similar incentive units in such entities. As a result, the burden of the incentive units previously attributable to Rice Partners and Natural Gas Partners was replicated in the limited liability company agreements of Rice Holdings and NGP Holdings, respectively. The limited liability company agreement of NGP Holdings entitles holders of incentive units to a portion of distributions made by NGP Holdings. Generally, it is anticipated
121
Table of Contents
Index to Financial Statements
that such distributions will occur in connection with sales of our common stock by NGP Holdings. Accordingly, if the requisite cumulative cash distribution thresholds to Natural Gas Partners have been met, incentive unitholders are entitled to cash distributions on any applicable class of incentive units at such time. Following the end of the 2013 fiscal year, on January 30, 2014, a distribution threshold was satisfied and NGP Holdings made certain cash distributions to incentive unit holders; Messrs. Daniel Rice, Toby Rice, Lisenby and Rogers received aggregate payments in the amount of $376,376; $486,647; $557,076 and $114,626, respectively, related to their incentive units. We expect that this offering will result in additional cash payments to incentive unitholders, including members of management. Similarly, the limited liability company agreement of Rice Holdings entitles holders of incentive units to a portion of distributions made by Rice Holdings. However, incentive unitholders in Rice Holdings are not entitled to receive distributions of distributable funds until the earlier of January 2, 2016, or 30 days following the date on which NGP Holdings has sold in excess of 50% of its Rice Energy Inc. common stock (including pursuant to our IPO). On such date and each of the three anniversaries thereafter, Rice Holdings will distribute one-quarter of its distributable funds, including shares of our common stock, to its members. Accordingly, if requisite cumulative distribution thresholds to Rice Partners have been met, incentive unitholders are entitled to distributions of either cash or our common stock on any applicable class of incentive units at such times. As of the date of this filing, no distributions have been made to the incentive unit holders from Rice Holdings. Because we are not a party to the limited liability company agreements of Rice Holdings or NGP Holdings, we cannot be certain that the terms of the profits interest units will not change in the future.
Long-Term Incentive Plan
In order to incentivize management members, our board of directors adopted the LTIP, an omnibus long-term incentive plan for employees, consultants, and directors. Our Named Executive Officers are eligible to participate in the LTIP which provides for the grant of bonus stock, restricted stock, restricted stock units, options, stock appreciation rights, dividend equivalent rights, performance awards, annual incentive awards and other stock-based awards intended to align the interests of key employees (including the Named Executive Officers) with those of our stockholders. We did not grant any equity awards under the LTIP to our Named Executive Officers during the 2013 year. In May of 2014, our compensation committee approved grants of performance stock units and restricted stock units to each of our Named Executive Officers. The terms and conditions of these awards will be more fully described in our definitive proxy statement filed pursuant to Section 14(a) of the Securities Exchange Act of 1934 with respect to our 2015 annual meeting of stockholders.
Other Compensation Elements
We also offer participation in broad-based retirement and health and welfare plans to all of our employees. We currently maintain a retirement plan intended to provide benefits under section 401(k) of the Code whereby employees, including our Named Executive Officers, are allowed to contribute portions of their compensation (which includes all compensation reported on Form W-2 for the year) to a tax-qualified retirement account. See “—Additional Narrative Disclosure Regarding Retirement Benefits and Other Potential Payments Upon Termination or a Change in Control-Retirement Benefits” for more information.
Outstanding Equity Awards at 2013 Fiscal Year-End
None of our Named Executive Officers held any outstanding equity awards that were accounted for under FASB ASC Topic 718 as of December 31, 2013.
Additional Narrative Disclosure Regarding Retirement Benefits and Other Potential Payments Upon Termination or a Change in Control
Retirement Benefits
We have not maintained, and do not currently maintain, a defined benefit pension plan or a nonqualified deferred compensation plan providing for retirement benefits. We currently maintain a retirement plan intended
122
Table of Contents
Index to Financial Statements
to provide benefits under section 401(k) of the Code, under which employees, including our Named Executive Officers, are allowed to contribute portions of their compensation to a tax-qualified retirement account. Under our 401(k) plan, we provide matching contributions equal to 100% of the first 6% of employees’ eligible compensation contributed to the plan.
Employment, Severance or Change in Control Agreements
As described in more detail under “—Narrative Description to the Summary Compensation Table for the 2013 Fiscal Year-Long-Term Incentive Compensation” above, the REA Incentive Units held by our Named Executive Officers were to be either forfeited or remain outstanding following the officer’s termination of employment, with no acceleration of vesting or payment being made under the awards upon such termination of employment.
Prior to our IPO, we historically had not maintained any employment, severance or change in control agreements with any of our Named Executive Officers. In addition, none of the Named Executive Officers were entitled to any payments or other benefits in connection with a termination of their employment or a change in control during the 2013 year, except that in certain instances, (1) our employees may be entitled to receive, upon a sale of the company or substantially all of our assets, amounts of already earned annual bonus awards under our Bonus Plan to the extent such amounts have not yet been paid at the time such transaction occurs, and (2) a change in control (a “Fundamental Change,” as such term is defined in the REA LLC Agreement and summarized under “—Narrative Description to the Summary Compensation Table for the 2013 Fiscal Year-Long Term Incentive Compensation-Incentive Units” above may result in a cash distribution being made to holders of vested REA Incentive Units, in accordance with the distribution priority specified in the REA LLC Agreement (unvested REA Incentive Units do not become vested upon a change in control).
In connection with our IPO, our Named Executive Officers entered into employment agreements with us on January 29, 2014. Under these new employment agreements, each of our Named Executive Officers is entitled to certain severance benefits upon a qualifying termination of employment and the employment agreements preclude the executives from soliciting employees or competing with us for a period of one year following termination of employment.
The description of the employment agreements set forth below is a summary of the material features of the agreements regarding potential payments upon termination or a change in control. This summary, however, does not purport to be a complete description of all the provisions of the agreements with the executives. This summary is qualified in its entirety by reference to the employment agreements, which are filed as exhibits to our Annual Report on Form 10-K for the year ended December 31, 2013.
Under the terms of the new employment agreements, each Named Executive Officer is entitled to receive the following amounts (the “Accrued Rights”) upon a termination by the company for “cause” (as such term is defined below), upon a termination of employment by reason of death, disability, or expiration of the term of the employment agreement, or upon the executive’s termination without “good reason” (as such term is defined below): (a) payment of all accrued and unpaid base salary to the date of termination, (b) reimbursement of all incurred but unreimbursed business expenses to which the executive would have been entitled to reimbursement, and (c) benefits to which the executive is entitled under the terms of any applicable benefit plan or program. If the termination is due to death or disability, such Named Executive Officer is also entitled to accelerated vesting of any outstanding LTIP awards.
Under the terms of the employment agreements, each Named Executive Officer is also entitled to receive the following amounts upon a termination by the executive for “good reason” (as such term is defined below) or by the company without “cause” (as such term is defined below): (a) the Accrued Rights; (b) any earned but unpaid annual bonus for the prior year; (c) a prorated annual bonus for the year of termination; (d) a severance payment equal to one times (two times in the event of a qualifying termination within the 12-month period
123
Table of Contents
Index to Financial Statements
following a “change in control” as such term is defined below) the sum of the executive’s base salary on the date of termination and the average annual bonus for the three prior calendar years; and (e) accelerated vesting of any outstanding LTIP awards held by the executive as of the date of termination. The Named Executive Officers are also entitled to continued coverage under our group health plan for any COBRA period (up to 18 months) elected for the executive and the executive’s spouse and eligible dependents, at no greater premium cost than that which applies to our active senior executive employees.
The following terms are defined under the employment agreements for the Named Executive Officers, as described below:
| • | “Cause” means a determination by the board of directors (or its delegates) that the executive (a) has engaged in gross negligence, gross incompetence, or misconduct in the performance of the executive’s duties to us, (b) has failed without proper legal reason to perform the executive’s duties and responsibilities to us, (c) has breached any material provision of the employment agreement or any written agreement or corporate policy or code of conduct established by us, (d) has engaged in conduct that is, or could reasonably expected to be, materially injurious to us, (e) has committed an act of theft, fraud, embezzlement, misappropriation, or breach of a fiduciary duty to us, or (f) has been convicted of, pleaded no contest to, or received adjudicated probation or deferred adjudication in connection with a crime involving fraud, dishonesty, or moral turpitude or any felony (or a crime of similar import in a foreign jurisdiction). |
| • | “Good Reason” means (a) a material diminution in the executive’s base salary (as defined in the employment agreements), other than as a part of one or more decreases that (i) shall not exceed, in the aggregate, more than 10% of the base salary as in effect on the date immediately prior to such decrease, and (ii) are applied similarly to all of our similarly situated executives; (b) a material diminution in the executive’s authority, duties, or responsibilities; or (c) the involuntary relocation of the geographic location of the executive’s principal place of employment by more than 75 miles from the location of the executive’s principal place of employment as of the effective date of the employment agreement. |
| • | “Change in Control” generally means (a) a merger, consolidation, or sale of all or substantially all of our assets if (i) our shareholders do not continue to own at least 50% of the voting power of the resulting entity in substantially the same proportions that they owned our equity securities prior to the transaction or event or (ii) the members of our board immediately prior to the transaction or event do not constitute at least a majority of the board of directors of the resulting entity immediately after the transaction or event; (b) the dissolution or liquidation of the company; (c) when any person, entity, or group acquires or gains ownership or control of more than 50% of the combined voting power of the outstanding securities of the company, or (d) as a result of or in connection with a contested election of directors, the persons who were members of our board immediately before such election cease to constitute a majority of the board. |
Compensation of Directors
We did not award any compensation to our non-employee directors during 2013. Going forward, our board of directors believes that attracting and retaining qualified non-employee directors will be critical to the future value growth and governance of our company. Our board of directors also believes that the compensation package for our non-employee directors should require a portion of the total compensation package to be equity-based to align the interest of these directors with our stockholders.
Except with respect to designees of Rice Holdings and NGP Holdings, we have implemented the following non-employee director compensation program: (a) an annual cash retainer valued at approximately $250,000 for the chairman of our board, $60,000 for our committee chairmen and $50,000 for all other non-employee directors, and (b) an annual LTIP award valued at approximately $250,000 for the chairman of our board and $175,000 for our committee chairmen, and $165,000 for all other non-employee directors. We do not pay any additional fees for attendance at board or committee meetings, but we do reimburse each director for travel and
124
Table of Contents
Index to Financial Statements
miscellaneous expenses to attend meetings and activities of our board or its committees. In addition, two of our non-employee directors, Robert F. Vagt and James W. Christmas, received initial grants of restricted stock units upon the closing of our IPO in the amount of 11,905 and 5,238, respectively, that are subject to a one-year cliff vesting schedule. Directors who are also our employees and directors who are designees of Rice Holdings and NGP Holdings do not receive any additional compensation for their service on our board of directors.
125
Table of Contents
Index to Financial Statements
PRINCIPAL AND SELLING STOCKHOLDERS
Beneficial Ownership
The following table sets forth certain information regarding the beneficial ownership of our common stock as of July 1, 2014 by (i) each person who is known by us to own beneficially more than five percent of our outstanding shares of common stock, (ii) each of our named executive officers, (iii) each member of our board of directors and (iv) all of our directors and executive officers as a group and (v) the selling stockholders. Unless otherwise noted, the mailing address of each person or entity named below is c/o Rice Energy Inc., 171 Hillpointe Drive, Suite 301, Canonsburg, Pennsylvania 15317.
| Shares Beneficially Owned Prior to the Offering |
Shared Being Offered |
Shares Beneficially Owned After the Offering(1) |
||||||||||||||||||
| Name and Address of Beneficial Owner |
Number | Percentage | Number | Percentage | ||||||||||||||||
| Selling Stockholders and 5% Stockholders: |
||||||||||||||||||||
| Rice Partners(2) |
20,000,000 | 15.6 | % | — | 20,000,000 | 14.7 | % | |||||||||||||
| Rice Holdings(3) |
20,300,923 | 15.8 | — | 20,300,923 | 14.9 | |||||||||||||||
| NGP Holdings(4) |
23,452,550 | 18.3 | 6,460,623 | 16,991,927 | 12.5 | |||||||||||||||
| Alpha Holdings(5) |
9,523,810 | 7.4 | 6,460,623 | 3,063,187 | 2.2 | |||||||||||||||
| Directors and Named Executive Officers: |
||||||||||||||||||||
| Daniel J. Rice IV(6) |
25,009 | * | — | 25,009 | * | |||||||||||||||
| Toby Z. Rice(7) |
27,594 | * | — | 27,594 | * | |||||||||||||||
| Grayson T. Lisenby(8) |
30,014 | * | — | 30,014 | * | |||||||||||||||
| James W. Rogers(9) |
23,088 | * | — | 23,088 | * | |||||||||||||||
| Robert F. Vagt(10) |
25,869 | * | — | 25,869 | * | |||||||||||||||
| Daniel J. Rice III(2) |
22,356,844 | 17.4 | — | 22,356,844 | 16.4 | |||||||||||||||
| Scott A. Gieselman |
40,000 | * | — | 40,000 | * | |||||||||||||||
| Chris G. Carter |
— | — | — | — | — | |||||||||||||||
| James W. Christmas(11) |
112,694 | * | — | 112,694 | * | |||||||||||||||
| Kevin S. Crutchfield(12) |
10,236 | * | — | 10,236 | * | |||||||||||||||
| All Directors and Executive Officers as a Group (12 Persons)(13) |
22,712,732 | 17.7 | — | 22,712,732 | 16.7 | |||||||||||||||
| * | Less than one percent. |
| (1) | Based upon an aggregate of 128,654,526 shares outstanding as of June 30, 2014. |
| (2) | Rice Partners is the sole member of Rice Holdings. Rice Energy Management LLC is the general partner of Rice Partners. Rice Energy Management LLC is controlled by a board of managers, consisting solely of Daniel J. Rice III. By virtue of his relationship with Rice Partners, Daniel J. Rice III is deemed to have an indirect beneficial interest in the shares of common stock held by Rice Partners. Daniel J. Rice III directly owns 2,356,844 shares of our common stock. Rice Partners has indicated that it may pledge all or a portion of its shares of our common stock as collateral under a credit agreement it may enter into in the future. |
| (3) | Rice Holdings is controlled by a board of managers consisting of Daniel J. Rice IV, Toby Z. Rice and Daniel J. Rice III. |
| (4) | NGP Holdings is indirectly owned by Natural Gas Partners IX, L.P. and an affiliate thereof (“NGP IX”) and NGP Natural Resources X, L.P. and an affiliate thereof (“NGP X”). NGP IX and NGP X may be deemed to share voting and dispositive power over the reported securities, and therefore, may also be deemed to be the beneficial owner of these securities. NGP IX and NGP X disclaim beneficial ownership of the reported securities in excess of such entity’s respective pecuniary interest in the securities. G.F.W. Energy IX, L.P. and GFW IX, L.L.C. may be deemed to share voting and dispositive power over the reported securities, and therefore, may also be deemed to be the beneficial owner of these shares by virtue of GFW IX, L.L.C. being the sole general partner of G.F.W. Energy IX, L.P. (which is the sole general partner of NGP IX). G.F.W. Energy X, L.P. and GFW X, L.L.C. may be deemed to share voting and dispositive power over the reported securities, and therefore, may also be deemed to be the beneficial owner of these shares by virtue of |
126
Table of Contents
Index to Financial Statements
| GFW X, L.L.C. being the sole general partner of G.F.W. Energy X, L.P. (which is the sole general partner of NGP X). David R. Albin and Kenneth A. Hersh, each an Authorized Member of GFW IX, L.L.C. and GFW X, L.L.C., may also be deemed to share the power to vote, or to direct the vote, and to dispose, or to direct the disposition, of the securities owned by NGP Holdings. Mr. Hersh and Mr. Albin disclaim beneficial ownership of the securities, except to the extent of their respective pecuniary interest therein. Neither Mr. Hersh nor Mr. Albin owns directly any such securities. GFW IX, L.L.C. and GFW X, L.L.C. have delegated full power and authority to manage NGP IX and NGP X, respectively to NGP Energy Capital Management, L.L.C. and accordingly, NGP Energy Capital Management, L.L.C. may be deemed to share voting and dispositive power over these securities and therefore may also be deemed to be the beneficial owner of these securities. |
| (5) | Alpha Holdings has granted the underwriters the option to purchase an additional 3,063,187 shares of common stock in connection with this offering. If the underwriters exercise such option in full, Alpha Holdings will not beneficially own any shares of our common stock following this offering. Alpha Holdings is a wholly owned indirect subsidiary of Alpha Natural Resources, Inc., and as such, Alpha Natural Resources, Inc. will be deemed to be the beneficial owner of these securities. The mailing address for each of Alpha Holdings and Alpha Natural Resources Inc. is One Alpha Place, P.O. Box 16429, Bristol, Virginia. |
| (6) | Includes 13,770 unvested restricted stock units. |
| (7) | Includes 13,770 unvested restricted stock units. |
| (8) | Includes 13,770 unvested restricted stock units. |
| (9) | Includes 12,049 unvested restricted stock units. |
| (10) | Includes 22,869 unvested restricted stock units. |
| (11) | Includes 12,694 unvested restricted stock units. |
| (12) | Includes 7,236 unvested restricted stock units. |
| (13) | Includes an aggregate of 146,303 unvested restricted stock units granted to all directors and executive officers of the Company. |
Equity Compensation Plans
At December 31, 2013, we had no securities authorized for issuance under equity compensation plans.
127
Table of Contents
Index to Financial Statements
CERTAIN RELATIONSHIPS AND RELATED PARTY TRANSACTIONS
Historical Transactions with Affiliates
Since its inception, Rice Drilling B has issued additional membership interests as consideration for capital contributions received from Rice Appalachia. Capital contributions for the year ended December 31, 2013 and the year ended December 31, 2012 were $198.2 million and $113.0 million, respectively. Rice Appalachia made no capital contributions to Rice Drilling B for the year ended December 31, 2011 or for the three months ended March 31, 2014.
The capital contributions made by Rice Appalachia were the result of capital contributions made to Rice Appalachia by the following individuals and entities:
| • | Daniel J. Rice III: $0.2 million and $14.0 million for the years ended December 31, 2013 and 2012, respectively; |
| • | Rice Partners: $49.9 million for the year ended December 31, 2012; and |
| • | Natural Gas Partners $198.0 million and $99.0 million for the years ended December 31, 2013 and 2012, respectively. |
In addition, Rice Drilling B paid legal fees of Natural Gas Partners totaling approximately $30 thousand and $0.4 million for the years ended December 31, 2013 and 2012, respectively, in connection with these transactions.
NGP received a put right with respect to their equity investment in Rice Drilling B (indirectly, through its investment in Rice Appalachia) which is contingently exercisable upon the occurrence of certain events. The earliest date that this put right could be exercised is January 25, 2017. The fair value of this put right is de minimis given the accretion in fair value of Rice Appalachia and this put right is no longer be applicable following the completion of our IPO.
In prior periods, we reimbursed Rice Partners for expenses incurred on our behalf. General and administrative expenses incurred by Rice Partners and reimbursed by us were $9.3 million, $4.8 million and $3.1 million for the years ended December 31, 3013, 2012 and 2011, respectively. As of December 31, 2013 and 2012, $6.1 million and $2.5 million, respectively, of general and administrative expenses was due to Rice Partners and is recorded as due to affiliate on the consolidated balance sheet. This agreement was terminated prior to the closing of our IPO, and no general and administrative expenses incurred by Rice Partners were reimbursed us in the three months ended March 31, 2014.
We are reimbursed for costs incurred on behalf of our Marcellus joint venture. General and administrative expenses incurred by us and reimbursed by our Marcellus joint venture were $1.6 million, $1.3 million and $0.0 million for the years ended December 31, 2013, 2012 and 2011, respectively, and no amounts were reimbursed by our Marcellus joint venture for the three months ended March 31, 2014. As of December 31, 2012, we recorded a receivable from our Marcellus joint venture for $4.6 million representing leaseholds that were approved to be contributed to the joint venture. There was no such receivable as of December 31, 2013 or as of March 31, 2014.
In January 2010, Rice Energy Limited Partnership assigned its 100% membership interest in Rice Drilling C LLC (“Rice C”) to Rice Drilling B. At the date of the transfer of membership interest, Rice C’s assets consisted solely of approximately $0.9 million.
In November 2009, we entered into restricted unit agreements with an employee and certain consultants. Under separate and individual restricted unit agreements, the eligible employee and consultants were granted units which vest over a specified period of time. Each unit entitles the holder to an equity ownership in us. The restricted units are accounted for as liability awards, which require re-measurement each reporting period, as a
128
Table of Contents
Index to Financial Statements
result of the existence of a call option that permits us to repurchase the awards at a fixed amount that could be above or below fair market value of the units. Management established an estimated fair value for issued units based upon an income approach prior to December 31, 2013. At December 31, 2013, in connection with the IPO, a market approach was used. During the years ended December 31, 2013, 2012 and 2011 and the three months ended March 31, 2014, $32.9 million, $0.0 million, $0.2 million and $0.0 million, respectively, of restricted unit expense was recognized for these awards. During 2012, Rice Appalachia, as the designee of Rice Drilling B, exercised the option to repurchase certain restricted units from a consultant. In connection with our IPO, the balance of the restricted units outstanding was exchanged for 1,728,852 shares of our common stock.
On October 28, 2009, we entered into a subordinated working capital promissory note payable to Daniel J. Rice III in the amount of $4.0 million. The note accrued interest at a rate of 1.20% and interest only is due at maturity on February 1, 2018. This note was converted to equity in January 2012.
On February 1, 2009, the terms of a $10.0 million subordinated related party promissory note payable to Daniel J. Rice III were modified. For accounting purposes, the cash flows of the promissory note were considered substantially different resulting in extinguishment accounting. There were no financing fees recorded for the promissory note. The fair value of the modified promissory note was compared to the carrying value of the original promissory note with the difference resulting in a capital contribution from the related party of $3.6 million. The fair value was estimated based upon an estimate of market rates at the inception of the promissory note. The discount was amortized over the life of the instruments using an effective interest rate of 4.6%. This note was converted to equity in January 2012.
Marcellus JV Buy-In Transaction Agreement
On January 29, 2014, in connection with the closing of our IPO and pursuant to the Transaction Agreement, we completed our acquisition of Alpha Holdings’ 50% interest in our Marcellus joint venture to us in exchange for total consideration of $322 million, consisting of $100 million of cash and our issuance to Alpha Holdings of 9,523,810 shares of our common stock.
Registration Rights Agreement
In connection with the closing of our IPO, we entered into a registration rights agreement with Rice Holdings, Rice Partners, Daniel J. Rice III, NGP Holdings and Alpha Holdings, referred to herein as the Initial Holders. Pursuant to the registration rights agreement, we have agreed to register the sale of shares of our common stock under certain circumstances.
Demand Rights. Subject to the limitations set forth below, any Initial Holder (or their permitted transferees) has the right to require us by written notice to prepare and file a registration statement registering the offer and sale of a number of their shares of common stock. Generally, we are required to provide notice of the request within five business days following the receipt of such demand request to all additional holders of our common stock, who may, in certain circumstances, participate in the registration. In no event shall more than one demand registration occur during any six-month period or within 180 days (with respect to our IPO) or 90 days (with respect to any public offering other than our IPO) after the effective date of a final Annual Report we file. Further, we are not obligated to effect:
| • | (i) through December 31, 2016, more than a total of three demand registrations or (ii) on or after January 1, 2017, more than a total of one demand registration per calendar year at the request of Rice Holdings; |
| • | more than one demand registration for Daniel J. Rice III; |
| • | (i) through December 31, 2016, more than a total of three demand registrations or (ii) on or after January 1, 2017, more than a total of one demand registration per calendar year at the request of NGP Holdings; or |
| • | more than one demand registration for Alpha Holdings. |
129
Table of Contents
Index to Financial Statements
We are also not obligated to effect any demand registration in which the anticipated aggregate offering price included in such offering is less than $30 million. Once we are eligible to effect a registration on Form S-3, any such demand registration may be for a shelf registration statement. Any demand for an underwritten offering pursuant to an effective shelf registration statement shall constitute a demand request subject to the limitations set forth above. We will be required to maintain the effectiveness of any such registration statement until the earlier of 180 days (or two years if a “shelf registration” is requested) after the effective date and the consummation of the distribution by the participating holders.
Piggy-back Rights. If, at any time, we propose to register an offering of common stock (subject to certain exceptions) for our own account, then we must give at least five business days’ notice to all holders of registrable securities to allow them to include a specified number of their shares in that registration statement.
Conditions and Limitations; Expenses. These registration rights are subject to certain conditions and limitations, including the right of the underwriters to limit the number of shares to be included in a registration and our right to delay or withdraw a registration statement under certain circumstances. We will generally pay all registration expenses in connection with our obligations under the registration rights agreement, regardless of whether a registration statement is filed or becomes effective.
Stockholders’ Agreement
In connection with the closing of our IPO, we entered into a stockholders’ agreement with Rice Holdings, Rice Partners, NGP Holdings and Alpha Natural Resources, Inc. Pursuant to the stockholders’ agreement, we and our principal stockholders agreed to appoint individuals designated by the principal stockholders to our board of directors and nominate such persons for election at each annual meeting of our stockholders, subject to the following:
| • | Rice Holdings has the right to nominate three members of our board of directors, provided that such number of nominees shall be reduced to two and zero if Rice Holdings and its affiliates, which includes Rice Partners and Dan Rice III, collectively own less than 15% and 5%, respectively, of the outstanding shares of our common stock; |
| • | NGP Holdings has the right to nominate two members of our board of directors, provided that such number of nominees shall be reduced to one and zero if NGP Holdings and its affiliates collectively own less than 15% and 5%, respectively, of the outstanding shares of our common stock; |
| • | Alpha Natural Resources, Inc. has the right to nominate one member of our board of directors, provided that such number of nominees shall be reduced to zero if Alpha Natural Resources, Inc. and its affiliates collectively own less than 5% of the outstanding shares of our common stock. |
The nominee designated by Alpha Natural Resources, Inc. must be either (i) the Chief Executive Officer of Alpha Natural Resources, Inc. at the time of designation or (ii) a member of senior management (with a title of Senior Vice President or greater) of Alpha Natural Resources, Inc. that is reasonably satisfactory to us.
The stockholders’ agreement also requires the stockholders party thereto to take all necessary actions, including voting their shares of common stock, for the election of the nominees designated by such principal stockholders.
130
Table of Contents
Index to Financial Statements
The authorized capital stock of Rice Energy Inc. consists of 650,000,000 shares of common stock, $0.01 par value per share, of which 136,154,526 shares will be issued and outstanding upon the completion of this offering, and 50,000,000 shares of preferred stock, $0.01 par value per share, of which no shares will be issued and outstanding. The following summary of the capital stock and amended and restated certificate of incorporation and amended and restated bylaws of Rice Energy Inc. does not purport to be complete and is qualified in its entirety by reference to the provisions of applicable law and to our amended and restated certificate of incorporation and amended and restated bylaws, which are filed as exhibits to the registration statement of which this prospectus is a part.
Common Stock
Except as provided by law or in a preferred stock designation, holders of common stock are entitled to one vote for each share held of record on all matters submitted to a vote of the stockholders, will have the exclusive right to vote for the election of directors and do not have cumulative voting rights. Except as otherwise required by law, holders of common stock, are not entitled to vote on any amendment to the amended and restated certificate of incorporation (including any certificate of designations relating to any series of preferred stock) that relates solely to the terms of any outstanding series of preferred stock if the holders of such affected series are entitled, either separately or together with the holders of one or more other such series, to vote thereon pursuant to the amended and restated certificate of incorporation (including any certificate of designations relating to any series of preferred stock) or pursuant to the DGCL. Subject to prior rights and preferences that may be applicable to any outstanding shares or series of preferred stock, holders of common stock are entitled to receive ratably in proportion to the shares of common stock held by them such dividends (payable in cash, stock or otherwise), if any, as may be declared from time to time by our board of directors out of funds legally available for dividend payments. All outstanding shares of common stock are fully paid and non-assessable, and the shares of common stock to be issued upon completion of this offering will be fully paid and non-assessable. The holders of common stock have no preferences or rights of conversion, exchange, pre-emption or other subscription rights. There are no redemption or sinking fund provisions applicable to the common stock. In the event of any voluntary or involuntary liquidation, dissolution or winding-up of our affairs, holders of common stock will be entitled to share ratably in our assets in proportion to the shares of common stock held by then that are remaining after payment or provision for payment of all of our debts and obligations and after distribution in full of preferential amounts to be distributed to holders of outstanding shares of preferred stock, if any.
Warrants
On August 15, 2011, we issued warrants to certain of the broker-dealers involved in our private placement of convertible notes. Two separate classes of warrants were issued (normal and bonus), the sole difference being the exercise price per share. Through July 1, 2014, 1,065 warrants have been exercised in exchange for 643,615 shares of Rice Energy Inc. common stock.
Preferred Stock
Our amended and restated certificate of incorporation authorizes our board of directors, subject to any limitations prescribed by law, without further stockholder approval, to establish and to issue from time to time one or more classes or series of preferred stock, par value $0.01 per share, covering up to an aggregate of 50,000,000 shares of preferred stock. Each class or series of preferred stock will cover the number of shares and will have the powers, preferences, rights, qualifications, limitations and restrictions determined by the board of directors, which may include, among others, dividend rights, liquidation preferences, voting rights, conversion rights, preemptive rights and redemption rights. Except as provided by law or in a preferred stock designation, the holders of preferred stock will not be entitled to vote at or receive notice of any meeting of stockholders.
131
Table of Contents
Index to Financial Statements
Anti-Takeover Effects of Provisions of Our Amended and Restated Certificate of Incorporation, our Amended and Restated Bylaws and Delaware Law
Some provisions of Delaware law, our amended and restated certificate of incorporation and our amended and restated bylaws contain provisions that could make the following transactions more difficult: acquisitions of us by means of a tender offer, a proxy contest or otherwise; or removal of our incumbent officers and directors. These provisions may also have the effect of preventing changes in our management. It is possible that these provisions could make it more difficult to accomplish or could deter transactions that stockholders may otherwise consider to be in their best interest or in our best interests, including transactions that might result in a premium over the market price for our shares.
These provisions are expected to discourage coercive takeover practices and inadequate takeover bids. These provisions are also designed to encourage persons seeking to acquire control of us to first negotiate with us. We believe that the benefits of increased protection and our potential ability to negotiate with the proponent of an unfriendly or unsolicited proposal to acquire or restructure us outweigh the disadvantages of discouraging these proposals because, among other things, negotiation of these proposals could result in an improvement of their terms.
Delaware Law
Section 203 of the DGCL prohibits a Delaware corporation, including those whose securities are listed for trading on the NYSE, from engaging in any business combination with any interested stockholder for a period of three years following the date that the stockholder became an interested stockholder, unless:
| • | the transaction is approved by the board of directors before the date the interested stockholder attained that status; |
| • | upon consummation of the transaction that resulted in the stockholder becoming an interested stockholder, the interested stockholder owned at least 85% of the voting stock of the corporation outstanding at the time the transaction commenced; or |
| • | on or after such time the business combination is approved by the board of directors and authorized at a meeting of stockholders by at least two-thirds of the outstanding voting stock that is not owned by the interested stockholder. |
We are not subject to the provisions of Section 203 of the DGCL.
Amended and Restated Certificate of Incorporation and Amended and Restated Bylaws
Provisions of our amended and restated certificate of incorporation and amended and restated bylaws may delay or discourage transactions involving an actual or potential change in control or change in our management, including transactions in which stockholders might otherwise receive a premium for their shares, or transactions that our stockholders might otherwise deem to be in their best interests. Therefore, these provisions could adversely affect the price of our common stock.
Among other things, our amended and restated certificate of incorporation and amended and restated bylaws:
| • | establish advance notice procedures with regard to stockholder proposals relating to the nomination of candidates for election as directors or new business to be brought before meetings of our stockholders. These procedures provide that notice of stockholder proposals must be timely given in writing to our corporate secretary prior to the meeting at which the action is to be taken. Generally, to be timely, notice must be received at our principal executive offices not less than 90 days nor more than 120 days prior to the first anniversary date of the annual meeting for the preceding year. Our amended and restated bylaws specify the requirements as to form and content of all stockholders’ notices. These requirements may preclude stockholders from bringing matters before the stockholders at an annual or special meeting; |
| • | provide our board of directors the ability to authorize undesignated preferred stock. This ability makes it possible for our board of directors to issue, without stockholder approval, preferred stock with voting |
132
Table of Contents
Index to Financial Statements
| or other rights or preferences that could impede the success of any attempt to change control of us. These and other provisions may have the effect of deferring hostile takeovers or delaying changes in control or management of our company; |
| • | provide that the authorized number of directors may be changed only by resolution of the board of directors; |
| • | provide that all vacancies, including newly created directorships, may, except as otherwise required by law or, if applicable, the rights of holders of a series of preferred stock, be filled by the affirmative vote of a majority of directors then in office, even if less than a quorum; |
| • | at any time after Rice Holdings, Daniel J. Rice III, NGP Holdings and NGP Energy Capital Management, L.L.C. and their respective affiliates (collectively, the “Sponsors”) no longer collectively beneficially own more than 50% of the outstanding shares of our common stock, |
| • | provide that any action required or permitted to be taken by the stockholders must be effected at a duly called annual or special meeting of stockholders and may not be effected by any consent in writing in lieu of a meeting of such stockholders, subject to the rights of the holders of any series of preferred stock with respect to such series (prior to such time, such actions may be taken without a meeting by written consent of holders of common stock having not less than the minimum number of votes that would be necessary to authorize such action at a meeting); |
| • | provide our certificate of incorporation and bylaws may be amended by the affirmative vote of the holders of at least two-thirds of our then outstanding common stock (prior to such time, our certificate of incorporation and bylaws may be amended by the affirmative vote of the holders of a majority of our then outstanding common stock); and |
| • | provide that special meetings of our stockholders may only be called by the board of directors, the chief executive officer or the chairman of the board (prior to such time, a special meeting may also be called at the request of stockholders holding a majority of the outstanding shares entitled to vote); |
| • | provide for our board of directors to be divided into three classes of directors, with each class as nearly equal in number as possible, serving staggered three year terms, other than directors which may be elected by holders of preferred stock, if any. This system of electing and removing directors may tend to discourage a third party from making a tender offer or otherwise attempting to obtain control of us, because it generally makes it more difficult for stockholders to replace a majority of the directors; |
| • | provide that we renounce any interest in the business opportunities of the Sponsors or any of their officers, directors, agents, stockholders, members, partners, affiliates and subsidiaries (other than our directors that are presented business opportunities in their capacity as our directors) and that they have no obligation to offer us those investments or opportunities; and |
| • | provide that our bylaws can be amended or repealed at any regular or special meeting of stockholders or by the board of directors, including the requirement that any amendment by the stockholders at a meeting, at any time after the Sponsors and their respective affiliates no longer collectively own more than 50% of the outstanding shares of our common stock, be upon the affirmative vote of at least 66 2/3% of the shares of common stock generally entitled to vote in the election of directors. |
Upon the closing of this offering, the Sponsors and their respective affiliates will no longer collectively beneficially own more than 50% of the outstanding shares of our common stock, and the foregoing provisions of our amended and restated certificate of incorporation and our amended and restated bylaws that apply at any time following the Sponsors and their affiliates no longer maintaining such level of collective beneficial ownership will take effect.
Forum Selection
Our amended and restated certificate of incorporation provides that unless we consent in writing to the selection of an alternative forum, the Court of Chancery of the State of Delaware will, to the fullest extent permitted by applicable law, be the sole and exclusive forum for:
| • | any derivative action or proceeding brought on our behalf; |
133
Table of Contents
Index to Financial Statements
| • | any action asserting a claim of breach of a fiduciary duty owed by any of our directors, officers, employees or agents to us or our stockholders; |
| • | any action asserting a claim against us arising pursuant to any provision of the DGCL, our amended and restated certificate of incorporation or our bylaws; or |
| • | any action asserting a claim against us that is governed by the internal affairs doctrine, in each such case subject to such Court of Chancery having personal jurisdiction over the indispensable parties named as defendants therein. |
Our amended and restated certificate of incorporation also provides that any person or entity purchasing or otherwise acquiring any interest in shares of our capital stock will be deemed to have notice of and to have consented to this forum selection provision. However, it is possible that a court could find our forum selection provision to be inapplicable or unenforceable.
Limitation of Liability and Indemnification Matters
Our amended and restated certificate of incorporation limits the liability of our directors for monetary damages for breach of their fiduciary duty as directors, except for liability that cannot be eliminated under the DGCL. Delaware law provides that directors of a company will not be personally liable for monetary damages for breach of their fiduciary duty as directors, except for liabilities:
| • | for any breach of their duty of loyalty to us or our stockholders; |
| • | for acts or omissions not in good faith or which involve intentional misconduct or a knowing violation of law; |
| • | for unlawful payment of dividend or unlawful stock repurchase or redemption, as provided under Section 174 of the DGCL; or |
| • | for any transaction from which the director derived an improper personal benefit. |
Any amendment, repeal or modification of these provisions will be prospective only and would not affect any limitation on liability of a director for acts or omissions that occurred prior to any such amendment, repeal or modification.
Our amended and restated certificate of incorporation and amended and restated bylaws also provide that we will indemnify our directors and officers to the fullest extent permitted by Delaware law. Our amended and restated certificate of incorporation and amended and restated bylaws also permit us to purchase insurance on behalf of any officer, director, employee or other agent for any liability arising out of that person’s actions as our officer, director, employee or agent, regardless of whether Delaware law would permit indemnification. We intend to enter into indemnification agreements with each of our current and future directors and officers. These agreements will require us to indemnify these individuals to the fullest extent permitted under Delaware law against liability that may arise by reason of their service to us, and to advance expenses incurred as a result of any proceeding against them as to which they could be indemnified. We believe that the limitation of liability provision in our amended and restated certificate of incorporation and the indemnification agreements will facilitate our ability to continue to attract and retain qualified individuals to serve as directors and officers.
Transfer Agent and Registrar
The transfer agent and registrar for our common stock is American Stock Transfer & Trust Company, LLC.
Listing
Our common stock is listed on the NYSE under the symbol “RICE.”
134
Table of Contents
Index to Financial Statements
SHARES ELIGIBLE FOR FUTURE SALE
Future sales of our common stock in the public market, or the availability of such shares for sale in the public market, could adversely affect the market price of our common stock prevailing from time to time. Sales of a substantial number of shares of our common stock in the public market after such restrictions lapse, or the perception that those sales may occur, could adversely affect the prevailing market price of our common stock at such time and our ability to raise equity-related capital at a time and price we deem appropriate.
Sales of Restricted Shares
Upon completion of this offering, we will have outstanding an aggregate of 136,154,526 shares of common stock. Of these shares, the shares of common stock sold in our IPO and all of the 20,421,246 shares of common stock to be sold in this offering (or 23,484,433 shares assuming the underwriters exercise the option to purchase additional shares in full) will be freely tradable without restriction or further registration under the Securities Act, unless the shares are held by any of our “affiliates” as such term is defined in Rule 144 under the Securities Act. All remaining shares of common stock will be deemed “restricted securities” as such term is defined under Rule 144. The restricted securities were, or will be, issued and sold by us in private transactions and are eligible for public sale only if registered under the Securities Act or if they qualify for an exemption from registration under Rule 144 or Rule 701 under the Securities Act, which rules are summarized below.
As a result of the lock-up agreements described below and the provisions of Rule 144 and Rule 701 under the Securities Act, the shares of our common stock (excluding the shares to be sold in this offering) that will be available for sale in the public market are as follows:
| • | 53,020,399 shares will be eligible for sale on the date of this prospectus or prior to 90 days after the date of this prospectus; and |
| • | 62,776,467 shares will be eligible for sale upon the expiration of the lock-up agreements beginning 90 days after the date of this prospectus and when permitted under Rule 144 or Rule 701. |
In addition, there are approximately 242,000 shares of our common stock issuable upon the exercise of our outstanding warrants. Such shares will be eligible for sale not earlier than July 29, 2014 and otherwise when permitted under Rule 144.
Lock-up Agreements
We, the Rice Owners, NGP Holdings, Alpha Holdings, all of our directors and executive officers and certain of our employees and other investors have agreed not to sell any common stock or securities convertible into or exchangeable for shares of common stock for a period of 90 days from the date of this prospectus, subject to certain exceptions. See “Underwriting” for a description of these lock-up provisions.
Rule 144
In general, under Rule 144 under the Securities Act as currently in effect, a person (or persons whose shares are aggregated) who is not deemed to have been an affiliate of ours at any time during the three months preceding a sale, and who has beneficially owned restricted securities within the meaning of Rule 144 for a least sixth months (including any period of consecutive ownership of preceding non-affiliated holders) would be entitled to sell those shares, subject only to the availability of current public information about us. A non-affiliated person who has beneficially owned restricted securities within the meaning of Rule 144 for at least one year would be entitled to sell those shares without regard to the provisions of Rule 144.
A person (or persons whose shares are aggregated) who is deemed to be an affiliate of ours and who has beneficially owned restricted securities within the meaning of Rule 144 for at least nine months would be entitled
135
Table of Contents
Index to Financial Statements
to sell within any three-month period a number of shares that does not exceed the greater of one percent of the then outstanding shares of our common stock or the average weekly trading volume of our common stock reported through the NYSE during the four calendar weeks preceding the filing of notice of the sale. Such sales are also subject to certain manner of sale provisions, notice requirements and the availability of current public information about us.
Rule 701
In general, under Rule 701 under the Securities Act, any of our employees, directors, officers, consultants or advisors who purchases shares from us in connection with a compensatory stock or option plan or other written agreement before the effective date of this offering is entitled to sell such shares 90 days after the effective date of this offering in reliance on Rule 144, without having to comply with the holding period requirement of Rule 144 and, in the case of non-affiliates, without having to comply with the public information, volume limitation or notice filing provisions of Rule 144. The SEC has indicated that Rule 701 will apply to typical stock options granted by an issuer before it becomes subject to the reporting requirements of the Exchange Act, along with the shares acquired upon exercise of such options, including exercises after the date of this prospectus.
136
Table of Contents
Index to Financial Statements
MATERIAL U.S. FEDERAL INCOME AND ESTATE TAX CONSIDERATIONS FOR NON-U.S. HOLDERS
The following is a summary of the material U.S. federal income tax and, to a limited extent, estate tax, considerations related to the purchase, ownership and disposition of our common stock by a non-U.S. holder (as defined below), that holds our common stock as a “capital asset” (generally property held for investment). This summary is based on the provisions of the Internal Revenue Code of 1986, as amended (the “Code”), U.S. Treasury regulations and administrative rulings and judicial decisions, all as in effect on the date hereof, and all of which are subject to change, possibly with retroactive effect. We have not sought any ruling from the Internal Revenue Service (“IRS”) with respect to the statements made and the conclusions reached in the following summary, and there can be no assurance that the IRS or a court will agree with such statements and conclusions.
This summary does not address all aspects of U.S. federal income or estate taxation that may be relevant to non-U.S. holders in light of their personal circumstances. In addition, this summary does not address the Medicare tax on certain investment income, U.S. federal gift tax laws, any state, local or foreign tax laws or any tax treaties. This summary also does not address tax considerations applicable to investors that may be subject to special treatment under the U.S. federal income tax laws, such as (without limitation):
| • | banks, insurance companies or other financial institutions; |
| • | tax-exempt or governmental organizations; |
| • | dealers in securities or foreign currencies; |
| • | traders in securities that use the mark-to-market method of accounting for U.S. federal income tax purposes; |
| • | persons subject to the alternative minimum tax; |
| • | partnerships or other pass-through entities for U.S. federal income tax purposes or holders of interests therein; |
| • | persons deemed to sell our common stock under the constructive sale provisions of the Code; |
| • | persons that acquired our common stock through the exercise of employee stock options or otherwise as compensation or through a tax-qualified retirement plan; |
| • | certain former citizens or long-term residents of the United States; |
| • | real estate investment trusts or regulated investment companies; and |
| • | persons that hold our common stock as part of a straddle, appreciated financial position, synthetic security, hedge, conversion transaction or other integrated investment or risk reduction transaction. |
PROSPECTIVE INVESTORS ARE ENCOURAGED TO CONSULT THEIR TAX ADVISOR WITH RESPECT TO THE APPLICATION OF THE U.S. FEDERAL INCOME AND ESTATE TAX LAWS TO THEIR PARTICULAR SITUATION, AS WELL AS ANY TAX CONSEQUENCES OF THE PURCHASE, OWNERSHIP AND DISPOSITION OF OUR COMMON STOCK ARISING UNDER THE U.S. FEDERAL GIFT TAX LAWS OR UNDER THE LAWS OF ANY STATE, LOCAL, NON-U.S. OR OTHER TAXING JURISDICTION OR UNDER ANY APPLICABLE TAX TREATY.
Non-U.S. Holder Defined
For purposes of this discussion, a “non-U.S. holder” is a beneficial owner of our common stock that is not for U.S. federal income tax purposes a partnership or any of the following:
| • | an individual who is a citizen or resident of the United States; |
137
Table of Contents
Index to Financial Statements
| • | a corporation (or other entity treated as a corporation for U.S. federal income tax purposes) created or organized in or under the laws of the United States, any state thereof or the District of Columbia; |
| • | an estate the income of which is subject to U.S. federal income tax regardless of its source; or |
| • | a trust (i) whose administration is subject to the primary supervision of a U.S. court and which has one or more United States persons who have the authority to control all substantial decisions of the trust or (ii) which has made a valid election under applicable U.S. Treasury regulations to be treated as a United States person. |
If a partnership (including an entity treated as a partnership for U.S. federal income tax purposes) holds our common stock, the tax treatment of a partner in the partnership generally will depend upon the status of the partner and upon the activities of the partnership. Accordingly, we urge partners in partnerships (including entities treated as partnerships for U.S. federal income tax purposes) considering the purchase of our common stock to consult their tax advisors regarding the U.S. federal income tax considerations of the purchase, ownership and disposition of our common stock by such partnership.
Distributions
As described in the section entitled “Dividend Policy,” we do not plan to make any distributions on our common stock for the foreseeable future. However, if we do make distributions of cash or property on our common stock, those distributions will constitute dividends for U.S. federal income tax purposes to the extent paid from our current or accumulated earnings and profits, as determined under U.S. federal income tax principles. To the extent those distributions exceed our current and accumulated earnings and profits, the distributions will be treated as a non-taxable return of capital to the extent of the non-U.S. holder’s tax basis in our common stock and thereafter as capital gain from the sale or exchange of such common stock. See “—Gain on Disposition of Common Stock.” Any distribution made to a non-U.S. holder on our common stock generally will be subject to U.S. withholding tax at a rate of 30% of the gross amount of the distribution unless an applicable income tax treaty provides for a lower rate. To receive the benefit of a reduced treaty rate, a non-U.S. holder must provide the applicable withholding agent with an IRS Form W-8BEN or IRS form W-8BEN-E (or other applicable or successor form) certifying qualification for the reduced rate.
Dividends paid to a non-U.S. holder that are effectively connected with a trade or business conducted by the non-U.S. holder in the United States (and, if required by an applicable income tax treaty, are treated as attributable to a permanent establishment maintained by the non-U.S. holder in the United States) generally will be taxed on a net income basis at the rates and in the manner generally applicable to United States persons (as defined under the Code). Such effectively connected dividends will not be subject to U.S. withholding tax if the non-U.S. holder satisfies certain certification requirements by providing the applicable withholding agent a properly executed IRS Form W-8ECI certifying eligibility for exemption. If the non-U.S. holder is a foreign corporation, it may also be subject to a branch profits tax (at a 30% rate or such lower rate specified by an applicable income tax treaty) on its effectively connected earnings and profits (as adjusted for certain items).
Gain on Disposition of Common Stock
A non-U.S. holder generally will not be subject to U.S. federal income tax on any gain realized upon the sale or other disposition of our common stock unless:
| • | the non-U.S. holder is an individual who is present in the United States for a period or periods aggregating 183 days or more during the calendar year in which the sale or disposition occurs and certain other conditions are met; |
| • | the gain is effectively connected with a trade or business conducted by the non-U.S. holder in the United States (and, if required by an applicable tax treaty, is attributable to a permanent establishment maintained by the non-U.S. holder in the United States); or |
138
Table of Contents
Index to Financial Statements
| • | our common stock constitutes a U.S. real property interest by reason of our status as a United States real property holding corporation (“USRPHC”) for U.S. federal income tax purposes. |
A non-U.S. holder described in the first bullet point above will be subject to U.S. federal income tax at a rate of 30% (or such lower rate specified by an applicable income tax treaty) on the amount of such gain, which generally may be offset by U.S. source capital losses.
A non-U.S. holder whose gain is described in the second bullet point above generally will be taxed on a net income basis at the rates and in the manner generally applicable to United States persons (as defined under the Code) unless an applicable income tax treaty provides otherwise. If the non-U.S. holder is a corporation, it may also be subject to a branch profits tax (at a 30% rate or such lower rate specified by an applicable income tax treaty) on its effectively connected earnings and profits (as adjusted for certain items) which will include such gain.
Generally, a corporation is a USRPHC if the fair market value of its U.S. real property interests equals or exceeds 50% of the sum of the fair market value of its worldwide real property interests and its other assets used or held for use in a trade or business. We believe that we currently are, and expect to remain for the foreseeable future, a USRPHC for U.S. federal income tax purposes. However, as long as our common stock continues to be regularly traded on an established securities market, only a non-U.S. holder that actually or constructively owns or owned at any time during the shorter of the five-year period ending on the date of the disposition or the non-U.S. holder’s holding period for the common stock, more than 5% of our common stock will be taxable on gain recognized on the disposition of our common stock as a result of our status as a USRPHC. If our common stock ceased to be regularly traded on an established securities market prior to the beginning of the calendar year in which the relevant disposition occurred, all non-U.S. holders generally would be subject to U.S. federal income tax on a taxable disposition of our common stock, and a 10% U.S. withholding tax would apply to the gross proceeds from the sale of our common stock by such non-U.S. holders.
Non-U.S. holders should consult their tax advisors with respect to the application of the foregoing rules to their ownership and disposition of our common stock.
U.S. Federal Estate Tax
Our common stock beneficially owned or treated as owned by an individual who is not a citizen or resident of the United States (as defined for U.S. federal estate tax purposes) at the time of death generally will be includable in the decedent’s gross estate for U.S. federal estate tax purposes and thus may be subject to U.S. federal estate tax, unless an applicable estate tax treaty provides otherwise.
Backup Withholding and Information Reporting
Any dividends paid to a non-U.S. holder must be reported annually to the IRS and to the non-U.S. holder. Copies of these information returns may be made available to the tax authorities in the country in which the non-U.S. holder resides or is established. Payments of dividends to a non-U.S. holder generally will not be subject to backup withholding if the non-U.S. holder establishes an exemption by properly certifying its non-U.S. status on an IRS Form W-8BEN, IRS Form W-8BEN-E or other appropriate version of IRS Form W-8.
Payments of the proceeds from a sale or other disposition by a non-U.S. holder of our common stock effected by or through a U.S. office of a broker generally will be subject to information reporting and backup withholding (at the applicable rate) unless the non-U.S. holder establishes an exemption by properly certifying its non-U.S. status on an IRS Form W-8BEN, IRS Form W-8BEN-E or other appropriate version of IRS Form W-8 and certain other conditions are met. Information reporting and backup withholding generally will not apply to any payment of the proceeds from a sale or other disposition of our common stock effected outside the United States by a foreign office of a broker. However, unless such broker has documentary evidence in its records that the holder is not a United States person and certain other conditions are met, or the non-U.S. holder otherwise establishes an exemption, information reporting will apply to a payment of the proceeds of the disposition of our common stock effected outside the United States by such a broker if it has certain relationships within the United States.
139
Table of Contents
Index to Financial Statements
Backup withholding is not an additional tax. Rather, the U.S. income tax liability (if any) of persons subject to backup withholding will be reduced by the amount of tax withheld. If withholding results in an overpayment of taxes, a refund may be obtained, provided that the required information is timely furnished to the IRS.
Additional Withholding Requirements under FACTA
Sections 1471 through 1474 of the Code, and the Treasury regulations and administrative guidance issued thereunder (“FACTA”), impose a 30% withholding tax on any dividends paid on our common stock on or after July 1, 2014 and on the gross proceeds from a disposition of our common stock paid after December 31, 2016, in each case if paid to a “foreign financial institution” or a “non-financial foreign entity” (each as defined in the Code) (including, in some cases, when such foreign financial institution or non-financial foreign entity is acting as an intermediary), unless (i) in the case of a foreign financial institution, such institution enters into an agreement with the U.S. government to withhold on certain payments, and to collect and provide to the U.S. tax authorities substantial information regarding U.S. account holders of such institution (which includes certain equity and debt holders of such institution, as well as certain account holders that are foreign entities with U.S. owners); (ii) in the case of a non-financial foreign entity, such entity certifies that it does not have any “substantial United States owners” (as defined in the Code) or provides the applicable withholding agent with a certification identifying the direct and indirect substantial United States owners of the entity; or (iii) the foreign financial institution or non-financial foreign entity otherwise qualifies for an exemption from these rules. Foreign financial institutions located in jurisdictions that have an intergovernmental agreement with the United States governing these rules may be subject to different rules. Under certain circumstances, a holder might be eligible for refunds or credits of such taxes.
Non-U.S. holders are encouraged to consult their tax advisors regarding the possible implications of these FACTA withholding rules on an investment in our common stock.
THE FOREGOING DISCUSSION IS FOR GENERAL INFORMATION ONLY AND SHOULD NOT BE VIEWED AS TAX ADVICE. INVESTORS CONSIDERING THE PURCHASE OF OUR COMMON STOCK ARE URGED TO CONSULT THEIR OWN TAX ADVISORS REGARDING THE APPLICATION OF THE U.S. FEDERAL INCOME AND ESTATE TAX LAWS TO THEIR PARTICULAR SITUATIONS AND THE APPLICABILITY AND EFFECT OF U.S. FEDERAL GIFT TAX LAWS AND ANY STATE, LOCAL OR FOREIGN TAX LAWS AND TAX TREATIES.
140
Table of Contents
Index to Financial Statements
The company, the selling stockholders and the underwriters named below have entered into an underwriting agreement with respect to the shares being offered. Subject to certain conditions, each underwriter has severally agreed to purchase the number of shares indicated in the following table. Goldman, Sachs & Co. is the representative of the underwriters.
| Underwriters |
Number of Shares |
|||
| Goldman, Sachs & Co. |
||||
| Barclays Capital Inc. |
||||
| Citigroup Global Markets Inc. |
||||
|
|
|
|||
| Total |
20,421,246 | |||
|
|
|
|||
The underwriters are committed to take and pay for all of the shares being offered, if any are taken, other than the shares covered by the option described below unless and until this option is exercised.
The underwriters have an option to buy up to an additional 3,063,187 shares from certain of the selling stockholders to cover sales by the underwriters of a greater number of shares than the total number set forth in the table above. They may exercise that option for 30 days. If any shares are purchased pursuant to this option, the underwriters will severally purchase shares in approximately the same proportion as set forth in the table above.
The following tables show the per share and total underwriting discounts and commissions to be paid to the underwriters by the company and selling stockholders. Such amounts are shown assuming both no exercise and full exercise of the underwriters’ option to purchase 3,063,187 additional shares.
Paid by the Company
| No Exercise |
Full Exercise |
|||||||
| Per Share |
$ | $ | ||||||
| Total |
$ | $ | ||||||
Paid by the Selling Stockholders
| No Exercise |
Full Exercise |
|||||||
| Per Share |
$ | $ | ||||||
| Total |
$ | $ | ||||||
Shares sold by the underwriters to the public will initially be offered at the initial public offering price set forth on the cover of this prospectus. Any shares sold by the underwriters to securities dealers may be sold at a discount of up to $ per share from the initial public offering price. After the initial offering of the shares, the representative may change the offering price and the other selling terms. The offering of the shares by the underwriters is subject to receipt and acceptance and subject to the underwriters’ right to reject any order in whole or in part.
The company and the selling stockholders and other parties have agreed with the underwriters, subject to certain exceptions, not to dispose of or hedge any of their common stock or securities convertible into or exchangeable for shares of common stock during the period from the date of this prospectus continuing through the date 90 days after the date of this prospectus, except with the prior written consent of the representative.
141
Table of Contents
Index to Financial Statements
This agreement does not apply to any existing employee benefit plans. See “Shares Available for Future Sale” for a discussion of certain transfer restrictions.
In connection with this offering, the underwriters may purchase and sell shares of common stock in the open market. These transactions may include short sales, stabilizing transactions and purchases to cover positions created by short sales. Short sales involve the sale by the underwriters of a greater number of shares than they are required to purchase in the offering, and a short position represents the amount of such sales that have not been covered by subsequent purchases. A “covered short position” is a short position that is not greater than the amount of additional shares for which the underwriters’ option described above may be exercised. The underwriters may cover any covered short position by either exercising their option to purchase additional shares or purchasing shares in the open market. In determining the source of shares to cover the covered short position, the underwriters will consider, among other things, the price of shares available for purchase in the open market as compared to the price at which they may purchase additional shares pursuant to the option described above. “Naked” short sales are any short sales that create a short position greater than the amount of additional shares for which the option described above may be exercised. The underwriters must cover any such naked short position by purchasing shares in the open market. A naked short position is more likely to be created if the underwriters are concerned that there may be downward pressure on the price of the common stock in the open market after pricing that could adversely affect investors who purchase in the offering. Stabilizing transactions consist of various bids for or purchases of common stock made by the underwriters in the open market prior to the completion of the offering.
The underwriters may also impose a penalty bid. This occurs when a particular underwriter repays to the underwriters a portion of the underwriting discount received by it because the representative has repurchased shares sold by or for the account of such underwriter in stabilizing or short covering transactions.
Purchases to cover a short position and stabilizing transactions, as well as other purchases by the underwriters for their own accounts, may have the effect of preventing or retarding a decline in the market price of the company’s stock, and together with the imposition of the penalty bid, may stabilize, maintain or otherwise affect the market price of the common stock. As a result, the price of the common stock may be higher than the price that otherwise might exist in the open market. The underwriters are not required to engage in these activities and may end any of these activities at any time. These transactions may be effected on NYSE, in the over-the-counter market or otherwise.
The company may enter into derivative transactions with third parties, or sell securities not covered by this prospectus to third parties in privately negotiated transactions. In connection with those derivatives, the third parties may sell securities covered by this prospectus, including in short sale transactions. If so, the third party may use securities pledged by the company or borrowed from the company or others to settle those sales or to close out any related open borrowings of stock, and may use securities received from the company in settlement of those derivatives to close out any related open borrowings of stock. The third party in such sale transactions will be an underwriter or will be identified in a post-effective amendment.
European Economic Area
In relation to each Member State of the European Economic Area which has implemented the Prospectus Directive (each, a Relevant Member State), each underwriter has represented and agreed that with effect from and including the date on which the Prospectus Directive is implemented in that Relevant Member State (the Relevant Implementation Date) it has not made and will not make an offer of shares to the public in that Relevant Member State prior to the publication of a prospectus in relation to the shares which has been approved by the competent authority in that Relevant Member State or, where appropriate, approved in another Relevant Member State and notified to the competent authority in that Relevant Member State, all in accordance with the
142
Table of Contents
Index to Financial Statements
Prospectus Directive, except that it may, with effect from and including the Relevant Implementation Date, make an offer of shares to the public in that Relevant Member State at any time:
(a) to legal entities which are authorised or regulated to operate in the financial markets or, if not so authorised or regulated, whose corporate purpose is solely to invest in securities;
(b) to any legal entity which has two or more of (1) an average of at least 250 employees during the last financial year; (2) a total balance sheet of more than €43,000,000 and (3) an annual net turnover of more than €50,000,000, as shown in its last annual or consolidated accounts;
(c) to fewer than 100 natural or legal persons (other than qualified investors as defined in the Prospectus Directive) subject to obtaining the prior consent of the representative for any such offer; or
(d) in any other circumstances which do not require the publication by the Issuer of a prospectus pursuant to Article 3 of the Prospectus Directive.
For the purposes of this provision, the expression an “offer of shares to the public” in relation to any shares in any Relevant Member State means the communication in any form and by any means of sufficient information on the terms of the offer and the shares to be offered so as to enable an investor to decide to purchase or subscribe for the shares, as the same may be varied in that Relevant Member State by any measure implementing the Prospectus Directive in that Relevant Member State and the expression Prospectus Directive means Directive 2003/71/EC and includes any relevant implementing measure in each Relevant Member State.
United Kingdom
Each underwriter has represented and agreed that:
| (a) | it has only communicated or caused to be communicated and will only communicate or cause to be communicated an invitation or inducement to engage in investment activity (within the meaning of Section 21 of the Financial Services and Markets Act 2000 (the “FSMA”)) received by it in connection with the issue or sale of the shares in circumstances in which Section 21(1) of the FSMA does not apply to the Issuer; and |
| (b) | it has complied and will comply with all applicable provisions of the FSMA with respect to anything done by it in relation to the shares in, from or otherwise involving the United Kingdom. |
Hong Kong
The shares may not be offered or sold by means of any document other than (i) in circumstances which do not constitute an offer to the public within the meaning of the Companies Ordinance (Cap.32, Laws of Hong Kong), (ii) to “professional investors” within the meaning of the Securities and Futures Ordinance (Cap.571, Laws of Hong Kong) and any rules made thereunder, or (iii) in other circumstances which do not result in the document being a “prospectus” within the meaning of the Companies Ordinance (Cap.32, Laws of Hong Kong), and no advertisement, invitation or document relating to the shares may be issued or may be in the possession of any person for the purpose of issue (in each case whether in Hong Kong or elsewhere), which is directed at, or the contents of which are likely to be accessed or read by, the public in Hong Kong (except if permitted to do so under the laws of Hong Kong) other than with respect to shares which are or are intended to be disposed of only to persons outside Hong Kong or only to “professional investors” within the meaning of the Securities and Futures Ordinance (Cap. 571, Laws of Hong Kong) and any rules made thereunder.
Singapore
This prospectus has not been registered as a prospectus with the Monetary Authority of Singapore. Accordingly, this prospectus and any other document or material in connection with the offer or sale, or invitation for subscription or purchase, of the shares may not be circulated or distributed, nor may the shares be
143
Table of Contents
Index to Financial Statements
offered or sold, or be made the subject of an invitation for subscription or purchase, whether directly or indirectly, to persons in Singapore other than (i) to an institutional investor under Section 274 of the Securities and Futures Act, Chapter 289 of Singapore (the “SFA”), (ii) to a relevant person, or any person pursuant to Section 275(1A), and in accordance with the conditions, specified in Section 275 of the SFA or (iii) otherwise pursuant to, and in accordance with the conditions of, any other applicable provision of the SFA.
Where the shares are subscribed or purchased under Section 275 by a relevant person which is: (a) a corporation (which is not an accredited investor) the sole business of which is to hold investments and the entire share capital of which is owned by one or more individuals, each of whom is an accredited investor; or (b) a trust (where the trustee is not an accredited investor) whose sole purpose is to hold investments and each beneficiary is an accredited investor, shares, debentures and units of shares and debentures of that corporation or the beneficiaries’ rights and interest in that trust shall not be transferable for 6 months after that corporation or that trust has acquired the shares under Section 275 except: (1) to an institutional investor under Section 274 of the SFA or to a relevant person, or any person pursuant to Section 275(1A), and in accordance with the conditions, specified in Section 275 of the SFA; (2) where no consideration is given for the transfer; or (3) by operation of law.
Japan
The securities have not been and will not be registered under the Financial Instruments and Exchange Law of Japan (the Financial Instruments and Exchange Law) and each underwriter has agreed that it will not offer or sell any securities, directly or indirectly, in Japan or to, or for the benefit of, any resident of Japan (which term as used herein means any person resident in Japan, including any corporation or other entity organized under the laws of Japan), or to others for re-offering or resale, directly or indirectly, in Japan or to a resident of Japan, except pursuant to an exemption from the registration requirements of, and otherwise in compliance with, the Financial Instruments and Exchange Law and any other applicable laws, regulations and ministerial guidelines of Japan.
The company and the selling stockholders estimate that their share of the total expenses of the offering, excluding underwriting discounts and commissions, will be approximately $ .
The company and the selling stockholders have agreed to indemnify the several underwriters against certain liabilities, including liabilities under the Securities Act of 1933.
The underwriters and their respective affiliates are full service financial institutions engaged in various activities, which may include sales and trading, commercial and investment banking, advisory, investment management, investment research, principal investment, hedging, market making, brokerage and other financial and non-financial activities and services. Certain of the underwriters and their respective affiliates have provided, and may in the future provide, a variety of these services to the issuer and to persons and entities with relationships with the issuer, for which they received or will receive customary fees and expenses.
In the ordinary course of their various business activities, the underwriters and their respective affiliates, officers, directors and employees may purchase, sell or hold a broad array of investments and actively trade securities, derivatives, loans, commodities, currencies, credit default swaps and other financial instruments for their own account and for the accounts of their customers, and such investment and trading activities may involve or relate to assets, securities and/or instruments of the issuer (directly, as collateral securing other obligations or otherwise) and/or persons and entities with relationships with the issuer. The underwriters and their respective affiliates may also communicate independent investment recommendations, market color or trading ideas and/or publish or express independent research views in respect of such assets, securities or instruments and may at any time hold, or recommend to clients that they should acquire, long and/or short positions in such assets, securities and instruments. In addition, affiliates of certain of the underwriters are lenders under our Third Amended and Restated Credit Agreement and/or holders of our Notes. Certain of the underwriters or their affiliates were also
144
Table of Contents
Index to Financial Statements
underwriters in connection with our IPO and were initial purchasers in our Senior Notes Offering and received customary fees and reimbursement of expenses. In addition, an affiliate of Barclays Capital Inc. is a limited partner in the general partner of each of Natural Gas Partners IX, L.P. and NGP Natural Resources X, L.P., which are both members of the selling stockholder, NGP Holdings, and such affiliate may receive a portion of the net proceeds to NGP Holdings from this offering.
145
Table of Contents
Index to Financial Statements
The validity of our common stock offered by this prospectus will be passed upon for us by Vinson & Elkins L.L.P., Houston, Texas. Certain legal matters in connection with this offering will be passed upon for the underwriters by Baker Botts L.L.P., Houston, Texas.
The consolidated financial statements of Rice Drilling B LLC as of December 31, 2013 and 2012 and for each of the two years in the period ended December 31, 2013, appearing in this prospectus have been audited by Ernst & Young LLP, an independent registered public accounting firm, as set forth in their report appearing elsewhere herein, and are included in reliance upon such report given on the authority of such firm as experts in accounting and auditing.
The financial statements of Countrywide Energy Services as of and for the periods ended December 31, 2012 and 2013 have been included in reliance upon the report of Grossman Yanak & Ford LLP, independent auditors, appearing elsewhere herein and upon the authority of said firm as experts in accounting and auditing.
The financial statements of Alpha Shale Resources, LP as of December 31, 2013 and 2012 and for each of the two years in the period ended December 31, 2013, appearing in this prospectus have been audited by Ernst & Young LLP, independent auditors, as set forth in their report appearing elsewhere herein, and are included in reliance upon such report given on the authority of such firm as experts in accounting and auditing.
The financial statements of Alpha Shale Resources, LP as of December 31, 2011 and for the year ended December 31, 2011, appearing in this prospectus have been audited by Schneider Downs & Co., Inc., independent auditors, as set forth in their report thereon appearing elsewhere herein, and are included in reliance upon such report given on the authority of such firm as experts in accounting and auditing.
Estimates of our oil and natural gas reserves, related future net cash flows and the present values thereof related to our properties as of December 31, 2012 and 2013 included elsewhere in this prospectus were based upon reserve reports prepared by independent petroleum engineers, Netherland, Sewell and Associates, Inc. We have included these estimates in reliance on the authority of such firm as an expert in such matters.
Estimates of oil and natural gas reserves, related future net cash flows and the present values thereof related to the properties of Alpha Shale Resources, LP as of December 31, 2012 and 2013 included elsewhere in this prospectus were based upon reserve reports prepared by independent petroleum engineers, Netherland, Sewell and Associates, Inc. We have included these estimates in reliance on the authority of such firm as an expert in such matters.
146
Table of Contents
Index to Financial Statements
WHERE YOU CAN FIND MORE INFORMATION
We have filed with the SEC a registration statement on Form S-1 (including the exhibits, schedules and amendments thereto) under the Securities Act, with respect to the shares of our common stock offered hereby. This prospectus does not contain all of the information set forth in the registration statement and the exhibits and schedules thereto. For further information with respect to the common stock offered hereby, we refer you to the registration statement and the exhibits and schedules filed therewith. Statements contained in this prospectus as to the contents of any contract, agreement or any other document are summaries of the material terms of such contract, agreement or other document and are not necessarily complete. With respect to each of these contracts, agreements or other documents filed as an exhibit to the registration statement, reference is made to the exhibits for a more complete description of the matter involved. A copy of the registration statement, and the exhibits and schedules thereto, may be inspected without charge at the public reference facilities maintained by the SEC at 100 F Street NE, Washington, D.C. 20549. Copies of these materials may be obtained, upon payment of a duplicating fee, from the Public Reference Room of the SEC at 100 F Street NE, Washington, D.C. 20549. Please call the SEC at 1-800-SEC-0330 for further information on the operation of the Public Reference Room. The SEC maintains a website that contains reports, proxy and information statements and other information regarding registrants that file electronically with the SEC. The address of the SEC’s website is www.sec.gov.
We are required to file annual and quarterly reports and other information with the SEC. You may read and copy any materials we file with the SEC at the SEC’s Public Reference Room at 100 F Street, N.E., Room 1580, Washington, D.C., 20549. Please call 1-800-SEC-0330 for further information on the operation of the Public Reference Room. Our filings will also be available to the public from commercial document retrieval services and at the web site maintained by the SEC at http://www.sec.gov. Our reports and other information that we have filed, or may in the future file, with the SEC are not incorporated by reference into and do not constitute part of this prospectus.
147
Table of Contents
Index to Financial Statements
F-1
Table of Contents
Index to Financial Statements
Rice Energy Inc.
Introduction to the Condensed Consolidated Financial Statements
(Unaudited)
The following unaudited condensed consolidated financial statements of Rice Energy Inc. (the “Company,” “we,” “our” or “us”) for the period from January 1, 2014 through January 29, 2014, as contained within the three months ended March 31, 2014; the three months ended March 31, 2013; and as of December 31, 2013, pertain to the historical financial statements and results of operations of Rice Drilling B, our accounting predecessor, which reflects the 50% equity investment in our Marcellus joint venture owned by Rice Drilling B prior to January 29, 2014.
The unaudited condensed consolidated financial statements have been prepared on the fact that Rice Energy Inc. is treated as a corporation for federal income tax purposes. The unaudited condensed consolidated financial statements should be read in conjunction with the notes accompanying such unaudited condensed consolidated financial statements as well as “Management’s Discussion and Analysis of Financial Condition and Results of Operations,” each included elsewhere in this prospectus. Please see “—Notes to Condensed Consolidated Financial Statements (Unaudited)—5. Acquisitions” for further details on the purchase price allocations and resulting impact on the corresponding condensed consolidated balance sheet and for the related pro forma information.
The unaudited condensed consolidated financial statements as of and for the three months ended March 31, 2014 reflect the following transactions:
Initial Public Offering
On January 29, 2014, we completed our initial public offering (“IPO”) of 50,000,000 shares of our $0.01 par value common stock, which included 30,000,000 shares sold by us, 14,000,000 shares sold by the selling stockholder and 6,000,000 shares sold subject to an option granted to the underwriters by the selling stockholder.
The net proceeds of our IPO, based on the public offering price of $21.00 per share, were approximately $993.5 million, which resulted in net proceeds to us of $593.6 million after deducting expenses and underwriting discounts and commissions of approximately $36.4 million and the net proceeds to the selling stockholder of approximately $399.0 million after deducting expenses and underwriting discounts of approximately $21.0 million. We did not receive any proceeds from the sale of the shares by the selling stockholder. A portion of the net proceeds from our IPO were used to repay all outstanding borrowings under the revolving credit facility of our Marcellus joint venture, to make a $100.0 million payment to Alpha Holdings in partial consideration for the Marcellus JV Buy-In (as defined below) and to repay all outstanding borrowings under our Senior Secured Revolving Credit Facility (as defined below). The remainder of the net proceeds from our IPO will be used to fund a portion of our capital expenditure plan.
Corporate Reorganization
A corporate reorganization occurred concurrently with the completion of our IPO on January 29, 2014. As a part of this corporate reorganization, we acquired all of the outstanding membership interests in Rice Appalachia in exchange for shares of our common stock. Our business continues to be conducted through Rice Drilling B, as a wholly owned subsidiary.
Upon (a) completion of the IPO, (b) the issuance of (i) 43,452,550 shares of common stock to NGP Holdings, (ii) 20,300,923 shares of common stock to Rice Holdings, (iii) 2,356,844 shares of common stock to Daniel J. Rice III, (iv) 20,000,000 shares of common stock to Rice Partners, (v) 160,831 shares of common stock to the persons holding incentive units representing interests in Rice Appalachia and (vi) 1,728,852 shares of common stock to the members of Rice Drilling B (other than Rice Appalachia), each of which were issued by us in connection with the closing of the IPO, and (c) the issuance of 9,523,810 shares of common stock to Alpha Holdings in connection with the completion of the Marcellus JV Buy-In, we had 127,523,810 shares of common stock outstanding.
F-2
Table of Contents
Index to Financial Statements
Compensation Charge in Connection with the Reorganization
Rice Appalachia, as the parent company of Rice Drilling B, historically granted incentive units to certain members of management and other employees. The incentive units provided the holder with a performance bonus for fair value accretion of Rice Appalachia equity.
In connection with the IPO and the related corporate reorganization, the holders of incentive units in Rice Appalachia contributed their incentive units to Rice Holdings and NGP Holdings in return for substantially similar incentive units in such entities (except for those related to the incentive units attributable to Mr. Daniel J. Rice III, which were settled with the issuance of 160,831 shares of our common stock as described above). In the first quarter of 2014, certain incentive units granted by NGP Holdings to certain employees triggered the pre-determined payout criteria, resulting in a cash payment by NGP Holdings of $4.4 million. No payments were made in respect of incentive units prior to the completion of the Company’s IPO. The exchange of incentive units and cash payment collectively resulted in non-cash compensation expense of $7.8 million being recorded in the first quarter of 2014 by the Company.
As a result of the IPO, the payment likelihood related to the incentive units was deemed probable, requiring that we recognize expense. Accordingly, we recognized approximately $66.0 million of compensation expense in the first quarter of 2014 relative to these interests, and we expect to recognize approximately $85.5 million of additional compensation expense over the remaining expected service periods, related to the Rice Holdings interests. The NGP Holdings interests are considered a liability-based award and will be adjusted on a quarterly basis until all payments have been made. As of March 31, 2014, the unrecognized compensation expense related to the NGP Holdings units is approximately $93.7 million, which will be recognized over the remaining expected service period. The compensation expense related to these interests is treated as additional paid in capital from Rice Holdings and NGP Holdings in our financial statements and is not deductible for federal or state income tax purposes. The compensation expense recognized is a non-cash charge, with the settlement obligation resting on NGP Holdings and Rice Holdings. Payments on the incentive units will be made by Rice Holdings and NGP Holdings and not Rice Energy Inc., and as such are not dilutive to Rice Energy Inc.
Marcellus JV Buy-In
On January 29, 2014, in connection with the closing of the IPO and pursuant to the Transaction Agreement between us and Alpha Holdings dated as of December 6, 2013, we completed our acquisition of Alpha Holdings’ 50% interest in our Marcellus joint venture in exchange for total consideration of $322.0 million, consisting of $100.0 million of cash and our issuance to Alpha Holdings of 9,523,810 shares of our common stock (the “Marcellus JV Buy-In”). This transaction resulted in a non-recurring gain of $203.6 million due to the remeasurement of our previously recorded equity investment at fair value.
F-3
Table of Contents
Index to Financial Statements
Rice Energy Inc.
Condensed Consolidated Balance Sheets
(Unaudited)
| March 31, 2014 |
December 31, 2013 |
|||||||
| (in thousands) | ||||||||
| Assets |
||||||||
| Current assets: |
||||||||
| Cash |
$ | 228,669 | $ | 31,612 | ||||
| Restricted cash |
— | 8,268 | ||||||
| Accounts receivable |
68,216 | 31,765 | ||||||
| Receivable from affiliate |
159 | 2,244 | ||||||
| Prepaid expenses and other |
5,916 | 863 | ||||||
|
|
|
|
|
|||||
| Total current assets |
302,960 | 74,752 | ||||||
| Investments in joint ventures |
— | 49,814 | ||||||
| Gas collateral account |
3,995 | 3,700 | ||||||
| Proved natural gas properties, net |
589,986 | 270,523 | ||||||
| Unproved natural gas properties |
632,119 | 457,836 | ||||||
| Property and equipment, net |
7,125 | 5,972 | ||||||
| Deferred financing costs, net |
8,796 | 12,292 | ||||||
| Goodwill |
338,036 | — | ||||||
| Derivative assets |
5,726 | 4,921 | ||||||
|
|
|
|
|
|||||
| Total assets |
$ | 1,888,743 | $ | 879,810 | ||||
|
|
|
|
|
|||||
| Liabilities and stockholders’/members’ equity |
||||||||
| Current liabilities: |
||||||||
| Current portion of long-term debt |
$ | 13,086 | $ | 20,120 | ||||
| Accounts payable |
72,456 | 51,219 | ||||||
| Royalties payable |
33,499 | 9,393 | ||||||
| Accrued capital expenditures |
39,628 | 16,753 | ||||||
| Other accrued liabilities |
12,937 | 8,533 | ||||||
| Leasehold payable |
6,144 | 18,606 | ||||||
| Derivative liabilities |
23,987 | 965 | ||||||
| Payable to affiliate |
2 | 6,148 | ||||||
| Operated prepayment liability |
2,456 | 1,201 | ||||||
|
|
|
|
|
|||||
| Total current liabilities |
204,195 | 132,938 | ||||||
| Long-term liabilities: |
||||||||
| Long-term debt |
290,841 | 406,822 | ||||||
| Leasehold payable |
1,064 | 1,675 | ||||||
| Deferred tax liabilities |
191,813 | — | ||||||
| Restricted units |
— | 36,306 | ||||||
| Other long-term liabilities |
4,969 | 3,422 | ||||||
|
|
|
|
|
|||||
| Total liabilities |
692,882 | 581,163 | ||||||
| Stockholders’/members’ equity |
1,195,861 | 298,647 | ||||||
|
|
|
|
|
|||||
| Total liabilities and stockholders’/members’ equity |
$ | 1,888,743 | $ | 879,810 | ||||
|
|
|
|
|
|||||
The accompanying notes are an integral part of these Condensed Consolidated Financial Statements.
F-4
Table of Contents
Index to Financial Statements
Rice Energy Inc.
Condensed Consolidated Statements of Operations
(Unaudited)
| Three Months Ended March 31, |
||||||||
| 2014 | 2013 | |||||||
| (in thousands, except per share data) |
||||||||
| Revenues: |
||||||||
| Natural gas sales |
$ | 90,466 | $ | 13,049 | ||||
| Other revenue |
— | 184 | ||||||
|
|
|
|
|
|||||
| Total revenues |
90,466 | 13,233 | ||||||
| Operating expenses: |
||||||||
| Lease operating |
5,187 | 1,236 | ||||||
| Gathering, compression and transportation |
7,130 | 1,528 | ||||||
| Production taxes and impact fees |
639 | 169 | ||||||
| Exploration |
486 | 898 | ||||||
| Incentive unit expense |
73,802 | — | ||||||
| General and administrative |
11,521 | 1,743 | ||||||
| Depreciation, depletion and amortization |
25,507 | 5,131 | ||||||
|
|
|
|
|
|||||
| Total operating expenses |
124,272 | 10,705 | ||||||
|
|
|
|
|
|||||
| Operating income (loss) |
(33,806 | ) | 2,528 | |||||
| Interest expense |
(7,042 | ) | (1,915 | ) | ||||
| Gain on purchase of Marcellus joint venture |
203,579 | — | ||||||
| Other income |
602 | 248 | ||||||
| Loss on derivative instruments |
(20,380 | ) | (4,993 | ) | ||||
| Amortization of deferred financing costs |
(489 | ) | (1,865 | ) | ||||
| Loss on extinguishment of debt |
(143 | ) | — | |||||
| Write-off of deferred financing costs |
(836 | ) | — | |||||
| Equity in loss of joint ventures |
(2,656 | ) | (778 | ) | ||||
|
|
|
|
|
|||||
| Income (loss) before income taxes |
138,829 | (6,775 | ) | |||||
| Income tax expense |
(9,375 | ) | — | |||||
|
|
|
|
|
|||||
| Net income (loss) |
$ | 129,454 | $ | (6,775 | ) | |||
|
|
|
|
|
|||||
| Earnings (loss) per share—basic |
$ | 1.04 | $ | (0.05 | ) | |||
| Earnings (loss) per share—diluted |
$ | 1.03 | $ | (0.05 | ) | |||
The accompanying notes are an integral part of these Condensed Consolidated Financial Statements.
F-5
Table of Contents
Index to Financial Statements
Rice Energy Inc.
Condensed Consolidated Statements of Cash Flows
(Unaudited)
| Three Months Ended March 31, |
||||||||
| 2014 | 2013 | |||||||
| (in thousands) | ||||||||
| Cash flows from operating activities: |
||||||||
| Net income (loss) |
$ | 129,454 | $ | (6,775 | ) | |||
| Adjustments to reconcile net income (loss) to net cash provided by operating activities: |
||||||||
| Depreciation, depletion and amortization |
25,507 | 5,131 | ||||||
| Amortization of deferred financing costs |
489 | 1,865 | ||||||
| Incentive unit expense |
73,802 | — | ||||||
| Write-off of deferred financing costs |
836 | — | ||||||
| Loss on extinguishment of debt |
143 | — | ||||||
| Derivative instruments fair value loss |
20,380 | 4,993 | ||||||
| Income tax expense |
9,375 | — | ||||||
| Fair value gain on purchase of Marcellus joint venture |
(203,579 | ) | — | |||||
| Equity in loss of joint ventures |
2,656 | 778 | ||||||
| (Increase) decrease in: |
||||||||
| Accounts receivable |
(21,059 | ) | (52 | ) | ||||
| Receivable from affiliate |
2,096 | 7,025 | ||||||
| Gas collateral account |
— | (1,500 | ) | |||||
| Prepaid expenses and other |
(4,963 | ) | (378 | ) | ||||
| Cash payments for settled derivatives |
(11,158 | ) | (206 | ) | ||||
| Increase (decrease) in: |
||||||||
| Accounts payable |
(860 | ) | 453 | |||||
| Royalties payable |
16,197 | 1,178 | ||||||
| Other accrued expenses |
5,871 | (970 | ) | |||||
| Payable to affiliate |
(9,643 | ) | (1,977 | ) | ||||
|
|
|
|
|
|||||
| Net cash provided by operating activities |
35,544 | 9,565 | ||||||
|
|
|
|
|
|||||
| Cash flows from investing activities: |
||||||||
| Capital expenditures for natural gas properties |
(178,445 | ) | (27,583 | ) | ||||
| Acquisition of Marcellus joint venture, net of cash acquired |
(82,766 | ) | — | |||||
| Capital expenditures for property and equipment |
(1,342 | ) | (40 | ) | ||||
| Proceeds from sale of interest in gas properties |
11,263 | — | ||||||
|
|
|
|
|
|||||
| Net cash used in investing activities |
(251,290 | ) | (27,623 | ) | ||||
|
|
|
|
|
|||||
| Cash flows from financing activities: |
||||||||
| Proceeds from borrowings |
— | 25,000 | ||||||
| Repayments of debt obligations |
(192,114 | ) | (193 | ) | ||||
| Restricted cash for convertible debt |
8,268 | |||||||
| Debt issuance costs |
(446 | ) | (607 | ) | ||||
| Repurchase of restricted units |
— | (2,267 | ) | |||||
| Costs relating to initial public offering |
(1,405 | ) | ||||||
| Proceeds from issuance of common stock sold in initial public offering, net of underwriting fees |
598,500 | — | ||||||
|
|
|
|
|
|||||
| Net cash provided by financing activities |
412,803 | 21,933 | ||||||
|
|
|
|
|
|||||
| Net increase in cash |
197,057 | 3,875 | ||||||
| Cash at the beginning of the year |
31,612 | 8,547 | ||||||
|
|
|
|
|
|||||
| Cash at the end of the year |
$ | 228,669 | $ | 12,422 | ||||
|
|
|
|
|
|||||
The accompanying notes are an integral part of these Condensed Consolidated Financial Statements.
F-6
Table of Contents
Index to Financial Statements
Rice Energy Inc.
Statements of Condensed Consolidated Equity
(Unaudited)
| Preferred Units |
Warrants | Accumulated Deficit |
Total | |||||||||||||
| (in thousands) | ||||||||||||||||
| Balance, January 1, 2013 |
$ | 164,228 | $ | 3,294 | $ | (29,331 | ) | $ | 138,191 | |||||||
| Capital contributions, net |
64 | — | — | 64 | ||||||||||||
| Net loss |
— | — | (6,775 | ) | (6,775 | ) | ||||||||||
|
|
|
|
|
|
|
|
|
|||||||||
| Balance, March 31, 2013 |
$ | 164,292 | $ | 3,294 | $ | (36,106 | ) | $ | 131,480 | |||||||
|
|
|
|
|
|
|
|
|
|||||||||
| Preferred Units |
Warrants | Common Stock ($0.01 par) |
Additional Paid-In Capital |
Accumulated (Deficit) Earnings |
Total | |||||||||||||||||||
| (in thousands) | ||||||||||||||||||||||||
| Balance, January 1, 2014 |
$ | 360,461 | $ | 3,294 | $ | — | $ | — | $ | (65,108 | ) | $ | 298,647 | |||||||||||
| Shares of common stock issued in corporate reorganization |
(360,461 | ) | (3,294 | ) | 878 | 362,877 | ||||||||||||||||||
| Shares of common stock sold in initial public offering, net of offering costs |
— | — | 300 | 593,120 | — | 593,420 | ||||||||||||||||||
| Shares of common stock issued in purchase of Marcellus joint venture |
— | — | 95 | 221,905 | — | 222,000 | ||||||||||||||||||
| Conversion of restricted units into shares of common stock at IPO |
— | — | 2 | 36,304 | — | 36,306 | ||||||||||||||||||
| Conversion of convertible debentures into shares of common stock after IPO |
— | — | 6 | 6,599 | — | 6,605 | ||||||||||||||||||
| Conversion of warrants into shares of common stock after IPO |
— | — | 1 | 39 | — | 40 | ||||||||||||||||||
| Incentive unit compensation |
— | — | — | 73,802 | — | 73,802 | ||||||||||||||||||
| Restricted stock compensation |
— | — | — | 91 | — | 91 | ||||||||||||||||||
| Tax impact of initial public offering and corporate reorganization |
— | — | — | (164,504 | ) | — | (164,504 | ) | ||||||||||||||||
| Consolidated net income |
— | — | — | — | 129,454 | 129,454 | ||||||||||||||||||
|
|
|
|
|
|
|
|
|
|
|
|
|
|||||||||||||
| Balance, March 31, 2014 |
$ | — | $ | — | $ | 1,282 | $ | 1,130,233 | $ | 64,346 | $ | 1,195,861 | ||||||||||||
|
|
|
|
|
|
|
|
|
|
|
|
|
|||||||||||||
The accompanying notes are an integral part of these Condensed Consolidated Financial Statements.
F-7
Table of Contents
Index to Financial Statements
Rice Energy Inc.
Notes to Condensed Consolidated Financial Statements
(Unaudited)
| 1. | Basis of Presentation |
The accompanying unaudited condensed consolidated financial statements of Rice Energy Inc. have been prepared by the Company’s management in accordance with generally accepted accounting principles in the United States (“GAAP”) for interim financial information and applicable rules and regulations promulgated under the Exchange Act. Accordingly, they do not include all of the information and footnotes required by GAAP for annual financial statements. The unaudited condensed consolidated financial statements included herein contain all adjustments which are, in the opinion of management, necessary to present fairly the Company’s financial position as of March 31, 2014 and its condensed consolidated statements of operations for the three months ended March 31, 2014 and 2013 and of cash flows for the three months ended March 31, 2014 and 2013. The condensed consolidated statements of operations for the three months ended March 31, 2014 and 2013 are not necessarily indicative of the results to be expected for future periods. The accompanying unaudited condensed consolidated financial statements of Rice Energy Inc. for the period from January 1, 2014 through January 29, 2014, as contained within the three months ended March 31, 2014; the three months ended March 31, 2013; and as of December 31, 2013, pertain to the historical financial statements and results of operations of Rice Drilling B, our accounting predecessor, which reflects the 50% equity investment in our Marcellus joint venture owned by Rice Drilling B prior to January 29, 2014. These condensed consolidated financial statements should be read in conjunction with the audited consolidated financial statements and notes therein for the year ended December 31, 2013, as filed with the Securities and Exchange Commission by the Company in its 2013 Annual Report.
| 2. | Long-Term Debt |
Long-term debt consists of the following as of March 31, 2014 and December 31, 2013 (in thousands):
| Description |
March 31, 2014 |
December 31, 2013 |
||||||
| Long-term Debt |
||||||||
| Debentures (a) |
$ | — | $ | 6,890 | ||||
| Second Lien Term Loan Facility (b)(1) |
293,280 | 293,821 | ||||||
| NPI Note, due June 2014(2) |
8,286 | 8,028 | ||||||
| Senior Secured Revolving Credit Facility (c) |
— | 115,000 | ||||||
| Other |
2,361 | 3,203 | ||||||
|
|
|
|
|
|||||
| Total debt |
$ | 303,927 | $ | 426,942 | ||||
| Less current portion Long-term debt |
13,086 | 20,120 | ||||||
|
|
|
|
|
|||||
| $ | 290,841 | $ | 406,822 | |||||
|
|
|
|
|
|||||
| (1) | The Second Lien Term Loan Facility was repaid in full and retired in April 2014. |
| (2) | The NPI Note was repaid in full in April 2014. |
Debentures (a)
In June of 2011, Rice Drilling B sold $60.0 million of its 12% Senior Subordinated Convertible Debentures due 2014 (the “Debentures”) in a private placement to certain accredited investors as defined in Rule 501 of Regulation D. The Debentures accrued interest at 12% per year payable monthly in arrears by the 15th day of the month and mature on July 31, 2014 (“Maturity Date”). The Debentures were Rice Drilling B’s unsecured senior obligations and ranked equally with all of Rice Drilling B’s then-current and future senior unsecured indebtedness.
F-8
Table of Contents
Index to Financial Statements
From July 31, 2013 through August 20, 2013 (the “put redemption period”), any holder of Debentures had the right to cause Rice Drilling B to repurchase all or any portion of the Debentures owned by such holder at 100% of the portion of the principal amount of the Debentures as to which the right was being exercised, plus a premium of 20%. During the put redemption period, Rice Drilling B repurchased $53.1 million of outstanding Debentures and paid a put premium of $10.6 million in accordance with the terms of the agreements.
At any time after July 31, 2013 until the Maturity Date, Rice Drilling B had the right to redeem all, but not less than all, of the Debentures on 30 days prior written notice at a redemption price equal to 100% of the principal amount of the Debentures plus a premium of 50%. In connection with the IPO, the Debentures and warrants of Rice Drilling B were amended to become convertible or exercisable for shares of common stock of Rice Energy Inc. On February 28, 2014, Rice Drilling B issued a redemption notice on the remaining Debentures, which set a redemption date of March 28, 2014. Prior to the redemption date, $6.6 million of the Debentures were converted into 570,945 shares of Rice Energy Inc. common stock. The remaining principal balance of $0.3 million was not converted and is recorded as an accrued liability as of March 31, 2014 in the amount of $0.4 million, including the 50% premium of $0.1 million, and will be paid upon request from holders of the remaining Debentures. The premium of $0.1 million was recorded to expense in the three months ended March 31, 2014. As the principal amount of the Debentures outstanding has been reduced to zero, Rice Drilling B is no longer required to maintain restricted cash or comply with the restrictive covenants which apply thereto.
In connection with the convertible debt offering, Rice Drilling B granted warrants that were issued on August 15, 2011, to certain of the broker-dealers involved in the private placement. These warrants are considered to be separate instruments issued solely in lieu of cash compensation for services provided by the broker-dealers. Two separate classes of warrants were issued with the sole difference being the exercise price. At March 31, 2014, 1,137 warrants remain exercisable at a weighted average price of $11.01 per share of Rice Energy Inc. common stock. The 1,137 warrants are exercisable into up to 982,837 shares. During the quarter ended March 31, 2014, warrants were exercised in exchange for 54,032 shares of Rice Energy Inc. common stock.
Second Lien Term Loan Facility (b)
On April 25, 2013, Rice Drilling B entered into a Second Lien Term Loan Facility (“Second Lien Term Loan Facility”) with Barclays Bank PLC, as administrative agent, and a syndicate of lenders in an aggregate principal amount of $300.0 million. Rice Drilling B estimated the discount on issuance of this instrument based upon an estimate of market rates at the inception of the instrument and recorded a discount of $4.5 million. The discount was being amortized over the life of the note using an effective interest rate of 0.284%. As of March 31, 2014, Rice Drilling B had a balance of $293.3 million relating to the Second Lien Term Loan Facility, this included borrowings outstanding of $297.0 million less a discount of $3.7 million. The Second Lien Term Loan Facility was to mature on October 25, 2018. Approximately $7.4 million in fees were capitalized in connection with the Second Lien Term Loan Facility. On April 25, 2014, the Company used a portion of the net proceeds from the Senior Notes Offering to repay and retire the Second Lien Term Loan Facility in the amount of $301.8 million.
Rice Drilling B was in compliance with the covenants and ratios under the Second Lien Term Loan Facility as of March 31, 2014.
Senior Secured Revolving Credit Facility (c)
On April 25, 2013, Rice Drilling B entered into a Senior Secured Revolving Credit Facility (“Senior Secured Revolving Credit Facility”) with Wells Fargo Bank, N.A., as administrative agent, and a syndicate of lenders with a maximum credit amount of $500.0 million and a sublimit for letters of credit of $10.0 million. Concurrently with the closing of Rice Energy’s IPO, on January 29, 2014, Rice Drilling B amended its Senior Secured Revolving Credit Facility to, among other things, allow for the corporate reorganization that was
F-9
Table of Contents
Index to Financial Statements
completed simultaneously with the closing of the IPO, add Rice Energy Inc. as a guarantor, increase the maximum commitment amount to $1.5 billion and lower the interest rate on amounts borrowed under the Senior Secured Revolving Credit Facility. The Company used a portion of the net proceeds of the IPO to repay $115.0 million of borrowings under the Senior Secured Revolving Credit Facility. After giving effect to the amendment, the borrowing base under the Senior Secured Revolving Credit Facility was increased to $350.0 million as a result of the Marcellus JV Buy-In. The amount available to be borrowed under the Senior Secured Revolving Credit Facility is subject to a borrowing base that is redetermined semiannually as of each January 1 and July 1 and depends on the volumes of Rice Drilling B’s proved oil and gas reserves and estimated cash flows from these reserves, its commodity hedge positions, and other factors. The next redetermination is scheduled to occur in May 2014. As of March 31, 2014, the borrowing base was $350.0 million and the sublimit for letters of credit was $100.0 million. Rice Drilling B had no borrowings and approximately $71.3 million in letters of credit outstanding under its Senior Secured Revolving Credit Facility as of March 31, 2014, resulting in availability of $278.7 million.
Eurodollar loans under the Senior Secured Revolving Credit Facility bear interest at a rate per annum equal to LIBOR plus an applicable margin ranging from 150 to 250 basis points, depending on the percentage of borrowing base utilized. Base rate loans bear interest at a rate per annum equal to the greatest of (i) the agent bank’s reference rate, (ii) the federal funds effective rate plus 50 basis points and (iii) the rate for one month Eurodollar loans plus 100 basis points, plus an applicable margin ranging from 50 to 150 basis points, depending on the percentage of borrowing base utilized. Rice Drilling B is subject to the same financial ratios and substantively the same restricted covenants as under the Senior Secured Revolving Credit Facility prior to such amendment. The Senior Secured Revolving Credit Facility will mature upon the earlier of the date that is five years following the closing of the amendment and the date that is 180 days prior to the maturity of the Second Lien Term Loan Facility, if any amounts are outstanding under that facility as of such date.
Concurrently with the Senior Notes Offering (as defined below), the Company, as borrower, and Rice Drilling B, as predecessor borrower, amended and restated its Senior Secured Revolving Credit Facility (“Amended Credit Agreement”) to, among other things, assign all of its rights and obligations under the Senior Secured Revolving Credit Facility to the Company, and the Company assumed all such rights and obligations as borrower under the Amended Credit Agreement. Please see “14. Subsequent Events—Third Amended and Restated Credit Agreement” for additional details on the Amended Credit Agreement.
Rice Drilling B was in compliance with the covenants and ratios under its Senior Secured Revolving Credit Facility as of March 31, 2014.
6.25% Senior Notes Due 2022
On April 25, 2014, the Company offered $900.0 million (the “Senior Notes Offering”) in aggregate principal amount of 6.25% senior notes due 2022 (the “Notes”) in a private placement to eligible purchasers under Rule 144A and Regulation S of the Securities Act, which resulted in net proceeds to it of $882.7 million after deducting estimated expenses and underwriting discounts and commissions of approximately $17.3 million. The Company used $301.8 million of the net proceeds to repay and retire the Second Lien Term Loan Facility, with the remainder expected to be used to fund the Company’s 2014 capital expenditure program.
F-10
Table of Contents
Index to Financial Statements
Expected Aggregate Maturities
Expected aggregate maturities of notes payable as of March 31, 2014 are as follows (in thousands):
| Remainder of Year Ended December 31, 2014(1) |
$ | 13,086 | ||
| Year Ended December 31, 2015 |
2,847 | |||
| Year Ended December 31, 2016 |
2,257 | |||
| Year Ended December 31, 2017 |
2,173 | |||
| Year Ended December 31, 2018 and Beyond(2) |
283,564 | |||
|
|
|
|||
| Total |
$ | 303,927 | ||
|
|
|
| (1) | Includes $8.3 million attributable to the NPI Note, which was repaid in full in April 2014. |
| (2) | Excludes $900.0 million attributable to the Notes issued in the Senior Notes Offering in April 2014. |
Interest paid in cash was $7.0 million and $3.4 million for the three months ended March 31, 2014 and 2013, respectively.
| 3. | Derivative Instruments |
The Company uses derivative commodity instruments that are placed with major financial institutions whose creditworthiness is regularly monitored. Our derivative counterparties share in the Amended Credit Agreement collateral. The Company’s derivative commodity instruments have not been designated as hedges for accounting purposes; therefore, all gains and losses are recognized in income currently. As of March 31, 2014, the Company has entered into derivative instruments with Wells Fargo Bank, N.A., Bank of Montreal and Barclays Bank PLC, fixing the price it receives for a portion of its natural gas through December 1, 2017, as summarized in the following table:
| Swap Contract Expiration |
MMbtu/day | Weighted Average Price |
||||||
| 2014 |
163,000 | $ | 4.120 | |||||
| 2015 |
92,000 | $ | 4.160 | |||||
| 2016 |
98,000 | $ | 4.200 | |||||
| 2017 |
60,000 | $ | 4.240 | |||||
| Collar Contract Expiration |
MMbtu/day | Floor/Ceiling | ||||||
| 2014 |
10,000 | $ | 3.000/$5.800 | |||||
| 2015 |
70,000 | $ | 3.910/$4.680 | |||||
| Basis Contract Expiration |
MMbtu/day | Swap ($/MMBtu) |
||||||
| 2014 |
48,000 | $ | (0.240 | ) | ||||
| 2015 |
37,000 | $ | (0.420 | ) | ||||
| 2016 |
17,000 | $ | (0.420 | ) | ||||
| Put Contract Expiration |
MMbtu/day | Swap ($/MMBtu) |
||||||
| 2014 |
33,000 | $ | 0.450 | |||||
F-11
Table of Contents
Index to Financial Statements
The following is a summary of the Company’s derivative instruments, which are recorded in the condensed consolidated balance sheets as of March 31, 2014 and December 31, 2013 (in thousands). Included within current derivative liabilities is a deferred put premium liability of $4.1 million.
| As of March 31, 2014 |
As of December 31, 2013 |
|||||||
| Current derivative assets |
$ | — | $ | 2,270 | ||||
| Long-term derivative assets |
5,726 | 6,030 | ||||||
|
|
|
|
|
|||||
| $ | 5,726 | $ | 8,300 | |||||
|
|
|
|
|
|||||
| Current derivative liabilities |
$ | 23,987 | $ | 3,235 | ||||
| Long-term derivative liabilities |
— | 1,109 | ||||||
|
|
|
|
|
|||||
| $ | 23,987 | $ | 4,344 | |||||
|
|
|
|
|
|||||
| Net current value of derivative liabilities |
$ | (23,987 | ) | $ | (965 | ) | ||
|
|
|
|
|
|||||
| Net long-term value of derivative assets |
$ | 5,726 | $ | 4,921 | ||||
|
|
|
|
|
|||||
The following tables present the gross amounts of recognized derivative assets and liabilities, the amounts offset under netting arrangements with counterparties, and the resulting net amounts presented in the condensed consolidated balance sheets for the periods presented, all at fair value (in thousands):
| As of March 31, 2014 | ||||||||||||
| Description |
Gross Amounts of Recognized Assets |
Gross Amounts Offset on Balance Sheet |
Net Amounts of Assets (Liabilities) on Balance Sheet |
|||||||||
| Gross Amounts |
||||||||||||
| Derivative assets |
$ | 13,647 | $ | (7,921 | ) | $ | 5,726 | |||||
| Derivative liabilities |
$ | 5,221 | $ | (29,208 | ) | $ | (23,987 | ) | ||||
| As of December 31, 2013 | ||||||||||||
| Description |
Gross Amounts of Recognized Assets |
Gross Amounts Offset on Balance Sheet |
Net Amounts of Assets (Liabilities) on Balance Sheet |
|||||||||
| Gross Amounts |
||||||||||||
| Derivative assets |
$ | 13,000 | $ | (4,700 | ) | $ | 8,300 | |||||
| Derivative liabilities |
$ | 256 | $ | (4,600 | ) | $ | (4,344 | ) | ||||
Both realized and unrealized gains and losses are recorded as a gain or loss on derivatives in the condensed consolidated statement of operations under loss on derivative instruments. The Company had an unrealized loss of $9.2 million for the three months ended March 31, 2014 and an unrealized loss of $4.8 million for the three months ended March 31, 2013. The Company had realized losses related to contract settlements of $11.2 million and $0.2 million for the three months ended March 31, 2014 and 2013, respectively.
| 4. | Fair Value of Financial Instruments |
The Company determines fair value on a recurring basis for its liability related to restricted units and recorded amounts for derivative instruments as these instruments are required to be recorded at fair value for each reporting amount. Certain amounts in the Company’s financial statements are measured at fair value on a nonrecurring basis including discounts associated with long-term debt. Fair value is based on quoted market prices, where available. If quoted market prices are not available, fair value is based upon models that use as inputs market-based parameters, including but not limited to forward curves, discount rates, broker quotes, volatilities, and nonperformance risk.
F-12
Table of Contents
Index to Financial Statements
The Company has categorized its fair value measurements into a three-level fair value hierarchy, based on the priority of the inputs to the valuation technique. The fair value hierarchy gives the highest priority to quoted prices in active markets for identical assets and liabilities (Level 1) and the lowest priority to unobservable inputs (Level 3). The Company’s fair value measurements relating to restricted units are included in Level 3. The Company’s fair value measurements relating to derivative instruments are included in Level 2. Since the adoption of fair value accounting, the Company has not made any changes to its classification of financial instruments in each category.
Items included in Level 3 are valued using internal models that use significant unobservable inputs. Items included in Level 2 are valued using management’s best estimate of fair value corroborated by third-party quotes.
The following assets and liabilities were measured at fair value on a recurring basis during the period (refer to Note 3 for details relating to derivative instruments) (in thousands):
| As of March 31, 2014 | ||||||||||||||||||||
| Fair Value Measurements at Reporting Date Using | ||||||||||||||||||||
| Description |
Carrying Value |
Total Fair Value |
Quoted Prices in Active Markets for Identical Assets (Level 1) |
Significant Other Observable Inputs (Level 2) |
Significant Unobservable Inputs (Level 3) |
|||||||||||||||
| Assets: |
||||||||||||||||||||
| Derivative instruments, at fair value |
$ | 5,726 | $ | 5,726 | $ | — | $ | 5,726 | $ | — | ||||||||||
|
|
|
|
|
|
|
|
|
|
|
|||||||||||
| Total assets |
$ | 5,726 | $ | 5,726 | $ | — | $ | 5,726 | $ | — | ||||||||||
|
|
|
|
|
|
|
|
|
|
|
|||||||||||
| Liabilities: |
||||||||||||||||||||
| Derivative instruments, at fair value |
$ | 23,987 | $ | 23,987 | $ | — | $ | 23,987 | $ | — | ||||||||||
|
|
|
|
|
|
|
|
|
|
|
|||||||||||
| Total liabilities |
$ | 23,987 | $ | 23,987 | $ | — | $ | 23,987 | $ | — | ||||||||||
|
|
|
|
|
|
|
|
|
|
|
|||||||||||
| As of December 31, 2013 | ||||||||||||||||||||
| Fair Value Measurements at Reporting Date Using | ||||||||||||||||||||
| Description |
Carrying Value |
Total Fair Value |
Quoted Prices in Active Markets for Identical Assets (Level 1) |
Significant Other Observable Inputs (Level 2) |
Significant Unobservable Inputs (Level 3) |
|||||||||||||||
| Assets: |
||||||||||||||||||||
| Derivative instruments, at fair value |
$ | 4,921 | $ | 4,921 | $ | — | $ | 4,921 | $ | — | ||||||||||
|
|
|
|
|
|
|
|
|
|
|
|||||||||||
| Total assets |
$ | 4,921 | $ | 4,921 | $ | — | $ | 4,921 | $ | — | ||||||||||
|
|
|
|
|
|
|
|
|
|
|
|||||||||||
| Liabilities: |
||||||||||||||||||||
| Restricted units, at fair value |
$ | 36,306 | $ | 36,306 | $ | — | $ | — | $ | 36,306 | ||||||||||
| Derivative instruments, at fair value |
965 | 965 | — | 965 | — | |||||||||||||||
|
|
|
|
|
|
|
|
|
|
|
|||||||||||
| Total liabilities |
$ | 37,271 | $ | 37,271 | $ | — | $ | 965 | $ | 36,306 | ||||||||||
|
|
|
|
|
|
|
|
|
|
|
|||||||||||
F-13
Table of Contents
Index to Financial Statements
| Fair Value Measurements Using Significant Unobservable Inputs (Level 3) |
||||||||
| 2014 | 2013 | |||||||
| Balance as of January 1, |
$ | 36,306 | $ | 5,667 | ||||
| Total gain or losses: |
||||||||
| Included in earnings |
— | — | ||||||
| Transfers in and/or out of Level 3 |
— | — | ||||||
| Repurchase of restricted units |
— | (2,267 | ) | |||||
| Converted to shares of common stock |
$ | (36,306 | ) | $ | — | |||
|
|
|
|
|
|||||
| Balance as of March 31, |
$ | — | 3,400 | |||||
|
|
|
|
|
|||||
Gains and losses related to restricted units included in earnings for the period are reported in operating expenses in the statements of consolidated operations.
The carrying value of cash equivalents approximates fair value due to the short maturity of the instruments.
The estimated fair value and carrying amount of long-term debt as reported on the condensed consolidated balance sheets as of March 31, 2014 and December 31, 2013 is shown in the table below (refer to Note 2 for details relating to the borrowing arrangements) (in thousands). The fair value was estimated using Level 3 inputs based on rates reflective of the remaining maturity as well as the Company’s financial position.
| Long-Term Debt |
As of March 31, 2014 | As of December 31, 2013 | ||||||||||||||
| Description |
Carrying Value | Fair Value | Carrying Value | Fair Value | ||||||||||||
| Debentures |
$ | — | $ | — | $ | 6,890 | $ | 12,671 | ||||||||
| Second Lien Term Loan Facility(1) |
293,280 | 314,743 | 293,821 | 315,284 | ||||||||||||
| NPI Note(2) |
8,286 | 8,500 | 8,028 | 8,028 | ||||||||||||
| Senior Secured Revolving Credit Facility |
— | — | 115,000 | 115,000 | ||||||||||||
| Other |
2,361 | 2,361 | 3,203 | 3,203 | ||||||||||||
|
|
|
|
|
|
|
|
|
|||||||||
| Total |
$ | 303,927 | $ | 325,604 | $ | 426,942 | $ | 454,186 | ||||||||
|
|
|
|
|
|
|
|
|
|||||||||
| (1) | The Second Lien Term Loan Facility was repaid in full and retired in April 2014. |
| (2) | The NPI Note was repaid in full in April 2014. |
| 5. | Acquisitions |
Marcellus JV Buy-In
Prior to the completion of the Marcellus JV Buy-In, the Company accounted for its 50% equity interest in the Marcellus joint venture under the equity method of accounting. Immediately prior to the completion of the Marcellus JV Buy-In, the fair value of the existing equity in the Marcellus joint venture was approximately $250.6 million. The acquisition date fair value of the existing equity investment was based on an income approach. The income approach, considered to be a Level 3 fair value method, calculated the present value of the future cash flows related to the natural gas properties as of the date of the transaction, utilizing a discount rate based upon market participant assumptions, natural gas strip prices as of the date of the transaction, and a decline curve consistent with our geographic peers. As a result of the Marcellus JV Buy-In, the Company was required to remeasure its equity investment at fair value, which resulted in a non-recurring gain of approximately $203.6 million during the three months ended March 31, 2014. Based on valuations performed as of the acquisition date, the natural gas properties had a fair value of approximately $343.0 million. The acquisition consolidated the resources of the Company and the Marcellus joint venture, which enables management to optimize and prioritize the development of their combined natural gas properties. The management team of the Company historically
F-14
Table of Contents
Index to Financial Statements
served as the management team of the Marcellus joint venture, providing it with familiarity with its assets and operations. As a result of these factors, the excess purchase price over net assets and liabilities assumed of $338.0 million was allocated to goodwill.
The purchase price allocation and resulting impact on the corresponding condensed consolidated balance sheet relating to the Marcellus JV Buy-In is as follows:
| (in thousands) |
||||
| Financial assets |
$ | 34,242 | ||
| Proved natural gas properties, net |
288,000 | |||
| Unproved natural gas properties |
55,000 | |||
| Goodwill |
338,036 | |||
| Financial liabilities |
(49,313 | ) | ||
| Long-term debt |
(75,400 | ) | ||
| Deferred tax liability |
(17,933 | ) | ||
|
|
|
|||
| Total identifiable net assets |
$ | 572,632 | ||
|
|
|
|||
| Cash paid for acquisitions |
$ | 100,000 | ||
| Fair value of equity issued |
222,000 | |||
| Fair value of pre-existing equity investment Total consideration |
250,632 | |||
|
|
|
|||
| $ | 572,632 | |||
|
|
|
|||
Subsequent to the completion of the Marcellus JV Buy-In and excluding the related gain of $203.6 million recorded at January 29, 2014, the 100%-owned Marcellus joint venture contributed the following to the Company’s consolidated operating results for the three months ended March 31, 2014:
| Three Months Ended March 31, 2014 |
||||
| (in thousands) | ||||
| Revenue |
$ | 34,935 | ||
| Net income |
$ | 29,467 | ||
Pro Forma Information (Unaudited)
The following unaudited pro forma combined financial information presents the Company’s results as though the Marcellus JV Buy-In has been completed at January 1, 2014 and January 1, 2013, respectively.
| Three Months Ended March 31, 2014 (Pro Forma) |
Three Months Ended March 31, 2013 (Pro Forma) |
|||||||
| (in thousands, except per share data) |
||||||||
| Pro forma net revenues |
$ | 102,402 | $ | 30,172 | ||||
| Pro forma net income (loss) |
$ | 124,142 | $ | (7,762 | ) | |||
| Pro forma earnings per share (basic) |
$ | 1.00 | $ | (0.06 | ) | |||
| Pro forma earnings per share (diluted) |
$ | 0.99 | $ | (0.06 | ) | |||
Momentum Acquisition
On February 12, 2014, the Company, through its indirect wholly-owned subsidiary Rice Poseidon Midstream LLC, a Delaware limited liability company (“Rice Poseidon”), entered into a purchase and sale agreement with M3 Appalachia Gathering LLC, a Delaware limited liability company (“M3”), to acquire (the
F-15
Table of Contents
Index to Financial Statements
“Momentum Acquisition”) certain gas gathering assets in eastern Washington and Greene Counties, Pennsylvania. On April 17, 2014, the Company completed the Momentum Acquisition for aggregate consideration of approximately $110.0 million (the “Purchase Price”). The effective date for the Momentum Acquisition is March 1, 2014. The Company funded the Purchase Price with cash on hand.
The properties acquired in the Momentum Acquisition consist of a 28-mile, 6”-16” gathering system in eastern Washington County, Pennsylvania, and permits and rights of way in Washington and Greene Counties, Pennsylvania, necessary to construct an 18-mile, 30” gathering system connecting the northern system to the Texas Eastern pipeline. The northern system is supported by long-term contracts with acreage dedications covering approximately 20,000 acres from third parties. Once fully constructed, the acquired systems are expected to have an aggregate capacity of over 1 billion cubic feet of natural gas per day.
| 6. | Sale of Interests in Gas Properties |
In December 2013, the Company agreed to sell interests in noncore assets in Guernsey County, Ohio representing an undivided 75.0% interest in certain of its Guernsey County leaseholds (representing approximately 2,136 net acres) to a third party in exchange for approximately $22.0 million, consisting of $11.0 million in cash and an $11.0 million carried working interest. Of the 2,136 net acres, 1,033 net acres closed in the first quarter of 2014. No gain or loss was recorded on this transaction.
| 7. | Commitments and Contingencies |
On October 14, 2013, the Company entered into a Development Agreement and Area of Mutual Interest (“AMI”) Agreement with Gulfport Energy Corporation (“Gulfport”) covering approximately 50,000 aggregate net acres in the Utica Shale in Belmont County, Ohio. The Company refers to these agreements as “Utica Development Agreements.” Pursuant to the Utica Development Agreements, the Company had approximately 68.80% participating interest in acreage currently owned or to be acquired by the Company or Gulfport located within Goshen and Smith Townships (the “Northern Contract Area”) and an approximately 42.63% participating interest in acreage currently owned or to be acquired by the Company or Gulfport located within Wayne and Washington Townships (the “Southern Contract Area”), each within Belmont County, Ohio. The remaining participating interests are held by Gulfport. The participating interests of the Company and Gulfport in each of the Northern and Southern Contract Areas approximate the Company’s current relative acreage positions in each area.
Each quarter during the term of the Development Agreement, the Company and Gulfport will establish a work program and budget detailing the proposed exploration and development to be performed in the Northern and Southern Contract Areas, respectively, for the following year. The number of horizontal wells proposed to be drilled in each of the Northern Contract Area and Southern Contract Area is limited by the Development Agreement as follows: in 2013, no more than five wells; in 2014, between eight and 40 wells; in 2015, between eight and 50 wells; and thereafter, unlimited.
The Utica Development Agreements have terms of ten years and are terminable upon 90 days’ notice by either party; provided that, with respect to interests included within a drilling unit, such interests shall remain subject to the applicable joint operating agreement and the Company and Gulfport shall remain operators of drilling units located in the Northern and Southern Contract Areas, respectively, following such termination.
The Company has commitments for gathering and firm transportation under existing contracts with third parties. Future payments for these items as of March 31, 2014 totaled $1,751.7 million (remainder of 2014—$25.6 million, 2015—$68.1 million, 2016—$81.6 million, 2017—$81.5 million, 2018—$80.0 million, 2019—$75.7 million and thereafter—$1,339.2 million).
As of March 31, 2014, the Company had two horizontal drilling rigs under contract. One of these contracts expires in 2014 and the other contract expires in 2015. Future payments for these items as of March 31, 2014
F-16
Table of Contents
Index to Financial Statements
totaled $17.0 million (remainder of 2014—$7.3 million and 2015—$9.7 million). Any other rig performing work for us is doing so on a well-by-well basis and therefore can be released without penalty at the conclusion of drilling on the current well. These types of drilling obligations have not been included in the amounts above. The values above represent the gross amounts that we are committed to pay without regard to our proportionate share based on our working interest.
The Company is involved in various litigation matters arising in the normal course of business. Management is not aware of any actions that are expected to have a material adverse effect on its financial position or results of operations.
| 8. | Stockholders’ Equity |
On January 29, 2014, pursuant to the Master Reorganization Agreement (the “Master Reorganization Agreement”) among Rice Energy Inc., Rice Drilling B, Rice Appalachia, Rice Holdings, Rice Partners, NGP Holdings, NGP RE Holdings, L.L.C., (“NGP RE Holdings”) NGP RE Holdings II, L.L.C. (“NGP RE II” and, together with NGP RE Holdings, “Natural Gas Partners”), Mr. Daniel J. Rice III, Rice Merger LLC (“Merger Sub”) and each of the persons holding incentive units representing interests in Rice Appalachia (collectively, the “Incentive Unitholders”) dated as of January 23, 2014, (i) (a) Rice Partners contributed a portion of its interests in Rice Appalachia to Rice Holdings, (b) Natural Gas Partners contributed its interests in Rice Appalachia to NGP Holdings and (c) the Incentive Unitholders contributed a portion of their incentive units to Rice Holdings and NGP Holdings, each in return for substantially similar incentive units in such entities; (ii) NGP Holdings, Rice Holdings and Mr. Daniel J. Rice III contributed their respective interests in Rice Appalachia to the Company in exchange for 43,452,550, 20,300,923 and 2,356,844 shares of Common Stock, respectively; (iii) Rice Partners contributed its remaining interest in Rice Appalachia to Rice Energy Inc. in exchange for 20,000,000 shares of Common Stock; (iv) the Incentive Unitholders contributed their remaining interests in Rice Appalachia to the Company in exchange for 160,831 shares of Common Stock, each of which were issued by the company in connection with the closing of the IPO. In connection with the IPO, in the first quarter of 2014, we recognized a non-cash compensation expense of $3.4 million for these 160,831 shares.
In addition, on January 29, 2014, pursuant to the Agreement and Plan of Merger (the “Merger Agreement”) among the Company, Rice Drilling B and Merger Sub dated as of January 23, 2014, Rice Energy Inc. issued 1,728,852 shares of Common Stock to the members of Rice Drilling B (other than Rice Appalachia) for settlement of the restricted units.
The Company’s Board of Directors did not declare or pay a dividend for the three months ended March 31, 2014 or 2013.
| 9. | Incentive Units |
In connection with the IPO and the related corporate reorganization, the Rice Appalachia incentive unit holders contributed their Rice Appalachia incentive units to Rice Holdings and NGP Holdings in return for substantially similar incentive units in such entities (except for those related to the incentive units attributable to Mr. Daniel J. Rice III, which were settled with the issuance of 160,831 shares of our common stock). In the first quarter of 2014, certain incentive units granted by NGP Holdings to certain employees triggered the pre-determined payout criteria, resulting in a cash payment by NGP Holdings of $4.4 million. No payments were made in respect of incentive units prior to the completion of the Company’s IPO. These two transactions resulted in non-cash compensation expense of $7.8 million being recorded in the first quarter of 2014 by the Company.
As a result of the IPO, the payment likelihood related to the incentive units was deemed probable, requiring that we recognize expense. Accordingly, we recognized approximately $66.0 million of compensation expense in the first quarter of 2014 relative to these interests, and we expect to recognize approximately $85.5 million of additional compensation expense over the remaining expected service periods, related to the Rice Holdings
F-17
Table of Contents
Index to Financial Statements
interests. The NGP Holdings interests are considered a liability-based award and will be adjusted on a quarterly basis until all payments have been made. As of March 31, 2014, the unrecognized compensation expense related to the NGP Holdings units is approximately $93.7 million which will be recognized over the remaining expected service period. The compensation expense related to these interests is treated as additional paid in capital from Rice Holdings and NGP Holdings in our financial statements and is not deductible for federal or state income tax purposes. The compensation expense recognized is a non-cash charge, with the settlement obligation resting on NGP Holdings and Rice Holdings. Payments on the incentive units will be made by Rice Holdings and NGP Holdings and not Rice Energy Inc., and as such are not dilutive to Rice Energy Inc.
Three tranches of the incentive units have a time vesting feature. A rollforward of those units from IPO to March 31, 2014 is included below.
| Vested Units Balance, January 29, 2014 |
641,236 | |||
| Vested During Period |
126,296 | |||
| Forfeited During Period |
— | |||
| Cancelled During Period |
— | |||
|
|
|
|||
| Vested Units Balance, March 31, 2014 |
767,532 | |||
|
|
|
Four tranches of the incentive units do not have a time vesting feature, and their payouts are triggered upon a future payment condition. There were no forfeitures or cancellations of those units during the first quarter of 2014.
The fair value of the incentive units was estimated using a Monte Carlo simulation valuation model with the following assumptions:
| Rice Holdings |
||||
| Valuation Date |
1/29/2014 | |||
| Dividend Yield |
0.00 | % | ||
| Expected Volatility |
47.00 | % | ||
| Risk-Free Rate |
1.11 | % | ||
| Expected Life (Years) |
4.0 | |||
| NGP Holdings |
||||
| Valuation Date |
3/31/2014 | |||
| Dividend Yield |
0.00 | % | ||
| Expected Volatility |
41.00 | % | ||
| Risk-Free Rate |
0.38 | % | ||
| Expected Life (Years) |
1.8 | |||
| 10. | Earnings Per Share |
Basic earnings per share (“EPS”) is computed by dividing net income (loss) by the weighted-average number of shares of common stock outstanding during the period. Diluted earnings per share takes into account the dilutive effect of potential common stock that could be issued by the Company in conjunction with stock awards that have been granted to directors and employees. On January 29, 2014 (the “grant date”), the Company granted restricted stock units to two of its non-employee directors which are subject to a one-year cliff vesting schedule. In addition, the Company granted restricted stock units to one employee which are subject to a three-year cliff vesting schedule. On February 24, 2014, the Company granted additional restricted stock units to one employee which are subject to a three-year cliff vesting schedule. For the three months ended March 31, 2014, $0.1 million was recorded in compensation expense related to the restricted stock units. As of March 31, 2014, the Company has unrecorded compensation expense related to the restricted stock units of $0.8 million. In accordance with FASB ASC Topic 260, awards of nonvested shares shall be considered to be outstanding as of
F-18
Table of Contents
Index to Financial Statements
the grant date for purposes of computing diluted EPS even though their exercise is contingent upon vesting. The following is a calculation of the basic and diluted weighted-average number of shares of common stock outstanding and EPS for the three months ended March 31, 2014. Net income and weighted-average number of shares of common stock outstanding is based on the actual days in which the shares were outstanding for the period from January 29, 2014, the closing date of the IPO, to March 31, 2014.
| Three Months Ended March 31, 2014 |
Three Months Ended March 31, 2013 |
|||||||
| (in thousands, except per share data) |
||||||||
| Income (loss) (numerator): |
||||||||
| Net income (loss) |
$ | 129,454 | $ | (6,775 | ) | |||
| Weighted-average shares (denominator): |
||||||||
| Weighted-average number of shares of common stock—basic |
124,646 | 124,646 | ||||||
| Weighted-average number of shares of common stock—diluted |
125,192 | 125,192 | ||||||
| Earnings (loss) per share: |
||||||||
| Basic |
$ | 1.04 | $ | (0.05 | ) | |||
| Diluted |
$ | 1.03 | $ | (0.05 | ) | |||
| 11. | Income Taxes |
At the date of IPO, Rice Energy indirectly owned 100% of Rice Drilling B and its subsidiaries. Rice Drilling B was a limited liability company not subject to federal income taxes before IPO. However, in connection with the closing of the IPO, as a result of our corporate reorganization, the Company became a corporation subject to federal income tax and, as such, our future income taxes will be dependent upon our future taxable income. The change in tax status requires the recognition of a deferred tax asset or liability for the initial temporary differences at the time of the change in status. The resulting deferred tax liability of approximately $164.5 million was recorded in equity at the date of the completion of the IPO as it represents a transaction among shareholders.
Based on management’s analysis, the Company did not have any uncertain tax positions as of March 31, 2014 and December 31, 2013.
| 12. | New Accounting Pronouncements |
In February 2013, the FASB issued ASU, No. 2013-04, “Liabilities (Topic 405): Obligations Resulting from Joint and Several Liability Arrangements for Which the Total Amount of the Obligation is Fixed at the Reporting Date,” or ASU No. 2013-04. ASU 2013-04 requires an entity to measure obligations resulting from joint and several liability arrangements for which the total amount of the obligation is fixed at the reporting date, as the sum of the amount the reporting entity agreed to pay on the basis of its arrangement among its co-obligors and any additional amount the reporting entity expects to pay on behalf of its co-obligors. ASU 2013-04 also requires the nature and amount of the obligation as well as other information about those obligations to be disclosed. ASU 2013-04 is effective for fiscal and interim periods within those years, beginning after December 15, 2013 and should be applied retrospectively. The Company adopted this guidance effective January 1, 2014. Please refer to Note 2 and Note 13 for the required disclosure.
| 13. | Subsequent Events |
6.25% Senior Notes Due 2022
On April 25, 2014, the Company offered $900.0 million in aggregate principal amounts of 6.25% senior notes (the “Notes”) due 2022 in a private placement to eligible purchasers under Rule 144A and Regulation S of the Securities Act, which resulted in net proceeds to us of $882.7 million after deducting estimated expenses and
F-19
Table of Contents
Index to Financial Statements
underwriting discounts and commissions of approximately $17.3 million. The Company used $301.8 million of the net proceeds to repay and retire the Second Lien Term Loan Facility. The Company’s obligations under the Notes, including the due and punctual payment of interest on the Notes, are fully and unconditionally, and jointly and severally, guaranteed on an unsecured basis by the Company’s subsidiary guarantors.
Third Amended and Restated Credit Agreement
Concurrently with the Senior Notes Offering, the Company, as borrower, and Rice Drilling B, as predecessor borrower, amended and restated its Senior Secured Revolving Credit Facility (“Amended Credit Agreement”) to, among other things, assign all of its rights and obligations under the Senior Secured Revolving Credit Facility to the Company, and the Company assumed all such rights and obligations as borrower under the Amended Credit Agreement. Furthermore, the Amended Credit Agreement (i) allowed for the issuance of the Notes described above and (ii) provided that the Company did not incur an immediate reduction in the borrowing base under the Senior Secured Revolving Credit Facility as a result of the issuance of the Notes (though the borrowing base will be redetermined within approximately 30 days after the issuance of the Notes) and, as such, the borrowing base under the Amended Credit Agreement immediately following the issuance of the Notes remained at $350.0 million until the next redetermination. The Amended Credit Agreement also extended the maturity date of the Senior Secured Revolving Credit Facility from April 25, 2018 to January 29, 2019. The interest rate did not change under the Amended Credit Agreement.
The Amended Credit Agreement is secured by liens on at least 80% of the proved oil and gas reserves of the Company and its subsidiaries (other than any subsidiary that is designated as an unrestricted subsidiary), as well as significant unproved acreage and substantially all of the personal property of the Company and such restricted subsidiaries, and the Amended Credit Agreement is guaranteed by such restricted subsidiaries. The Amended Credit Agreement contains restrictive covenants that limit the ability of the Company and its restricted subsidiaries to, among other things:
| • | incur additional indebtedness; |
| • | sell assets; |
| • | make loans to others; |
| • | make investments; |
| • | enter into mergers; |
| • | make or declare dividends; |
| • | hedge future production or interest rates; |
| • | incur liens; and |
| • | engage in certain other transactions without the prior consent of the lenders. |
The Amended Credit Agreement also requires the Company to maintain certain financial ratios, which are measured at the end of each calendar quarter, beginning March 31, 2014:
| • | a current ratio, which is the ratio of consolidated current assets (including unused commitments under the Amended Credit Agreement and excluding non-cash derivative assets) to consolidated current liabilities (excluding current maturities under the Amended Credit Agreement and non-cash derivative liabilities), of not less than 1.0 to 1.0; and |
| • | a minimum interest coverage ratio, which is the ratio of consolidated EBITDAX (as such term is defined in the Amended Credit Agreement) based on the trailing 12 month period to consolidated interest expense, of not less than 2.5 to 1.0. |
The Company was in compliance with such covenants and ratios effective as of March 31, 2014.
F-20
Table of Contents
Index to Financial Statements
Momentum Acquisition
On April 17, 2014, the Company completed the Momentum Acquisition for aggregate consideration of approximately $110.0 million. The effective date for the Momentum Acquisition is March 1, 2014.
F-21
Table of Contents
Index to Financial Statements
RICE ENERGY INC.
PRO FORMA CONDENSED CONSOLIDATED FINANCIAL STATEMENTS
(UNAUDITED)
Introduction
The following unaudited pro forma condensed consolidated financial statements of Rice Energy Inc. as of and for the year ended December 31, 2013 are derived from the historical financial statements of Rice Drilling B LLC and Alpha Shale Resources, LP, set forth elsewhere in this prospectus, and the following unaudited pro forma condensed consolidated statement of operations of Rice Energy Inc. for the three months ended March 31, 2014 are derived from the historical financial statements of Rice Energy Inc., set forth elsewhere in this prospectus, and in each case are qualified in their entirety by reference to such historical financial statements and related notes contained therein. These unaudited pro forma condensed consolidated financial statements have been prepared to reflect our acquisition of a 50% interest in our Marcellus joint venture, our corporate reorganization and our initial public offering, each of which is described below.
Initial Public Offering
On January 29, 2014, we completed our IPO of 50,000,000 shares of our $0.01 par value common stock, which included 30,000,000 shares sold by us, 14,000,000 shares sold by the selling stockholder and 6,000,000 shares subject to an option granted to the underwriters by the selling stockholder.
The net proceeds of our IPO, based on the public offering price of $21.00 per share, were approximately $993.5 million, which resulted in net proceeds to us of $593.6 million after deducting estimated expenses and underwriting discounts and commissions of approximately $36.4 million and the net proceeds to the selling stockholders of approximately $399.0 million after deducting estimated expenses and underwriting discounts of approximately $21.0 million. We did not receive any proceeds from the sale of the shares by the selling stockholder. A portion of the net proceeds from our IPO were used to repay all outstanding borrowings under the revolving credit facility of our Marcellus joint venture, to make a $100.0 million payment to Alpha Holdings in partial consideration for the Marcellus JV Buy-In and to repay all outstanding borrowings under our revolving credit facility. The remainder of the net proceeds from our IPO will be used to fund a portion of our capital expenditure plan.
Corporate Reorganization
A corporate reorganization occurred concurrently with the completion of our IPO on January 29, 2014. As a part of this corporate reorganization, we acquired all of the outstanding membership interests in Rice Appalachia, in exchange for shares of the Company’s common stock. Our business continues to be conducted through Rice Drilling B, as a wholly owned subsidiary. Upon (a) completion of the IPO, (b) the issuance of (i) 43,452,550 shares of common stock to NGP Holdings, (ii) 20,300,923 shares of common stock to Rice Holdings, (iii) 2,356,844 shares of common stock to Daniel J. Rice III, (iv) 20,000,000 shares of common stock to Rice Partners, (v) 160,831 shares of common stock to the persons holding incentive units representing interests in Rice Appalachia and (vi) 1,728,852 shares of common stock to the members of Rice Drilling B (other than Rice Appalachia), each of which were issued by us in connection with the closing of the IPO, and (c) the issuance of 9,523,810 shares of common stock to Alpha Holdings in connection with the completion of the Marcellus JV Buy-In described below under “—Marcellus JV Buy-In,” we had 127,523,810 shares of common stock outstanding.
Marcellus JV Buy-In
On January 29, 2014, in connection with the closing of the IPO and pursuant to the Transaction Agreement between us and Alpha Holdings dated as of December 6, 2013 (the “Transaction Agreement”), we completed our acquisition of Alpha Holdings’ 50% interest in our Marcellus joint venture in exchange for total consideration of $322 million, consisting of $100 million of cash and our issuance to Alpha Holdings of 9,523,810 shares of our common stock.
F-22
Table of Contents
Index to Financial Statements
The unaudited pro forma condensed consolidated balance sheet and the unaudited pro forma condensed consolidated statement of operations for the year ended December 31, 2013 were derived by adjusting the historical audited and unaudited financial statements of our predecessor. The unaudited pro forma condensed consolidated statement of operations for the three months ended March 31, 2014 were derived by adjusting the historical unaudited financial statements of Rice Energy Inc. The adjustments are based upon information available as of May 13, 2014, and certain estimates and assumptions. Actual effects of the transactions may differ from the pro forma adjustments. Management believes, however, that the assumptions provide a reasonable basis for presenting the significant effects of the transactions as contemplated and that the pro forma adjustments are factually supportable and give appropriate effect to those assumptions and are properly applied in the unaudited pro forma financial data.
The pro forma adjustments have been prepared as if the Marcellus JV Buy-In, the Reorganization and our IPO had each taken place on December 31, 2013, in the case of the unaudited pro forma condensed consolidated balance sheet, and as if the Marcellus JV Buy-In, the Reorganization and our IPO had each taken place as of January 1, 2013, in the case of the unaudited pro forma condensed consolidated statements of operations for the year ended December 31, 2013 and the three months ended March 31, 2014. The unaudited pro forma condensed consolidated financial statements have been prepared on the fact that Rice Energy Inc. is treated as a corporation for federal income tax purposes. The unaudited pro forma condensed consolidated financial statements should be read in conjunction with the notes accompanying such unaudited pro forma financial statements and with the historical audited financial statements of Rice Drilling B LLC, Alpha Shale Resources, LP, and with respect to the three months ended March 31, 2014, Rice Energy Inc., and related notes, as well as “Management’s Discussion and Analysis of Financial Condition and Results of Operations,” each included elsewhere in this prospectus.
The unaudited pro forma condensed consolidated financial statements give pro forma effect to the following adjustments, among others:
| • | the acquisition of a 50% interest in our Marcellus joint venture from our joint venture partner in return for 9,523,810 shares of common stock of Rice Energy Inc. and $100 million in cash; |
| • | the repayment of all outstanding borrowings under the revolving credit facility of us and our Marcellus joint venture; |
| • | the contribution by Rice Holdings, NGP Holdings and Daniel J. Rice III of their respective interests, and by Rice Partners of its remaining interest, in Rice Appalachia to Rice Energy Inc. in return for an aggregate of 86,110,317 shares of common stock of Rice Energy Inc.; |
| • | the contribution by certain of the incentive unit holders of their respective remaining interest in Rice Appalachia to Rice Energy Inc. in exchange for 160,831 shares of common stock of Rice Energy Inc.; |
| • | the issuance of 1,728,852 shares of common stock of Rice Energy Inc. to certain existing members of Rice Drilling B in exchange for their outstanding membership interests in Rice Drilling B; and |
| • | the issuance by Rice Energy Inc. of 30,000,000 million common shares in the offering and the use of the net proceeds therefrom. |
The unaudited pro forma condensed consolidated statements of operations exclude certain transaction costs, such as costs associated with the IPO that were not capitalized as part of the IPO. The unaudited pro forma condensed consolidated financial data are presented for illustrative purposes only and do not purport to indicate the financial condition or results of operations of future periods or the financial condition or results of operations that actually would have been realized had the transactions described above been consummated on the dates or for the periods presented.
The unaudited pro forma condensed consolidated financial statements constitute forward-looking information and are subject to certain risks and uncertainties that could cause actual results to differ materially from those anticipated. See “Risk Factors” and “Cautionary Statement Regarding Forward-Looking Statements”, included elsewhere in this prospectus.
F-23
Table of Contents
Index to Financial Statements
PRO FORMA CONDENSED
CONSOLIDATED BALANCE SHEET AS OF DECEMBER 31, 2013
(Unaudited)
| (in thousands) | Historical Rice Drilling B |
Consolidation of Marcellus JV Pro Forma Adjustments (a) |
Reorganization and Offering Pro Forma Adjustments |
Pro Forma Rice Energy Inc. |
||||||||||||
| Assets |
||||||||||||||||
| Current assets: |
||||||||||||||||
| Cash |
$ | 31,612 | $ | (88,701 | )(b) | $ | 630,000 | (c) | $ | 347,011 | ||||||
| (35,500 | )(d) | |||||||||||||||
| (190,400 | )(e) | |||||||||||||||
| Restricted cash |
8,268 | — | — | 8,268 | ||||||||||||
| Accounts receivable |
31,765 | 12,827 | — | 44,592 | ||||||||||||
| Receivable from affiliate |
2,244 | 10 | — | 2,254 | ||||||||||||
| Prepaid expenses and other |
863 | 93 | — | 956 | ||||||||||||
|
|
|
|
|
|
|
|
|
|||||||||
| Total current assets |
74,752 | (75,771 | ) | 404,100 | 403,081 | |||||||||||
| Investments in joint ventures |
49,814 | (49,760 | )(b) | — | 54 | |||||||||||
| Gas collateral account |
3,700 | 295 | — | 3,995 | ||||||||||||
| Proved natural gas properties, net |
270,523 | 320,000 | (b) | — | 590,523 | |||||||||||
| Unproved natural gas properties |
457,836 | — | — | 457,836 | ||||||||||||
| Property and equipment, net |
5,972 | 83 | — | 6,055 | ||||||||||||
| Deferred financing costs, net |
12,292 | 851 | — | 13,143 | ||||||||||||
| Other non-current assets |
4,921 | 366,042 | (b) | — | 370,963 | |||||||||||
|
|
|
|
|
|
|
|
|
|||||||||
| Total assets |
$ | 879,810 | $ | 561,740 | $ | 404,100 | $ | 1,845,650 | ||||||||
|
|
|
|
|
|
|
|
|
|||||||||
| Liabilities and members’/stockholders’ capital |
||||||||||||||||
| Current liabilities: |
||||||||||||||||
| Current portion of long-term debt |
$ | 20,120 | $ | — | $ | — | $ | 20,120 | ||||||||
| Accounts payable |
51,219 | 20,024 | — | 71,243 | ||||||||||||
| Royalties payable |
9,393 | 6,831 | — | 16,224 | ||||||||||||
| Accrued interest |
250 | 16 | — | 266 | ||||||||||||
| Accrued capital expenditures |
16,753 | 1,775 | — | 18,528 | ||||||||||||
| Other accrued liabilities |
8,283 | 2,048 | — | 10,331 | ||||||||||||
| Leasehold payable |
18,606 | 69 | — | 18,675 | ||||||||||||
| Derivative liabilities |
965 | 2,427 | — | 3,392 | ||||||||||||
| Payable to affiliate |
6,148 | 11 | — | 6,159 | ||||||||||||
| Operated prepayment liability |
1,201 | — | — | 1,201 | ||||||||||||
|
|
|
|
|
|
|
|
|
|||||||||
| Total current liabilities |
132,938 | 33,201 | — | 166,139 | ||||||||||||
| Long-term liabilities: |
||||||||||||||||
| Long-term debt |
406,822 | 75,400 | (190,400 | )(e) | 291,822 | |||||||||||
| Leasehold payable |
1,675 | 69 | — | 1,744 | ||||||||||||
| Deferred tax liability |
— | 57,118 | (b) | 154,146 | (f) | 211,264 | ||||||||||
| Restricted units |
36,306 | — | — | 36,306 | ||||||||||||
| Other long-term liabilities |
3,422 | 712 | — | 4,134 | ||||||||||||
|
|
|
|
|
|
|
|
|
|||||||||
| Total liabilities |
581,163 | 166,500 | (36,254 | ) | 711,409 | |||||||||||
|
|
|
|
|
|
|
|
|
|||||||||
| Members’/stockholders’ capital |
298,647 | 395,240 | 440,354 | (c)(d)(f) | 1,134,241 | |||||||||||
| Total liabilities and members’/stockholders’ capital |
$ | 879,810 | $ | 561,740 | $ | 404,100 | $ | 1,845,650 | ||||||||
|
|
|
|
|
|
|
|
|
|||||||||
See accompanying Notes to Pro Forma Financial Data (Unaudited).
F-24
Table of Contents
Index to Financial Statements
RICE ENERGY INC.
PRO FORMA CONDENSED CONSOLIDATED STATEMENT OF OPERATIONS
YEAR ENDED DECEMBER 31, 2013
(Unaudited)
| (in thousands, except per share data) |
Historical Rice Drilling B |
Consolidation of Marcellus JV Pro Forma Adjustments (a) |
Reorganization and Offering Pro Forma Adjustments |
Pro Forma Rice Energy Inc. |
||||||||||||
| Revenues: |
||||||||||||||||
| Natural gas sales |
$ | 87,847 | $ | 90,677 | $ | — | $ | 178,524 | ||||||||
| Other revenue |
757 | — | — | 757 | ||||||||||||
|
|
|
|
|
|
|
|
|
|||||||||
| Total revenues |
88,604 | 90,677 | — | 179,281 | ||||||||||||
| Operating expenses: |
||||||||||||||||
| Lease operating |
8,309 | 8,193 | — | 16,502 | ||||||||||||
| Gathering, compression and transportation |
9,774 | 15,663 | — | 25,437 | ||||||||||||
| Production taxes and impact fees |
1,629 | 1,258 | — | 2,887 | ||||||||||||
| Exploration |
9,951 | — | — | 9,951 | ||||||||||||
| Restricted unit expense |
32,906 | — | — | 32,906 | ||||||||||||
| General and administrative |
16,953 | 3,256 | — | 20,209 | ||||||||||||
| Depreciation, depletion and amortization |
32,815 | 39,071 | (b) | — | 71,886 | |||||||||||
| Loss on impairment of natural gas properties |
— | 146 | — | 146 | ||||||||||||
| Loss from sale of interest in gas properties |
4,230 | — | — | 4,230 | ||||||||||||
|
|
|
|
|
|
|
|
|
|||||||||
| Total operating expenses |
116,567 | 67,587 | — | 184,154 | ||||||||||||
|
|
|
|
|
|
|
|
|
|||||||||
| Operating income (loss) |
(27,963 | ) | 23,090 | — | (4,873 | ) | ||||||||||
| Interest income (expense) |
(17,915 | ) | (880 | ) | 2,373 | (d) | (16,422 | ) | ||||||||
| Other expense |
(357 | ) | (796 | ) | — | (1,153 | ) | |||||||||
| Gain on derivative instruments |
6,891 | 3,347 | — | 10,238 | ||||||||||||
| Amortization of deferred financing costs |
(5,230 | ) | (164 | ) | — | (5,394 | ) | |||||||||
| Loss on extinguishment of debt |
(10,622 | ) | — | — | (10,622 | ) | ||||||||||
| Equity in income (loss) of joint ventures |
19,420 | (19,330 | ) | — | 90 | |||||||||||
|
|
|
|
|
|
|
|
|
|||||||||
| Income (loss) before income taxes |
(35,776 | ) | 5,267 | 2,373 | (28,136 | ) | ||||||||||
| Income tax benefit |
— | — | 11,674 | (c) | 11,674 | |||||||||||
|
|
|
|
|
|
|
|
|
|||||||||
| Net income (loss) |
$ | (35,776 | ) | $ | 5,267 | $ | 14,047 | $ | (16,462 | ) | ||||||
|
|
|
|
|
|
|
|
|
|||||||||
| Earnings per share—basic |
$ | (0.13 | ) | |||||||||||||
| Earnings per share—diluted (e) |
$ | (0.13 | ) | |||||||||||||
See accompanying Notes to Pro Forma Financial Data (Unaudited).
F-25
Table of Contents
Index to Financial Statements
RICE ENERGY INC.
PRO FORMA CONDENSED CONSOLIDATED STATEMENT OF OPERATIONS FOR THE THREE
MONTHS ENDED MARCH 31, 2014
| (in thousands, except per share data) |
Rice Energy Inc. (b)(c) | Consolidation of Marcellus JV Pro Forma Adjustments (a) |
Reorganization and Offering Pro Forma Adjustments |
Pro Forma Rice Energy Inc. |
||||||||||||
| Revenues: |
||||||||||||||||
| Natural gas sales |
$ | 90,466 | $ | 11,936 | $ | — | $ | 102,402 | ||||||||
|
|
|
|
|
|
|
|
|
|||||||||
| Total revenues |
90,466 | 11,936 | — | 102,402 | ||||||||||||
| Operating expenses: |
||||||||||||||||
| Lease operating |
5,187 | 420 | — | 5,607 | ||||||||||||
| Gathering, compression and transportation |
7,130 | 1,390 | — | 8,520 | ||||||||||||
| Production taxes and impact fees |
639 | 69 | — | 708 | ||||||||||||
| Exploration |
486 | — | — | 486 | ||||||||||||
| Restricted unit expense |
73,802 | — | — | 73,802 | ||||||||||||
| General and administrative |
11,521 | 72 | — | 11,593 | ||||||||||||
| Depreciation, depletion and amortization |
25,507 | 2,856 | — | 28,363 | ||||||||||||
|
|
|
|
|
|
|
|
|
|||||||||
| Total operating expenses |
124,272 | 4,807 | — | 129,079 | ||||||||||||
|
|
|
|
|
|
|
|
|
|||||||||
| Operating income (loss) |
(33,806 | ) | 7,129 | — | (26,677 | ) | ||||||||||
| Interest income (expense) |
(7,042 | ) | (235 | ) | — | (7,277 | ) | |||||||||
| Gain on purchase of Marcellus joint venture |
203,579 | — | (2,656 | ) | 200,923 | |||||||||||
| Other income |
602 | — | — | 602 | ||||||||||||
| Gain (loss) on derivative instruments |
(20,380 | ) | (12,191 | ) | — | (32,571 | ) | |||||||||
| Amortization of deferred financing costs |
(489 | ) | (15 | ) | — | (504 | ) | |||||||||
| Loss on extinguishment of debt |
(143 | ) | — | — | (143 | ) | ||||||||||
| Write-off of deferred financing costs |
(836 | ) | — | — | (836 | ) | ||||||||||
| Equity in income (loss) of joint ventures |
(2,656 | ) | — | 2,656 | — | |||||||||||
|
|
|
|
|
|
|
|
|
|||||||||
| Income (loss) before income taxes |
138,829 | (5,312 | ) | — | 133,517 | |||||||||||
| Income tax expense |
(9,375 | ) | — | — | (9,375 | ) | ||||||||||
|
|
|
|
|
|
|
|
|
|||||||||
| Net income (loss) |
$ | 129,454 | $ | (5,312 | ) | $ | — | $ | 124,142 | |||||||
|
|
|
|
|
|
|
|
|
|||||||||
| Earnings per share—basic |
$ | 1.00 | ||||||||||||||
| Earnings per share—diluted(e) |
$ | 0.99 | ||||||||||||||
See accompanying Notes to Pro Forma Financial Data (Unaudited).
F-26
Table of Contents
Index to Financial Statements
RICE ENERGY INC.
NOTES TO PRO FORMA FINANCIAL DATA
(Unaudited)
| 1. | Basis of Presentation, Transactions and this Offering |
The historical financial information is derived from the historical financial statements of our predecessor. The pro forma adjustments have been prepared as if the Marcellus JV Buy-In, the Reorganization and the IPO described in this prospectus had each taken place on December 31, 2013, in the case of the unaudited pro forma condensed consolidated balance sheet, and as of January 1, 2013, in the case of the unaudited pro forma condensed combined statement of operations for the year ended December 31, 2013 and three months ended March 31, 2014. The adjustments are based on information available as of May 13, 2014, and certain estimates and assumptions and therefore the actual effects of these transactions will differ from the pro forma adjustments.
| 2. | Pro Forma Condensed Consolidated Balance Sheet Adjustments and Assumptions—Unaudited |
The adjustments are based on information available as of May 13, 2014, and certain estimates and assumptions and therefore the actual effects of these transactions will differ from the pro forma adjustments. A description of these transactions and adjustments is provided as follows:
| (a) | Reflects the consolidation of Alpha Shale Resources, L.P. and elimination of the investment in joint ventures associated therewith as a result of the Marcellus JV Buy-In. |
| (b) | Reflects the impact of applying purchase accounting to the acquisition of Alpha Shale Resources, L.P. The assigned fair values are subject to final purchase accounting valuation adjustments under GAAP and may change. Reflects the impact of the transfer by Alpha Holdings of its 50% interest in Alpha Shale Resources, L.P. in exchange for $100.0 million of cash and the issuance of 9,523,810 shares of common stock to Alpha Holdings. |
| (c) | Reflects the receipt of $630 million of gross proceeds from the IPO from the issuance and sale of shares of common stock at the initial public offering price of $21.00 per share. |
| (d) | Reflects the payment of underwriting discounts totaling $31.5 million and additional estimated expenses related to the IPO of approximately $4.0 million. |
| (e) | Reflects the use of a portion of the net proceeds of the IPO to repay $115.0 million of borrowings under our revolving credit facility and $75.4 million of borrowings outstanding under the revolving credit facility of Alpha Shale Resources, L.P. |
| (f) | Reflects the estimated change in long-term deferred tax liabilities for temporary differences between the historical cost basis and tax basis of the Company’s assets and liabilities as the result of its change in tax status to a subchapter C corporation. A corresponding charge to earnings has not been reflected in the unaudited pro forma combined statements of operations as the charge is considered non-recurring. |
| 3. | Pro Forma Condensed Consolidated Statement of Operations Adjustments and Assumptions—Unaudited |
The adjustments are based on information available as of May 13, 2014, and certain estimates and assumptions and therefore the actual effects of these transactions will differ from the pro forma adjustments. A description of these transactions and adjustments is provided as follows:
| (a) | Reflects the consolidation of Alpha Shale Resources, L.P. and elimination of the investment in joint ventures associated therewith as a result of the Marcellus JV Buy-In. |
| (b) | Reflects the impact of applying purchase accounting to the acquisition of Alpha Shale Resources, L.P. The assigned fair values are subject to final purchase accounting valuation adjustments under GAAP and may change. |
F-27
Table of Contents
Index to Financial Statements
| (c) | Reflects estimated incremental income tax provision assuming the earnings of Rice Drilling B, LLC and Alpha Shale Resources, L.P. had been subject to federal income tax as a subchapter C corporation using an effective tax rate of approximately 41%. This rate is inclusive of federal, state and local income taxes. |
| (d) | Reflects the elimination of interest expense related to the revolving credit facilities of Rice Drilling B, LLC and Alpha Shale Resources, L.P., which were repaid in full in connection with the IPO, partially offset by an increase in unused commitment fees related to the revolving credit facility of Rice Drilling B, LLC. |
| (e) | Reflects basic and diluted income per common share giving effect to (i) the conversion of restricted units in Rice Drilling B, LLC into shares of common stock in Rice Energy Inc. in connection with the corporate reorganization, (i) the issuance of 9,523,810 shares of common stock to Alpha Holdings as partial consideration of the Marcellus JV Buy-In and (iii) the issuance of 30,000,000 shares of common stock in the IPO. As we incurred a loss for the period presented, no dilutive impact occurred. |
| 4. | Income Taxes—Unaudited |
At the date of IPO, Rice Energy Inc. owned 100% of Rice Drilling B and Subsidiaries. Rice Drilling B was a limited liability company not subject to federal income taxes before IPO. However, in connection with the closing of the IPO, as a result of our corporate reorganization, we became a corporation subject to federal income tax and, as such, our future income taxes will be dependent upon our future taxable income. The change in tax status would require the recognition of a deferred tax asset or liability for the initial temporary differences at the time of the change in status. The resulting deferred tax liability is approximately $145.1 million.
No current tax expense would result as of the date of the change in status. The recognition of the initial deferred tax liability will be recorded in equity at the date of IPO, but not in the financials as of December 31, 2013.
| 5. | Supplemental Information on Gas-Producing Activities—Unaudited |
The historical pro forma supplemental natural gas disclosure is derived from the combined financial statements of Rice Drilling B and our Marcellus joint venture included elsewhere in this prospectus and valuations prepared by the independent petroleum engineering firm of Netherland, Sewell and Associates, Inc. for us and our Marcellus joint venture. For information regarding our independent petroleum engineers and the basis and assumptions for our reserve estimates, please see Note 17 to the consolidated financial statements of Rice Drilling B and Note 11 to the financial statements for Alpha Shale Resources, LP as of and for the year ended December 31, 2013. The unaudited pro forma combined supplemental natural gas disclosures of the Company reflect the combined historical results of Rice Drilling B and Alpha Shale Resources, LP, on a pro forma basis to give effect to the transactions, described above, as if they had occurred on December 31, 2013 for pro forma supplemental natural gas disclosure purposes.
In accordance with SEC regulations, reserves at December 31, 2013 were estimated using the unweighted arithmetic average first-day-of-the-month price for the preceding 12-month period. Reserve estimates are inherently imprecise and estimates of new discoveries are more imprecise than those of producing natural gas properties. Accordingly, the estimates may change as future information becomes available.
F-28
Table of Contents
Index to Financial Statements
Pro forma reserve quantity information for the year ended December 31, 2013 is as follows (in millions of cubic feet, MMcf):
| Historical Rice Drilling B |
Consolidation of Marcellus JV Pro Forma Adjustments |
Pro Forma Rice Energy Inc. |
||||||||||
| Proved developed and undeveloped reserves: |
||||||||||||
| Beginning of year |
304,272 | 256,236 | 560,508 | |||||||||
| Extensions and discoveries |
100,626 | 39,623 | 140,249 | |||||||||
| Revisions of previous estimates |
757 | (53,605 | ) | (52,848 | ) | |||||||
| Production |
(22,995 | ) | (22,886 | ) | (45,881 | ) | ||||||
|
|
|
|
|
|
|
|||||||
| End of year |
382,660 | 219,368 | 602,028 | |||||||||
|
|
|
|
|
|
|
|||||||
| Proved developed reserves: |
||||||||||||
| Beginning of year |
61,225 | 70,026 | 131,251 | |||||||||
| End of year |
144,310 | 104,741 | 249,051 | |||||||||
| Proved undeveloped reserves: |
||||||||||||
| Beginning of year |
243,047 | 186,210 | 429,257 | |||||||||
| End of year |
238,350 | 114,627 | 352,977 | |||||||||
Extensions, Discoveries and Other Additions
On a pro forma basis, we added 140,249 MMcf through its drilling program in the Marcellus Shale in 2013.
Information with respect to our pro forma estimated discounted future net cash flows related to proved natural gas reserves as of December 31, 2013 is as follows (in thousands):
| Historical Rice Drilling B |
Consolidation of Marcellus JV Pro Forma Adjustments |
Reorganization and IPO Pro Forma Adjustments |
Pro Forma Rice Energy Inc. |
|||||||||||||
| Future cash inflows |
$ | 1,496,294 | $ | 854,334 | $ | — | $ | 2,350,628 | ||||||||
| Future production costs |
(517,101 | ) | (264,853 | ) | — | (781,954 | ) | |||||||||
| Future development costs |
(219,879 | ) | (92,689 | ) | — | (312,568 | ) | |||||||||
| Future income tax expenses |
— | — | (451,493 | ) | (451,493 | ) | ||||||||||
|
|
|
|
|
|
|
|
|
|||||||||
| Future net cash flows |
759,314 | 496,792 | (451,493 | ) | 804,613 | |||||||||||
| 10% discount for estimated timing of cash flows |
(342,150 | ) | (204,586 | ) | 185,781 | (360,955 | ) | |||||||||
|
|
|
|
|
|
|
|
|
|||||||||
| Standardized measure of discounted future net cash flows |
$ | 417,164 | $ | 292,206 | $ | (265,712 | ) | $ | 443,658 | |||||||
|
|
|
|
|
|
|
|
|
|||||||||
For information on our assumptions regarding pricing, please see Note 17 to the consolidated financial statements of Rice Drilling B and Note 11 to the financial statements for Alpha Shale Resources, LP as of and for the year ended December 31, 2013.
F-29
Table of Contents
Index to Financial Statements
The following are the principal sources of changes in our pro forma standardized measure of discounted future net cash flows for 2013 (in thousands):
| Historical Rice Drilling B |
Consolidation of Marcellus JV Pro Forma Adjustments |
Reorganization and IPO Pro Forma Adjustments |
Pro Forma Rice Energy Inc. |
|||||||||||||
| Balance at beginning of period |
$ | 102,218 | $ | 142,154 | $ | (23,942 | ) | $ | 220,430 | |||||||
| Net change in prices and production costs |
101,345 | 163,948 | — | 265,293 | ||||||||||||
| Net change in future development costs |
29,336 | 5,563 | — | 34,899 | ||||||||||||
| Natural gas net revenues |
(68,135 | ) | (65,563 | ) | — | (133,698 | ) | |||||||||
| Extensions |
114,489 | 37,901 | — | 152,390 | ||||||||||||
| Revisions of previous quantity estimates |
1,133 | (29,504 | ) | — | (28,371 | ) | ||||||||||
| Previously estimated development costs incurred |
66,894 | 62,507 | — | 129,401 | ||||||||||||
| Changes in taxes |
— | — | (241,770 | ) | (241,770 | ) | ||||||||||
| Accretion of discount |
10,230 | 14,222 | — | 24,452 | ||||||||||||
| Changes in timing and other |
59,654 | (39,022 | ) | — | 20,632 | |||||||||||
|
|
|
|
|
|
|
|
|
|||||||||
| Balance at end of period |
$ | 417,164 | $ | 292,206 | $ | (265,712 | ) | $ | 443,658 | |||||||
|
|
|
|
|
|
|
|
|
|||||||||
Gains on sales of interests in gas properties are not included in the information set forth above. We have also allocated certain general and administrative expenses to our results of operations as these expenses relate to production activities.
F-30
Table of Contents
Index to Financial Statements
Report of Independent Registered Public Accounting Firm
The Members of
Rice Drilling B LLC
We have audited the accompanying consolidated balance sheets of Rice Drilling B LLC and subsidiaries as of December 31, 2013 and 2012, and the related consolidated statements of operations, cash flows and members’ capital for each of the three years in the period ended December 31, 2013. These financial statements are the responsibility of the Company’s management. Our responsibility is to express an opinion on these financial statements based on our audits.
We conducted our audits in accordance with the standards of the Public Company Accounting Oversight Board (United States). Those standards require that we plan and perform the audit to obtain reasonable assurance about whether the financial statements are free of material misstatement. We were not engaged to perform an audit of the Company’s internal control over financial reporting. Our audits included consideration of internal control over financial reporting as a basis for designing audit procedures that are appropriate in the circumstances, but not for the purpose of expressing an opinion on the effectiveness of the Company’s internal control over financial reporting. Accordingly, we express no such opinion. An audit also includes examining, on a test basis, evidence supporting the amounts and disclosures in the financial statements, assessing the accounting principles used and significant estimates made by management, and evaluating the overall financial statement presentation. We believe that our audits provide a reasonable basis for our opinion.
In our opinion, the financial statements referred to above present fairly, in all material respects, the consolidated financial position of Rice Drilling B LLC and subsidiaries at December 31, 2013 and 2012, and the consolidated results of their operations and their cash flows for each of the three years in the period ended December 31, 2013, in conformity with U.S. generally accepted accounting principles.
/s/ Ernst & Young LLP
Pittsburgh, Pennsylvania
March 21, 2014
F-31
Table of Contents
Index to Financial Statements
RICE DRILLING B LLC AND SUBSIDIARIES
| December 31, | ||||||||
| (in thousands) | 2013 | 2012 | ||||||
| Assets |
||||||||
| Current assets: |
||||||||
| Cash |
$ | 31,612 | $ | 8,547 | ||||
| Restricted cash |
8,268 | — | ||||||
| Accounts receivable |
31,765 | 8,557 | ||||||
| Receivable from affiliate |
2,244 | 11,879 | ||||||
| Prepaid expenses and other |
863 | 321 | ||||||
|
|
|
|
|
|||||
| Total current assets |
74,752 | 29,304 | ||||||
| Investments in joint ventures |
49,814 | 30,976 | ||||||
| Gas collateral account |
3,700 | 5,843 | ||||||
| Proved natural gas properties, net |
270,523 | 159,988 | ||||||
| Unproved natural gas properties |
457,836 | 111,030 | ||||||
| Property and equipment, net |
5,972 | 2,622 | ||||||
| Deferred financing costs, net |
12,292 | 5,208 | ||||||
| Other non-current assets |
4,921 | — | ||||||
|
|
|
|
|
|||||
| Total assets |
$ | 879,810 | $ | 344,971 | ||||
|
|
|
|
|
|||||
| Liabilities and members’ capital |
||||||||
| Current liabilities: |
||||||||
| Current portion of long-term debt |
$ | 20,120 | $ | 8,814 | ||||
| Accounts payable |
51,219 | 19,793 | ||||||
| Royalties payable |
9,393 | 1,960 | ||||||
| Accrued interest |
250 | 2,004 | ||||||
| Accrued capital expenditures |
16,753 | 2,359 | ||||||
| Other accrued liabilities |
8,283 | 5,585 | ||||||
| Leasehold payable |
18,606 | 3,954 | ||||||
| Derivative liabilities |
965 | 2,260 | ||||||
| Payable to affiliate |
6,148 | 2,482 | ||||||
| Operated prepayment liability |
1,201 | 11,553 | ||||||
|
|
|
|
|
|||||
| Total current liabilities |
132,938 | 60,764 | ||||||
|
|
|
|
|
|||||
| Long-term liabilities: |
||||||||
| Long-term debt |
406,822 | 140,506 | ||||||
| Leasehold payable |
1,675 | 106 | ||||||
| Restricted units |
36,306 | 3,400 | ||||||
| Other long-term liabilities |
3,422 | 2,004 | ||||||
|
|
|
|
|
|||||
| Total liabilities |
581,163 | 206,780 | ||||||
| Members’ capital |
298,647 | 138,191 | ||||||
|
|
|
|
|
|||||
| Total liabilities and members’ capital |
$ | 879,810 | $ | 344,971 | ||||
|
|
|
|
|
|||||
See accompanying Notes to Consolidated Financial Statements.
F-32
Table of Contents
Index to Financial Statements
RICE DRILLING B LLC AND SUBSIDIARIES
CONSOLIDATED STATEMENTS OF OPERATIONS
| Years Ended December 31, | ||||||||||||
| (in thousands) | 2013 | 2012 | 2011 | |||||||||
| Revenues: |
||||||||||||
| Natural gas sales |
$ | 87,847 | $ | 26,743 | $ | 13,972 | ||||||
| Other revenue |
757 | 457 | — | |||||||||
|
|
|
|
|
|
|
|||||||
| Total revenues |
88,604 | 27,200 | 13,972 | |||||||||
| Operating expenses: |
||||||||||||
| Lease operating |
8,309 | 3,688 | 1,617 | |||||||||
| Gathering, compression and transportation |
9,774 | 3,754 | 540 | |||||||||
| Production taxes and impact fees |
1,629 | 1,382 | — | |||||||||
| Exploration |
9,951 | 3,275 | 660 | |||||||||
| Restricted unit expense |
32,906 | — | 170 | |||||||||
| General and administrative |
16,953 | 7,599 | 5,208 | |||||||||
| Depreciation, depletion and amortization |
32,815 | 14,149 | 5,981 | |||||||||
| Write-down of abandoned leases |
— | 2,253 | 109 | |||||||||
| Loss from sale of interest in gas properties |
4,230 | — | (1,478 | ) | ||||||||
|
|
|
|
|
|
|
|||||||
| Total operating expenses |
116,567 | 36,100 | 12,807 | |||||||||
|
|
|
|
|
|
|
|||||||
| Operating income (loss) |
(27,963 | ) | (8,900 | ) | 1,165 | |||||||
|
|
|
|
|
|
|
|||||||
| Other income (expense): |
||||||||||||
| Interest expense |
(17,915 | ) | (3,487 | ) | (531 | ) | ||||||
| Other income (expense) |
(357 | ) | 112 | 161 | ||||||||
| Gain (loss) on derivative instruments |
6,891 | (1,381 | ) | 574 | ||||||||
| Amortization of deferred financing costs |
(5,230 | ) | (7,220 | ) | (2,675 | ) | ||||||
| Loss on extinguishment of debt |
(10,622 | ) | — | — | ||||||||
| Equity in income of joint ventures |
19,420 | 1,532 | 370 | |||||||||
|
|
|
|
|
|
|
|||||||
| Total other income (expense) |
(7,813 | ) | (10,444 | ) | (2,101 | ) | ||||||
|
|
|
|
|
|
|
|||||||
| Net loss |
$ | (35,776 | ) | $ | (19,344 | ) | $ | (936 | ) | |||
|
|
|
|
|
|
|
|||||||
See accompanying Notes to Consolidated Financial Statements.
F-33
Table of Contents
Index to Financial Statements
RICE DRILLING B LLC AND SUBSIDIARIES
CONSOLIDATED STATEMENTS OF CASH FLOWS
| Years Ended December 31, | ||||||||||||
| (in thousands) | 2013 | 2012 | 2011 | |||||||||
| Cash flows from operating activities: |
||||||||||||
| Net loss |
$ | (35,776 | ) | $ | (19,344 | ) | $ | (936 | ) | |||
| Adjustments to reconcile net loss to net cash provided by (used in) operating activities: |
||||||||||||
| Depreciation, depletion and amortization |
32,815 | 14,149 | 5,981 | |||||||||
| Amortization of deferred financing costs |
5,230 | 7,220 | 2,675 | |||||||||
| Loss (gain) from sale of interest in gas properties |
4,230 | — | (1,478 | ) | ||||||||
| Restricted unit expense |
32,906 | — | 170 | |||||||||
| Write-off of unsuccessful exploratory well costs |
8,143 | — | — | |||||||||
| Derivative instruments fair value (gain) loss |
(6,891 | ) | 1,381 | (574 | ) | |||||||
| Equity in income of joint ventures |
(19,420 | ) | (1,532 | ) | (370 | ) | ||||||
| Write-down of abandoned leases and other leasehold costs |
— | 2,253 | 109 | |||||||||
| (Increase) decrease in: |
||||||||||||
| Accounts receivable |
(17,208 | ) | (3,828 | ) | (4,310 | ) | ||||||
| Receivable from affiliate |
9,635 | (8,403 | ) | (76 | ) | |||||||
| Gas collateral account |
643 | (4,137 | ) | (207 | ) | |||||||
| Prepaid expenses and other |
(541 | ) | (212 | ) | 73 | |||||||
| Cash receipts for settled derivatives |
676 | 879 | 574 | |||||||||
| Increase (decrease) in: |
||||||||||||
| Accounts payable |
2,273 | (30 | ) | (125 | ) | |||||||
| Royalties payable |
7,432 | 775 | 1,117 | |||||||||
| Other accrued expenses |
5,859 | 7,391 | 746 | |||||||||
| Payable to affiliate |
3,666 | 424 | 1,762 | |||||||||
|
|
|
|
|
|
|
|||||||
| Net cash provided by (used in) operating activities |
33,672 | (3,014 | ) | 5,131 | ||||||||
|
|
|
|
|
|
|
|||||||
| Cash flows from investing activities: |
||||||||||||
| Capital expenditures for natural gas properties |
(463,128 | ) | (109,149 | ) | (69,077 | ) | ||||||
| Investment in joint ventures |
— | (9,957 | ) | (15,205 | ) | |||||||
| Capital expenditures for property and equipment |
(2,259 | ) | (867 | ) | (673 | ) | ||||||
| Proceeds from sale of interest in gas properties |
6,792 | — | 5,710 | |||||||||
|
|
|
|
|
|
|
|||||||
| Net cash used in investing activities |
(458,595 | ) | (119,973 | ) | (79,245 | ) | ||||||
|
|
|
|
|
|
|
|||||||
| Cash flows from financing activities: |
||||||||||||
| Proceeds from borrowings |
435,500 | 44,361 | 82,972 | |||||||||
| Repayments of debt obligations |
(160,760 | ) | (10,152 | ) | (7,726 | ) | ||||||
| Restricted cash for convertible debt |
(8,268 | ) | — | — | ||||||||
| Debt issuance costs |
(12,194 | ) | (1,913 | ) | (9,699 | ) | ||||||
| Capital contributions |
195,977 | 96,782 | 7,900 | |||||||||
| Repurchase of restricted units |
(2,267 | ) | (1,133 | ) | — | |||||||
| Return of capital |
— | (800 | ) | — | ||||||||
|
|
|
|
|
|
|
|||||||
| Net cash provided by financing activities |
447,988 | 127,145 | 73,447 | |||||||||
|
|
|
|
|
|
|
|||||||
| Net increase (decrease) in cash |
23,065 | 4,158 | (667 | ) | ||||||||
| Cash at the beginning of the year |
8,547 | 4,389 | 5,056 | |||||||||
|
|
|
|
|
|
|
|||||||
| Cash at the end of the year |
$ | 31,612 | $ | 8,547 | $ | 4,389 | ||||||
|
|
|
|
|
|
|
|||||||
| Supplemental disclosure of noncash investing and financing activities |
||||||||||||
| Capital expenditures for natural gas properties financed by accounts payable |
$ | 48,615 | $ | 18,083 | $ | 10,529 | ||||||
| Capital expenditures for natural gas properties financed by other accrued liabilities |
16,753 | 2,359 | 5,936 | |||||||||
| Natural gas properties financed through borrowings |
— | 18,328 | 1,016 | |||||||||
| Accretion of debt discount |
2,099 | — | — | |||||||||
| Gas collateral financed by accounts payable |
— | 1,500 | — | |||||||||
| Capital expenditures for property, office furniture and equipment funded by capital lease borrowings |
1,557 | 419 | — | |||||||||
| Property and equipment financed through borrowings |
503 | 1,270 | — | |||||||||
| Natural gas properties financed through deferred payment obligations |
20,281 | 3,577 | 5,314 | |||||||||
| Natural gas properties financed through other liabilities |
— | 8,261 | — | |||||||||
| Application of advances from joint interest owners |
(10,415 | ) | — | — | ||||||||
| Warrants issued in exchange for services |
— | — | 3,294 | |||||||||
| Conversion of related-party note payable to equity |
255 | 11,332 | — | |||||||||
See accompanying Notes to Consolidated Financial Statements.
F-34
Table of Contents
Index to Financial Statements
RICE DRILLING B LLC AND SUBSIDIARIES
CONSOLIDATED STATEMENTS OF MEMBERS’ CAPITAL
YEARS ENDED DECEMBER 31, 2013, 2012 AND 2011
| (in thousands) | Preferred Units |
Warrants | Accumulated Deficit |
Total | ||||||||||||
| Balance as of December 31, 2010 |
$ | 45,615 | $ | — | $ | (9,052 | ) | $ | 36,563 | |||||||
| Capital contributions |
7,900 | — | — | 7,900 | ||||||||||||
| Issuance of warrants |
— | 3,294 | — | 3,294 | ||||||||||||
| Net loss |
— | — | (936 | ) | (936 | ) | ||||||||||
|
|
|
|
|
|
|
|
|
|||||||||
| Balance as of December 31, 2011 |
53,515 | 3,294 | (9,988 | ) | 46,821 | |||||||||||
| Capital contributions, net |
100,182 | — | — | 100,182 | ||||||||||||
| Return of capital |
(800 | ) | — | — | (800 | ) | ||||||||||
| Conversion of related-party notes payable |
11,332 | — | — | 11,332 | ||||||||||||
| Net loss |
— | — | (19,344 | ) | (19,344 | ) | ||||||||||
|
|
|
|
|
|
|
|
|
|||||||||
| Balance as of December 31, 2012 |
164,229 | 3,294 | (29,332 | ) | 138,191 | |||||||||||
| Capital contributions, net |
196,232 | — | — | 196,232 | ||||||||||||
| Net loss |
— | — | (35,776 | ) | (35,776 | ) | ||||||||||
|
|
|
|
|
|
|
|
|
|||||||||
| Balance as of December 31, 2013 |
$ | 360,461 | $ | 3,294 | $ | (65,108 | ) | $ | 298,647 | |||||||
|
|
|
|
|
|
|
|
|
|||||||||
See accompanying Notes to Consolidated Financial Statements.
F-35
Table of Contents
Index to Financial Statements
RICE DRILLING B LLC AND SUBSIDIARIES
NOTES TO CONSOLIDATED FINANCIAL STATEMENTS
| 1. | Summary of Significant Accounting Policies and Related Matters |
Organization, Operations and Principles of Consolidation
The consolidated financial statements of the Company include the accounts of Rice Drilling B LLC (“the Company” or “Rice Drilling B”) and its wholly owned subsidiaries, Rice Drilling C LLC (“Rice C”), Rice Drilling D LLC (“Rice D”), RDB Real Estate Holdings LLC (“RDB Real Estate”), Blue Tiger Oilfield Services LLC (“Blue Tiger”), Rice Poseidon Midstream LLC (“Rice PM”), and Rice Olympus Midstream LLC (“Rice OM”). All significant intercompany accounts have been eliminated in consolidation.
The Company was organized as a Delaware limited liability company on February 12, 2008. Prior to the Company’s amended and restated LLC agreement dated November 13, 2009, Rice Energy Family Holdings, LP (formerly known as Rice Energy Limited Partnership) (“Rice Partners”) was the Company’s sole member. Effective November 13, 2009, separate classes of restricted units were authorized (see Note 9).
On January 25, 2012, Rice Partners, the sole owner of the Company’s preferred units and owner of 90% of the total units outstanding in the Company, assigned its preferred units in the Company to its wholly owned subsidiary, Rice Energy Appalachia LLC (“REA”). Concurrent with Rice Partners’ assignment of its units to REA, REA and Natural Gas Partners (“NGP”), a private equity firm, finalized a $100.0 million equity commitment to REA from NGP of which $75 million of NGP’s commitment was funded at closing on January 25, 2012. Cash proceeds from the investments were contributed by REA to Rice Drilling B. NGP received a put right with respect to their equity investment at REA which was contingently exercisable upon the occurrence of certain events. The earliest date that this put right could have been exercised is January 25, 2017. The fair value of this put right was de minimis given the accretion in fair value of REA. In conjunction with the equity investment in NGP, Daniel J. Rice III converted his outstanding promissory notes into equity of REA. On August 30, 2012, NGP funded the remaining $25 million of its commitment at REA.
During the year ended December 31, 2013, REA finalized a $300 million equity commitment from NGP, of which approximately $200 million was funded in April 2013 and contributed to Rice Drilling B. Cash proceeds from the investment were used to partially fund our Utica Shale leasehold acquisitions in southeastern Ohio. NGP’s equity commitments terminated in connection with the closing of the Rice Energy Inc. (“Rice Energy”) initial public offering (“IPO”).
In October 2013, Rice Energy was formed as a Delaware corporation for the purpose of becoming a publicly traded company and the holding company of Rice Drilling B. The historical financial information contained in this report relates to periods that ended prior to the completion of the IPO of Rice Energy. Consequently, the consolidated financial statements and notes thereto pertain to Rice Drilling B. In connection with the completion of its IPO on January 29, 2014, Rice Energy became a holding company whose sole material asset consists of a 100% indirect ownership interest in Rice Drilling B. As the sole managing member of Rice Drilling B, Rice Energy is responsible for all operational, management and administrative decisions relating to Rice Drilling B’s business and for periods subsequent to January 29, 2014, will consolidate the financial results of Rice Drilling B and its subsidiaries.
Rice Drilling B is the operating company of Rice Energy and as such is engaged in the acquisition, exploration, and development of natural gas properties in the Appalachian Basin.
Use of Estimates
The preparation of consolidated financial statements in conformity with U.S. generally accepted accounting principles requires management to make estimates and assumptions that affect the reported amounts of assets and
F-36
Table of Contents
Index to Financial Statements
liabilities and disclosure of contingent assets and liabilities at the dates of the consolidated financial statements and the reported amounts of revenues and expenses during the reporting periods. Actual results could differ from those estimates and changes in these estimates are recorded when known.
Revenue Recognition
Sales of natural gas are recognized when natural gas has been delivered to a custody transfer point, persuasive evidence of a sales arrangement exists, the rights and responsibility of ownership pass to the purchaser upon delivery, collection of revenue from the sale is reasonably assured, and the sales price is fixed or determinable. Natural gas is sold by the Company under contracts with the Company’s natural gas marketers. Pricing provisions are tied to the Platts Gas Daily market prices.
Cash
The Company maintains cash at financial institutions which may at times exceed federally insured amounts and which may at times significantly exceed consolidated balance sheet amounts due to outstanding checks. The Company has no other accounts that are considered cash equivalents.
Accounts Receivable
Accounts receivable are primarily from the Company’s two gas marketers. The Company extends credit to parties in the normal course of business based upon management’s assessment of their creditworthiness. A valuation allowance is provided for those accounts for which collection is estimated as doubtful; uncollectible accounts are written off and charged against the allowance. In estimating the allowance, management considers, among other things, how recently and how frequently payments have been received and the financial position of the party. There was no allowance recorded for any of the periods presented in the consolidated financial statements. Accounts receivable as of December 31, 2013 and 2012 are detailed below.
| December 31, | ||||||||
| (in thousands) | 2013 | 2012 | ||||||
| Natural gas sales |
$ | 16,534 | $ | 5,564 | ||||
| Joint interest |
6,391 | 1,810 | ||||||
| Other |
8,840 | 1,183 | ||||||
|
|
|
|
|
|||||
| Total accounts receivable |
$ | 31,765 | $ | 8,557 | ||||
|
|
|
|
|
|||||
Investments in Joint Ventures
The Company accounts for its oilfield service company joint venture investment and for periods prior to the completion of the Marcellus JV Buy-In accounted for our Marcellus joint venture investment, under the equity method of accounting as we have significant influence, but not control, over the joint ventures as of December 31, 2013.
Under the equity method of accounting, investments are carried at cost, adjusted for the Company’s proportionate share of the undistributed earnings or losses and reduced for any distributions from the investment. The Company also evaluates its equity method investments for potential impairment whenever events or changes in circumstances indicate that there is an other-than-temporary decline in value of the investment. Such events may include sustained operating losses by the investee or long-term negative changes in the investee’s industry. These indicators were not present, and as a result, the Company did not recognize any impairment charges related to its equity method investments for any of the periods presented in the consolidated financial statements.
On January 29, 2014, in connection with the closing of the IPO and pursuant to the Transaction Agreement between it and Alpha Holdings dated as of December 6, 2013 (the “Transaction Agreement”), Rice Energy
F-37
Table of Contents
Index to Financial Statements
completed its acquisition of Alpha Holdings’ 50% interest in its Marcellus joint venture (“Marcellus JV Buy-In”) in exchange for total consideration of $322 million, consisting of $100 million of cash and its issuance to Alpha Holdings of 9,523,810 shares of our common stock. See Note 15 for additional information.
Natural Gas Properties
The Company uses the successful efforts method of accounting for gas-producing activities. Costs to acquire mineral interests in gas properties, to drill and equip exploratory wells that result in proved reserves, are capitalized. Costs to drill exploratory wells that do not identify proved reserves as well as geological and geophysical costs and costs of carrying and retaining unproved properties are expensed. The Company wrote off approximately $8.1 million of costs associated with the drilling of the Bigfoot 7H in the fourth quarter of 2013.
Unproved gas properties that are individually significant are periodically assessed for impairment of value, and a loss is recognized at the time of impairment by providing an impairment allowance. Capitalized costs of producing gas properties and support equipment directly related to such properties, after considering estimated residual salvage values, are depreciated and depleted by the units of production method. Support equipment and other property and equipment not directly related to gas properties are depreciated over their estimated useful lives.
Management’s estimates of proved reserves are based on quantities of natural gas that engineering and geological analysis demonstrates, with reasonable certainty, to be recoverable from established reservoirs in the future under current operating and economic conditions. External engineers prepare the annual reserve and economic evaluation of all properties on a well-by-well basis. Additionally, the Company adjusts natural gas reserves for major well rework or abandonment during the year as needed. The process of estimating and evaluating natural gas reserves is complex, requiring significant decisions in the evaluation of available geological, geophysical, engineering, and economic data. The data for a given property may also change substantially over time as a result of numerous factors, including additional development activity, evolving production history and a continual reassessment of the viability of production under changing economic conditions. As a result, revisions in existing reserve estimates occur from time to time. Although every reasonable effort is made to ensure that reserve estimates represent the Company’s most accurate assessments possible, the subjective decisions and variances in available data for various properties increase the likelihood of significant changes in these estimates over time. Because estimates of reserves significantly affect the Company’s depreciation, depletion, and amortization expense, a change in the Company’s estimated reserves could have a material effect on the Company’s operating results.
On the sale of an entire interest in an unproved property for cash, a gain or loss on the sale is recognized, taking into consideration the amount of any recorded impairment if the property had been assessed individually. If a partial interest in an unproved property is sold, the amount received is treated as a reduction of the cost of the interest retained unless the proceeds received are in excess of the cost basis which would result in gain on sale.
Interest
The Company capitalizes interest on expenditures for significant exploration and development projects while activities are in progress to bring the assets to their intended use. Upon completion of construction of the asset, the associated capitalized interest costs are included within our asset base and depleted accordingly. The following table summarizes the components of the Company’s interest incurred for the periods indicated (in thousands):
| 2013 | 2012 | 2011 | ||||||||||
| Interest incurred: |
||||||||||||
| Interest capitalized |
$ | 8,034 | $ | 7,695 | $ | 5,405 | ||||||
| Interest expensed |
17,915 | 3,487 | 531 | |||||||||
|
|
|
|
|
|
|
|||||||
| Total incurred |
$ | 25,949 | $ | 11,182 | $ | 5,936 | ||||||
|
|
|
|
|
|
|
|||||||
F-38
Table of Contents
Index to Financial Statements
Property and Equipment
Property and equipment are recorded at cost and are being depreciated over estimated useful lives of three to forty years on a straight-line basis. Accumulated depreciation was $1.3 million and $0.6 million at December 31, 2013 and 2012, respectively. Depreciation expense was $0.7 million, $0.6 million and $0.1 million for the years ended December 31, 2013, 2012 and 2011, respectively, and is included in depreciation, depletion, and amortization expense in the accompanying statements of consolidated operations.
Long-Lived Assets
Long-lived assets to be held and used or disposed of other than by sale are reviewed for impairment whenever events or changes in circumstances indicate that the carrying amount may not be recoverable. When required, impairment losses on assets to be held and used or disposed other than by sale are recognized based on the fair value of the asset. Long-lived assets to be disposed of by sale are reported at the lower of their carrying amount or fair value less selling costs.
Deferred Financing Costs
Deferred financing costs are amortized on a straight-line basis, which approximates the interest method, over the term of the related agreement. Accumulated amortization was $14.3 million and $9.9 million at December 31, 2013 and 2012, respectively. Amortization expense was $5.2 million , $7.2 million and $2.7 million for the years ended December 31, 2013, 2012 and 2011, respectively. The annual amortization of deferred financing costs for years subsequent to December 31, 2013, is expected to be approximately $1.9 million in 2014, $1.9 million in 2015, $1.9 million in 2016, $1.9 million in 2017 and $1.1 million in 2018.
Delay Rental Agreements
The Company has leased drilling rights under agreements which specify additional payments for the privilege of deferring drilling operations for another year. Costs incurred to extend such agreements were $1.6 million and $3.1 million for the years ended December 31, 2013 and 2012, respectively.
Asset Retirement Obligations
The Company records the fair value of a legal liability for an asset retirement obligation in the period in which it is incurred. For gas properties, this is the period in which a gas well is acquired or drilled. The Company’s retirement obligations relate to the abandonment of gas-producing facilities and include costs to reclaim drilling sites and dismantle and relocate or dispose of gathering systems, wells, and related structures. Estimates are based on historical experience in plugging and abandoning wells and estimated remaining lives of those wells based on reserve estimates.
When a new liability is recorded, the Company capitalizes the costs of the liability by increasing the carrying amount of the related long-lived asset. The liability is accreted to its present value each period and the capitalized cost is depreciated over the units of production basis.
Equity Incentives
The cost of employee and consultant services received in exchange for an award of equity instruments, such as restricted units, is measured based on the fair value of those instruments. Management established an estimated fair value for issued units based upon an income approach prior to December 31, 2013. At December 31, 2013, in connection with the IPO, a market approach was used. The restricted units are subject to a call option held by the Company which requires liability accounting for the restricted units. Details related to the restricted units are included in Notes 8 and 9.
F-39
Table of Contents
Index to Financial Statements
Income Taxes
The Company is treated as a partnership for federal and state income tax purposes. Consequently, the Company is not subject to income taxes; instead its members include the income in their tax returns.
Reclassifications
Certain reclassifications have been made to prior periods’ financial information related to post production costs, restricted unit liability and asset retirement obligations to conform to the 2013 presentation.
Correction of Errors
The Company’s net income for the year ended December 31, 2012 included expense of approximately $1.7 million that related to prior periods. These corrections resulted in additional exploration expense of approximately $1.1 million, lease operating expense of $0.5 million, and other expense of $0.1 million recorded in 2012. These errors were not material to prior periods, individually or in the aggregate, and were not material to the 2012 period. These errors did not impact debt covenant compliance nor distort operating results. Therefore, these items were corrected in fiscal 2012.
| 2. | Capitalized Costs Relating to Gas-Producing Activities |
Proved and unproved capitalized costs related to the Company’s gas-producing activities are as follows (in thousands):
| 2013 | 2012 | |||||||
| Capitalized costs: |
||||||||
| Unproved properties |
$ | 457,836 | $ | 111,030 | ||||
| Proved, producing properties |
244,771 | 119,374 | ||||||
| Proved, nonproducing properties |
78,441 | 61,434 | ||||||
|
|
|
|
|
|||||
| Total |
781,048 | 291,838 | ||||||
| Accumulated depreciation, depletion and amortization |
52,689 | 20,820 | ||||||
|
|
|
|
|
|||||
| Net capitalized costs |
$ | 728,359 | $ | 271,018 | ||||
|
|
|
|
|
|||||
| Entity’s share of equity method investees’ net capitalized costs |
$ | 91,166 | $ | 57,110 | ||||
|
|
|
|
|
|||||
| 3. | Sale of Interests in Gas Properties |
In December 2013, the Company agreed to sell interests in noncore assets in Guernsey County, Ohio and Lycoming County, Pennsylvania in two separate transactions. The Company agreed to sell an undivided 75.0% interest in certain of its Guernsey County leaseholds (representing approximately 2,136 net acres) to a third party in exchange for approximately $22.0 million, consisting of $11.0 million in cash and an $11.0 million carried working interest. Of the 2,136 net acres, 1,033 net acres closed subsequent to December 31, 2013. No gain or loss was recorded on this transaction.
In addition, the Company sold all of its Lycoming County acreage (100% non-operated) and related assets to another third party in exchange for $7.0 million of which $6.0 million will be paid on or before April 30, 2014. This receivable is included in accounts receivable on the accompanying consolidated balance sheet. There was no production or net proved reserves attributable to the interests sold in either transaction. The Company incurred a loss of $4.2 million in the fourth quarter of 2013 as a result of this transaction.
In March 2011, the Company entered into a joint operating agreement with US Energy Development Corporation (US Energy) covering those certain properties whereby the Company sold a 50% non-operated working interest in the properties to US Energy. Subsequent to this transaction, the Company owns a 50%
F-40
Table of Contents
Index to Financial Statements
working interest in approximately 1,000 acres in the Whipkey field and has retained operatorship. The Company received cash consideration of $1.7 million and recorded a gain of $1.5 million on this transaction in the accompanying consolidated statements of operations.
| 4. | Long-Term Debt |
Long-term debt consists of the following as of December 31, 2013 and 2012 (in thousands):
| Description | December 31, 2013 | December 31, 2012 | ||||||
| Long-term Debt |
||||||||
| Debentures (a) |
$ | 6,890 | $ | 60,000 | ||||
| Wells Fargo Energy Capital Credit Facility (b) |
— | 70,000 | ||||||
| Second Lien Term Loan Facility (c) |
293,821 | — | ||||||
| NPI Note (d) |
8,028 | 15,282 | ||||||
| Senior Secured Revolving Credit Facility (e) |
115,000 | — | ||||||
| Other |
3,203 | 4,038 | ||||||
|
|
|
|
|
|||||
| Total debt |
$ | 426,942 | $ | 149,320 | ||||
| Less current portion |
20,120 | 8,814 | ||||||
|
|
|
|
|
|||||
| Long-term debt |
$ | 406,822 | $ | 140,506 | ||||
|
|
|
|
|
|||||
Debentures (a)
In June of 2011, the Company sold $60.0 million of its 12% Senior Subordinated Convertible Debentures due 2014 (“the Debentures”) in a private placement to certain accredited investors as defined in Rule 501 of Regulation D. The Debentures accrue interest at 12% per year payable monthly in arrears by the 15th day of the month and mature on July 31, 2014 (“Maturity Date”). The Debentures are the Company’s unsecured senior obligations and rank equally with all of the Company’s current and future senior unsecured indebtedness.
From July 31, 2013 through August 20, 2013 (“the put redemption period”), any holder of Debentures had the right to cause the Company to repurchase all or any portion of the Debentures owned by such holder at 100% of the portion of the principal amount of the Debentures as to which the right was being exercised, plus a premium of 20%. During the put redemption period, the Company repurchased $53.1 million of outstanding Debentures and paid a put premium of $10.6 million in accordance with the terms of the agreements. The put redemption period expired in the nine months ended September 30, 2013 and the Company recorded the premium of $10.6 million as a loss on extinguishment of debt in the statement of consolidated operations for the year ended December 31, 2013.
At any time after July 31, 2013 until the Maturity Date, the Company has the right to redeem all, but not less than all, of the Debentures on 30 days prior written notice at a redemption price equal to 100% of the principal amount of the Debentures plus a premium of 50%. In connection with the IPO, the convertible debentures and warrants of Rice Drilling B were amended to become convertible or exercisable for an aggregate 1,671,800 shares of common stock of Rice Energy Inc. Through March 10, 2014, approximately $5.0 million of the convertible debentures had been converted into 433,073 shares of Rice Energy Inc. common stock. On February 28, 2014, the Company issued a call notice on the remaining convertible debentures, requiring a response by March 30, 2014. Amounts not converted by the redemption date will receive a cash payment from the Company of 100% of the principal amount plus a premium of 50%, which could result in additional costs of $1.0 million if all remaining convertible debentures are redeemed. As the principal amount of the convertible debentures outstanding has been reduced to less than $5.0 million, the Company is no longer required to maintain restricted cash.
In connection with the convertible debt offering, Rice Drilling B granted warrants that were issued on August 15, 2011, to certain of the broker-dealers involved in the private placement. These warrants are
F-41
Table of Contents
Index to Financial Statements
considered to be separate instruments issued solely in lieu of cash compensation for services provided by the broker-dealers. Two separate classes of warrants were issued (Normal and Bonus), the sole difference being the exercise price.
The fair value of these warrants at the date of grant was estimated using the Black-Scholes valuation model with the following assumptions:
| Dividend yield |
— | % | ||
| Expected volatility |
72.1 | % | ||
| Risk-free rate |
0.96 | % | ||
| Expected life |
5 years | |||
| “Normal” warrant |
||||
| Number of warrants issued |
1,044 | |||
| Exercise price |
$ | 10,000 | ||
| Grant date fair value, per unit |
$ | 2,569 | ||
| Weighted average contractual life |
5 years | |||
| “Bonus” warrant |
||||
| Number of warrants issued |
192 | |||
| Exercise price |
$ | 6,250 | ||
| Grant date fair value, per unit |
$ | 3,184 | ||
| Weighted average contractual life |
5 years | |||
The fair value of $3.3 million of the above warrants were recorded as a deferred financing cost during the year ended December 31, 2011, and were amortized over the term of the Debentures. Subsequent to December 31, 2013, two warrants had been exercised in exchange for 1,728 shares of Rice Energy Inc. common stock. If all warrants are exercised approximately 1.1 million shares of Rice Energy Inc. common stock would be issued.
Wells Fargo Energy Capital Credit Facility (b)
In November of 2012, the Company amended and restated its then existing credit facility with Wells Fargo. In connection with the amendment and restatement, a lender was added to the new facility. The amendment and restatement was accounted for as a modification of the debt, resulting in $0.2 million of third-party costs associated with the amendment and restatement being expensed. The Wells Fargo Energy Capital Credit Facility (“Wells Fargo Energy Capital Credit Facility”) was subject to a maximum borrowing base equal to $200.0 million, as determined unanimously by Wells Fargo Energy Capital, in accordance with customary lending practices. This loan was repaid using proceeds from the Second Lien Term Loan Facility during the second quarter of 2013.
Second Lien Term Loan Facility (c)
On April 25, 2013, the Company entered into a Second Lien Term Loan Facility (“Second Lien Term Loan Facility”) with Barclays Bank PLC, as administrative agent, and a syndicate of lenders in an aggregate principal amount of $300.0 million. The Company estimated the discount on issuance of this instrument based upon an estimate of market rates at the inception of the instrument and recorded a discount of $4.5 million. The discount is being amortized over the life of the note using an effective interest rate of 0.284% using the effective yield method. As of December 31, 2013, the Company had a balance of $293.8 million relating to the Second Lien Term Loan Facility, this includes borrowings outstanding of $297.7 million less a discount of $3.9 million. The Second Lien Term Loan Facility matures October 25, 2018. Approximately $7.3 million in fees were capitalized in connection with the Second Lien Term Loan Facility.
F-42
Table of Contents
Index to Financial Statements
Principal amounts borrowed under the Second Lien Term Loan Facility are payable in an amount equal to 0.25% of the initial principal amount at the end of each quarter with the remainder payable on the maturity date. Interest is payable in arrears at the end of each quarter and on the maturity date. The Company has the choice to borrow in Eurodollars or at the base rate. Eurodollar loans bear interest at a rate per annum equal to LIBOR plus 725 basis points. Base rate loans bear interest at a rate per annum equal to the greatest of (i) 2.25%, (ii) the agent bank’s reference rate, (iii) the federal funds effective rate plus 50 basis points and (iv) the rate for one month Eurodollar loans plus 100 basis points, plus 625 basis points. The Company may prepay the borrowings under the Second Lien Term Loan Facility at any time, provided that any prepayments of principal amounts during the first year following the closing date are subject to a 2% premium and any prepayments of principal during the second year following the closing date are subject to 1% premium. The interest rate was 8.5% as of December 31, 2013.
The Second Lien Term Loan Facility is secured by liens on substantially all of the Company’s properties that are subordinated to the liens securing the revolving credit facility and guarantees from the Company’s subsidiaries other than any subsidiary that have been designated as an unrestricted subsidiary. The Second Lien Term Loan Facility contains restrictive covenants that may limit the Company’s ability to, among other things:
| • | incur additional indebtedness; |
| • | sell assets; |
| • | withdraw funds from specified restricted account; |
| • | make loans to others; |
| • | make investments; |
| • | enter into mergers; |
| • | make or declare dividends; |
| • | hedge future production or interest rates; |
| • | incur liens; and |
| • | engage in certain other transactions without the prior consent of the lenders. |
The Second Lien Term Loan Facility also requires the Company to maintain an asset coverage ratio, which is the ratio of the present value of oil and gas reserves (discounted at 10% per annum) to the sum of all secured debt (including any debt incurred by the Company’s Marcellus joint venture under its credit facility or any replacement or refinancing of its credit facility) of not less than 1.5 to 1.0.
The Company was in compliance with such covenants and ratios as of December 31, 2013.
NPI Note (d)
In November of 2012, in connection with the amendment of the Wells Fargo Credit Facility, the Company repurchased the NPI it had previously assigned to Wells Fargo for $26.5 million, of which $9.5 million was paid at the closing of the Wells Fargo Energy Capital Credit Facility and $17.0 million was financed by a note to Wells Fargo. The Company accounted for this as the acquisition of a mineral right and therefore capitalized this amount in proved properties and will amortize using the units of production method. There is no stated interest rate associated with this note and as a result, this note was considered to have below market financing rates. The Company estimated the discount on issuance of this instrument based upon an estimate of market rates at the inception of the instrument and recorded a discount of $2.0 million. The discount is being amortized over the life of the note using an effective interest rate of 12.10% using the effective yield method. As part of the use of proceeds from the Second Lien Term Loan Facility, the Company repaid $8.5 million of this note during the second quarter of 2013. A final payment of $8.5 million is due to be repaid in June of 2014.
F-43
Table of Contents
Index to Financial Statements
Senior Secured Revolving Credit Facility (e)
On April 25, 2013, the Company entered into a revolving credit facility with Wells Fargo Bank, N.A., as administrative agent, and a syndicate of lenders with a maximum credit amount of $500.0 million and a sublimit for letters of credit of $10.0 million. As of December 31, 2013, the sublimit for the letters of credit was $100.0 million. The amount available to be borrowed under the revolving credit facility is subject to a borrowing base that is redetermined semiannually as of each January 1 and July 1 and depends on the volumes of our proved oil and gas reserves and estimated cash flows from these reserves and our commodity hedge positions. The next redetermination is scheduled to occur in April 2014. As of December 31 2013, the borrowing base was $200.0 million. As of December 31, 2013, we had $115.0 million in borrowings and approximately $22.5 million in letters of credit outstanding under our revolving credit facility. The revolving credit facility matures April 25, 2018.
Principal amounts borrowed are payable on the maturity date, and interest is payable quarterly for base rate loans and at the end of the applicable interest period for Eurodollar loans. The Company has a choice of borrowing in Eurodollars or at the base rate. Eurodollar loans bear interest at a rate per annum equal to LIBOR plus an applicable margin ranging from 175 to 275 basis points, depending on the percentage of our borrowing base utilized. Base rate loans bear interest at a rate per annum equal to the greatest of (i) the agent bank’s reference rate, (ii) the federal funds effective rate plus 50 basis points and (iii) the rate for one month Eurodollar loans plus 100 basis points, plus an applicable margin ranging from 75 to 175 basis points, depending on the percentage of our borrowing base utilized. The Company may repay any amounts borrowed prior to the maturity date without any premium or penalty other than customary LIBOR breakage costs. The weighted average interest rate was 2.39% as of December 31, 2013.
The credit facility is secured by liens on substantially all of the properties of the Company and guarantees from its subsidiaries other than any subsidiary that we have designated as an unrestricted subsidiary. The credit facility contains restrictive covenants that may limit our ability to, among other things:
| • | incur additional indebtedness; |
| • | sell assets; |
| • | make loans to others; |
| • | make investments; |
| • | enter into mergers; |
| • | make or declare dividends; |
| • | hedge future production or interest rates; |
| • | incur liens; and |
| • | engage in certain other transactions without the prior consent of the lenders. |
The credit facility also requires the Company to maintain the following three financial ratios, which are measured at the end of each calendar quarter:
| • | a current ratio, which is the ratio of the Company’s consolidated current assets (includes unused commitment under the credit facility and excludes derivative assets) to its consolidated current liabilities, of not less than 0.75 to 1.0 as of March 31, 2013 and 1.0 to 1.0 at the end of each fiscal quarter thereafter; |
| • | a minimum interest coverage ratio, which is the ratio of consolidated EBITDAX based on the trailing twelve month period to consolidated interest expense, of not less than 2.5 to 1.0; and |
| • | an asset coverage ratio, which is the ratio of the present value of the Company’s oil and gas reserves (discounted at 10% per annum) to the sum of all our secured debt (including 50% of any debt incurred |
F-44
Table of Contents
Index to Financial Statements
| by the Company’s Marcellus joint venture under its credit facility or any replacement or refinancing of its credit facility) of not less than 1.5 to 1.0 so long as any debt is outstanding under the term loan facility. |
The Company was in compliance with such covenants and ratios as of December 31, 2013.
Concurrently with the closing of Rice Energy’s IPO, the Company amended its revolving credit facility to, among other things, increase the maximum commitment amount to $1.5 billion and lower the interest rate owed on amounts borrowed under the revolving credit facility. After giving effect to the amendment, the borrowing base under the credit facility was increased to $350 million as a result of the Marcellus JV Buy-In. Eurodollar loans under the amended revolving credit facility bear interest at a rate per annum equal to LIBOR plus an applicable margin ranging from 150 to 250 basis points, depending on the percentage of borrowing base utilized. Base rate loans bear interest at a rate per annum equal to the greatest of (i) the agent bank’s reference rate, (ii) the federal funds effective rate plus 50 basis points and (iii) the rate for one month Eurodollar loans plus 100 basis points, plus an applicable margin ranging from 50 to 150 basis points, depending on the percentage of borrowing base utilized. The Company will be subject to the same financial ratios and substantively the same restricted covenants as under the revolving credit facility prior to such amendment. The amended revolving credit facility will mature upon the earlier of the date that is five years following the closing of the amendment and the date that is 180 days prior to the maturity of the second lien term loan facility, if any amounts are outstanding under that facility as of such date.
Expected aggregate maturities of notes payable subsequent to December 31, 2013, are as follows (in thousands):
| 2014 |
$ | 20,120 | ||
| 2015 |
3,058 | |||
| 2016 |
2,277 | |||
| 2017 |
2,173 | |||
| 2018 |
399,314 | |||
|
|
|
|||
| Total |
$ | 426,942 | ||
|
|
|
Interest paid in cash was $27.7 million and $10.2 million for years ended December 31, 2013 and 2012, respectively. See Note 1 for information on capitalized interest.
| 5. | Fair Value of Financial Instruments |
The Company determines fair value on a recurring basis for its liability related to restricted units and recorded amounts for derivative instruments as these instruments are required to be recorded at fair value for each reporting amount. Certain amounts in the Company’s financial statements are measured at fair value on a nonrecurring basis including discounts associated with long-term debt. Fair value is based on quoted market prices, where available. If quoted market prices are not available, fair value is based upon models that use as inputs market-based parameters, including but not limited to forward curves, discount rates, broker quotes, volatilities, and nonperformance risk.
The Company has categorized its fair value measurements into a three-level fair value hierarchy, based on the priority of the inputs to the valuation technique. The fair value hierarchy gives the highest priority to quoted prices in active markets for identical assets and liabilities (Level 1) and the lowest priority to unobservable inputs (Level 3). The Company’s fair value measurements relating to restricted units are included in Level 3. The Company’s fair value measurements relating to derivative instruments are included in Level 2. Since the adoption of fair value accounting, the Company has not made any changes to its classification of financial instruments in each category.
F-45
Table of Contents
Index to Financial Statements
Items included in Level 3 are valued using internal models that use significant unobservable inputs. Items included in Level 2 are valued using management’s best estimate of fair value corroborated by third-party quotes.
The following liabilities were measured at fair value on a recurring basis during the period (refer to Notes 9 and 11 for details relating to the restricted units and derivative instruments) (in thousands):
| Fair Value Measurements at Reporting Date Using |
||||||||||||||||
| Description | December 31, 2013 |
Quoted Prices in Active Markets for Identical Assets (Level 1) |
Significant Other Observable Inputs (Level 2) |
Significant Unobservable Inputs (Level 3) |
||||||||||||
| Assets: |
||||||||||||||||
| Derivative Instruments, at fair value |
$ | 4,921 | $ | — | $ | 4,921 | $ | — | ||||||||
|
|
|
|
|
|
|
|
|
|||||||||
| Total assets |
$ | 4,921 | $ | — | $ | 4,921 | $ | — | ||||||||
|
|
|
|
|
|
|
|
|
|||||||||
| Liabilities: |
||||||||||||||||
| Restricted units, at fair value |
$ | 36,306 | $ | — | $ | — | $ | 36,306 | ||||||||
| Derivative Instruments, at fair value |
965 | — | 965 | — | ||||||||||||
|
|
|
|
|
|
|
|
|
|||||||||
| Total liabilities |
$ | 37,271 | $ | — | $ | 965 | $ | 36,306 | ||||||||
|
|
|
|
|
|
|
|
|
|||||||||
| Fair Value Measurements at Reporting Date Using |
||||||||||||||||
| Description | December 31, 2012 |
Quoted Prices in Active Markets for Identical Assets (Level 1) |
Significant Other Observable Inputs (Level 2) |
Significant Unobservable Inputs (Level 3) |
||||||||||||
| Liabilities: |
||||||||||||||||
| Restricted units, at fair value |
$ | 5,667 | $ | — | $ | — | $ | 5,667 | ||||||||
| Derivative Instruments, at fair value |
2,260 | — | 2,260 | — | ||||||||||||
|
|
|
|
|
|
|
|
|
|||||||||
| Total liabilities |
$ | 7,927 | $ | — | $ | 2,260 | $ | 5,667 | ||||||||
|
|
|
|
|
|
|
|
|
|||||||||
| Fair Value Measurements Using |
||||
| Significant Unobservable Inputs (Level 3) |
||||
| Balance at December 31, 2011 |
$ | 6,800 | ||
| Total gain or losses: |
||||
| Included in earnings |
115 | |||
| Transfers in and/or out of Level 3 |
— | |||
| Repurchase of restricted units |
(1,133 | ) | ||
| Settlement |
(115 | ) | ||
|
|
|
|||
| Balance at December 31, 2012 |
$ | 5,667 | ||
| Total gain or losses: |
||||
| Included in earnings |
32,906 | |||
| Transfers in and/or out of Level 3 |
— | |||
| Repurchase of restricted units |
(2,267 | ) | ||
| Settlement |
— | |||
|
|
|
|||
| Balance at December 31, 2013 |
$ | 36,306 | ||
|
|
|
|||
F-46
Table of Contents
Index to Financial Statements
Gains and losses related to restricted units included in earnings for the period are reported in operating expenses in the statements of consolidated operations.
The carrying value of cash equivalents approximates fair value due to the short maturity of the instruments.
The estimated fair value of long-term debt on the consolidated balance sheets at December 31, 2013 and 2012 is shown in the table below (refer to Note 4 for details relating to the borrowing arrangements) (in thousands). The fair value was estimated using Level 3 inputs based on rates reflective of the remaining maturity as well as the Company’s financial position.
| Description | 2013 | 2012 | ||||||
| Long-term debt, at fair value |
||||||||
| Debentures |
$ | 12,671 | $ | 70,220 | ||||
| Wells Fargo Energy Capital Credit Facility |
— | 70,000 | ||||||
| Second Lien Term Loan Facility |
315,284 | — | ||||||
| NPI Note |
8,028 | 15,282 | ||||||
| Senior Secured Revolving Credit Facility |
115,000 | — | ||||||
| Other |
3,203 | 4,038 | ||||||
|
|
|
|
|
|||||
| Total |
$ | 454,186 | $ | 159,540 | ||||
|
|
|
|
|
|||||
| 6. | Lease Obligations |
The Company leases drilling rights under agreements which expire at various times. The following represents the future minimum lease payments under the agreements as of December 31, 2013 (in thousands):
| 2014 |
$ | 18,606 | ||
| 2015 |
1,398 | |||
| 2016 |
153 | |||
| 2017 |
124 | |||
| 2018 and thereafter |
— | |||
|
|
|
|||
| Total future minimum lease payments |
$ | 20,281 | ||
|
|
|
These lease payments are included as leasehold payables in the accompanying consolidated balance sheets.
Additionally, the Company has leased drilling rights under agreements which specify additional payments due in the event that the Company does not meet predetermined criteria within a specified period of time. The Company could be required to pay up to approximately $2.0 million, $1.0 million and $0.3 million in 2014, 2015 and 2016, respectively, under these agreements.
| 7. | Asset Retirement Obligations |
The Company is subject to certain legal requirements which result in recognition of a liability related to the obligation to incur future plugging and abandonment costs. The Company records a liability for such asset retirement obligations and capitalizes a corresponding amount for asset retirement costs. The liability is estimated using the present value of expected future cash flows, adjusted for inflation and discounted at the Company’s credit adjusted risk-free rate.
F-47
Table of Contents
Index to Financial Statements
A reconciliation of the beginning and ending aggregate carrying amount of asset retirement obligations for the years ended December 31, 2013 and 2012 is as follows (in thousands):
| Balance at December 31, 2010 |
$ | 289 | ||
| Liabilities incurred |
493 | |||
| Accretion expense |
53 | |||
|
|
|
|||
| Balance at December 31, 2011 |
$ | 835 | ||
| Liabilities incurred |
382 | |||
| Accretion expense |
164 | |||
|
|
|
|||
| Balance at December 31, 2012 |
$ | 1,381 | ||
| Liabilities incurred |
583 | |||
| Accretion expense |
150 | |||
|
|
|
|||
| Balance at December 31, 2013 |
$ | 2,114 | ||
|
|
|
| 8. | Members’ Capital |
Members include consultants and employees of the Company as well as REA. The liability of the members of the Company is limited to each member’s total capital account. Subsequent to a 4:1 stock split on June 22, 2011, authorized capital consisted of 36,000 preferred units, 2,000 Class A units, and 2,000 Class B units as of December 31, 2011. The consolidated financial statements have been adjusted to reflect the impact of the stock split for all periods presented, where applicable.
As of December 31, 2012, all units of Class A units were reserved for issuance pursuant to a Restricted Unit Agreement (see Note 9). As discussed in Note 1, the founding member, Rice Partners, assigned its 36,000 preferred units to REA. Additionally, in connection with NGP’s $100.0 million equity investment into REA in 2012, of which 100% of the net proceeds were invested into Rice Drilling B, Rice Drilling B issued 15,998 preferred units to REA. Operating profits and losses are to be allocated in proportion to the members’ interest.
During 2013, the Company finalized a $300.0 million equity commitment from NGP of which approximately $200.0 million of NGP’s commitment was funded at closing in April 2013. Cash proceeds from the investment were used to fund Utica Shale leasehold acquisitions in southeastern Ohio. As a part of the reorganization that occurred in connection with the Rice Energy IPO, the Company became a wholly-owned subsidiary of REA and the restricted units were exchanged for common stock of Rice Energy. Furthermore, NGP’s equity commitments terminated in connection with the closing of the Rice Energy IPO.
Liquidation Preference
Prior to the reorganization in connection with the Rice Energy IPO, the terms of the governance documents of the Company provided that in the event of any liquidation, dissolution or winding up of the Company, distributions would first be made to members holding senior preferred units until such members have received cumulative distributions in an amount equal to the preferred return as defined in the REA agreement, second to the members holding preferred units in the amount of $49.9 million, then, until the Company had achieved breakeven operations, as defined, to the members holding preferred and Class A common units in proportion to their ownership interests and thereafter to the members in proportion to their ownership units. Following the restructuring, distributions in such event would be made to the sole member.
Repurchase Option
Up until the third anniversary of the grant of Class A and B restricted units, the Company or a member of its affiliates had the right to repurchase all of the units from the member at $1,700 per unit, as defined and in accordance with the Company’s then-existing limited liability company agreement. Subsequent to the third
F-48
Table of Contents
Index to Financial Statements
anniversary of the grant of Class A and B restricted units, the Company or a member of its affiliates has the right to repurchase all of the units from the member at fair market value, not less than $1,700 per unit, in accordance with the Company’s then-existing limited liability company agreement.
During 2012, REA exercised the option to repurchase all units of the 2,000 Class B restricted units for $3.4 million. In December 2012, a payment of $1.1 million was made by the Company to the member on behalf of REA. Additional payments of $2.3 million were made by the Company on behalf of REA in 2013. The Company was reimbursed these costs.
Voting Rights
Preferred units have voting rights whereas the restricted units (Class A and B common units) are nonvoting.
| 9. | Restricted Unit Agreements |
Effective November 13, 2009, the Company entered into restricted unit agreements with an employee and consultants. Under separate and individual restricted unit agreements, the eligible employee and consultants are granted units which vest over a specified period of time. Each unit entitles the holder to an equity ownership in the Company. The restricted units are accounted for as liability awards, which require remeasurement each reporting period, as a result of the existence of a call option that permits the Company to repurchase the awards at a fixed amount that could be above or below fair market value of the units. Prior to November 13, 2012, the Company had the ability to exercise the call option at a specified amount. Subsequently, the Company’s call right is at fair market value. As of December 31, 2013, the remaining liability recorded for the restricted units represented fair value. Management established an estimated fair value for issued units based upon an income approach prior to December 31, 2013. The income approach requires use of internal business plans that are based on judgments and estimates regarding future economic conditions, costs, inflation rates and discount rates, among other factors. At December 31, 2013, in connection with the Rice Energy IPO, a market approach was used.
During 2012, REA exercised its option to repurchase all of the 2,000 Class B restricted units. A summary of the change in vested restricted units is as follows:
| Restricted Units | ||||
| Class A and Class B restricted units |
||||
| Vested restricted units |
4,000 | |||
| Repurchased Class B restricted units |
(2,000 | ) | ||
|
|
|
|||
| Vested restricted units as of December 31, 2012 |
2,000 | |||
| Repurchased Class B restricted units |
— | |||
|
|
|
|||
| Vested restricted units as of December 31, 2013 |
2,000 | |||
|
|
|
|||
| 10. | Incentive Units |
REA, as the parent company of Rice Drilling B, granted Incentive Units to certain members of management. The Incentive Units are not accounted for as equity instruments as the Incentive Units do not have the characteristics of a substantive class of equity. Rather, the Incentive Units provide the holders with a performance bonus for fair value accretion of REA equity. In connection with the January 2012 NGP investment in REA, 100,000 Tier I Legacy units, 13,000 Tier II Legacy units, and 17,000 Tier III Legacy units were issued. The Incentive Units will only be paid in cash and payout for each tier occurs when a specified level of cumulative cash distributions has been received by NGP.
F-49
Table of Contents
Index to Financial Statements
In connection with the April 2013 NGP investment in REA, an additional 900,000 Tier I Legacy units, 987,000 Tier II Legacy Units and 983,000 Tier III Legacy Units were issued. In addition, 100,000 New Tier I Units, 100,000 New Tier II Units, 100,000 New Tier III Units, and 100,000 New Tier IV Units were issued. In June 2013, an additional 717,546 New Tier I Units, 577,546 New Tier II Units, 577,546 New Tier III Units, and 577,546 New Tier IV Units were issued to certain members of management. Similar to above, there is no payout of the awards until specified level of cumulative cash distributions has been received by NGP.
During 2012 and 2013, no payments were made in respect of Incentive Units. The Company has not recognized compensation cost on the Incentive Units because the payment conditions, which relate to a liquidity event are not probable at December 31, 2013. The estimated payout under these awards at December 31, 2013 is approximately $142.3 million if a liquidity event were to occur. Prior to December 31, 2013, this estimate was based upon an option pricing model with various Level 3 assumptions including internal business plans that were based on judgments and estimates regarding future economic conditions, costs, inflation rates and discount rates, among other factors. To the extent market transactions were known, this information was factored into the fair value estimate. At December 31, 2013, the Company no longer used an income approach to estimate the fair value and instead utilized a market approach to estimate the fair value. This change in fair value method was a result of the Rice Energy IPO.
On January 23, 2014, in connection with our IPO and corporate reorganization, the incentive units described above were modified. As a result of these modifications, certain of these incentive units are to be settled in cash and others are to be settled by the issuance of stock. The Company has not yet quantified the amount of the expense associated with the modifications.
| 11. | Derivative Instruments |
The Company uses derivative commodity instruments that are placed with major financial institutions whose creditworthiness is regularly monitored. Our derivative counterparties share in the Credit Agreement collateral. The Company’s derivative commodity instruments have not been designated as hedges for accounting purposes; therefore, all gains and losses were recognized in income currently. As of December 31, 2013, the Company entered into derivative instruments with Wells Fargo Bank, N.A. and Bank of Montreal fixing the price it receives for natural gas through November 28, 2017, as summarized in the following table:
| Swap Contract Expiration |
MMbtu/day | Weighted Average Price |
||||||
| 2014 |
87,219 | $ | 4.112 | |||||
| 2015 |
58,781 | $ | 4.153 | |||||
| 2016 |
68,326 | $ | 4.233 | |||||
| 2017 |
30,000 | $ | 4.343 | |||||
| Collar Contract Expiration |
MMbtu/day | Floor/Ceiling | ||||||
| 2014 |
10,000 | $ | 3.000/$5.800 | |||||
| 2015 |
45,000 | $ | 4.000/$4.500 | |||||
| Basis Contract Expiration |
MMbtu/day | Swap ($/MMBtu) |
||||||
| 2014 |
15,000 | $ | (0.205 | ) | ||||
| 2015 |
10,000 | $ | (0.410 | ) | ||||
F-50
Table of Contents
Index to Financial Statements
The following is a summary of the Company’s derivative instruments, which are recorded in the consolidated balance sheets as of December 31, 2013 and 2012 (in thousands):
| December 31, 2013 | December 31, 2012 | |||||||
| Current derivative assets |
$ | 2,270 | $ | 46 | ||||
| Long-term derivative assets |
6,030 | — | ||||||
|
|
|
|
|
|||||
| $ | 8,300 | $ | 46 | |||||
|
|
|
|
|
|||||
| Current derivative liabilities |
$ | 3,235 | $ | 2,306 | ||||
| Long-term derivative liabilities |
1,109 | — | ||||||
|
|
|
|
|
|||||
| $ | 4,344 | $ | 2,306 | |||||
|
|
|
|
|
|||||
| Net current value of derivative liabilities |
$ | (965 | ) | $ | (2,260 | ) | ||
|
|
|
|
|
|||||
| Net long-term value of derivative assets |
$ | 4,921 | $ | — | ||||
|
|
|
|
|
|||||
The following tables present the gross amounts of recognized derivative assets and liabilities, the amounts offset under netting arrangements with counterparties, and the resulting net amounts presented in the consolidated balance sheets for the periods presented, all at fair value (in thousands):
| December 31, 2013 | ||||||||||||
| Description | Gross Amounts of Recognized Assets |
Gross Amounts Offset on Balance Sheet |
Net Amounts of Assets (Liabilities) on Balance Sheet |
|||||||||
| Derivative assets |
$ | 13,000 | $ | (4,700 | ) | $ | 8,300 | |||||
| Derivative liabilities |
$ | 256 | $ | (4,600 | ) | $ | (4,344 | ) | ||||
| December 31, 2012 | ||||||||||||
| Description | Gross Amounts of Recognized Assets |
Gross Amounts Offset on Balance Sheet |
Net Amounts of Assets (Liabilities) on Balance Sheet |
|||||||||
| Derivative assets |
$ | 416 | $ | (370 | ) | $ | 46 | |||||
| Derivative liabilities |
$ | — | $ | (2,306 | ) | $ | (2,306 | ) | ||||
Both realized and unrealized gains and losses are recorded as a gain or loss on derivatives in the consolidated statement of operations under other income/expense. The Company had an unrealized gain of $6.2 million for the year ended December 31, 2013 and an unrealized loss of $2.3 million for the year ended December 31, 2012. There were no unrealized gains or losses for the year ended December 31, 2011. The Company had realized gains related to contract settlements of $0.7 million, $0.9 million and $0.6 million for the years ended December 31, 2013, 2012 and 2011 respectively.
| 12. | Commitments and Contingencies |
On October 14, 2013, the Company entered into a Development Agreement and Area of Mutual Interest (“AMI”) Agreement with Gulfport Energy Corporation (“Gulfport”) covering approximately 50,000 aggregate net acres in the Utica Shale in Belmont County, Ohio. The Company refers to these agreements as “Utica Development Agreements.” Pursuant to the Utica Development Agreements, the Company had approximately 68.80% participating interest in acreage currently owned or to be acquired by the Company or Gulfport located within Goshen and Smith Townships (the “Northern Contract Area”) and an approximately 42.63% participating interest in acreage currently owned or to be acquired by the Company or Gulfport located within Wayne and Washington Townships (the “Southern Contract Area”), each within Belmont County, Ohio. The remaining participating interests are held by Gulfport. The participating interests of the Company and Gulfport in each of the Northern and Southern Contract Areas approximate the Company’s current relative acreage positions in each area.
F-51
Table of Contents
Index to Financial Statements
Each quarter during the term of the Development Agreement, the Company and Gulfport will establish a work program and budget detailing the proposed exploration and development to be performed in the Northern and Southern Contract Areas, respectively, for the following year. The number of horizontal wells proposed to be drilled in each of the Northern Contract Area and Southern Contract Area is limited by the Development Agreement as follows: in 2013, no more than five wells; in 2014, between eight and 40 wells; in 2015, between eight and 50 wells; and thereafter, unlimited.
The Utica Development Agreements have terms of ten years and are terminable upon 90 days’ notice by either party; provided that, with respect to interests included within a drilling unit, such interests shall remain subject to the applicable joint operating agreement and the Company and Gulfport shall remain operators of drilling units located in the Northern AMI and Southern AMI, respectively, following such termination.
The Company is involved in various litigation matters arising in the normal course of business. Management is not aware of any actions that are expected to have a material adverse effect on its financial position or results of operations.
The Company has commitments for gathering and firm transportation under existing contracts with third parties. Future payments for these items as of December 31, 2013 totaled $637.2 million (2014—$28.3 million, 2015—$52.1 million, 2016—$65.6 million, 2017—$65.4 million, 2018—$64.0 million and thereafter—$361.8 million).
As of December 31, 2013, the Company had two horizontal drilling rigs under contract. One of these contracts expires in 2014. A third rig, which we took delivery of in February 2014, expires in 2015. Future payments for these items as of December 31, 2013 totaled $21.4 million (2014—$11.7 million and 2015—$9.7 million). Any other rig performing work for us is doing so on a well-by-well basis and therefore can be released without penalty at the conclusion of drilling on the current well. These types of drilling obligations have not been included in the amounts above. The values above represent the gross amounts that we are committed to pay without regard to our proportionate share based on our working interest.
Capital leases are entered into for vehicle purchases. The acquisition value of vehicles recorded under capital leases is $2.0 million. Accumulated amortization related to capital leases was $0.2 million and $8 thousand as of December 31, 2013 and 2012, respectively. Amortization expense related to capital leases was $0.2 million, $8 thousand and $0 as of December 31, 2013, 2012 and 2011, respectively. Future lease payments under capital leases as of December 31, 2013 totaled $1.6 million (2014—$0.4 million, 2015—$0.3 million, 2016—$0.3 million, 2017—$0.5 million and 2018—$0.1 million).
Operating leases are primarily entered into for various office locations. Rental expense under operating leases was $0.2 million, $0.2 million and $0.1 million for the years ended December 31, 2013, 2012 and 2011, respectively. Future lease payments under non-cancelable operating leases as of December 31, 2013 totaled $4.5 million (2014—$0.6 million, 2015—$1.0 million, 2016—$0.9 million, 2017—$0.8 million, 2018—$0.8 million and thereafter—$0.4 million).
| 13. | Related-Party Transactions |
In prior periods, the Company reimbursed Rice Partners for expenses incurred on behalf of the Company. General and administrative expenses incurred by Rice Partners and reimbursed by the Company were $9.3 million, $4.8 million and $3.1 million for the years ended December 31, 2013 , 2012 and 2011, respectively. As of December 31, 2013 and 2012, $6.1 million and $2.5 million, respectively, of general and administrative expenses was due to Rice Partners and is recorded as due to affiliate on the consolidated balance sheet. Prior to the closing of the Rice Energy IPO, the Company terminated its agreement to reimburse Rice Partners for expenses incurred on its behalf.
F-52
Table of Contents
Index to Financial Statements
Payments totaling $2.2 million, $0.8 million and $0.6 million were made during the years ended December 31, 2013, 2012 and 2011 respectively to Geological Engineering Services, Inc. (“GES”) in respect of consultancy services. GES is a drilling and completion engineering consulting company specializing in unconventional reservoirs like the Marcellus Shale. John P. LaVelle, Rice Energy’s Vice President of Drilling, served as president of GES from February 1994 until February 2010. There were no amounts outstanding between the Company and GES as of any period presented.
The Company was reimbursed for costs incurred on behalf of the Company’s Marcellus joint venture. General and administrative expenses incurred by the Company and reimbursed by the Company’s Marcellus joint venture were $1.6 million, $1.3 million and $0.0 million for the years ended December 31, 2013, 2012 and 2011, respectively.
As of December 31, 2012, the Company recorded a receivable from its Marcellus joint venture for $6.0 million representing capitalized costs that were approved to be contributed to the joint venture.
| 14. | Acquisitions |
On December 31, 2012, the Company entered into a transaction to acquire certain producing shallow natural gas wells and unproved properties (the “Shallow-Well Acquisition”). Total firm consideration in the Shallow-Well Acquisition was approximately $10.0 million of which $3.3 million was paid to the seller in January 2013. An additional $1.0 million was paid to the seller as of December 31, 2013, reducing the notes payable. The remaining consideration will be transferred to the seller from 2014 to 2015. In addition to the firm consideration, the seller has the right to participate in the development of the unproved properties and the Company is responsible for funding $3.7 million of these activities. The Company has recorded the $10.0 million purchase price with the offset to proved and unproved properties.
| 15. | Subsequent Events |
Initial Public Offering
On January 29, 2014, Rice Energy completed their IPO of 50,000,000 shares of our $0.01 par value common stock, which included 30,000,000 shares sold by Rice Energy Inc., 14,000,000 shares sold by the selling stockholder and 6,000,000 shares subject to an option granted to the underwriters by the selling stockholder.
The net proceeds of the IPO, based on the public offering price of $21.00 per share, were approximately $993.5 million, which resulted in net proceeds to Rice Energy of $593.6 million after deducting estimated expenses and underwriting discounts and commissions of approximately $36.4 million and the net proceeds to the selling stockholders of approximately $399.0 million after deducting underwriting discounts of approximately $21.0 million. Rice Energy did not receive any proceeds from the sale of the shares by the selling stockholders. A portion of the net proceeds from the IPO were used to repay all outstanding borrowings under the revolving credit facility of the Company’s Marcellus joint venture, to make a $100.0 million payment to Alpha Holdings in partial consideration for the Marcellus JV Buy-In and to repay all outstanding borrowings under the Company’s revolving credit facility. The remainder of the net proceeds from the IPO will be used to fund a portion of our capital expenditure plan.
Marcellus JV Buy-In
On January 29, 2014, in connection with the closing of the IPO and pursuant to the Transaction Agreement between Rice Energy and Alpha Holdings dated as of December 6, 2013 (the “Transaction Agreement”), Rice Energy completed its acquisition of Alpha Holdings’ 50% interest in the Company’s Marcellus joint venture in exchange for total consideration of $300.0 million, consisting of $100.0 million of cash and the issuance to Alpha Holdings of 9,523,810 shares of Rice Energy common stock. Prior to the completion of the acquisition of Alpha Holdings’ 50% interest in the Company’s Marcellus joint venture, the Company accounted for its investment under the equity method of accounting.
F-53
Table of Contents
Index to Financial Statements
The company is currently assessing the fair value of assets acquired and liabilities assumed. Immediately prior to the acquisition, the fair value of the existing equity in the Marcellus joint venture, based upon preliminary valuations, was approximately $245.0 million. The acquisition-date fair value of the existing equity was based on an income approach. The income approach calculated the present value of the future cash flows related to the natural gas properties as of the date of the transaction, utilizing a discount rate based upon market participant assumptions, natural gas strip prices as of the date of the transaction, and a decline curve consistent with our geographic peers. As we acquired the remaining ownership in the Marcellus joint venture we are required to remeasure our equity investment at fair value which will result in a non-recurring gain of approximately $195.2 million during the quarter ended March 31, 2014. On a preliminary basis and based on preliminary valuations performed to determine the fair value of the assets as of the acquisition date, the company anticipates the natural gas properties have fair value of approximately $320.0 million. The preliminary estimate of excess purchase price over net assets and liabilities assumed which is to be allocated to goodwill is approximately $365.0 million and will be deductible for tax purposes.
The acquisition consolidates the resources of the Company and the Marcellus joint venture which will enable the Company to efficiently develop the natural gas properties concurrently. The management team of the Company has historically also served as the management team of the joint venture, so the team is intimately familiar with the assets. These factors resulted in the aforementioned goodwill.
The following unaudited pro forma combined financial information presents the Company’s results as though the Company and the incremental 50% interest in our Marcellus joint venture had occurred at January 1, 2013.
| (in thousands) | Year Ended December 31, 2013 (Pro forma) |
|||
| Pro forma net revenues |
$ | 179,281 | ||
| Pro forma net loss |
$ | (30,509 | ) | |
| Pro forma earnings per share |
$ | (0.24 | ) | |
The Company expects to complete the purchase price allocation during 2014 and may adjust the preliminary amounts set forth above to reflect the final valuation. This final valuation of the assets and liabilities could have a material impact on the pro forma information and preliminary purchase price allocation discussed above.
Income Taxes
At the date of IPO, Rice Energy owned 100% of Rice Drilling B and its subsidiaries. Rice Drilling B was a limited liability company not subject to federal income taxes before IPO. However, in connection with the closing of the IPO, as a result of our corporate reorganization, we became a corporation subject to federal income tax and, as such, our future income taxes will be dependent upon our future taxable income. The change in tax status would require the recognition of a deferred tax asset or liability for the initial temporary differences at the time of the change in status. The resulting deferred tax liability is approximately $145.1 million.
No current tax expense would result as of the date of the change in status. The recognition of the initial deferred tax liability will be recorded in equity at the date of IPO, but not in the financials as of December 31, 2013.
Unregistered Sales of Equity Securities
On January 29, 2014, pursuant to the Master Reorganization Agreement (the “Master Reorganization Agreement”) among Rice Energy Inc., Rice Drilling B, REA, Rice Holdings, Rice Partners, NGP Holdings, NGP RE Holdings, L.L.C., (“NGP RE Holdings”) NGP RE Holdings II, L.L.C. (“NGP RE II” and, together with NGP RE Holdings, “Natural Gas Partners”), Mr. Daniel J. Rice III, Rice Merger LLC (“Merger Sub”) and each of the
F-54
Table of Contents
Index to Financial Statements
persons holding incentive units representing interests in REA (collectively, the “Incentive Unitholders”) dated as of January 23, 2014, (i) (a) Rice Partners contributed a portion of its interests in REA to Rice Holdings, (b) Natural Gas Partners contributed its interests in REA to NGP Holdings and (c) the Incentive Unitholders contributed a portion of their incentive units to Rice Holdings and NGP Holdings, each in return for substantially similar incentive units in such entities; (ii) NGP Holdings, Rice Holdings and Mr. Daniel J. Rice III contributed their respective interests in Rice Appalachia to the Company in exchange for 43,452,550, 20,300,923 and 2,356,844 shares of Common Stock, respectively; (iii) Rice Partners contributed its remaining interest in Rice Appalachia to Rice Energy Inc. in exchange for 20,000,000 shares of Common Stock; (iv) the Incentive Unitholders contributed their remaining interests in Rice Appalachia to the Company in exchange for 160,831 shares of Common Stock, each of which were issued by the company in connection with the closing of the IPO. In connection with the IPO, in the first quarter of 2014, we recognized a non-cash compensation expense of $3.4 million.
In addition, on January 29, 2014, pursuant to the Agreement and Plan of Merger (the “Merger Agreement”) among the Company, Rice Drilling B and Merger Sub dated as of January 23, 2014, Rice Energy Inc. issued 1,728,852 shares of Common Stock to the members of Rice Drilling B (other than Rice Appalachia) for settlement of the restricted units.
Incentive Units
In connection with the IPO, in the first quarter of 2014, certain incentive units granted by NGP Holdings to certain members of management triggered the pre-determined payout criteria, resulting in a cash payment by NGP Holdings of $4.4 million. This resulted in additional non-cash compensation expense being recorded in the first quarter of 2014 by the Company.
Convertible Debentures and Warrants
In connection with the IPO, the convertible debentures and warrants of Rice Drilling B were amended to become convertible or exercisable for an aggregate 1,671,800 shares of common stock of Rice Energy. Through March 10, 2014, approximately $5.0 million of the convertible debentures have been converted into 433,073 shares of Rice Energy Inc. common stock. On February 28, 2014, the Company issued a call notice on the remaining convertible debentures, requiring a response by March 30, 2014. Amounts not converted by the response date will require payment by the Company of 100% of the principal amount plus a premium of 50%, which could result in additional costs of $1.0 million. As the principal amount of the convertible debentures outstanding has been reduced to less than $5.0 million, the Company is no longer required to maintain restricted cash. Through March 10, 2014, two warrants have been exercised in exchange for 1,728 shares of Rice Energy common stock.
Amendment to Senior Secured Revolving Credit Facility
On January 29, 2014, Rice Energy, as parent guarantor, and Rice Drilling B, as borrower, entered into an amendment (the “Sixth Amendment”) to the Second Amended and Restated Credit Agreement, dated as of April 25, 2013 with Wells Fargo Bank, N.A., as administrative agent and the lenders and other parties thereto (the “Second Amended and Restated Credit Agreement”). Rice Drilling B is a wholly-owned subsidiary of Rice Energy Inc. Among other things, the Sixth Amendment (i) added Rice Energy Inc. as a guarantor, (ii) increased the maximum commitment to $1.5 billion from $500.0 million, (iii) increased the borrowing base to $350.0 million from $200.0 million, (iv) lowered the interest rate on amounts borrowed, and (v) allowed for the corporate reorganization that was completed simultaneously with the closing of the IPO.
Subsequent to December 31, 2013, the Company issued additional letters of credit with Wells Fargo Bank, N.A. of $55.9 million (refer to Note 4 for further details on letters of credit as required by the Company’s natural gas marketer and pipeline).
F-55
Table of Contents
Index to Financial Statements
Momentum Acquisition
On February 12, 2014, the Company’s wholly owned subsidiary, Rice Poseidon, entered into a Purchase Agreement with M3 to acquire certain gas gathering assets in eastern Washington and Greene Counties, Pennsylvania, for aggregate consideration of approximately $110.0 million in cash, subject to customary purchase price adjustments. Rice Energy expects the Momentum Acquisition to close in the second quarter of 2014, subject to customary closing conditions. The effective date for the Momentum Acquisition is March 1, 2014 and will be funded with proceeds received from our IPO.
The properties to be acquired in the Momentum Acquisition consist of a 28-mile, 6”-16” gathering system in eastern Washington County, Pennsylvania, and permits and rights of way in Washington and Greene Counties, Pennsylvania, necessary to construct an 18-mile, 30” gathering system connecting the northern system to the Texas Eastern pipeline. The northern system is supported by long-term contracts with acreage dedications covering approximately 20,000 acres from third parties. Once fully constructed, the acquired systems are expected to have an aggregate capacity of over 1 Bcf/d.
Subsequent events have been considered for disclosure and recognition through March 21, 2014, the same date the consolidated financial statements were available to be issued.
| 16. | Quarterly Financial Information (Unaudited) |
The Company’s quarterly financial information for the years ended December 31, 2013 and 2012 is as follows (in thousands):
| First quarter |
Second quarter |
Third quarter |
Fourth quarter |
|||||||||||||
| Year ended December 31, 2013: |
||||||||||||||||
| Total operating revenues |
$ | 13,233 | $ | 23,840 | $ | 23,665 | $ | 27,866 | ||||||||
| Total operating expenses |
10,705 | 25,833 | 52,274 | 27,755 | ||||||||||||
| Operating income (loss) |
2,528 | (1,993 | ) | (28,609 | ) | 111 | ||||||||||
| Net income (loss) |
$ | (6,775 | ) | $ | 19,586 | $ | (33,652 | ) | $ | (14,935 | ) | |||||
| First quarter |
Second quarter |
Third quarter |
Fourth quarter |
|||||||||||||
| Year ended December 31, 2012: |
||||||||||||||||
| Total operating revenues |
$ | 4,792 | $ | 4,155 | $ | 6,580 | $ | 11,673 | ||||||||
| Total operating expenses |
6,353 | 11,984 | 8,123 | 9,640 | ||||||||||||
| Operating income (loss) |
(1,561 | ) | (7,829 | ) | (1,543 | ) | 2,033 | |||||||||
| Net income (loss) |
$ | (2,334 | ) | $ | (12,884 | ) | $ | (6,523 | ) | $ | 2,397 | |||||
| 17. | Supplemental Information on Gas-Producing Activities (Unaudited) |
Costs incurred for property acquisitions, exploration and development are as follows for Rice Drilling B (in thousands):
| For the Years Ended December 31, | ||||||||||||
| 2013 | 2012 | 2011 | ||||||||||
| Acquisitions: |
||||||||||||
| Unproved leaseholds |
$ | 305,000 | $ | 47,396 | $ | 16,877 | ||||||
| Development costs |
184,217 | 89,307 | 72,776 | |||||||||
| Exploration costs: |
||||||||||||
| Geological and geophysical |
9,951 | 3,275 | 660 | |||||||||
|
|
|
|
|
|
|
|||||||
| Total costs incurred |
$ | 499,168 | $ | 139,978 | $ | 90,313 | ||||||
|
|
|
|
|
|
|
|||||||
F-56
Table of Contents
Index to Financial Statements
The following table presents the results of operations related to natural gas production for Rice Drilling B (in thousands):
| For the Years Ended December 31, | ||||||||||||
| 2013 | 2012 | 2011 | ||||||||||
| Revenues |
$ | 87,847 | $ | 26,743 | $ | 13,972 | ||||||
| Production costs |
19,712 | 8,824 | 2,157 | |||||||||
| Exploration costs |
9,951 | 3,275 | 660 | |||||||||
| Depreciation, depletion and amortization |
29,808 | 13,329 | 5,920 | |||||||||
| Write-down of abandoned leases |
— | 2,253 | 109 | |||||||||
| General and administrative expenses |
5,108 | 3,050 | 2,212 | |||||||||
|
|
|
|
|
|
|
|||||||
| Results of operations from producing activities |
$ | 23,268 | $ | (3,988 | ) | $ | 2,914 | |||||
|
|
|
|
|
|
|
|||||||
Reserve quantity information is as follows for Rice Drilling B:
| Natural Gas (Millions of Cubic Feet, MMcf) |
||||||||||||
| For the Years Ended December 31, | ||||||||||||
| 2013 | 2012 | 2011 | ||||||||||
| Proved developed and undeveloped reserves: |
||||||||||||
| Beginning of year |
304,272 | 232,996 | 12,230 | |||||||||
| Extensions and discoveries |
100,626 | 176,956 | 223,538 | |||||||||
| Revision of previous estimates |
757 | (96,911 | ) | 620 | ||||||||
| Production |
(22,995 | ) | (8,769 | ) | (3,392 | ) | ||||||
|
|
|
|
|
|
|
|||||||
| End of year |
382,660 | 304,272 | 232,996 | |||||||||
|
|
|
|
|
|
|
|||||||
| Proved developed reserves: |
||||||||||||
| End of year |
144,310 | 61,225 | 25,397 | |||||||||
| Proved undeveloped reserves: |
||||||||||||
| End of year |
238,350 | 243,047 | 207,599 | |||||||||
Extensions, Discoveries and Other Additions
The Company added 100,626 MMcf, 176,956 MMcf and 223,538 MMcf through its drilling program in the Marcellus Shale in 2013, 2012 and 2011, respectively.
Revision of Previous Estimates
In 2012, the Company had net negative revisions of 96,911 MMcf, as 32 proved undeveloped locations were removed from its estimate of reserves at December 31, 2011 due primarily to declines in natural gas pricing and changes to the Company’s drilling plans with regards to horizontal drilling.
The reserve quantity information is limited to reserves which had been evaluated as of December 31, 2013. Proved developed reserves represent only those reserves expected to be recovered from existing wells and support equipment. Proved undeveloped reserves are expected to be recovered from new wells after substantial development costs are incurred. Netherland, Sewell and Associates, Inc. reviewed 100% of the total net gas proved reserves attributable to the Company’s interests and the Company’s Marcellus joint venture as of December 31, 2013 and 2012.
The information presented represents estimates of proved natural gas reserves based on evaluations prepared by the independent petroleum engineering firms of Netherland, Sewell and Associates, Inc. and Wright & Company in accordance with Standards Pertaining to the Estimating and Auditing of Oil and Gas Reserves
F-57
Table of Contents
Index to Financial Statements
Information promulgated by the Society of Petroleum Evaluation Engineers and definitions and guidelines established by the SEC. The Company’s independent reserve engineers were selected for their historical experience and geographic expertise in engineering unconventional resources. Since 1961, Netherland, Sewell and Associates, Inc. has evaluated oil and gas properties and independently certified petroleum reserves quantities in the United States and internationally. Wright & Company was founded in 1988 and performs consulting petroleum engineering services under the Texas Board of Professional Engineers.
Certain information concerning the assumptions used in computing the standardized measure of proved reserves and their inherent limitations are discussed below. The Company believes such information is essential for a proper understanding and assessment of the data presented. Future cash inflows are computed by applying the 12-month unweighted arithmetic average of the first-day-of-the-month price for each month in the period January through, respectively, to the period-end quantities of those reserves. Gas prices are held constant throughout the lives of the properties.
The assumptions used to compute estimated future net revenues do not necessarily reflect the Company’s expectations of actual revenues or costs, or their present worth. In addition, variations from the expected production rates also could result directly or indirectly from factors outside of the Company’s control, such as unintentional delays in development, changes in prices, or regulatory controls. The standardized measure calculation further assumes that all reserves will be disposed of by production. However, if reserves are sold in place, this could affect the amount of cash eventually realized.
Future development and production costs are computed by estimating the expenditures to be incurred in developing and producing the proved natural gas reserves at the end of the year, based on period-end costs and assuming continuation of existing economic conditions.
An annual discount rate of 10% was used to reflect the timing of the future net cash flows relating to proved natural gas reserves.
Information with respect to Rice Drilling B’s estimated discounted future net cash flows related to its proved natural gas reserves is as follows (in thousands):
| For the Years Ended December 31, | ||||||||||||
| 2013 | 2012 | 2011 | ||||||||||
| Future cash inflows |
$ | 1,496,294 | $ | 869,882 | $ | 1,015,589 | ||||||
| Future production costs |
(517,101 | ) | (323,855 | ) | (208,733 | ) | ||||||
| Future development costs |
(219,879 | ) | (262,084 | ) | (206,612 | ) | ||||||
|
|
|
|
|
|
|
|||||||
| Future net cash flows |
759,314 | 283,943 | 600,244 | |||||||||
| 10% annual discount for estimated timing of cash flows |
(342,150 | ) | (181,725 | ) | (330,924 | ) | ||||||
|
|
|
|
|
|
|
|||||||
| Standardized measure of discounted future net cash flows(1) |
$ | 417,164 | $ | 102,218 | $ | 269,320 | ||||||
|
|
|
|
|
|
|
|||||||
| (1) | Does not include the effects of income taxes on future revenues at December 31, 2013 and 2012 because as of December 31, 2013 and 2012, the Company was a limited liability company not subject to entity-level taxation. Accordingly, no provision for federal or state corporate income taxes has been provided because taxable income was passed through to the Company’s equity holders. However, in connection with the closing of the IPO, as a result of the corporate reorganization, the Company became a corporation subject to federal income tax and, as such, its future income taxes will be dependent upon its future taxable income. |
For 2013, the reserves for Rice Drilling B were computed using unweighted arithmetic averages of the closing prices on the first day of each month during 2013, adjusted for energy content and a regional price differential. For 2013, this adjusted gas price was $3.91 per Mcf.
F-58
Table of Contents
Index to Financial Statements
For 2012, the reserves for Rice Drilling B were computed using unweighted arithmetic averages of the closing prices on the first day of each month during 2012, adjusted for energy content and a regional price differential. For 2012, this adjusted gas price was $2.86 per Mcf.
For 2011, the reserves for Rice Drilling B were computed using unweighted arithmetic averages of the closing prices on the first day of each month during 2011, adjusted for energy content and a regional price differential. For 2011, this adjusted gas price was $4.36 per Mcf.
The following are the principal sources of changes in the standardized measure of discounted future net cash flows for Rice Drilling B (in thousands):
| For the Years Ended December 31, | ||||||||||||
| 2013 | 2012 | 2011 | ||||||||||
| Balance at beginning of period |
$ | 102,218 | $ | 269,320 | $ | 46,422 | ||||||
| Net change in prices and production costs |
101,345 | (83,873 | ) | (15,929 | ) | |||||||
| Net change in future development costs |
29,336 | (31,811 | ) | (3,695 | ) | |||||||
| Natural gas net revenues |
(68,135 | ) | (18,376 | ) | (11,815 | ) | ||||||
| Extensions |
114,489 | 38,937 | 243,003 | |||||||||
| Revisions of previous quantity estimates |
1,133 | (108,209 | ) | (14,259 | ) | |||||||
| Previously estimated development costs incurred |
66,894 | 17,036 | 3,040 | |||||||||
| Accretion of discount |
10,230 | 26,932 | 4,642 | |||||||||
| Changes in timing and other |
59,654 | (7,738 | ) | 17,911 | ||||||||
|
|
|
|
|
|
|
|||||||
| Balance at end of period |
$ | 417,164 | $ | 102,218 | $ | 269,320 | ||||||
|
|
|
|
|
|
|
|||||||
Gains on sales of interests in gas properties are not included in the information set forth above. We have also allocated certain general and administrative expenses to the Company’s results of operations as these expenses relate to production activities.
Costs incurred for property acquisitions, exploration and development related to the Company’s Marcellus joint venture (“the Marcellus joint venture”) are as follows (represents Rice Drilling B’s proportionate share, in thousands):
| For the Years Ended December 31, | ||||||||||||
| 2013 | 2012 | 2011 | ||||||||||
| Acquisitions: |
||||||||||||
| Unproved leaseholds |
$ | — | $ | — | $ | 519 | ||||||
| Development costs |
46,571 | 46,725 | 21,700 | |||||||||
| Exploration costs: |
||||||||||||
| Geological and geophysical |
— | — | — | |||||||||
|
|
|
|
|
|
|
|||||||
| Total costs incurred |
$ | 46,571 | $ | 46,725 | $ | 22,219 | ||||||
|
|
|
|
|
|
|
|||||||
The following table presents Rice Drilling B’s share of the results of operations related to natural gas production of the Marcellus joint venture (represents Rice Drilling B’s proportionate share, in thousands):
| For the Years Ended December 31, | ||||||||||||
| 2013 | 2012 | 2011 | ||||||||||
| Revenues |
$ | 45,339 | $ | 13,142 | $ | 2,872 | ||||||
| Production costs |
12,557 | 5,436 | 379 | |||||||||
| Impairment of oil and gas properties |
— | — | 1,296 | |||||||||
| Depreciation, depletion and accretion |
12,500 | 4,702 | 1,092 | |||||||||
| General and administrative expenses |
1,557 | 986 | — | |||||||||
|
|
|
|
|
|
|
|||||||
| Results of operations from producing activities |
$ | 18,725 | $ | 2,018 | $ | 105 | ||||||
|
|
|
|
|
|
|
|||||||
F-59
Table of Contents
Index to Financial Statements
Reserve quantity information is as follows for the Marcellus joint venture (represents Rice Drilling B’s proportionate share, in thousands):
| Natural Gas (MMcf) | ||||||||||||
| For the Years Ended December 31, | ||||||||||||
| 2013 | 2012 | 2011 | ||||||||||
| Proved developed and undeveloped reserves: |
||||||||||||
| Beginning of year |
128,118 | 58,103 | — | |||||||||
| Extensions and discoveries |
19,812 | 98,119 | 58,800 | |||||||||
| Revision of previous estimates |
(26,803 | ) | (23,808 | ) | — | |||||||
| Production |
(11,443 | ) | (4,296 | ) | (697 | ) | ||||||
|
|
|
|
|
|
|
|||||||
| End of year |
109,684 | 128,118 | 58,103 | |||||||||
|
|
|
|
|
|
|
|||||||
| Proved developed reserves: |
||||||||||||
| End of year |
52,370 | 35,013 | 14,474 | |||||||||
| Proved undeveloped reserves: |
||||||||||||
| End of year |
57,314 | 93,105 | 43,629 | |||||||||
Rice Drilling B’s 50% equity interest in the Marcellus joint venture added 19,812 MMcf, 98,119 MMcf and 58,800 MMcf through its drilling program in the Marcellus Shale in 2013, 2012 and 2011, respectively. In 2013, Rice Drilling B’s 50% equity interest in the Marcellus joint venture had net negative revisions of 26,803 MMcf due primarily to performance revisions. In 2012, Rice Drilling B’s 50% equity interest in the Marcellus joint venture had net negative revisions of 23,808 MMcf due primarily to declines in natural gas pricing.
Information with respect to Rice Drilling B’s share of the Marcellus joint venture’s estimated discounted future net cash flows related to its proved natural gas reserves is as follows (in thousands):
| For the Years Ended December 31, | ||||||||||||
| 2013 | 2012 | 2011 | ||||||||||
| Future cash inflows |
$ | 427,167 | $ | 364,157 | $ | 252,384 | ||||||
| Future production costs |
(132,427 | ) | (127,086 | ) | (29,683 | ) | ||||||
| Future development costs |
(46,344 | ) | (86,213 | ) | (51,882 | ) | ||||||
|
|
|
|
|
|
|
|||||||
| Future net cash flows |
248,396 | 150,858 | 170,819 | |||||||||
| 10% annual discount for estimated timing of cash flows |
(102,293 | ) | (79,781 | ) | (100,232 | ) | ||||||
|
|
|
|
|
|
|
|||||||
| Standardized measure of discounted future net cash flows(1) |
$ | 146,103 | $ | 71,077 | $ | 70,587 | ||||||
|
|
|
|
|
|
|
|||||||
| (1) | Does not include the effects of income taxes on future revenues at December 31, 2013 and 2012 because as of December 31, 2013 and 2012, the Company was a limited liability company not subject to entity-level taxation. Accordingly, no provision for federal or state corporate income taxes has been provided because taxable income was passed through to the Company’s equity holders. However, in connection with the closing of the IPO, as a result of the corporate reorganization, the Company became a corporation subject to federal income tax and, as such, its future income taxes will be dependent upon its future taxable income. |
For 2013, the reserves for the Marcellus joint venture were computed using unweighted arithmetic averages of the closing prices on the first day of each month during 2013, adjusted for energy content and a regional price differential. For 2013, this adjusted gas price was $3.90 per Mcf.
For 2012, the reserves for the Marcellus joint venture were computed using unweighted arithmetic averages of the closing prices on the first day of each month during 2012, adjusted for energy content and a regional price differential. For 2012, this adjusted gas price was $2.84 per Mcf.
F-60
Table of Contents
Index to Financial Statements
For 2011, the reserves for the Marcellus joint venture were computed using unweighted arithmetic averages of the closing prices on the first day of each month during 2011, adjusted for energy content and a regional price differential. For 2011, this adjusted gas price was $4.34 per Mcf.
The following is for the Marcellus joint venture (represents Rice Drilling B’s proportionate share, in thousands), the principal sources of changes in the standardized measure of discounted future net cash flows:
| For the Years Ended December 31, | ||||||||||||
| 2013 | 2012 | 2011 | ||||||||||
| Balance at beginning of period |
$ | 71,077 | $ | 70,587 | $ | — | ||||||
| Net change in prices and production costs |
81,974 | (26,855 | ) | — | ||||||||
| Net change in future development costs |
2,781 | (262 | ) | — | ||||||||
| Natural gas net revenues |
(32,782 | ) | (7,707 | ) | (2,494 | ) | ||||||
| Extensions |
18,950 | 38,131 | 73,081 | |||||||||
| Revisions of previous quantity estimates |
(14,752 | ) | (28,923 | ) | — | |||||||
| Previously estimated development costs incurred |
31,253 | 12,862 | — | |||||||||
| Accretion of discount |
7,111 | 7,059 | — | |||||||||
| Changes in timing and other |
(19,509 | ) | 6,185 | — | ||||||||
|
|
|
|
|
|
|
|||||||
| Balance at end of period |
$ | 146,103 | $ | 71,077 | $ | 70,587 | ||||||
|
|
|
|
|
|
|
|||||||
F-61
Table of Contents
Index to Financial Statements
Report of Independent Auditors
The Partners of
Alpha Shale Resources, LP
We have audited the accompanying financial statements of Alpha Shale Resources, LP, which comprise the balance sheets as of December 31, 2013 and 2012, and the related statements of operations, partners’ capital and cash flows for the years then ended, and the related notes to the financial statements.
Management’s Responsibility for the Financial Statements
Management is responsible for the preparation and fair presentation of these financial statements in conformity with U.S. generally accepted accounting principles; this includes the design, implementation, and maintenance of internal control relevant to the preparation and fair presentation of financial statements that are free of material misstatement, whether due to fraud or error.
Auditor’s Responsibility
Our responsibility is to express an opinion on these financial statements based on our audits. We conducted our audits in accordance with auditing standards generally accepted in the United States. Those standards require that we plan and perform the audit to obtain reasonable assurance about whether the financial statements are free of material misstatement.
An audit involves performing procedures to obtain audit evidence about the amounts and disclosures in the financial statements. The procedures selected depend on the auditor’s judgment, including the assessment of the risks of material misstatement of the financial statements, whether due to fraud or error. In making those risk assessments, the auditor considers internal control relevant to the entity’s preparation and fair presentation of the financial statements in order to design audit procedures that are appropriate in the circumstances, but not for the purpose of expressing an opinion on the effectiveness of the entity’s internal control. Accordingly, we express no such opinion. An audit also includes evaluating the appropriateness of accounting policies used and the reasonableness of significant accounting estimates made by management, as well as evaluating the overall presentation of the financial statements.
We believe that the audit evidence we have obtained is sufficient and appropriate to provide a basis for our audit opinion.
Opinion
In our opinion, the financial statements referred to above present fairly, in all material respects, the financial position of Alpha Shale Resources, LP at December 31, 2013 and 2012, and the results of its operations and its cash flows for the years then ended in conformity with U.S. generally accepted accounting principles.
Report of Other Auditors on December 31, 2011 Financial Statements Not Reissued
The financial statements of Alpha Shale Resources, LP for the year ended December 31, 2011 were audited by other auditors whose report dated April 20, 2012, expressed an unqualified opinion on those statements.
/s/ Ernst & Young LLP
Pittsburgh, Pennsylvania
March 21, 2014
F-62
Table of Contents
Index to Financial Statements
BALANCE SHEETS
| December 31, | ||||||||
| (in thousands) | 2013 | 2012 | ||||||
| Assets |
||||||||
| Current assets: |
||||||||
| Cash |
$ | 11,299 | $ | 4,445 | ||||
| Accounts receivable |
14,842 | 5,716 | ||||||
| Receivable from affiliate |
10 | 1 | ||||||
| Prepaid expenses and other |
93 | 108 | ||||||
|
|
|
|
|
|||||
| Total current assets |
26,244 | 10,270 | ||||||
| Gas collateral account |
295 | 295 | ||||||
| Proved natural gas properties, net |
182,333 | 114,128 | ||||||
| Property and other equipment, net |
83 | 91 | ||||||
| Deferred financing costs, net |
851 | 387 | ||||||
| Other non-current assets |
1,010 | — | ||||||
|
|
|
|
|
|||||
| Total assets |
$ | 210,816 | $ | 125,171 | ||||
|
|
|
|
|
|||||
| Liabilities and partners’ capital |
||||||||
| Current liabilities: |
||||||||
| Accounts payable |
$ | 20,024 | $ | 18,953 | ||||
| Royalties payable |
6,831 | 2,082 | ||||||
| Accrued interest |
16 | 413 | ||||||
| Accrued capital expenditures |
1,775 | 3,489 | ||||||
| Other accrued liabilities |
2,048 | 726 | ||||||
| Leasehold payables |
69 | 331 | ||||||
| Derivative liabilities |
2,427 | 138 | ||||||
| Payable to affiliate |
2,026 | 8,538 | ||||||
|
|
|
|
|
|||||
| Total current liabilities |
35,216 | 34,670 | ||||||
| Long-term liabilities: |
||||||||
| Long-term debt |
75,400 | 29,200 | ||||||
| Leasehold payable |
69 | — | ||||||
| Other long-term liabilities |
712 | 542 | ||||||
|
|
|
|
|
|||||
| Total liabilities |
111,397 | 64,412 | ||||||
| Partners’ capital |
99,419 | 60,759 | ||||||
|
|
|
|
|
|||||
| Total liabilities and partners’ capital |
$ | 210,816 | $ | 125,171 | ||||
|
|
|
|
|
|||||
See accompanying Notes to Financial Statements.
F-63
Table of Contents
Index to Financial Statements
STATEMENTS OF OPERATIONS
| Years Ended December 31, | ||||||||||||
| (in thousands) | 2013 | 2012 | 2011 | |||||||||
| Revenue: |
||||||||||||
| Natural gas sales |
$ | 90,677 | $ | 26,284 | $ | 5,744 | ||||||
| Operating expenses: |
||||||||||||
| Depreciation, depletion and amortization |
25,008 | 9,411 | 2,184 | |||||||||
| Gathering, compression and transportation |
15,663 | 6,671 | 53 | |||||||||
| Lease operating |
8,193 | 3,331 | 704 | |||||||||
| Production taxes and impact fees |
1,258 | 869 | — | |||||||||
| Loss on impairment of natural gas properties |
146 | — | 2,592 | |||||||||
| General and administrative expenses |
3,256 | 2,058 | 359 | |||||||||
|
|
|
|
|
|
|
|||||||
| Total operating expenses |
53,524 | 22,340 | 5,892 | |||||||||
|
|
|
|
|
|
|
|||||||
| Operating income (loss) |
37,153 | 3,944 | (148 | ) | ||||||||
|
|
|
|
|
|
|
|||||||
| Other income (expense): |
||||||||||||
| Other expense |
(796 | ) | — | — | ||||||||
| Gain (loss) on derivative instruments |
3,347 | (74 | ) | — | ||||||||
| Amortization of deferred financing costs |
(164 | ) | (15 | ) | — | |||||||
| Interest expense |
(880 | ) | (372 | ) | — | |||||||
|
|
|
|
|
|
|
|||||||
| Total other income (expenses) |
1,507 | (461 | ) | — | ||||||||
|
|
|
|
|
|
|
|||||||
| Net income (loss) |
$ | 38,660 | $ | 3,483 | $ | (148 | ) | |||||
|
|
|
|
|
|
|
|||||||
See accompanying Notes to Financial Statements.
F-64
Table of Contents
Index to Financial Statements
STATEMENTS OF CASH FLOWS
| Years Ended December 31, | ||||||||||||
| (in thousands) | 2013 | 2012 | 2011 | |||||||||
| Cash flows from operating activities: |
||||||||||||
| Net income (loss) |
$ | 38,660 | $ | 3,483 | $ | (148 | ) | |||||
| Adjustments to reconcile net income (loss) to net cash provided by operating activities: |
||||||||||||
| Depreciation, depletion and amortization |
25,008 | 9,411 | 2,184 | |||||||||
| Amortization of deferred financing costs |
164 | 15 | — | |||||||||
| Loss on impairment of natural gas properties |
146 | — | 2,592 | |||||||||
| Derivative instruments fair value (gain) loss |
(3,347 | ) | 74 | — | ||||||||
| (Increase) decrease in: |
||||||||||||
| Accounts receivable |
(9,126 | ) | (5,067 | ) | (623 | ) | ||||||
| Receivable from affiliate |
— | 25 | (26 | ) | ||||||||
| Gas collateral account |
— | (295 | ) | — | ||||||||
| Prepaid expenses and other |
15 | 55 | (123 | ) | ||||||||
| Cash receipts for settled derivatives |
4,627 | 64 | — | |||||||||
| Increase (decrease) in: |
||||||||||||
| Accounts payable |
69 | 347 | 7 | |||||||||
| Royalties payable |
4,749 | 1,734 | 337 | |||||||||
| Other accrued expenses |
928 | 1,050 | 16 | |||||||||
| Payable to affiliate |
(6,512 | ) | 2,499 | — | ||||||||
|
|
|
|
|
|
|
|||||||
| Net cash provided by operating activities |
55,381 | 13,395 | 4,216 | |||||||||
| Cash flows from investing activities: |
||||||||||||
| Capital expenditures for natural gas properties |
(94,099 | ) | (63,847 | ) | (29,499 | ) | ||||||
| Capital expenditures for property and other equipment |
— | (12 | ) | — | ||||||||
|
|
|
|
|
|
|
|||||||
| Net cash used in investing activities |
(94,099 | ) | (63,859 | ) | (29,499 | ) | ||||||
| Cash flows from financing activities: |
||||||||||||
| Proceeds from borrowings |
46,200 | 29,200 | — | |||||||||
| Debt issuance costs |
(628 | ) | (402 | ) | — | |||||||
| Capital contributions |
— | 20,000 | 29,600 | |||||||||
|
|
|
|
|
|
|
|||||||
| Net cash provided by financing activities |
45,572 | 48,798 | 29,600 | |||||||||
| Net increase (decrease) in cash |
6,854 | (1,666 | ) | 4,317 | ||||||||
| Cash at the beginning of the year |
4,445 | 6,111 | 1,794 | |||||||||
|
|
|
|
|
|
|
|||||||
| Cash at the end of the year |
$ | 11,299 | $ | 4,445 | $ | 6,111 | ||||||
|
|
|
|
|
|
|
|||||||
| Supplemental disclosure of non-cash investing and financing activities: |
||||||||||||
| Capital expenditures for natural gas properties financed by accounts payable |
$ | 19,599 | $ | 18,597 | $ | 8,357 | ||||||
| Capital expenditures for natural gas properties financed by other accrued liabilities |
1,775 | 3,489 | 8,823 | |||||||||
| Capital expenditures for natural gas properties financed by affiliate payable |
— | 6,038 | — | |||||||||
| Natural gas properties financed through deferred payment obligations |
138 | 331 | — | |||||||||
See accompanying Notes to Financial Statements.
F-65
Table of Contents
Index to Financial Statements
STATEMENTS OF PARTNERS’ CAPITAL
YEARS ENDED DECEMBER 31, 2013, 2012 AND 2011
| (in thousands) | Managing General Partner |
Limited Partners |
Total | |||||||||
| Balance as of December 31, 2010 |
$ | 8 | $ | 7,816 | $ | 7,824 | ||||||
| Capital contributions |
30 | 29,570 | 29,600 | |||||||||
| Net loss |
— | (148 | ) | (148 | ) | |||||||
|
|
|
|
|
|
|
|||||||
| Balance as of December 31, 2011 |
$ | 38 | $ | 37,238 | $ | 37,276 | ||||||
| Capital contributions |
20 | 19,980 | 20,000 | |||||||||
| Net income |
3 | 3,480 | 3,483 | |||||||||
|
|
|
|
|
|
|
|||||||
| Balance as of December 31, 2012 |
$ | 61 | $ | 60,698 | $ | 60,759 | ||||||
| Net income |
39 | 38,621 | 38,660 | |||||||||
|
|
|
|
|
|
|
|||||||
| Balance as of December 31, 2013 |
$ | 100 | $ | 99,319 | $ | 99,419 | ||||||
|
|
|
|
|
|
|
|||||||
See accompanying Notes to Financial Statements.
F-66
Table of Contents
Index to Financial Statements
NOTES TO FINANCIAL STATEMENTS
DECEMBER 31, 2013 AND 2012
| 1. | Summary of Significant Accounting Policies and Related Matters |
Organization and Operations
These financial statements present the activities for Alpha Shale Resources, LP (hereinafter referred to as the “Partnership”). The Partnership was organized as a limited partnership in accordance with the laws of the State of Delaware on February 3, 2010 (date of inception) through funding from its limited partners, Rice Drilling C, LLC (“Rice C”); a wholly-owned subsidiary of Rice Drilling B, LLC (“Rice B”) which in turn is a wholly-owned subsidiary of Rice Energy Inc. (“Rice Energy Inc.”); Foundation PA Coal Company, LLC (“PA Coal”), which is a wholly-owned indirect subsidiary of Alpha Natural Resources, Inc. (“ANR Holdings”); and its managing general partner, Alpha Shale Holdings, LLC (“Holdings”). According to the terms of the limited partnership agreement, revenues, costs and cash distributions of the Partnership are allocated 49.95% each to PA Coal and Rice and 0.10% to Holdings.
The Partnership is engaged primarily in the acquisition, exploration, development, production and sale of natural gas in the Marcellus Shale region of Southwestern Pennsylvania.
Use of Estimates
The preparation of financial statements in conformity with U.S. generally accepted accounting principles requires management to make estimates and assumptions that affect the reported amounts of assets and liabilities and disclosure of contingent assets and liabilities at the date of the financial statements and the reported amounts of revenues and expenses during the reporting period. Actual results could differ from those estimates and changes in these estimates are recorded when known.
Revenue Recognition
Sales of natural gas are recognized when natural gas has been delivered to a custody transfer point, persuasive evidence of a sales arrangement exists, the rights and responsibility of ownership pass to the purchaser upon delivery, collection of revenue from the sale is reasonably assured, and the sales price is fixed or determinable. Natural gas is sold by the Partnership under contract with the Partnership’s natural gas marketer and only current customer. Pricing provisions are tied to the Platts Gas Daily market prices.
Cash
The Partnership maintains cash at financial institutions which may at times exceed federally insured amounts and which may at times significantly exceed balance sheet amounts due to outstanding checks. The Partnership has no other accounts that are considered cash equivalents.
F-67
Table of Contents
Index to Financial Statements
Accounts Receivable
Accounts receivable are primarily from the Partnership’s sole gas marketer. The Partnership extends credit to parties in the normal course of business based upon management’s assessment of their creditworthiness. A valuation allowance is provided for those accounts for which collection is estimated as doubtful; uncollectible accounts are written off and charged against the allowance. In estimating the allowance, management considers, among other things, how recently and how frequently payments have been received and the financial position of the party. There was no allowance recorded for any of the periods presented in the financial statements.
| December 31, | ||||||||
| (in thousands) | 2013 | 2012 | ||||||
| Natural gas sales |
$ | 14,458 | $ | 5,570 | ||||
| Other |
384 | 146 | ||||||
|
|
|
|
|
|||||
| Total accounts receivable |
$ | 14,842 | $ | 5,716 | ||||
|
|
|
|
|
|||||
Natural Gas Properties
The Partnership uses the successful efforts method of accounting for gas-producing activities. Costs to acquire mineral interests in natural gas properties, to drill and equip exploratory wells that result in proved reserves are capitalized. Costs to drill exploratory wells that do not identify proved reserves as well as geological and geophysical costs and cost of carrying and retaining unproved properties are expensed.
Unproved natural gas properties that are individually significant are periodically assessed for impairment of value, and a loss is recognized at the time of impairment by providing an impairment allowance. Management determined that no impairment allowance was necessary as of December 31, 2013 and 2012. Capitalized costs of producing natural gas properties and support equipment directly related to such properties, after considering estimated residual salvage values, are depreciated and depleted by the unit-of-production method. Support equipment and other property and equipment not directly related to natural gas properties are depreciated over their estimated useful lives.
The Partnership assesses its proved natural gas properties for possible impairment on an annual basis, as events or changes in circumstances indicate that the carrying amount of an asset might not be recoverable. Management determined that no impairment allowance was necessary as of December 31, 2013 and 2012. During 2013, it was decided by the Operating Committee of the Partnership not to complete three vertical wells that had previously commenced drilling, as such an impairment charge of $0.1 million was recorded during the year ended December 31, 2013. There was no impairment charge during the year ended December 31, 2012. During 2011, it was decided by the Operating Committee of the Partnership not to complete two vertical wells that had previously commenced drilling. As such, an impairment charge of approximately $2.6 million was recorded during the year ended December 31, 2011.
Partnership estimates of proved reserves are based on quantities of natural gas that engineering and geological analysis demonstrates, with reasonable certainty, to be recoverable from established reservoirs in the future under current operating and economic conditions. External engineers prepare the annual reserve and economic evaluation of all properties on a well-by-well basis. Additionally, the Partnership adjusts natural gas reserves for major well rework or abandonment during the year as needed. The process of estimating and evaluating natural gas reserves is complex, requiring significant decisions in the evaluation of available geological, geophysical, engineering and economic data. The data for a given property may also change substantially over time as a result of numerous factors, including additional development activity, evolving production history and a continual reassessment of the viability of production under changing economic conditions. As a result, revisions in existing reserve estimates occur from time to time. Although every reasonable effort is made to ensure that reserve estimates represent the Partnership’s most accurate assessments possible, the subjective decisions and variances in available data for various properties increase the likelihood of
F-68
Table of Contents
Index to Financial Statements
significant changes in these estimates over time. Because estimates of reserves significantly affect the Partnership’s depreciation, depletion and amortization expense, as well as its impairment assessment of proved properties, a change in the Partnership’s estimated reserves could have a material effect on the Partnership’s net income or loss.
On the sale of an entire interest in an unproved property for cash, a gain or loss on the sale is recognized, taking into consideration the amount of any recorded impairment if the property had been assessed individually. If a partial interest in an unproved property is sold, the amount received is treated as a reduction of the cost of the interest retained unless the proceeds received are in excess of the cost basis which would result in gain on sale.
Interest
The Partnership capitalizes interest on expenditures for significant exploration and development projects while activities are in progress to bring the assets to their intended use. The following table summarizes the components of the Partnership’s interest incurred for the year indicated (in thousands):
| Year Ended December 31, | ||||||||
| 2013 | 2012 | |||||||
| Interest capitalized |
$ | 216 | $ | 143 | ||||
| Interest expensed |
880 | 372 | ||||||
|
|
|
|
|
|||||
| Total incurred |
$ | 1,096 | $ | 515 | ||||
|
|
|
|
|
|||||
Property and Other Equipment
Property and other equipment is recorded at cost and is being depreciated over estimated useful lives of five to fifteen years on a straight-line basis. Accumulated depreciation was $18 thousand and $9 thousand at December 31, 2013 and 2012, respectively. Depreciation expense was $9 thousand, $8 thousand and $1 thousand for the years ended December 31, 2013, 2012 and 2011, respectively, and is included in depreciation, depletion and amortization expense in the accompanying statements of operations.
Long-Lived Assets
Long-lived assets to be held and used or disposed of other than by sale are reviewed for impairment whenever events or changes in circumstances indicate that the carrying amount may not be recoverable. When required, impairment losses on assets to be held and used or disposed other than by sale are recognized based on the fair value of the asset. Long-lived assets to be disposed of by sale are reported at the lower of their carrying amount or fair value less selling costs.
Deferred Financing Costs
Deferred financing costs are amortized on a straight-line basis over the term of the related agreement. Accumulated amortization was $0.2 million and $15 thousand at December 31, 2013 and 2012, respectively. Amortization expense was $0.2 million, $15 thousand and $0 for the years ended December 31, 2013, 2012 and 2011, respectively. The annual amortization of deferred financing costs for years subsequent to December 31, 2013 is expected to be $0.3 million in each of the years through 2016 and $0.2 million in 2017.
Asset Retirement Obligations
The Partnership records the fair value of a legal liability for an asset retirement obligation in the period in which it is incurred. For gas properties, this is the period in which a gas well is acquired or drilled. The Partnership’s retirement obligations relate to the abandonment of gas-producing facilities and include costs to
F-69
Table of Contents
Index to Financial Statements
dismantle and relocate or dispose of the production platforms, gathering systems, wells and related structures. Estimates are based on historical experience in plugging and abandoning wells and estimated remaining lives of those wells based on reserve estimates.
When a new liability is recorded, the Partnership capitalizes the costs of the liability by increasing the carrying amount of the related long-lived asset. The liability is accreted to its present value each period and the capitalized cost is depreciated over the units of production basis.
Lease Obligations
The Partnership leases drilling rights under agreements which expire at various times. As of December 31, 2013, future minimum lease payments under these agreements expected to be paid during 2014 and 2015 are $0.1 million and $0.1 million, respectively, and are included as leasehold payables in the accompanying balance sheets.
Income Taxes
The Partnership is treated as a limited partnership for federal and state income tax purposes. Consequently, the Partnership is not subject to income taxes; instead its partners include the income in their tax returns.
Reclassifications
Certain reclassifications have been made to prior periods’ financial information related to accrued interest, other accrued liabilities and derivative liabilities to conform to the 2013 presentation.
| 2. | Capitalized Costs Relating to Natural Gas-Producing Activities |
Proved and unproved capitalized costs related to the Partnership’s natural gas-producing activities are as follows (in thousands):
| December 31, | ||||||||
| 2013 | 2012 | |||||||
| Capitalized costs: |
||||||||
| Proved, producing properties |
$ | 173,117 | $ | 50,437 | ||||
| Proved, non-producing properties |
45,861 | 75,338 | ||||||
|
|
|
|
|
|||||
| Total |
218,978 | 125,775 | ||||||
| Accumulated depreciation, depletion and amortization |
36,645 | 11,647 | ||||||
|
|
|
|
|
|||||
| Net capitalized costs |
$ | 182,333 | $ | 114,128 | ||||
|
|
|
|
|
|||||
| 3. | Long-Term Debt |
The Partnership had long-term debt outstanding as follows (in thousands):
| December 31, | ||||||||
| Description | 2013 | 2012 | ||||||
| Long-term Debt |
||||||||
| Wells Fargo Credit Facility |
$ | 75,400 | $ | 29,200 | ||||
|
|
|
|
|
|||||
| Total long-term debt |
$ | 75,400 | $ | 29,200 | ||||
|
|
|
|
|
|||||
F-70
Table of Contents
Index to Financial Statements
Wells Fargo Credit Facility
On September 7, 2012, the Partnership entered into a credit agreement (“Wells Fargo Credit Facility”) with Wells Fargo Bank, N.A. (“Wells Fargo”). The maximum credit amount allowed under the promissory note agreement is $200.0 million, payable at maturity with interest only due in monthly installments at the higher of the prime rate, the federal funds rate plus 0.5% or the adjusted LIBOR plus 1%; all unpaid balances are due September 7, 2017; secured by substantially all assets of the Partnership. The weighted average interest rate was 2.42% as of December 31, 2013. As of December 31, 2013, the Partnership issued letters of credit of $10.4 million with Wells Fargo as required by the Partnership’s natural gas marketer. The borrowing base as of December 31, 2013 was $145.0 million with approximately $59.2 million undrawn at that date. This credit facility was repaid using proceeds from the Rice Energy Inc. IPO during the first quarter of 2014.
The Wells Fargo Credit Facility provides for borrowings to be used for the purpose of funding capital expenditures related to the Partnership’s drilling program, providing working capital for lease acquisitions, exploration and production operations, and development (including the drilling and completion of producing wells), and for general business purposes, including fees and expenses. The Wells Fargo Credit Facility is subject to a maximum borrowing base equal to the maximum value, for credit purposes, of the subject properties as determined by Wells Fargo in accordance with its customary lending practices. The borrowing base is determined by the lenders on a quarterly basis and such determination is primarily based upon the value of the Partnership’s proved developed reserves. If the lenders were to decrease the borrowing base below the amounts outstanding under the facility, the Partnership would have to repay these amounts within 30 days, repay these amounts in six monthly installments, or add sufficient collateral value.
The Wells Fargo Credit Facility is subject to certain covenants which are ordinary to such credit facilities and include, among other things, minimum financial ratios, restrictions as to additional debt and changes to the Partnership’s structure. The Partnership was in compliance with such covenants and ratios as of December 31, 2013.
Interest paid in cash was $1.5 million and $0.1 million for the years ended December 31, 2013 and 2012, respectively. See Note 1 for information on capitalized interest.
| 4. | Fair Value of Financial Instruments |
The Partnership determines fair value on a recurring basis for its amounts related to its derivative instruments as the amounts are required to be recorded at fair value each reporting period. Fair value is based on quoted market prices, where available. If quoted market prices are not available, fair value is based upon models that use as inputs market-based parameters, including but not limited to forward curves, discount rates, broker quotes, volatilities, and nonperformance risk.
The Partnership has categorized its fair value measurements into a three-level fair value hierarchy, based on the priority of the inputs to the valuation technique. The fair value hierarchy gives the highest priority to quoted prices in active markets for identical assets and liabilities (Level 1) and the lowest priority to unobservable inputs (Level 3). All of the Partnership’s fair value measurements are included in Level 2. Since the adoption of fair value accounting, the Partnership has not made any changes to its classification of financial instruments in each category.
Items included in Level 2 are valued using management’s best estimate of fair value corroborated by third-party quotes.
F-71
Table of Contents
Index to Financial Statements
The following items were measured at fair value on a recurring basis during the period (refer to Note 7 for details relating to derivative instruments) (in thousands):
| December 31, 2013 |
Fair Value Measurements at Reporting Date Using | |||||||||||||||
| Description | Quoted Prices in Active Markets for Identical Assets (Level 1) |
Significant Other Observable Inputs (Level 2) |
Significant Unobservable Inputs (Level 3) |
|||||||||||||
| Assets: |
||||||||||||||||
| Derivative Instruments, at fair value |
$ | 1,010 | $ | — | $ | 1,010 | $ | — | ||||||||
|
|
|
|
|
|
|
|
|
|||||||||
| Total assets |
$ | 1,010 | $ | — | $ | 1,010 | $ | — | ||||||||
|
|
|
|
|
|
|
|
|
|||||||||
| Liabilities: |
||||||||||||||||
| Derivative Instruments, at fair value |
$ | 2,427 | $ | — | $ | 2,427 | $ | — | ||||||||
|
|
|
|
|
|
|
|
|
|||||||||
| Total liabilities |
$ | 2,427 | $ | — | $ | 2,427 | $ | — | ||||||||
|
|
|
|
|
|
|
|
|
|||||||||
| December 31, 2012 |
Fair Value Measurements at Reporting Date Using | |||||||||||||||
| Description | Quoted Prices in Active Markets for Identical Assets (Level 1) |
Significant Other Observable Inputs (Level 2) |
Significant Unobservable Inputs (Level 3) |
|||||||||||||
| Liabilities: |
||||||||||||||||
| Derivative Instruments, at fair value |
$ | 138 | $ | — | $ | 138 | $ | — | ||||||||
|
|
|
|
|
|
|
|
|
|||||||||
| Total liabilities |
$ | 138 | $ | — | $ | 138 | $ | — | ||||||||
|
|
|
|
|
|
|
|
|
|||||||||
The carrying amount of cash, receivables and accounts payable approximate their fair value due to the short-term nature of such instruments.
The estimated fair value of long-term debt on the balance sheet at December 31, 2012 is shown in the table below (refer to Note 3 for details relating to the borrowing arrangements (in thousands). The fair value was estimated using Level 3 inputs based on rates reflective of the remaining maturity as well as the Partnership’s financial position.
| December 31, | ||||||||
| Description | 2013 | 2012 | ||||||
| Long-term debt, at fair value: |
||||||||
| Wells Fargo Credit Facility |
$ | 75,400 | $ | 29,200 | ||||
|
|
|
|
|
|||||
| Total |
$ | 75,400 | $ | 29,200 | ||||
|
|
|
|
|
|||||
F-72
Table of Contents
Index to Financial Statements
| 5. | Asset Retirement Obligations |
The Partnership is subject to certain legal requirements which result in recognition of a liability related to the obligation to incur future plugging and abandonment costs. The Partnership records a liability for such asset retirement obligations and capitalizes a corresponding amount for asset retirement costs. The liability is estimated using the present value of expected future cash flows, adjusted for inflation and discounted at the Partnership’s credit adjusted risk-free rate. No wells were plugged or abandoned during 2012, nor were there any changes to assumptions. A reconciliation of the beginning and ending aggregate carrying amount of asset retirement obligations for the years ended December 31, 2013, 2012 and 2011 is as follows (in thousands):
| Balance at December 31, 2010 |
$ | 235 | ||
| Liabilities incurred |
67 | |||
| Accretion expense |
5 | |||
|
|
|
|||
| Balance at December 31, 2011 |
$ | 307 | ||
| Liabilities incurred |
138 | |||
| Accretion expense |
97 | |||
|
|
|
|||
| Balance at December 31, 2012 |
$ | 542 | ||
| Liabilities incurred |
110 | |||
| Accretion expense |
60 | |||
|
|
|
|||
| Balance at December 31, 2013 |
$ | 712 | ||
|
|
|
| 6. | Partners’ Capital |
The Partnership consists of three partners: Holdings, which is the managing general partner, and PA Coal and Rice C, the limited partners. The Partnership authorized and issued 10,000 units during 2010. In February 2010, Holdings contributed $6 thousand for 10 units, or a 0.10% ownership, and PA Coal and Rice each contributed $3.0 million for 4,995 shares, or 49.95% ownership each. In 2011, 2012 and 2013 the managing partner contributed an additional $30 thousand, $20 thousand, and $39 thousand, respectively, and the limited partners contributed an additional $29.6 million, $20.0 million and $38.6 million, respectively.
Since inception, the three partners have continued to make additional contributions into the Partnership, in accordance with ownership percentages, and no additional units were issued as depicted on the statements of changes in partners’ capital.
| 7. | Derivative Instruments |
The Partnership uses derivative commodity instruments that are placed with major financial institutions whose creditworthiness is regularly monitored. Our derivative counterparties share in the Credit Agreement collateral. The Partnership’s derivative commodity instruments have not been designated as hedges for accounting purposes; therefore, all gains and losses were recognized in income currently. As of December 31, 2013, the Partnership entered into derivative instruments with Wells Fargo Bank, N.A. and Bank of Montreal fixing the price it receives for natural gas through December 31, 2017, as summarized in the following table:
| Swap Contract Expiration | MMbtu/day | Weighted Average Price |
||||||
| 2014 |
83,648 | $ | 4.120 | |||||
| 2015 |
33,240 | $ | 4.173 | |||||
| 2016 |
30,000 | $ | 4.127 | |||||
| 2017 |
30,000 | $ | 4.127 | |||||
| Collar Contract Expiration | MMbtu/day | Floor/Ceiling | ||||||
| 2015 |
25,000 | $ | 3.750/$5.000 | |||||
F-73
Table of Contents
Index to Financial Statements
The following is a summary of the Partnership’s derivative instruments, which are recorded in the balance sheet as of December 31, 2013 and 2012 (in thousands):
| December 31, 2013 | December 31, 2012 | |||||||
| Current derivative assets |
$ | 1,140 | $ | 141 | ||||
| Long-term derivative assets |
1,577 | — | ||||||
|
|
|
|
|
|||||
| $ | 2,717 | $ | 141 | |||||
|
|
|
|
|
|||||
| Current derivative liabilities |
$ | 3,567 | $ | 279 | ||||
| Long-term derivative liabilities |
567 | — | ||||||
|
|
|
|
|
|||||
| $ | 4,134 | $ | 279 | |||||
|
|
|
|
|
|||||
| Net current value of derivative liabilities |
$ | (2,427 | ) | $ | (138 | ) | ||
|
|
|
|
|
|||||
| Net long-term value of derivative assets |
$ | 1,010 | $ | — | ||||
|
|
|
|
|
|||||
The following tables present the gross amounts of recognized derivative assets and liabilities, the amounts offset under netting arrangements with counterparties, and the resulting net amounts presented in the consolidated balance sheets for the periods presented, all at fair value:
| December 31, 2013 | ||||||||||||
| Description | Gross Amounts of Recognized Assets |
Gross Amounts Offset on Balance Sheet |
Net Amounts of Assets (Liabilities) on Balance Sheet |
|||||||||
| Derivative assets |
$ | 3,719 | $ | (1,002 | ) | $ | 2,717 | |||||
| Derivative liabilities |
$ | 736 | $ | (4,870 | ) | $ | (4,134 | ) | ||||
| December 31, 2012 | ||||||||||||
| Description | Gross Amounts of Recognized Assets |
Gross Amounts Offset on Balance Sheet |
Net Amounts of Assets (Liabilities) on Balance Sheet |
|||||||||
| Derivative assets |
$ | 324 | $ | (183 | ) | $ | 141 | |||||
| Derivative liabilities |
$ | 122 | $ | (401 | ) | $ | (279 | ) | ||||
Both realized and unrealized gains and losses are recorded as a gain or loss on derivatives in the consolidated statement of operations under other income/expense. Unrealized losses were $1.3 million and $0.1 million for the years ended December 31, 2013 and 2012, respectively. Realized gains related to contract settlements were $4.6 million and $0.1 million for the years ended December 31, 2013 and 2012, respectively. The Partnership did not have any derivative instruments as of December 31, 2011.
| 8. | Commitments and Contingencies |
The Partnership is involved in various litigation matters arising in the normal course of business. Management is not aware of any actions that are expected to have a material adverse effect on its financial position or results of operations.
The Partnership has drilling commitments which management expects to meet in the ordinary course of business.
| 9. | Related-Party Transactions |
During the years ended December 31, 2013 and 2012, the Partnership was billed for management services provided in the amount of $2.1 million and $1.3 million, respectively, which is included with general and administrative expenses on the statements of operations. As of December 31, 2013 and 2012, $2.0 million and
F-74
Table of Contents
Index to Financial Statements
$8.5 million, respectively, of costs were due to related entities and recorded as payable to affiliate on the balance sheets. Included in the 2013 amount are management service fees as described above as well as fees for gathering and transportation incurred by the Partnership that were billed to related parties. Included in the 2012 amount is $6.0 million relating to capitalized costs that were approved to be contributed from related entities.
During 2011, management services were provided by related entities; however, the partners agreed to waive charging a fee to the Partnership for these services for 2011.
Payments totaling $1.2 million, $0.5 million and $0.4 million were made during the years ended December 31, 2013, 2012 and 2011 respectively to Geological Engineering Services, Inc. (“GES”) in respect of consultancy services. GES is a drilling and completion engineering consulting company specializing in unconventional reservoirs like the Marcellus Shale. John P. LaVelle, Rice Energy’s Vice President of Drilling, served as president of GES from February 1994 until February 2010. There were no amounts outstanding between the Partnership and GES as of any period presented.
| 10. | Subsequent Events |
Transaction Agreement
On January 29, 2014, pursuant to the Transaction Agreement between Rice Energy Inc., Rice C and Alpha Holdings dated as of December 6, 2013 (the “Transaction Agreement”), Rice Energy Inc. completed their acquisition of Alpha Holdings’ 50% interest in the Partnership in exchange for total consideration of $322 million, consisting of $100 million of cash and the issuance to Alpha Holdings of 9,523,810 shares of Rice Energy Inc. common stock.
Subsequent events have been considered for disclosure and recognition through March 21, 2014, the same date the financial statements were available to be issued.
| 11. | Supplemental Information on Gas-Producing Activities (Unaudited) |
Costs incurred for property acquisitions, exploration and development for the years ended December 31, 2013, 2012 and 2011 are as follows (in thousands):
| For the Years Ended December 31, | ||||||||||||
| 2013 | 2012 | 2011 | ||||||||||
| Acquisitions: |
||||||||||||
| Unproved leaseholds |
$ | — | $ | — | $ | 1,038 | ||||||
| Development costs |
93,142 | 93,450 | 43,400 | |||||||||
| Exploration costs: |
||||||||||||
| Geological and geophysical |
— | — | — | |||||||||
|
|
|
|
|
|
|
|||||||
| Total costs incurred |
$ | 93,142 | $ | 93,450 | $ | 44,438 | ||||||
|
|
|
|
|
|
|
|||||||
The following table presents the results of operations related to natural gas production (in thousands):
| For the Years Ended December 31, | ||||||||||||
| 2013 | 2012 | 2011 | ||||||||||
| Revenues |
$ | 90,677 | $ | 26,284 | $ | 5,744 | ||||||
| Production costs |
25,114 | 10,872 | 758 | |||||||||
| Impairment of gas properties |
— | — | 2,592 | |||||||||
| Depreciation, depletion and amortization |
25,000 | 9,404 | 2,184 | |||||||||
| General and administrative expenses |
3,114 | 1,972 | — | |||||||||
|
|
|
|
|
|
|
|||||||
| Results of operations from producing activities |
$ | 37,449 | $ | 4,036 | $ | 210 | ||||||
|
|
|
|
|
|
|
|||||||
F-75
Table of Contents
Index to Financial Statements
Reserve quantity information for the years ended December 31, 2013, 2012 and 2011 are as follows (in thousands):
| 2013 | 2012 | 2011 | ||||||||||
| Proved developed and undeveloped reserves: |
||||||||||||
| Beginning of year |
256,236 | 116,206 | — | |||||||||
| Extensions and discoveries |
39,623 | 196,238 | 117,600 | |||||||||
| Revision of previous estimates |
(53,605 | ) | (47,616 | ) | — | |||||||
| Production |
(22,886 | ) | (8,592 | ) | (1,394 | ) | ||||||
|
|
|
|
|
|
|
|||||||
| End of year |
219,368 | 256,236 | 116,206 | |||||||||
|
|
|
|
|
|
|
|||||||
| Proved developed reserves: |
||||||||||||
| End of year |
104,741 | 70,026 | 28,948 | |||||||||
| Proved developed reserves: |
||||||||||||
| End of year |
114,627 | 186,210 | 87,258 | |||||||||
The Partnership added 39,623 MMcf, 196,238 MMcf and 117,600 MMcf through its drilling program in the Marcellus Shale in 2013, 2012 and 2011, respectively. In 2013, the Partnership had net negative revisions of 53,605 MMcf due primarily to performance revisions. In 2012, the Partnership had net negative revisions of 47,616 MMcf due primarily to declines in natural gas pricing.
Information with respect to estimated discounted future net cash flows related to its proved natural gas reserves as of December 31, is as follows (in thousands):
| 2013 | 2012 | 2011 | ||||||||||
| Future cash inflows |
$ | 854,334 | $ | 728,314 | $ | 504,768 | ||||||
| Future production costs |
(264,853 | ) | (254,172 | ) | (59,366 | ) | ||||||
| Future development costs |
(92,689 | ) | (172,426 | ) | (103,764 | ) | ||||||
|
|
|
|
|
|
|
|||||||
| Future net cash flows |
496,792 | 301,716 | 341,638 | |||||||||
| 10% annual discount for estimated timing of cash flows |
(204,586 | ) | (159,562 | ) | (200,464 | ) | ||||||
|
|
|
|
|
|
|
|||||||
| Standardized measure of discounted future net cash flows |
$ | 292,206 | $ | 142,154 | $ | 141,174 | ||||||
|
|
|
|
|
|
|
|||||||
For 2013, the reserves were computed using unweighted arithmetic averages of the closing prices on the first day of each month during 2013, adjusted for energy content and a regional price differential. For 2013, this adjusted gas price was $3.90 per Mcf.
For 2012, the reserves were computed using unweighted arithmetic averages of the closing prices on the first day of each month during 2012, adjusted for energy content and a regional price differential. For 2012, this adjusted gas price was $2.84 per Mcf.
For 2011, the reserves were computed using unweighted arithmetic averages of the closing prices on the first day of each month during 2011, adjusted for energy content and a regional price differential. For 2011, this adjusted gas price was $4.34 per Mcf.
F-76
Table of Contents
Index to Financial Statements
The following is the principal sources of changes in the standardized measure of discounted future net cash flows (in thousands):
| 2013 | 2012 | 2011 | ||||||||||
| Balance at beginning of period |
$ | 142,154 | $ | 141,174 | $ | — | ||||||
| Net change in prices and production costs |
163,948 | (53,710 | ) | — | ||||||||
| Net change in future development costs |
5,563 | (524 | ) | — | ||||||||
| Natural gas net revenues |
(65,563 | ) | (15,414 | ) | (4,988 | ) | ||||||
| Extensions |
37,901 | 76,262 | 146,162 | |||||||||
| Revisions of previous quantity estimates |
(29,504 | ) | (57,846 | ) | — | |||||||
| Previously estimated development costs incurred |
62,507 | 25,724 | — | |||||||||
| Accretion of discount |
14,222 | 14,118 | — | |||||||||
| Changes in timing and other |
(39,022 | ) | 12,370 | — | ||||||||
|
|
|
|
|
|
|
|||||||
| Balance at end of period |
$ | 292,206 | $ | 142,154 | $ | 141,174 | ||||||
|
|
|
|
|
|
|
|||||||
F-77
Table of Contents
Index to Financial Statements
To the Partners of
Alpha Shale Resources, LP
Canonsburg, Pennsylvania
We have audited the accompanying balance sheet of Alpha Shale Resources, LP (Partnership) as of December 31, 2011 and for the year then ended and the related statements of operations, changes in partners’ capital and cash flows. These financial statements are the responsibility of the Partnership’s management. Our responsibility is to express an opinion on these financial statements based on our audit.
We conducted our audit in accordance with the auditing standards generally accepted in the United States of America. Those standards require that we plan and perform the audit to obtain reasonable assurance about whether the financial statements are free of material misstatement. Our audit included consideration of internal control over financial reporting as a basis for designing audit procedures that are appropriate in the circumstances, but not for the purpose of expressing an opinion on the effectiveness of the Partnership’s internal control over financial reporting. Accordingly, we express no such opinion. An audit includes examining, on a test basis, evidence supporting the amounts and disclosures in the financial statements. An audit also includes assessing the accounting principles used and significant estimates made by Management, as well as evaluating the overall financial statement presentation. We believe that our audit provides a reasonable basis for our opinion.
In our opinion, the financial statements referred to above present fairly, in all material respects, the financial position of Alpha Shale Resources, LP as of December 31, 2011 and for the year then ended and the results of its operations and its cash flows, in conformity with accounting principles generally accepted in the United States of America.
/s/ Schneider Downs & Co., Inc.
Pittsburgh, Pennsylvania
April 20, 2012
F-78
Table of Contents
Index to Financial Statements
BALANCE SHEET
| (in thousands) | December 31, 2011 | |||
| Assets |
||||
| Current assets: |
||||
| Cash and cash equivalents |
$ | 6,111 | ||
| Accounts receivable |
649 | |||
| Due from general partner |
26 | |||
| Prepaids and other current assets |
163 | |||
|
|
|
|||
| Total current assets |
6,949 | |||
| Natural gas properties, net |
48,222 | |||
|
|
|
|||
| Total assets |
$ | 55,171 | ||
|
|
|
|||
| Liabilities and partners’ capital |
||||
| Current liabilities: |
||||
| Accounts payable |
$ | 8,366 | ||
| Accrued capital expenses |
8,823 | |||
| Revenues payable |
348 | |||
| Other accrued expenses |
51 | |||
|
|
|
|||
| Total current liabilities |
17,588 | |||
| Long-term liabilities: |
||||
| Asset retirement obligations |
307 | |||
|
|
|
|||
| Total liabilities |
17,895 | |||
| Partners’ capital |
||||
| Managing general partner |
38 | |||
| Limited partners |
37,238 | |||
|
|
|
|||
| Total partners’ capital |
37,276 | |||
|
|
|
|||
| Total liabilities and partners’ capital |
$ | 55,171 | ||
|
|
|
|||
See accompanying Notes to Financial Statements.
F-79
Table of Contents
Index to Financial Statements
STATEMENT OF OPERATIONS
FOR THE YEAR ENDED DECEMBER 31, 2011
| (in thousands) | 2011 | |||
| Revenues: |
||||
| Natural gas sales |
$ | 5,744 | ||
| Costs and expenses: |
||||
| Natural gas production costs |
757 | |||
| Depreciation, depletion and amortization |
2,184 | |||
| Loss on impairment of oil and gas properties |
2,592 | |||
| General and administrative expenses |
359 | |||
|
|
|
|||
| Total costs and expenses |
5,892 | |||
|
|
|
|||
| Net loss |
$ | (148 | ) | |
|
|
|
|||
See accompanying Notes to Financial Statements.
F-80
Table of Contents
Index to Financial Statements
STATEMENT OF CASH FLOWS
FOR THE YEAR ENDED DECEMBER 31, 2011
| (in thousands) | 2011 | |||
| Cash flows from operating activities: |
||||
| Net loss |
$ | (148 | ) | |
| Adjustments to reconcile net loss to net cash provided by operating activities: |
||||
| Depreciation, depletion and amortization |
2,184 | |||
| Loss on impairment of natural gas properties |
2,592 | |||
| Changes in assets and liabilities: |
||||
| Accounts receivable |
(649 | ) | ||
| Prepaid and other assets |
(123 | ) | ||
| Accounts payable |
7 | |||
| Accrued expenses |
353 | |||
|
|
|
|||
| Net cash provided by operating activities |
4,216 | |||
|
|
|
|||
| Cash flows from investing activities: |
||||
|
|
|
|||
| Purchase and development of natural gas properties |
(29,499 | ) | ||
|
|
|
|||
| Cash flows from financing activities: |
||||
|
|
|
|||
| Capital contributions |
29,600 | |||
|
|
|
|||
| Net increase in cash and cash equivalents |
4,317 | |||
| Cash and cash equivalents: |
||||
| Beginning of year |
1,794 | |||
|
|
|
|||
| End of year |
$ | 6,111 | ||
|
|
|
|||
| Supplemental schedule of noncash investing and financing activities |
||||
| Capital expenditures for natural gas properties financed by accounts payable and accrued expenses |
$ | 14,939 | ||
| Asset retirement obligation, with a corresponding increase to natural gas properties |
$ | 68 | ||
See accompanying Notes to Financial Statements.
F-81
Table of Contents
Index to Financial Statements
STATEMENT OF CHANGES IN PARTNERS’ CAPITAL
FOR THE YEAR ENDED DECEMBER 31, 2011
| (in thousands) | Managing General Partner |
Limited Partners | Total Capital | |||||||||
| Balance as of December 31, 2010 |
$ | 8 | $ | 7,816 | $ | 7,824 | ||||||
| Capital contributions |
30 | 29,570 | 29,600 | |||||||||
| Net loss |
— | (148 | ) | (148 | ) | |||||||
|
|
|
|
|
|
|
|||||||
| Balance as of December 31, 2011 |
$ | 38 | $ | 37,238 | $ | 37,276 | ||||||
|
|
|
|
|
|
|
|||||||
See accompanying Notes to Financial Statements.
F-82
Table of Contents
Index to Financial Statements
NOTES TO FINANCIAL STATEMENTS
DECEMBER 31, 2011
| 1. | Organization and Operations |
These financial statements present the activities for Alpha Shale Resources, LP (hereinafter referred to as the Partnership). The Partnership was organized as a limited partnership in accordance with the laws of the State of Delaware on February 3, 2010 (date of inception) through funding from its limited partners, Foundation PA Coal Company, LLC (Alpha Holdings), and Rice Drilling C, LLC (Rice Drilling C) and its managing general partner, Alpha Shale Holdings, LLC (Holdings). According to the terms of the limited partnership agreement, revenues, costs and cash distributions of the Partnership are allocated 49.95% each to Alpha Holdings and Rice Drilling C and 0.10% to Holdings.
Alpha is engaged primarily in the acquisition, exploration, development, production and sale of natural gas. Drilling is engaged in the tendering of natural gas wells in the Marcellus Shale region of Southwestern Pennsylvania. The Partnership sells its natural gas products solely to a natural gas marketing customer, which accounts for 100% of its accounts receivable as of December 31, 2011, and 100% of its sales for the year ended December 31, 2011. Natural gas sales included in the statement of operations consist of sales for one horizontal well, which was in production from May 2011 through December 31, 2011.
| 2. | Summary of Significant Accounting Policies |
A summary of significant accounting policies consistently applied by management in the preparation of the accompanying financial statements follows:
Use of Estimates. The preparation of financial statements in conformity with generally accepted accounting principles requires management to make estimates and assumptions that affect the reported amounts of assets and liabilities and disclosure of contingent assets and liabilities at the date of the financial statements and the reported amounts of revenues and expenses during the reporting period. Actual results could differ from those estimates.
Natural Gas Properties. The Partnership uses the successful efforts method of accounting for gas-producing activities. Costs to acquire mineral interests in natural gas properties, drill and equip exploratory wells that find proved reserves, and drill and equip development wells and related asset retirement costs are capitalized. Depletion is based on cost less estimated salvage value using the unit-of-production method. The process of estimating and evaluating natural gas reserves is complex, requiring significant decisions in the evaluation of geological, geophysical, engineering and economic data. Costs to drill exploratory wells that do not find proved reserves, geological and geophysical costs, and costs of carrying and retaining unproved properties are expensed.
Partnership estimates of proved reserves are based on quantities of natural gas that engineering and geological analysis demonstrates, with reasonable certainty, to be recoverable from established reservoirs in the future under current operating and economic conditions. The petroleum engineers prepare the annual reserve and economic evaluation of all properties on a well-by-well basis. Additionally, the Partnership adjusts natural gas reserves for major well rework or abandonment during the year as needed. The process of estimating and evaluating natural gas reserves is complex, requiring significant decisions in the evaluation of available geological, geophysical, engineering and economic data. The data for a given property may also change substantially over time as a result of numerous factors, including additional development activity, evolving production history and a continual reassessment of the viability of production under changing economic conditions. As a result, revisions in existing reserve estimates occur from time to time. Although every reasonable effort is made to ensure that reserve estimates represent the Partnership’s most accurate assessments possible, the subjective decisions and variances in available data for various properties increase the likelihood of significant changes in these estimates over time. Because estimates of reserves significantly affect the Partnership’s depreciation, depletion and amortization expense, a change in the Partnership’s estimated reserves could have a material effect on the Partnership’s net income.
F-83
Table of Contents
Index to Financial Statements
Unproved natural gas properties that are individually significant are periodically assessed for impairment of value, and a loss is recognized at the time of impairment by providing an impairment allowance. Management determined that no impairment allowance was necessary at December 31, 2011. Unproved natural gas properties approximated $3.8 million at December 31, 2011. Capitalized costs of producing natural gas properties, after considering estimated residual salvage values, are depreciated and depleted by the unit-of-production method. Support equipment and other property and equipment are depreciated over their estimated useful lives. Wells in progress approximated $27.8 million at December 31, 2011.
The Partnership assesses its proved natural gas properties for possible impairment on an annual basis, as events or changes in circumstances indicate that the carrying amount of an asset might not be recoverable. During 2011, it was decided by the Operating Committee of the Partnership not to complete two vertical wells that had previously been drilled. As such, an impairment charge of approximately $2.6 million was recorded during the period ended December 31, 2011.
On the sale of an entire interest in an unproved property for cash or cash equivalent, gain or loss on the sale is recognized, taking into consideration the amount of any recorded impairment if the property had been assessed individually. If a partial interest in an unproved property is sold, the amount received is treated as a reduction of the cost of the interest retained.
Revenue Recognition. Sales of natural gas are recognized when natural gas has been delivered to a custody transfer point, persuasive evidence of a sales arrangement exists, the rights and responsibility of ownership pass to the purchaser upon delivery, collection of revenue from the sale is reasonably assured, and the sales price is fixed or determinable. Natural gas is sold by the Partnership under contract with the Partnership’s natural gas marketer and only current customer. All of the Partnership contracts’ pricing provisions are tied to Platts Gas Daily market prices. As a result, the Partnership’s revenue from the sale of natural gas will suffer if market prices decline and benefit if they increase. The Partnership believes that the pricing provisions of its natural gas contracts are customary in the industry.
Cash and Cash Equivalents. The Partnership maintains cash that might exceed federally insured amounts at times. The Partnership considers all items purchased with a maturity of three months or less and all interest-bearing money market funds to be cash and cash equivalents.
Accounts Receivable. The Partnership performs ongoing credit evaluations of its customer and does not require collateral. Provisions are made for estimated uncollectible trade accounts receivable. The Partnership’s estimate is based on historical collection experience, a review of current status of trade receivables and judgment. Decisions to charge-off receivables are based on management’s judgment after consideration of facts and circumstances surrounding potential uncollectible accounts. Management determined that no allowance was necessary at December 31, 2011.
Asset Retirement Obligations. The Partnership accounts for its asset retirement obligations, plugging costs, as required by the Asset Retirement and Environmental Obligations topic of the Financial Accounting Standards Board (FASB) Accounting Standards Codification (Codification or ASC), which requires that the fair value of an asset retirement obligation be recognized in the period in which it is incurred if a reasonable estimate of fair value can be made. The present value of the estimated asset retirement costs is capitalized as part of the carrying amount of the long-lived asset. For the Partnership, asset retirement obligations primarily relate to the abandonment of natural gas-producing facilities and are accreted over the estimated life of the related asset, for the change in present value. The initial capitalized costs are depleted over the useful lives of the related asset, through charges to depreciation, depletion and amortization expense. If the fair value of the estimated asset retirement obligation changes, an adjustment is recorded to both the asset retirement obligation and the asset retirement cost. Revisions in estimated liabilities can result from revisions of estimated inflation rates, escalating retirement costs and changes in the estimated timing of settling asset retirement obligations.
F-84
Table of Contents
Index to Financial Statements
The estimated liability is based on historical experience in plugging and abandoning wells, estimated remaining lives of those based on reserve estimates, external estimates as to the cost to plug and abandon the wells in the future, and federal and state regulatory requirements. The liability is discounted using an assumed credit-adjusted, risk-free interest rate. Revisions to the liability could occur due to changes in estimates of plugging and abandonment costs or remaining lives of the wells, or if federal or state regulations enact new plugging and abandonment requirements. The Partnership has a $25 thousand bond deposit, legally restricted for purposes of settling asset retirement obligations in the Commonwealth of Pennsylvania. This bond deposit is included in prepaid and other assets.
A reconciliation of the Partnership’s liability for well plugging and abandonment costs as of December 31, 2011 is as follows (in thousands):
| Asset retirement obligations, beginning of year |
$ | 235 | ||
| Additions |
67 | |||
| Accretion expense |
5 | |||
|
|
|
|||
| Asset retirement obligations, end of year |
$ | 307 | ||
|
|
|
The accretion expense relative to the asset retirement obligations is included on the statements of operations under the caption depreciation, depletion and amortization.
Income Taxes. The Partnership is organized as a limited partnership and is not subject to federal or state income taxes. Accordingly, no provision has been made for current or deferred income taxes in these financial statements. The taxable income of the Partnership is included in the tax return of the individual partners. In addition, the Partnership has not identified any material uncertain tax positions requiring an accrual or disclosure in the financial statements. The Partnership accrues interest and penalties related to unrecognized tax benefits in income tax expense. Additionally, the Partnership’s U.S. Federal income tax return filed for 2010 remains subject to examination by the Internal Revenue Service (IRS).
Recent Accounting Pronouncements. In January 2010, the FASB issued the Accounting Standards Update (ASU), Fair Value Measurements Disclosures, to require new disclosures for fair value measurements and to provide clarification for existing disclosure requirements. More specifically, this update will require (1) an entity to disclose separately the amounts of significant transfers in and out of Levels I and 2 fair value measurements and to describe the reasons for the transfers; and (2) information about purchases, sales, issuances and settlements to be presented separately on a gross basis rather than net, in the reconciliation for fair value measurements using significant unobservable inputs (Level 3 inputs). The ASU clarifies existing disclosure requirements for the level of disaggregation used for classes of assets and liabilities measured at fair value and requires disclosures about the valuation techniques and inputs used to measure fair value for both recurring and nonrecurring fair value measurements using Level 2 and Level 3 inputs. The adoption of the ASU by the Partnership did not materially impact or expand its financial statement footnote disclosures.
| 3. | Natural Gas Properties |
Natural gas properties at December 31, 2011 consist of the following (in thousands):
| 2011 | ||||
| Unproved properties |
$ | 3,843 | ||
| Proved and producing |
18,691 | |||
|
|
|
|||
| Natural gas properties, successful efforts method, at cost |
22,534 | |||
| Less—Accumulated depreciation, depletion and amortization |
2,210 | |||
|
|
|
|||
| 20,324 | ||||
| Natural gas properties in progress |
27,898 | |||
|
|
|
|||
| Total natural gas properties |
$ | 48,222 | ||
|
|
|
|||
F-85
Table of Contents
Index to Financial Statements
Included in proved and producing are the estimated costs associated with the Partnership’s asset retirement obligations discussed in Note 2, which approximated $0.3 million at December 31, 2011.
| 4. | Partners’ Capital |
The Partnership consists of three partners: Holdings, which is the managing general partner, and Alpha Holdings and Rice Drilling C, the limited partners. The Partnership authorized and issued 10,000 units during 2010. In February 2010, Holdings contributed $6 thousand for 10 units, or a 0.10% ownership, and Alpha Holdings and Rice Drilling C each contributed $3.0 million for 4,995 shares, or 49.95% ownership each.
In November 2010, the Partnership had an additional capital call amounting to $4.0 million, of which $4 thousand was contributed by Holdings; and Alpha Holdings and Rice Drilling C contributed $2.0 million each, in line with ownership percentages; and no additional units were issued.
During 2011, the three partners continued to make contributions into Alpha, in line with ownership percentages, and no additional units were issued as depicted on the Statement of Changes in Partners’ Capital.
| 5. | Contingencies |
The Partnership is involved in various legal proceedings arising out of the normal conduct of its business. In the opinion of management, the ultimate resolution of such matters will not have a material effect on the financial position or results of operations of the Partnership.
The Partnership is subject to various federal, state and local laws and regulations relating to the protection of the environment. The Partnership has established procedures for the ongoing evaluation of its operations, to identify potential environmental exposures and to comply with regulatory policies and procedures.
The Partnership accounts for environmental contingencies in accordance with the Contingencies topic of the FASB Codification. Environmental expenditures that relate to current operations are expensed or capitalized as appropriate. Expenditures that relate to an existing condition caused by past operations, and do not contribute to current or future revenue generation, are expensed. Liabilities are recorded when environmental assessment and/or cleanup is probable, and the costs can be reasonably estimated. The Partnership maintains insurance that may cover in whole or in part certain environmental expenditures. At December 31, 2011, the Partnership had no environmental contingencies requiring specific disclosure or accrual.
| 6. | Related-Party Activity |
During 2011, management services were provided by related entities to the Partnership; however, the partners agreed to waive charging a fee to Alpha for these services for 2011.
During the year ended December 31, 2011, the Partnership incurred expenses relative to the development and production of natural gas properties with related parties amounting to approximately $0.5 million.
Amounts due to partners and related parties approximated $33 thousand at December 31, 2011.
| 7. | Fair Value Measurements |
Fair value measurement requires disclosures that categorize assets and liabilities measured at fair value into one of three different levels depending on the assumptions (i.e., inputs) used in the valuation. Level 1 provides the most reliable measure of fair value, while Level 3 generally requires significant management judgment: Financial assets and liabilities are classified in their entirety based on the lowest level of input significant to the fair value measurement. The fair value hierarchy is defined as follows:
Level 1—Valuations are based on unadjusted quoted prices in active markets for identical assets or liabilities.
F-86
Table of Contents
Index to Financial Statements
Level 2—Valuations are based on quoted prices for similar assets or liabilities in active markets, or quoted prices in markets that are not active for which significant inputs are observable, either directly or indirectly.
Level 3—Valuations are based on prices or valuation techniques that require inputs that are both unobservable and significant to the overall fair value measurement. Inputs reflect management’s best estimate of what market participants would use in valuing the asset or liability at the measurement date.
At December 31, 2011, the Partnership’s financial instruments consist primarily of cash, accounts receivable and accounts payable. The carrying amount of cash, receivables and accounts payable approximate their fair value due to the short-term nature of such instruments.
The Partnership reviews long-lived assets, including natural gas properties, for impairment whenever events or changes in circumstances indicate that the carrying amount of the assets might not be recoverable. If the estimated undiscounted cash flows for a particular asset are not sufficient to cover the asset’s carrying value, it is impaired and the carrying value is reduced to the asset’s current fair value. These fair value measurements fell within Level 3 of the fair value hierarchy. During 2011, the Partnership determined that certain natural gas properties were impaired, resulting in an impairment charge of $2.6 million. The impairment charge reduced the remaining carrying value of these properties to their aggregate fair value of approximately $0 at December 31, 2011.
| 8. | Subsequent Events |
Subsequent events are defined as events or transactions that occur after the balance sheet date, but before the financial statements are issued or are available to be issued. Management has evaluated subsequent events through April 20, 2012, the date on which the financial statements were available to be issued and noted that there was an additional capital contribution in February 2012 in the amount of $12.0 million.
F-87
Table of Contents
Index to Financial Statements
Independent Accountants’ Compilation Report
To the Members of
Countrywide Energy Services, LLC
We have compiled the accompanying balance sheet of Countrywide Energy Services, LLC, a Pennsylvania limited liability company (the “Company”), as of December 31, 2013, and the related statements of operations, members’ capital, and cash flows for the year then ended. We have not audited or reviewed the accompanying financial statements and, accordingly, do not express an opinion or provide any assurance about whether the financial statements are in accordance with accounting principles generally accepted in the United States of America.
Management is responsible for the preparation and fair presentation of the financial statements in accordance with accounting principles generally accepted in the United States of America and for designing, implementing, and maintaining internal control relevant to the preparation and fair presentation of the financial statements.
Our responsibility is to conduct the compilation in accordance with Statements on Standards for Accounting and Review Services issued by the American Institute of Certified Public Accountants. The objective of a compilation is to assist management in presenting financial information in the form of financial statements without undertaking to obtain or provide any assurance that there are no material modifications that should be made to the financial statements.
/s/ Grossman Yanak & Ford LLP
Pittsburgh, Pennsylvania
March 3, 2014
F-88
Table of Contents
Index to Financial Statements
To the Members of
Countrywide Energy Services, LLC
We have audited the accompanying financial statements of Countrywide Energy Services, LLC, a Pennsylvania limited liability company, (the “Company”), which comprise the balance sheet as of December 31, 2012, and the statements of operations, members’ capital, and cash flows for the year ended December 31, 2012 and the period from May 9, 2011 to December 31, 2011, and the related notes to the financial statements.
Management’s Responsibility for the Financial Statements
Management is responsible for the preparation and fair presentation of these financial statements in accordance with accounting principles generally accepted in the United States of America; this includes the design, implementation, and maintenance of internal control relevant to the preparation and fair presentation of financial statements that are free from material misstatement, whether due to fraud or error.
Auditors’ Responsibility
Our responsibility is to express an opinion on these financial statements based on our audits. We conducted our audits in accordance with auditing standards generally accepted in the United States of America. Those standards require that we plan and perform the audits to obtain reasonable assurance about whether the financial statements are free from material misstatement.
An audit involves performing procedures to obtain audit evidence about the amounts and disclosures in the financial statements. The procedures selected depend on the auditors’ judgment, including the assessment of the risks of material misstatement of the financial statements, whether due to fraud or error. In making those risk assessments, the auditors consider internal control relevant to the entity’s preparation and fair presentation of the financial statements in order to design audit procedures that are appropriate in the circumstances, but not for the purpose of expressing an opinion on the effectiveness of the entity’s internal control. Accordingly, we express no such opinion. An audit also includes evaluating the appropriateness of accounting policies used and the reasonableness of significant accounting estimates made by management, as well as evaluating the overall presentation of the financial statements.
We believe that the audit evidence we have obtained is sufficient and appropriate to provide a basis for our audit opinion.
Opinion
In our opinion, the financial statements referred to above present fairly, in all material respects, the financial position of Countrywide Energy Services, LLC as of December 31, 2012, and the results of its operations and its cash flows for the year ended December 31, 2012 and the period from May 9, 2011 to December 31, 2011 in accordance with accounting principles generally accepted in the United States of America.
/s/ Grossman Yanak & Ford LLP
Pittsburgh, Pennsylvania
February 20, 2013
F-89
Table of Contents
Index to Financial Statements
Countrywide Energy Services, LLC
Balance Sheets
December 31, 2013 And 2012
| NOTES | 2013 | 2012 | ||||||||
| (in thousands) | (Unaudited) | |||||||||
| Assets |
||||||||||
| Current assets: |
||||||||||
| Cash |
1 | $ | 879 | $ | 152 | |||||
| Accounts receivable, net (less allowance for doubtful accounts of $23 thousand and $102 thousand) |
1 | 163 | 1,731 | |||||||
| Current portion of note receivable |
2 | 351 | — | |||||||
| Prepaid expenses and other |
79 | 65 | ||||||||
|
|
|
|
|
|||||||
| Total current assets |
1,472 | 1,948 | ||||||||
| Equipment, net |
1,3 | 62 | 2,453 | |||||||
| Note receivable |
2 | 1,049 | — | |||||||
| Deposits |
— | 112 | ||||||||
|
|
|
|
|
|||||||
| Total assets |
$ | 2,583 | $ | 4,513 | ||||||
|
|
|
|
|
|||||||
| Liabilities and members’ capital |
||||||||||
| Current liabilities: |
||||||||||
| Current maturities of notes payable |
4 | $ | — | $ | 105 | |||||
| Current maturities of capital lease obligations |
1,5 | 30 | 665 | |||||||
| Accounts payable |
9 | 494 | ||||||||
| Distributions payable |
148 | — | ||||||||
| Accrued interest |
— | 14 | ||||||||
| Accrued payroll and related expenses |
— | 134 | ||||||||
|
|
|
|
|
|||||||
| Total current liabilities |
187 | 1,412 | ||||||||
| Long-term liabilities: |
||||||||||
| Notes payable |
4 | — | 48 | |||||||
| Lease obligations |
1 | — | 152 | |||||||
|
|
|
|
|
|||||||
| Total liabilities |
187 | 1,612 | ||||||||
| Members’ capital |
1 | 2,396 | 2,901 | |||||||
|
|
|
|
|
|||||||
| Total liabilities and members’ capital |
$ | 2,583 | $ | 4,513 | ||||||
|
|
|
|
|
|||||||
See accompanying Notes to Financial Statements, Independent Accountants’ Compilation Report and Independent Auditors’ Report.
F-90
Table of Contents
Index to Financial Statements
Countrywide Energy Services, LLC
Statements of Operations
For the Years Ended December 31, 2013 (Unaudited) and 2012
and for the Period from May 9, 2011 to December 31, 2011
| Notes | 2013 | 2012 | 2011 | |||||||||||
| (in thousands) | (Unaudited) | |||||||||||||
| Net revenue |
1,6 | $ | 4,885 | $ | 8,560 | $ | 9,724 | |||||||
| Cost of revenue |
5 | 4,274 | 6,535 | 6,721 | ||||||||||
|
|
|
|
|
|
|
|||||||||
| Gross profit |
611 | 2,025 | 3,003 | |||||||||||
| Selling, general and administrative expenses |
1 | 628 | 1,623 | 1,137 | ||||||||||
|
|
|
|
|
|
|
|||||||||
| Income (loss) from operations |
(17 | ) | 402 | 1,866 | ||||||||||
| Other income (expense): |
||||||||||||||
| Interest expense |
5 | (90 | ) | (218 | ) | (16 | ) | |||||||
| Gain (loss) on disposal of equipment |
255 | (82 | ) | 20 | ||||||||||
|
|
|
|
|
|
|
|||||||||
| Other income (expense), net |
165 | (300 | ) | 4 | ||||||||||
|
|
|
|
|
|
|
|||||||||
| Net income |
$ | 148 | $ | 102 | $ | 1,870 | ||||||||
|
|
|
|
|
|
|
|||||||||
See accompanying Notes to Financial Statements, Independent Accountants’ Compilation Report and Independent Auditors’ Report.
F-91
Table of Contents
Index to Financial Statements
Countrywide Energy Services, LLC
Statements of Cash Flows
For the Years Ended December 31, 2013 (Unaudited) and 2012
and for the Period from May 9, 2011 to December 31, 2011
| 2013 | 2012 | 2011 | ||||||||||
| (in thousands) | (Unaudited) | |||||||||||
| Cash flows from operating activities: |
||||||||||||
| Net income |
$ | 148 | $ | 102 | $ | 1,870 | ||||||
| Adjustments to reconcile net income to net cash provided by operating activities: |
||||||||||||
| Depreciation |
754 | 910 | 276 | |||||||||
| (Gain) loss on sale of equipment |
(255 | ) | 82 | (20 | ) | |||||||
| (Increase) decrease in: |
||||||||||||
| Accounts receivable |
1,568 | 1,603 | (2,252 | ) | ||||||||
| Prepaid expenses and other assets |
99 | (6 | ) | (65 | ) | |||||||
| Increase (decrease) in: |
||||||||||||
| Accounts payable |
(485 | ) | (1,459 | ) | 1,088 | |||||||
| Other accrued liabilities |
(147 | ) | (56 | ) | 155 | |||||||
|
|
|
|
|
|
|
|||||||
| Net cash provided by operating activities |
1,682 | 1,176 | 1,052 | |||||||||
|
|
|
|
|
|
|
|||||||
| Cash flows from investing activities: |
||||||||||||
| Purchase of equipment |
(273 | ) | (152 | ) | (1,117 | ) | ||||||
| Proceeds from sale of equipment |
992 | 148 | 152 | |||||||||
|
|
|
|
|
|
|
|||||||
| Net cash provided by (used in) investing activities |
719 | (4 | ) | (965 | ) | |||||||
|
|
|
|
|
|
|
|||||||
| Cash flows from financing activities: |
||||||||||||
| Deposit related to capital lease |
— | — | (107 | ) | ||||||||
| Repayment of capital lease obligations |
(1,015 | ) | (916 | ) | (330 | ) | ||||||
| Repayment of debt |
(154 | ) | (116 | ) | (73 | ) | ||||||
| Receipt from member |
— | — | 400 | |||||||||
| Distributions to members |
(505 | ) | (10 | ) | (6 | ) | ||||||
|
|
|
|
|
|
|
|||||||
| Net cash used in financing activities |
(1,674 | ) | (1,042 | ) | (116 | ) | ||||||
|
|
|
|
|
|
|
|||||||
| Net increase (decrease) in cash |
727 | 130 | (29 | ) | ||||||||
| Cash, beginning of period |
152 | 22 | 51 | |||||||||
|
|
|
|
|
|
|
|||||||
| Cash, end of period |
$ | 879 | $ | 152 | $ | 22 | ||||||
|
|
|
|
|
|
|
|||||||
| Supplemental disclosures of cash flow information: |
||||||||||||
| Cash paid during the period for interest |
$ | 104 | $ | 213 | $ | 7 | ||||||
|
|
|
|
|
|
|
|||||||
F-92
Table of Contents
Index to Financial Statements
Supplemental disclosure of noncash investing and financing activities:
During the year ended December 31, 2013, the Company financed equipment acquisitions of $0.2 million with capital leases. Additionally, equipment was sold in exchange for cash of $0.4 million and a note receivable of $1.4 million (see Note 2).
Also as of December 31, 2013, distributions of $0.1 million were included in distributions payable.
During the year ended December 31, 2012, the Company financed equipment acquisitions of $0.2 million with capital leases.
During the period from May 9, 2011 to December 31, 2011, the Company financed equipment acquisitions of $2.1 million with a note payable of $0.3 million and capital leases of $1.8 million. Additionally, equipment purchases of $0.3 million were unpaid and included in accounts payable as of December 31, 2011.
See accompanying Notes to Financial Statements, Independent Accountants’ Compilation Report and Independent Auditors’ Report.
F-93
Table of Contents
Index to Financial Statements
Countrywide Energy Services, LLC
Statements of Members’ Capital
For the Years Ended December 31, 2013 (Unaudited) and 2012
and for the Period from May 9, 2011 to December 31, 2011
| (in thousands) | Contributed Capital |
Accumulated Income |
Receivable from Member |
Total | ||||||||||||
| Balance as of May 9, 2011 |
$ | 359 | $ | 586 | $ | (400 | ) | $ | 545 | |||||||
| Receipt from member |
— | — | 400 | 400 | ||||||||||||
| Net income |
— | 1,870 | — | 1,870 | ||||||||||||
| Distributions |
— | (6 | ) | — | (6 | ) | ||||||||||
|
|
|
|
|
|
|
|
|
|||||||||
| Balance as of December 31, 2011 |
359 | 2,450 | — | 2,809 | ||||||||||||
| Net income |
— | 102 | — | 102 | ||||||||||||
| Distributions |
— | (10 | ) | — | (10 | ) | ||||||||||
|
|
|
|
|
|
|
|
|
|||||||||
| Balance as of December 31, 2012 |
359 | 2,542 | — | 2,901 | ||||||||||||
| Net income (Unaudited) |
— | 148 | — | 148 | ||||||||||||
| Distributions (Unaudited) |
— | (653 | ) | — | (653 | ) | ||||||||||
|
|
|
|
|
|
|
|
|
|||||||||
| Balance as of December 31, 2013 (Unaudited) |
$ | 359 | $ | 2,037 | $ | — | $ | 2,396 | ||||||||
|
|
|
|
|
|
|
|
|
|||||||||
See accompanying Notes to Financial Statements, Independent Accountants’ Compilation Report and Independent Auditors’ Report.
F-94
Table of Contents
Index to Financial Statements
Countrywide Energy Services, LLC
Notes To Financial Statements
| 1. | Summary of Significant Accounting Policies and Related Matters |
Organization and Activity—The Company was organized as a Pennsylvania limited liability company on January 21, 2010. The Company offers a wide-range of roustabout and oil field services to enterprises that are exploring and extracting Pennsylvania’s Marcellus Shale natural gas. These services include logistics, site preparation, maintenance, water transfer, land reclamation and production services.
Prior to the Company’s amended and restated operating agreement dated May 9, 2011, the Company had a sole member. Effective May 9, 2011, a 50% membership interest in the Company was purchased by Rice Drilling B LLC (“Rice Drilling B”).
Basis of Accounting—The Company maintains its accounting records on the accrual basis of accounting. Revenues are recognized for services provided or equipment on site based upon daily rates as specified in master service agreements with customers. Expenses are recognized as incurred.
The members of the Company decided that operations would be discontinued in the summer of 2013 as a result of the departure of the Company’s president. Subsequent operating activity has been limited to finishing work on outstanding contracts and selling the operating assets of the Company to an unrelated third party in exchange for cash and an installment note (see Note 2). The Company is in the process of converting the remaining assets to cash and satisfying its obligations. Remaining cash as well as the installment note will be distributed to Rice Drilling B and the other member in 2014 so that the Company can be dissolved. While the Company is in the process of liquidating, the financial statements have not been presented on the liquidation basis. However, the differences between the financial statements as presented and under the liquidation basis would not be significant.
Use of Estimates—The preparation of financial statements in conformity with U.S. generally accepted accounting principles requires management to make estimates and assumptions that affect the reported amounts of assets and liabilities and disclosure of contingent assets and liabilities at the dates of the financial statements and the reported amounts of revenues and expenses during the reporting periods. Actual results could differ from those estimates.
Comprehensive Income—Comprehensive income consists of net income plus changes in other equity accounts. The Company had no comprehensive income beyond its net income for the years ended December 31, 2013 and 2012 and for the period from May 9, 2011 to December 31, 2011.
Cash—The Company maintains cash at financial institutions which may at times exceed federally insured amounts and which may at times significantly exceed the balance sheets amounts due to outstanding checks.
Accounts Receivable—The Company regularly extended credit to customers for services provided in the normal course of business based upon management’s assessment of their creditworthiness. A valuation allowance is provided for those accounts for which collection is estimated as doubtful; uncollectible accounts are written off and charged against the allowance. Increases in the allowance are charged to general and administrative expenses. Accounts are judged to be delinquent principally based on contractual terms. In estimating the allowance, management considers, among other things, how recently and how frequently payments have been received and the financial position of the customer. While these estimates incorporated management’s assessment at December 31, 2013 and 2012, it is at least reasonably possible that the allowances will be further revised in the near term and actual results could differ from these estimates.
Equipment—Equipment is recorded at cost. Expenditures for major renewals and betterments that extend the useful lives of equipment are capitalized. Expenditures for maintenance and repairs are charged to expense as
F-95
Table of Contents
Index to Financial Statements
incurred. Provision for depreciation is computed using the straight-line method based on the estimated useful lives of the assets which range from two to ten years. Equipment under capital lease obligations is depreciated on the straight-line method over the shorter of the lease term or the estimated useful life of the equipment.
The carrying values of long-lived assets, which are limited to equipment, are evaluated periodically in relation to the operating performance of the underlying assets. Adjustments are made if the sum of expected future cash flows is less than book value and, if required, such adjustments would be measured based on discounted cash flows.
See Independent Accountants’ Compilation Report and Independent Auditors’ Report.
Income Taxes—The Company is treated as a partnership for federal and state income tax purposes. Consequently, the Company is not subject to income taxes; instead its members include the income in their tax returns.
Subsequent Events—Management has evaluated subsequent events for recognition and disclosure purposes through March 3, 2014, the date the financial statements were available to be issued.
| 2. | Note Receivable |
During 2013, the Company sold equipment in exchange for $0.4 million cash and a $1.4 million note receivable. Payments on this note are due in monthly installments of $42 thousand, including interest at 5%, beginning March 1, 2014 with final payment on February 1, 2017. The note is secured by the equipment. Installments on this note subsequent to December 31, 2013 are expected to be as follows (in thousands):
| 2014 |
$ | 351 | ||
| 2015 |
462 | |||
| 2016 |
485 | |||
| 2017 |
102 | |||
|
|
|
|||
| Total |
$ | 1,400 | ||
|
|
|
| 3. | Equipment |
Equipment consists of the following as of December 31, 2013 and 2012 (in thousands):
| 2013 | 2012 | |||||||
| (Unaudited) | ||||||||
| Field equipment: |
||||||||
| Machinery |
$ | — | $ | 1,916 | ||||
| Pipe |
— | 1,149 | ||||||
| Vehicles and trailers |
78 | 519 | ||||||
| Leasehold improvements |
— | 28 | ||||||
| Furniture and fixtures |
— | 8 | ||||||
| Construction in progress |
— | — | ||||||
|
|
|
|
|
|||||
| Total |
$ | 78 | $ | 3,620 | ||||
| Less accumulated depreciation |
16 | 1,167 | ||||||
|
|
|
|
|
|||||
| Equipment, net |
$ | 62 | $ | 2,453 | ||||
|
|
|
|
|
|||||
Depreciation expense was $0.8 million, $0.9 million and $0.3 million for the years ended December 31, 2013 and 2012 and for the period from May 9, 2011 to December 31, 2011, respectively. The cost of equipment
F-96
Table of Contents
Index to Financial Statements
held under capital leases as of December 31, 2013 and 2012 was $0.1 million and $1.8 million, respectively. Accumulated depreciation of equipment held under capital leases was $16 thousand and $0.5 million as of December 31, 2013 and 2012, respectively.
See Independent Accountants’ Compilation Report and Independent Auditors’ Report.
| 4. | Long-Term Debt |
Notes payable consist of the following as of December 31, 2012 (in thousands):
| 2012 | ||||
| Promissory note payable due in monthly installments of $8 thousand through June 2014, including interest at 4.41%; secured by vehicles and guaranteed by both members and an individual |
$ | 142 | ||
| Vehicle loan payable in monthly installments of $1 thousand through September 2013, including interest at 9.48%; secured by vehicle |
8 | |||
| Unsecured promissory note payable to two individuals in monthly installments of $2 thousand, including interest at 8%, through February 2013 |
3 | |||
|
|
|
|||
| Total |
153 | |||
| Less current portion |
105 | |||
|
|
|
|||
| Long-term notes payable |
$ | 48 | ||
|
|
|
|||
All notes payable were repaid during 2013.
| 5. | Leases |
As of December 31, 2013, the Company has vehicles under capital leases with remaining obligations of $30 thousand. Subsequent to December 31, 2013, the Company purchased the vehicles for approximately $31 thousand and the lease agreements were terminated.
The Company also leased a garage and the surrounding land under an operating lease which was transferred to a third party in November 2013. Rent expense for this lease was $33 thousand, $31 thousand and $20 thousand for the years ended December 31, 2013 and 2012 and for the period from May 9, 2011 to December 31, 2011, respectively.
Additionally, the Company rented equipment and vehicles under various short term arrangements. Rental expense for these items was approximately $0.4 million, $0.9 million and $1.2 million for the years ended December 31, 2013 and 2012 and for the period from May 9, 2011 to December 31, 2011, respectively.
| 6. | Concentrations |
The Company provided services to related companies (including Rice Drilling B, one of its investees, and one of its subcontractors) which accounted for approximately 91%, 85% and 60% of revenues for the years ended December 31, 2013 and 2012 and for the period from May 9, 2011 to December 31, 2011, respectively. Two additional customers accounted for approximately 26% of the Company’s revenues for the period from May 9, 2011 to December 31, 2011. Receivables from related companies accounted for 82%, and 98% of accounts receivable as of December 31, 2013 and 2012, respectively.
See Independent Accountants’ Compilation Report and Independent Auditors’ Report.
F-97
Table of Contents
Index to Financial Statements
GLOSSARY OF OIL AND NATURAL GAS TERMS
The following are abbreviations and definitions of certain terms used in this document, which are commonly used in the oil and natural gas industry:
“Bcf.” One billion cubic feet of natural gas.
“Btu.” One British thermal unit, the quantity of heat required to raise the temperature of a one-pound mass of water by one degree of Fahrenheit.
“Basin.” A large natural depression on the earth’s surface in which sediments generally brought by water accumulate.
“Completion.” The process of treating a drilled well followed by the installation of permanent equipment for the production of natural gas or oil, or in the case of a dry hole, the reporting of abandonment to the appropriate agency.
“DD&A.” Depreciation, depletion, amortization and accretion.
“Delineation.” The process of placing a number of wells in various parts of a reservoir to determine its boundaries and production characteristics.
“Developed acreage.” The number of acres that are allocated or assignable to productive wells or wells capable of production.
“Development well.” A well drilled within the proved area of an oil or natural gas reservoir to the depth of a stratigraphic horizon known to be productive.
“Dry gas.” A natural gas containing insufficient quantities of hydrocarbons heavier than methane to allow their commercial extraction or to require their removal in order to render the gas suitable for fuel use.
“Dry hole.” A well found to be incapable of producing hydrocarbons in sufficient quantities such that proceeds from the sale of such production exceed production expenses and taxes.
“EUR.” Estimated ultimate recovery.
“Exploratory well.” A well drilled to find and produce natural gas or oil reserves not classified as proved, to find a new reservoir in a field previously found to be productive of natural gas or oil in another reservoir or to extend a known reservoir.
“Drilling locations.” Total gross (net) resource play locations that we may be able to drill on our existing acreage. Actual drilling activities may change depending on the availability of capital, regulatory approvals, seasonal restrictions, natural gas and oil prices, costs, drilling results and other factors.
“Field.” An area consisting of a single reservoir or multiple reservoirs all grouped on, or related to, the same individual geological structural feature or stratigraphic condition. The field name refers to the surface area, although it may refer to both the surface and the underground productive formations.
“Formation.” A layer of rock which has distinct characteristics that differs from nearby rock.
“Gross acres” or “gross wells.” The total acres or wells, as the case may be, in which a working interest is owned.
A-1
Table of Contents
Index to Financial Statements
“Gross (net) drilling locations.” Gross (net) drilling locations are those drilling locations identified by management based on the following criteria:
| • | Drillable Locations—These are mapped locations that our Vice President of Exploration & Geology has deemed to have a high likelihood as being drilled or are currently in development but have not yet commenced production. With respect to our Pennsylvania acreage, we had 224 gross (200 net) pro forma drillable Marcellus locations and 134 gross (117 net) pro forma drillable Upper Devonian locations as of December 31, 2013. With respect to our Ohio acreage, as of December 31, 2013, we had 637 gross (192 net) drillable Utica locations, all of which are located within the contract areas covered by our Development Agreement and AMI Agreement with Gulfport. |
| • | Estimated Locations—These remaining estimated locations are calculated by taking our total acreage, less acreage that is producing or included in drillable locations, and dividing such amount by our expected well spacing to arrive at our unrisked estimated locations which is then multiplied by a risking factor. We assume these Marcellus locations have 6,000 foot laterals and 600 foot spacing between Marcellus wells which yields approximately 80 acre spacing. We assume these Upper Devonian locations have 6,000 foot laterals and 1,000 foot spacing between Upper Devonian wells which yields approximately 140 acre spacing. We assume these Utica locations have 8,000 foot laterals and 600 foot spacing between Utica wells which yields approximately 110 acre spacing. With respect to our Pennsylvania acreage, we multiply our unrisked estimated Marcellus and Upper Devonian locations by a risking factor of 50% to arrive at total risked estimated locations. As a result, we had 125 gross (125 net) pro forma estimated risked Marcellus locations and 77 gross (77 net) pro forma estimated risked Upper Devonian locations as of December 31, 2013. With respect to our Ohio acreage, we multiply our unrisked estimated locations by a risking factor of approximately 37% to arrive at total risked estimated locations. We then apply our assumed working interest for such location, calculated by applying the impact of assumed unitization on the underlying working interest as well as, in the case of locations within the AMI with Gulfport, the applicable participating interest. As a result, as of December 31, 2013, we had 116 gross (41 net) estimated risked Utica locations. Estimated locations include ununitized locations that have been risked (50% in the Marcellus, 37% in the Utica) to take into account the risk of forming drilling units. |
| • | Net Unrisked Locations—Consist of Drillable Locations and Estimated Locations without applying our risking factor. We assume 450 net unrisked Marcellus locations (200 pro forma net drillable Marcellus locations and 250 pro forma net estimated unrisked Marcellus locations). We assume 304 net unrisked Utica locations (192 pro forma net drillable Utica locations and 112 net estimated unrisked Utica locations). |
| • | Net Risked Locations—Consist of Drillable Locations and Estimated Locations. We assume 325 net risked Marcellus locations (200 pro forma net drillable Marcellus locations and 125 pro forma net estimated risked Marcellus locations). We assume 233 net risked Utica locations (192 pro forma net drillable Utica locations and 41 net estimated risked Utica locations). |
“Horizontal drilling.” A drilling technique used in certain formations where a well is drilled vertically to a certain depth and then drilled at a right angle within a specified interval.
“Mcf.” One thousand cubic feet of natural gas.
“MMcf.” One million cubic feet of natural gas.
“MMBtu.” One million Btu.
“NGLs.” Natural gas liquids. Hydrocarbons found in natural gas which may be extracted as liquefied petroleum gas and natural gasoline.
“NYMEX.” The New York Mercantile Exchange.
A-2
Table of Contents
Index to Financial Statements
“Net acres.” The percentage of total acres an owner has out of a particular number of acres, or a specified tract. An owner who has 50% interest in 100 acres owns 50 net acres.
“Productive well.” A well that is found to be capable of producing hydrocarbons in sufficient quantities such that proceeds from the sale of the production exceed production expenses and taxes.
“Prospect.” A specific geographic area which, based on supporting geological, geophysical or other data and also preliminary economic analysis using reasonably anticipated prices and costs, is deemed to have potential for the discovery of commercial hydrocarbons.
“Proved developed reserves.” Reserves that can be expected to be recovered through existing wells with existing equipment and operating methods.
“Proved reserves.” The estimated quantities of oil, natural gas and NGLs which geological and engineering data demonstrate with reasonable certainty to be commercially recoverable in future years from known reservoirs under existing economic and operating conditions.
“Proved undeveloped reserves (“PUD”).” Proved reserves that are expected to be recovered from new wells on undrilled acreage or from existing wells where a relatively major expenditure is required for recompletion.
“PV-10.” When used with respect to natural gas and oil reserves, PV-10 means the estimated future gross revenue to be generated from the production of proved reserves, net of estimated production, future development and abandonment costs, using prices and costs in effect at the determination date, before income taxes, and without giving effect to non-property-related expenses, discounted to a present value using an annual discount rate of 10% in accordance with the guidelines of the SEC.
“Recompletion.” The process of re-entering an existing wellbore that is either producing or not producing and completing new reservoirs in an attempt to establish or increase existing production.
“Reservoir.” A porous and permeable underground formation containing a natural accumulation of producible oil and/or natural gas that is confined by impermeable rock or water barriers and is separate from other reservoirs.
“Spacing.” The distance between wells producing from the same reservoir. Spacing is often expressed in terms of acres, e.g., 40-acre spacing, and is often established by regulatory agencies.
“Standardized measure.” Discounted future net cash flows estimated by applying year-end prices to the estimated future production of year-end proved reserves. Future cash inflows are reduced by estimated future production and development costs based on period-end costs to determine pre-tax cash inflows. Future income taxes, if applicable, are computed by applying the statutory tax rate to the excess of pre-tax cash inflows over our tax basis in the natural gas and oil properties. Future net cash inflows after income taxes are discounted using a 10% annual discount rate.
“Total depth.” The planned end of a well, measured by the length of pipe required to reach the bottom.
“Undeveloped acreage.” Lease acreage on which wells have not been drilled or completed to a point that would permit the production of commercial quantities of natural gas and oil regardless of whether such acreage contains proved reserves.
“Unit.” The joining of all or substantially all interests in a reservoir or field, rather than a single tract, to provide for development and operation without regard to separate property interests. Also, the area covered by a unitization agreement.
A-3
Table of Contents
Index to Financial Statements
“Wellbore.” The hole drilled by the bit that is equipped for natural gas production on a completed well. Also called well or borehole.
“Working interest.” The right granted to the lessee of a property to explore for and to produce and own natural gas or other minerals. The working interest owners bear the exploration, development, and operating costs on either a cash, penalty, or carried basis.
A-4
Table of Contents
Index to Financial Statements
20,421,246 Shares
Rice Energy Inc.
Common Stock
Prospectus
, 2014
Goldman, Sachs & Co.
Barclays
Citigroup
Table of Contents
Index to Financial Statements
Part II
INFORMATION NOT REQUIRED IN PROSPECTUS
| Item 13. | Other expenses of issuance and distribution |
The following table sets forth an itemized statement of the amounts of all expenses (excluding underwriting discounts and commissions) payable by us in connection with the registration of the common stock offered hereby. With the exception of the Registration Fee, FINRA Filing Fee and New York Stock Exchange listing fee), the amounts set forth below are estimates.
| SEC Registration Fee |
$ | 89,489 | ||
| FINRA Filing Fee |
104,718 | |||
| New York Stock Exchange listing fee |
* | |||
| Accountants’ fees and expenses |
* | |||
| Legal fees and expenses |
* | |||
| Printing and engraving expenses |
* | |||
| Transfer agent and registrar fees |
* | |||
| Miscellaneous |
* | |||
|
|
|
|||
| Total |
$ | * |
| * | To be provided by amendment |
| Item 14. | Indemnification of Directors and Officers |
Our amended and restated certificate of incorporation provides that a director will not be liable to the corporation or its stockholders for monetary damages to the fullest extent permitted by the DGCL. In addition, if the DGCL is amended to authorize the further elimination or limitation of the liability of directors, then the liability of a director of the corporation, in addition to the limitation on personal liability provided for in our certificate of incorporation, will be limited to the fullest extent permitted by the amended DGCL. Our amended and restated bylaws provides that the corporation will indemnify, and advance expenses to, any officer or director to the fullest extent authorized by the DGCL.
Section 145 of the DGCL provides that a corporation may indemnify directors and officers as well as other employees and individuals against expenses, including attorneys’ fees, judgments, fines and amounts paid in settlement in connection with specified actions, suits and proceedings whether civil, criminal, administrative, or investigative, other than a derivative action by or in the right of the corporation, if they acted in good faith and in a manner they reasonably believed to be in or not opposed to the best interests of the corporation and, with respect to any criminal action or proceeding, had no reasonable cause to believe their conduct was unlawful. A similar standard is applicable in the case of derivative actions, except that indemnification extends only to expenses, including attorneys’ fees, incurred in connection with the defense or settlement of such action and the statute requires court approval before there can be any indemnification where the person seeking indemnification has been found liable to the corporation. The statute provides that it is not exclusive of other indemnification that may be granted by a corporation’s certificate of incorporation, bylaws, disinterested director vote, stockholder vote, agreement or otherwise.
Our amended and restated certificate of incorporation also contains indemnification rights for our directors and our officers. Specifically, our amended and restated certificate of incorporation provides that we shall indemnify our officers and directors to the fullest extent authorized by the DGCL. Further, we may maintain insurance on behalf of our officers and directors against expense, liability or loss asserted incurred by them in their capacities as officers and directors.
We have obtained directors’ and officers’ insurance to cover our directors, officers and some of our employees for certain liabilities.
II-1
Table of Contents
Index to Financial Statements
We have entered into written indemnification agreements with our directors and executive officers. Under these agreements, if an officer or director makes a claim of indemnification to us, either a majority of the independent directors or independent legal counsel selected by the independent directors must review the relevant facts and make a determination whether the officer or director has met the standards of conduct under Delaware law that would permit (under Delaware law) and require (under the indemnification agreement) us to indemnify the officer or director.
The underwriting agreement provides for indemnification by the underwriters of us and our officers and directors, and by us of the underwriters, for certain liabilities arising under the Securities Act or otherwise in connection with this offering.
| Item 15. | Recent Sales of Unregistered Securities |
On January 29, 2014, pursuant to the Master Reorganization Agreement (the “Master Reorganization Agreement”) among us, Rice Drilling B, Rice Appalachia, Rice Holdings, Rice Partners, NGP Holdings, NGP RE Holdings, L.L.C., (“NGP RE Holdings”) NGP RE Holdings II, L.L.C. (“NGP RE II” and, together with NGP RE Holdings, “Natural Gas Partners”), Mr. Daniel J. Rice III, Rice Merger LLC (“Merger Sub”) and each of the persons holding incentive units representing interests in Rice Appalachia (collectively, the “Incentive Unitholders”) dated as of January 23, 2014, (i) (a) Rice Partners contributed a portion of its interests in Rice Appalachia to Rice Holdings, (b) Natural Gas Partners contributed its interests in Rice Appalachia to NGP Holdings and (c) the Incentive Unitholders contributed a portion of their incentive units to Rice Holdings and NGP Holdings, each in return for substantially similar incentive units in such entities; (ii) NGP Holdings, Rice Holdings and Mr. Daniel J. Rice III contributed their respective interests in Rice Appalachia to us in exchange for 43,452,550, 20,300,923 and 2,356,844 shares of our common stock, respectively; (iii) Rice Partners contributed its remaining interest in Rice Appalachia to us in exchange for 20,000,000 shares of our common stock; (iv) the Incentive Unitholders contributed their remaining interests in Rice Appalachia to us in exchange for 160,831 shares of our common stock, each of which were issued by us in connection with the closing of the IPO.
In addition, on January 29, 2014, pursuant to the Agreement and Plan of Merger (the “Merger Agreement”) among us, Rice Drilling B and Merger Sub dated as of January 23, 2014, we issued 1,728,852 shares of our common stock to the members of Rice Drilling B (other than Rice Appalachia).
The foregoing transactions were undertaken in reliance upon an exemption from the registration requirements of the Securities Act by Section 4(a)(2) thereof.
| Item 16. | Exhibits and financial statement schedules |
(a) See the Exhibit Index immediately following the signature page hereto, which is incorporated by reference as if fully set forth herein.
| Item 17. | Undertakings |
The undersigned registrant hereby undertakes to provide to the underwriters at the closing specified in the underwriting agreement certificates in such denominations and registered in such names as required by the underwriters to permit prompt delivery to each purchaser.
Insofar as indemnification for liabilities arising under the Securities Act may be permitted to directors, officers and controlling persons of the registrant pursuant to the foregoing provisions, or otherwise, the registrant has been advised that in the opinion of the Securities and Exchange Commission such indemnification is against public policy as expressed in the Securities Act and is, therefore, unenforceable. In the event that a claim for indemnification against such liabilities (other than the payment by the registrant of expenses incurred or paid by
II-2
Table of Contents
Index to Financial Statements
a director, officer or controlling person of the registrant in the successful defense of any action, suit or proceeding) is asserted by such director, officer or controlling person in connection with the securities being registered, the registrant will, unless in the opinion of its counsel the matter has been settled by controlling precedent, submit to a court of appropriate jurisdiction the question whether such indemnification by it is against public policy as expressed in the Securities Act and will be governed by the final adjudication of such issue.
The undersigned registrant hereby undertakes that, for the purpose of determining liability of the registrant under the Securities Act to any purchaser in the initial distribution of the securities, in a primary offering of securities of the undersigned registrant pursuant to this registration statement, regardless of the underwriting method used to sell the securities to the purchaser, if the securities are offered or sold to such purchaser by means of any of the following communications, the undersigned registrant will be a seller to the purchaser and will be considered to offer or sell such securities to such purchaser:
(i) Any preliminary prospectus or prospectus of the undersigned registrant relating to this offering required to be filed pursuant to Rule 424;
(ii) Any free writing prospectus relating to this offering prepared by or on behalf of the undersigned registrant or used or referred to by the undersigned registrant;
(iii) The portion of any other free writing prospectus relating to this offering containing material information about the undersigned registrant or its securities provided by or on behalf of the undersigned registrant; and
(iv) Any other communication that is an offer in this offering made by the undersigned registrant to the purchaser.
The undersigned registrant hereby undertakes that:
(1) For purposes of determining any liability under the Securities Act, the information omitted from the form of prospectus filed as part of this registration statement in reliance upon Rule 430A and contained in a form of prospectus filed by the registrant pursuant to Rule 424(b)(1) or (4) or 497(h) under the Securities Act shall be deemed to be part of this registration statement as of the time it was declared effective.
(2) For the purpose of determining any liability under the Securities Act, each post-effective amendment that contains a form of prospectus shall be deemed to be a new registration statement relating to the securities offered therein, and the offering of such securities at that time shall be deemed to be the initial bona fide offering thereof.
II-3
Table of Contents
Index to Financial Statements
SIGNATURES
Pursuant to the requirements of the Securities Act of 1933, the registrant has duly caused this registration statement to be signed on its behalf by the undersigned, thereunto duly authorized, in the City of Canonsburg, State of Pennsylvania, on July 7, 2014.
| By: | /s/ Daniel J. Rice IV | |
| Daniel J. Rice IV | ||
| Director, Chief Executive Officer |
Pursuant to the requirements of the Securities Act of 1933, as amended, this Registration Statement has been signed below by the following persons in the capacities and the dates indicated.
| Name |
Title |
Date | ||
| /s/ Daniel J. Rice IV Daniel J. Rice IV |
Director, Chief Executive Officer (Principal Executive Officer) |
July 7, 2014 | ||
| /s/ Toby Z. Rice Toby Z. Rice |
Director, President and Chief Operating Officer |
July 7, 2014 | ||
| /s/ Grayson T. Lisenby Grayson T. Lisenby |
Vice President and Chief Financial Officer (Principal Financial Officer) |
July 7, 2014 | ||
| /s/ James W. Rogers James W. Rogers |
Vice President, Chief Accounting & Administrative Officer, Treasurer (Principal Accounting Officer) |
July 7, 2014 | ||
| /s/ Robert F. Vagt Robert F. Vagt |
Director | July 7, 2014 | ||
| /s/ Chris G. Carter Chris G. Carter |
Director | July 7, 2014 | ||
| /s/ James W. Christmas James W. Christmas |
Director | July 7, 2014 | ||
| /s/ Kevin S. Crutchfield Kevin S. Crutchfield |
Director | July 7, 2014 | ||
| /s/ Scott A. Gieselman Scott A. Gieselman |
Director | July 7, 2014 | ||
| /s/ Daniel J. Rice III Daniel J. Rice III |
Director | July 7, 2014 | ||
II-4
Table of Contents
Index to Financial Statements
INDEX TO EXHIBITS
| Exhibit |
Description | |
| 1.1* | Form of Underwriting Agreement. | |
| 2.1 | Purchase and Sale Agreement, among M3 Appalachia Gathering, LLC, as seller, Rice Poseidon Midstream LLC, as Buyer, and M3 Midstream LLC, dated as of February 12, 2014 (incorporated by reference to Exhibit 2.1 of the Company’s Current Report on Form 8-K (File No. 001-36273) filed with the Commission on February 14, 2014). | |
| 3.1 | Amended and Restated Certificate of Incorporation of Rice Energy Inc. (incorporated by reference to Exhibit 3.1 of the Company’s Current Report on Form 8-K (File No. 001-36273) filed with the Commission on February 4, 2014). | |
| 3.2 | Amended and Restated Bylaws of Rice Energy Inc. (incorporated by reference to Exhibit 3.2 of the Company’s Current Report on Form 8-K (File No. 001-36273) filed with the Commission on February 4, 2014). | |
| 4.1 | Specimen Common Stock Certificate (incorporated by reference to Exhibit 4.1 of the Company’s Registration Statement on Form S-1 (File No. 133-192894) filed with the Commission on January 13, 2014). | |
| 4.2 | Registration Rights Agreement, dated as of January 29, 2014, by and among Rice Energy Inc., Rice Energy Holdings LLC, Rice Energy Family Holdings, LP, NGP Rice Holdings LLC and Foundation PA Coal Company, LLC (incorporated by reference to Exhibit 4.2 of the Company’s Current Report on Form 8-K (File No. 001-36273) filed with the Commission on February 4, 2014). | |
| 4.3 | Stockholders’ Agreement, dated as of January 29, 2014, by and among Rice Energy Inc., Rice Energy Holdings LLC, Rice Energy Family Holdings, LP, NGP Rice Holdings LLC and Alpha Natural Resources, Inc. (incorporated by reference to Exhibit 4.1 of the Company’s Current Report on Form 8-K (File No. 001-36273) filed with the Commission on February 4, 2014). | |
| 4.4 | Indenture, dated as of April 25, 2014, by and among Rice Energy Inc., the several guarantors named therein and Wells Fargo Bank, National Association, as trustee.(incorporated by reference to Exhibit 4.1 of the Company’s Current Report on Form 8-K (File No. 001-36273) filed with the Commission on April 29, 2014). | |
| 4.5 | Form of 6.250% Senior Note due 2022 (included as Exhibit A to Exhibit 4.4) (incorporated by reference to Exhibit 4.2 of the Company’s Current Report on Form 8-K (File No. 001-36273) filed with the Commission on April 29, 2014). | |
| 4.6 | Registration Rights Agreement, dated as of April 25, 2014, by and among Rice Energy Inc., the several guarantors named therein and Barclays Capital Inc. as representative of the initial purchasers named therein (incorporated by reference to Exhibit 4.3 of the Company’s Current Report on Form 8-K (File No. 001-36273) filed with the Commission on April 29, 2014). | |
| 10.1 | Second Amended and Restated Credit Agreement, dated as of April 25, 2013, among Rice Drilling B LLC, as borrower, Wells Fargo Bank, N.A., as administrative agent and the lenders and other parties thereto (incorporated by reference to Exhibit 10.1 of the Company’s Registration Statement on Form S-1 (File No. 333-192894) filed with the Commission on October 3, 2013). | |
| 10.2 | First Amendment to Second Amended and Restated Credit Agreement, dated as of August 7, 2013, among Rice Drilling B LLC, as borrower, Wells Fargo Bank, N.A., as administrative agent and the lenders and other parties thereto (incorporated by reference to Exhibit 10.2 of the Company’s Registration Statement on Form S-1 (File No. 333-192894) filed with the Commission on October 3, 2013). | |
II-5
Table of Contents
Index to Financial Statements
| Exhibit |
Description | |
| 10.3 | Second Amendment to Second Amended and Restated Credit Agreement, dated as of August 20, 2013, among Rice Drilling B LLC, as borrower, Wells Fargo Bank, N.A., as administrative agent and the lenders and other parties thereto (incorporated by reference to Exhibit 10.3 of the Company’s Registration Statement on Form S-1 (File No. 333-192894) filed with the Commission on October 3, 2013). | |
| 10.4 | Third Amendment to Second Amended and Restated Credit Agreement, dated as of October 15, 2013, among Rice Drilling B LLC, as borrower, Wells Fargo Bank, N.A., as administrative agent and the lenders and other parties thereto (incorporated by reference to Exhibit 10.4 of the Company’s Registration Statement on Form S-1 (File No. 333-192894) filed with the Commission on December 16, 2013). | |
| 10.5 | Fourth Amendment to Second Amended and Restated Credit Agreement, dated as of November 5, 2013, among Rice Drilling B LLC, as borrower, Wells Fargo Bank, N.A., as administrative agent and the lenders and other parties thereto (incorporated by reference to Exhibit 10.5 of the Company’s Registration Statement on Form S-1 (File No. 333-192894) filed with the Commission on December 16, 2013). | |
| 10.6 | Limited Consent and Waiver and Fifth Amendment to Second Amended and Restated Credit Agreement, dated as of December 27, 2013, among Rice Drilling B LLC, as borrower, Wells Fargo Bank, N.A., as administrative agent and the lenders and other parties thereto (incorporated by reference to Exhibit 10.6 of the Company’s Registration Statement on Form S-1 (File No. 333-192894) filed with the Commission on January 6, 2014). | |
| 10.7 | Sixth Amendment to Second Amended and Restated Credit Agreement, dated as of January 29, 2014, among Rice Drilling B LLC, as borrower, Wells Fargo Bank, N.A., as administrative agent and the lenders and other parties thereto (incorporated by reference to Exhibit 10.1 of the Company’s Current Report on Form 8-K (File No. 001-36273) filed with the Commission on February 4, 2014). | |
| 10.8 | Senior Secured Term Loan Credit Agreement, dated as of April 25, 2013, among Rice Drilling B LLC, as borrower, Barclays Bank PLC, as administrative agent and the lenders party thereto (incorporated by reference to Exhibit 10.10 of the Company’s Registration Statement on Form S-1 (File No. 333-192894) filed with the Commission on October 3, 2013). | |
| 10.9 | Master Reorganization Agreement, dated as of January 23, 2014, by and among Rice Energy Family Holdings, LP, NGP RE Holdings, L.L.C., NGP RE Holdings II, L.L.C., Daniel J. Rice III, Rice Drilling B LLC, Rice Merger LLC, Rice Energy Appalachia, LLC, each of the persons holding incentive units representing interests in Rice Energy Appalachia, LLC, Rice Energy Inc., Rice Energy Holdings LLC, and NGP Rice Holdings LLC (incorporated by reference to Exhibit 10.1 of the Company’s Current Report on Form 8-K (File No. 001-36273) filed with the Commission on January 29, 2014). | |
| 10.10 | Agreement and Plan of Merger of Rice Merger LLC with and into Rice Drilling B LLC (incorporated by reference to Exhibit 10.2 of the Company’s Current Report on Form 8-K (File No. 001-36273) filed with the Commission on January 29, 2014). | |
| 10.11 | Transaction Agreement by and among Rice Energy Inc., Rice Drilling C LLC and Foundation PA Coal Company, LLC, dated as of December 6, 2013 (incorporated by reference to Exhibit 10.8 of the Company’s Registration Statement on Form S-1 (File No. 333-192894) filed with the Commission on December 16, 2013). | |
| 10.12† | Amended and Restated Liability Company Agreement of Rice Energy Appalachia, LLC (incorporated by reference to Exhibit 10.11 of the Company’s Registration Statement on Form S-1 (File No. 333-192894) filed with the Commission on January 8, 2014). | |
II-6
Table of Contents
Index to Financial Statements
| Exhibit |
Description | |
| 10.13† | Amended and Restated Liability Company Agreement of Rice Energy Holdings LLC (incorporated by reference to Exhibit 10.23 of the Company’s Current Report on Form 8-K (File No. 001-36273) filed with the Commission on February 4, 2014). | |
| 10.14† | Amended and Restated Liability Company Agreement of NGP Rice Holdings LLC (incorporated by reference to Exhibit 10.24 of the Company’s Current Report on Form 8-K (File No. 001-36273) filed with the Commission on February 4, 2014). | |
| 10.15† | Employment Agreement (Daniel J. Rice IV) (incorporated by reference to Exhibit 10.17 of the Company’s Current Report on Form 8-K (File No. 001-36273) filed with the Commission on February 4, 2014). | |
| 10.16† | Employment Agreement (Toby Z. Rice) (incorporated by reference to Exhibit 10.18 of the Company’s Current Report on Form 8-K (File No. 001-36273) filed with the Commission on February 4, 2014). | |
| 10.17† | Employment Agreement (Derek A. Rice) (incorporated by reference to Exhibit 10.19 of the Company’s Current Report on Form 8-K (File No. 001-36273) filed with the Commission on February 4, 2014). | |
| 10.18† | Employment Agreement (Grayson T. Lisenby) (incorporated by reference to Exhibit 10.20 of the Company’s Current Report on Form 8-K (File No. 001-36273) filed with the Commission on February 4, 2014). | |
| 10.19† | Employment Agreement (James W. Rogers) (incorporated by reference to Exhibit 10.21 of the Company’s Current Report on Form 8-K (File No. 001-36273) filed with the Commission on February 4, 2014). | |
| 10.20† | Employment Agreement (William E. Jordan) (incorporated by reference to Exhibit 10.22 of the Company’s Current Report on Form 8-K (File No. 001-36273) filed with the Commission on February 4, 2014). | |
| 10.21† | Indemnification Agreement (Daniel J. Rice IV) (incorporated by reference to Exhibit 10.2 of the Company’s Current Report on Form 8-K (File No. 001-36273) filed with the Commission on February 4, 2014). | |
| 10.22† | Indemnification Agreement (Toby Z. Rice) (incorporated by reference to Exhibit 10.3 of the Company’s Current Report on Form 8-K (File No. 001-36273) filed with the Commission on February 4, 2014). | |
| 10.23† | Indemnification Agreement (Derek A. Rice) (incorporated by reference to Exhibit 10.4 of the Company’s Current Report on Form 8-K (File No. 001-36273) filed with the Commission on February 4, 2014). | |
| 10.24† | Indemnification Agreement (Grayson T. Lisenby) (incorporated by reference to Exhibit 10.5 of the Company’s Current Report on Form 8-K (File No. 001-36273) filed with the Commission on February 4, 2014). | |
| 10.25† | Indemnification Agreement (James W. Rogers) (incorporated by reference to Exhibit 10.6 of the Company’s Current Report on Form 8-K (File No. 001-36273) filed with the Commission on February 4, 2014). | |
| 10.26† | Indemnification Agreement (William E. Jordan) (incorporated by reference to Exhibit 10.7 of the Company’s Current Report on Form 8-K (File No. 001-36273) filed with the Commission on February 4, 2014). | |
| 10.27† | Indemnification Agreement (Daniel J. Rice III) (incorporated by reference to Exhibit 10.8 of the Company’s Current Report on Form 8-K (File No. 001-36273) filed with the Commission on February 4, 2014). | |
II-7
Table of Contents
Index to Financial Statements
| Exhibit |
Description | |
| 10.28† | Indemnification Agreement (Scott A. Gieselman) (incorporated by reference to Exhibit 10.9 of the Company’s Current Report on Form 8-K (File No. 001-36273) filed with the Commission on February 4, 2014). | |
| 10.29† | Indemnification Agreement (Kevin S. Crutchfield) (incorporated by reference to Exhibit 10.10 of the Company’s Current Report on Form 8-K (File No. 001-36273) filed with the Commission on February 4, 2014). | |
| 10.30† | Indemnification Agreement (James W. Christmas) (incorporated by reference to Exhibit 10.11 of the Company’s Current Report on Form 8-K (File No. 001-36273) filed with the Commission on February 4, 2014). | |
| 10.31† | Indemnification Agreement (Chris G. Carter) (incorporated by reference to Exhibit 10.12 of the Company’s Current Report on Form 8-K (File No. 001-36273) filed with the Commission on February 4, 2014). | |
| 10.32† | Indemnification Agreement (Robert F. Vagt) (incorporated by reference to Exhibit 10.13 of the Company’s Current Report on Form 8-K (File No. 001-36273) filed with the Commission on February 4, 2014). | |
| 10.33† | Rice Energy Inc. 2014 Long-Term Incentive Plan (incorporated by reference to Exhibit 4.5 to the Company’s Registration Statement on Form S-8 (File No. 333-193619) filed with the Commission on January 29, 2014). | |
| 10.34† | Rice Energy Management Bonus Plan (incorporated by reference to Exhibit 10.14 of the Company’s Registration Statement on Form S-1 (File No. 333-192894) filed with the Commission on November 12, 2013). | |
| 10.35† | Form of Restricted Stock Unit Agreement (Employees) (incorporated by reference to Exhibit 10.13 of the Company’s Registration Statement on Form S-1 (File No. 333-192894) filed with the Commission on December 16, 2013). | |
| 10.36† | Form of Restricted Stock Unit Agreement (Directors) (incorporated by reference to Exhibit 10.19 of the Company’s Registration Statement on Form S-1 (File No. 333-192894) filed with the Commission on January 8, 2014). | |
| 10.37 | Form of Senior Subordinated Convertible Debentures due 2014 (incorporated by reference to Exhibit 10.14 of the Company’s Registration Statement on Form S-1 (File No. 333-192894) filed with the Commission on December 16, 2013). | |
| 10.38 | Amendment, Consent and Parent Guaranty to Senior Subordinated Convertible Debentures due 2014 (incorporated by reference to Exhibit 10.21 of the Company’s Registration Statement on Form S-1 (File No. 333-192894) filed with the Commission on January 8, 2014). | |
| 10.39 | Form of Warrant Agreement (incorporated by reference to Exhibit 10.16 of the Company’s Registration Statement on Form S-1 (File No. 333-192894) filed with the Commission on December 16, 2013). | |
| 10.40 | Form of Bonus Warrant Agreement (incorporated by reference to Exhibit 10.17 of the Company’s Registration Statement on Form S-1 (File No. 333-192894) filed with the Commission on December 16, 2013). | |
| 10.41 | Form of Amended and Restated Warrant to Purchase Shares of Common Stock (incorporated by reference to Exhibit 10.41(a) of the Company’s Annual Report on Form 10-K (File No. 001-36273) filed with the Commission on March 21, 2014). | |
II-8
Table of Contents
Index to Financial Statements
| Exhibit |
Description | |
| 10.42 | Form of Amended and Restated Bonus Warrant to Purchase Shares of Common Stock (incorporated by reference to Exhibit 10.42(a) of the Company’s Annual Report on Form 10-K (File No. 001-36273) filed with the Commission on March 21, 2014). | |
| 10.43 | Third Amended and Restated Credit Agreement, dated as of April 10, 2014, among Rice Energy Inc., as borrower, Wells Fargo Bank, N.A., as administrative agent and the lenders and other parties thereto (incorporated by reference to Exhibit 10.1 of the Company’s Current Report on Form 8-K (File No. 001-36273) filed with the Commission on April 11, 2014). | |
| 10.44† | Form of Performance Stock Unit (PSU) Agreement. | |
| 21.1 | List of Subsidiaries of Rice Energy Inc. (incorporated by reference to Exhibit 21.1 to the Company’s Registration Statement on Form S-1 (File No. 333-192894) filed with the Commission on January 6, 2014). | |
| 23.1 | Consent of Ernst & Young LLP (Rice Drilling B LLC and Rice Energy Inc.) | |
| 23.2 | Consent of Grossman Yanak & Ford LLP (Countrywide Energy Services, LLC) | |
| 23.3 | Consent of Ernst & Young LLP (Alpha Shale Resources, LP) | |
| 23.4 | Consent of Schneider Downs & Co., Inc. (Alpha Shale Resources, LP) | |
| 23.5 | Consent of Netherland, Sewell and Associates, Inc. | |
| 23.6 | Consent of Vinson & Elkins L.L.P. (included as part of Exhibit 5.1 hereto) | |
| 24.1 | Power of Attorney (included on the signature page of the initial filing of the Registration Statement) | |
| 99.1 | Netherland, Sewell and Associates, Inc., Summary of Reserves at December 31, 2013 (Rice Energy Inc.) | |
| 99.2 | Netherland, Sewell and Associates, Inc., Summary of Reserves at December 31, 2013 (Alpha Shale Resources, LP) | |
| 101.INS* | XBRL Instance Document. | |
| 101.SCH* | XBRL Schema Document. | |
| 101.CAL* | XBRL Calculation Linkbase Document. | |
| 101.DEF* | XBRL Definition Linkbase Document. | |
| 101.LAB* | XBRL Labels Linkbase Document. | |
| 101.PRE* | XBRL Presentation Linkbase Document. | |
| * | To be filed by amendment. |
| † | Compensatory plan or arrangement. |
II-9