Attached files
| file | filename |
|---|---|
| 8-K - FORM 8-K - MOSAIC CO | d749502d8k.htm |
Exhibit 99.1


Market Mosaic is a newsletter published for our customers, suppliers and stakeholders by the Market and Strategic Analysis group of The Mosaic Company. Some issues assess the near term outlook for agricultural and plant nutrient markets while others take an in-depth look at a topic of special interest to our readers. This issue, titled The Half-Time Report, reviews first-half highlights and assesses prospects for the second half of 2014.
Michael R. Rahm
Vice President, Market and Strategic Analysis
Andy J. Jung
Director, Market and Strategic Analysis
Josh Paula
Market Analyst Lead
Mathew Philippi
Market Analyst
The 2014 FIFA World Cup kicked off in Brazil on June 12. National teams from 32 countries will play 64 matches at a dozen different venues during the tournament. The competition concludes with the championship match on July 13.
Each match will consist of two 45-minute periods with a 15-minute half-time break. This break gives players a needed rest and provides coaches with an opportunity to review first-period performances and adjust game plans. For television viewers, networks produce elaborate half-time reports hosted by a team of analysts who provide insightful and often entertaining commentary about first-half highlights as well as opine on what teams need to do in the second half in order to win the match.
Well, plant nutrient markets are not quite as exciting as World Cup football right now, but markets are at the half-time point of the year. So, it is appropriate that our team of analysts reviews first-half highlights and assesses prospects for the second half of 2014. Think of this issue as your 2014 World Cup half-time report on agricultural, phosphate and potash markets.
First-Half Highlights
Pent-Up Demand Unleashed
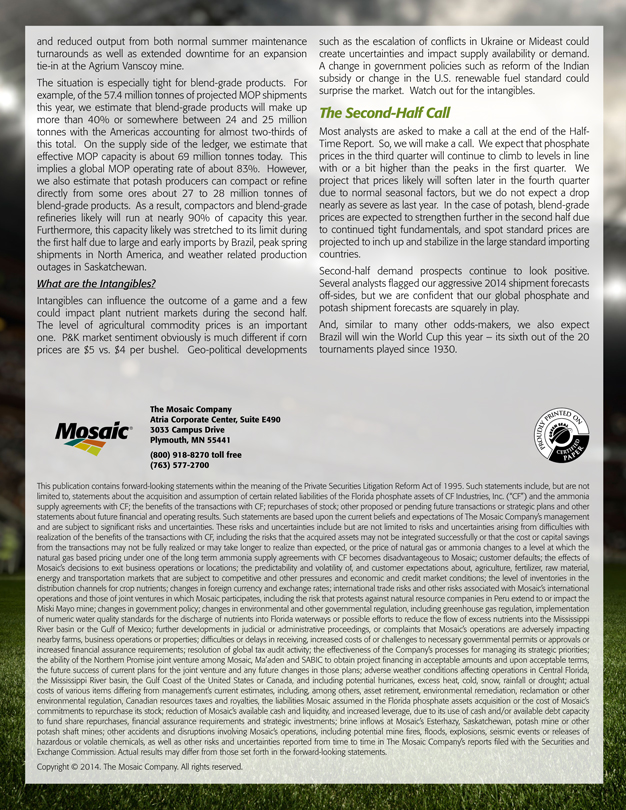
Our first highlight is the unleashing of pent-up grain and oilseed demand – as predicted in our last issue of Market Mosaic. Global grain and oilseed use was nearly flat in 2012/13 due to a smaller-than-expected crop and record-high prices for several agricultural commodities. In fact, global grain and oilseed use increased a paltry 0.5% in 2012/13 compared to a compound annual growth rate (CAGR) of 2.4% during the previous five years.
The decline in crop prices following the record-smashing 2013/14 harvest quickly unleashed enormous pent-up demand. The latest USDA projections show that global grain and oilseed use will jump 4.4% in 2013/14 thanks to ample supplies and more moderate prices.
– continued inside
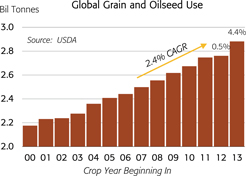
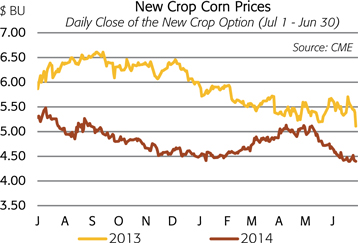
The U.S. corn balance sheet provides a compelling example. U.S. corn use is projected to total a record 13.64 billion bushels this year, up 23% or 2.52 billion from the drought-ravaged total in 2012/13. All three major use categories – feed, ethanol and exports – show significant gains, but the swing in more price-sensitive exports is the most pronounced. U.S. corn exports plunged to their lowest level since 1970/71 and accounted for nearly 60% of the decline in corn use last year. Exports are projected to rebound to 1.90 billion bushels in 2013/14 and account for slightly less than one-half of the projected rebound this year.
Brazil Led All Scorers
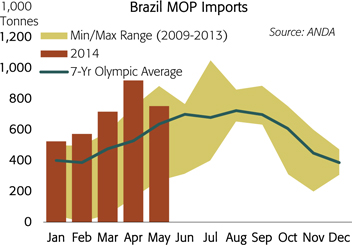
A review of first-half statistics shows that Brazil, the winningest team in World Cup history, led all scorers by a significant margin. Plant nutrient shipments got off to a blistering start during the first five months of this year according to the latest ANDA statistics. Shipments of all products were up 9% from the fast pace of last year. Our São Paulo team projects that shipments will total 32.4 million tonnes in 2014 based on the robust year-to-date total as well as continued strong demand outlook for the remainder of the year.
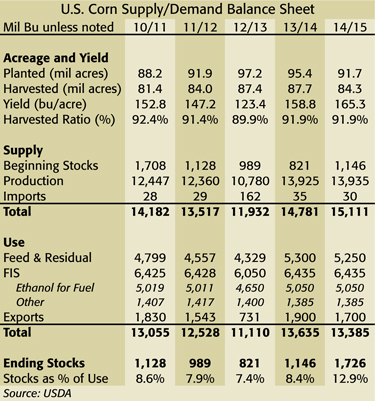
Year-to-date phosphate shipments were up 8% heading into the peak shipping season. Increases in DAP and MAP imports accounted for all of this gain. DAP and MAP imports were up 39% and 25%, respectively, while TSP imports were off 35%. Domestic MAP production was off 12% and TSP output was up 9% during the same period. DAP/MAP/TSP imports are projected to total nearly 5.0 million tonnes in 2014, up 21% from last year.
In the case of potash, shipments during the first five months of this year were up 11%. Imports also accounted for all of the growth. MOP imports were up 24% or more than 670,000 tonnes to nearly 3.5 million tonnes during this period. Domestic MOP production continues to trend downward with output through May reaching just 176,500 tonnes, down another 4% from the same period a year ago.
Phosphate Prices Ran Hard
Phosphate prices provided another first-half highlight. After dropping to extremely low levels at the end of last November, phosphate prices made a powerful run during the first quarter. For example, the price of DAP bottomed at $340 per tonne fob Tampa vessel in November but then ran $160 to a peak of $500 per tonne in March.


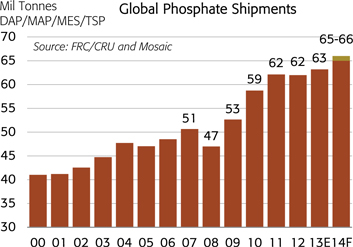
Several factors combined to fuel this run. First, global shipments got off to a fast start this year due to continued strong on-farm demand as well as a need to replenish a lean global distribution pipeline. We project that shipments of the leading solid phosphate products will climb to a record 65 to 66 million tonnes this year, up more than 3% from 63.2 million last year. While Brazil led all scorers and India mostly remained on the sidelines, other major phosphate consuming regions such as China, Europe, other Latin American countries and North America turned in solid first-half demand performances.
Second, several small planned and unplanned plant outages collectively resulted in a significant supply loss. For example, the large #5 granulation plant at our Riverview complex was offline from late-November through mid-April for a major re-vamp that now enables the unit to produce either DAP or MAP.
Third, severe weather, especially in Morocco and North America, delayed shipments and not only tightened fundamentals but also caused near-panic in the market. Delays were acute in Morocco where severe and persistent storms and 25-foot swells shut down the main port of Jorf Lasfar for many days during February and March. We estimate that the lost supply worldwide from both production outages and logistical disruptions totaled around 650,000 tonnes during the first quarter alone.
Fourth, a spike in sulphur prices, especially in China, also supported phosphate values. After dropping to around $70 per tonne c&f China last fall, sulphur prices spiked to more than $220 per tonne in March. The increase in sulphur prices alone boosted Chinese DAP costs approximately $60 per tonne.
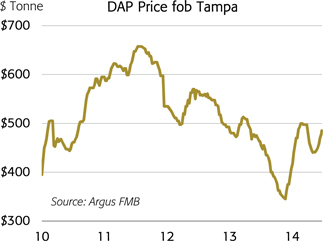
After peaking in March, phosphate prices declined in the second quarter due to normal seasonal pressures as well as other factors. However, after bottoming at about $440 per tonne fob Tampa in late May, prices began to move up and were trading in the $480 to $490 per tonne range at the end of June.
The Potash Market Quietly Tightened
Another less flashy, first-half highlight was the quiet tightening of the global potash market, especially in the case of blend grade products, due to a combination of strong shipments as well as a few planned and unplanned production outages.
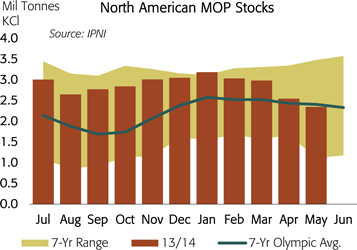
North American statistics highlight this development. Inventories held by North American producers at both on- and off-site locations declined steadily during the first half and were drawn down to less-than-average levels on May 31. In addition, we estimate that North American pipeline stocks were bone dry following the spring application season due to the combination of strong on-farm demand and long shipping delays earlier this year.
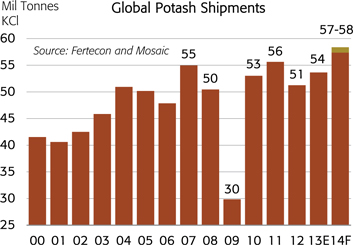
On the demand side of the ledger, global MOP shipments look squarely on track to hit our aggressive full-year forecast of a record 57 to 58 million tonnes KCl, an increase of more than 7% or nearly 4.0 million tonnes from last year. For example, we estimate that combined shipments in the top four consuming regions alone – namely Brazil, China, India and North America – were up almost 12% or more than 1.2 million tonnes during the first five months of 2014. The projected jump in global shipments this year is due to continued strong on-farm demand as well as lean pipeline inventories worldwide. All of the major consuming countries are expected to register increases this year.
On the supply side of the ledger, North American MOP production totaled 8.2 million tonnes during the first five months of this year, off almost 5% or nearly 400,000 tonnes from a year earlier. Much of this reduction resulted from unplanned shut-downs earlier this year after warehouses filled and railroads were unable to move product from Saskatchewan facilities due to power and crew cutbacks as well as rail car shortages – all exacerbated by a long stretch of severe winter weather. Recent statistics such as Russian first-quarter production also indicate less-than-advertised and less-than-expected output in other regions.
North American Railroads Drew a Yellow Card
A combination of factors including changes in railroad business models, increasing competition for rail services, over-reliance on just-in-time inventory, and one of the worst winters in several


decades resulted in logistical nightmares and long shipping delays last spring. Our supply chain team ranked last spring as the most challenging season ever in terms of getting product from our mines and plants to distributors throughout North America.
Several factors contributed to this nightmare, but railroads were flagged for tripping up the system and, as a result, drew a yellow card in the first half. Their new business models that seek more ratable performance throughout the year will continue to create challenges and force changes in an industry that is subject to strong seasonality.
What to Watch for in the Second Half
Which Mother Nature Will Show Up?
Which Mother Nature shows up in the second half could move agricultural commodity prices up or down significantly from current levels. Crop prices not only impact plant nutrient demand but also affect market sentiment. As a result, it looks like another summer of “Whiskey and The Weather Channel” for grain traders (at least following the conclusion of the World Cup!).
The expectation of an El Niño event during the second half looms over agricultural and plant nutrient markets. El Niño events typically result in both positive and negative weather developments around the globe. For example, the Indian Meteorological Department forecasts that this year’s monsoon will be less than normal with rainfall equal to about 93% of average mainly due to the expectation of an El Niño event. However, El Niño events more often than not are associated with a favorable growing season in the U.S. Corn Belt. So, stay tuned.
We do not, however, expect a weather event to greatly impact our second half P&K shipment forecasts, especially in North America. The potential impact in 2015 – either bullish or bearish – may be another story.
In North America, an ideal growing season, another blockbuster harvest, and further erosion in crop prices are not expected to negatively impact fall shipments for several reasons. First, much of the lost revenue due to lower crop prices is offset by higher yields (e.g. 200 bushels of corn sold at $4.00 per bushel generates as much revenue per acre as 160 bushels sold at $5.00 per bushel). Second, higher yields remove more nutrients from the soil and therefore create a need to replace a larger amount of P&K in order to maintain soil fertility. Third, many farmers likely heeded the advice of farm management consultants and forward-priced some of their 2014 crop at prices that exceed current values. Fourth, farm balance sheets remain strong from several years of record net cash income, and it is unlikely that farmers would cut back on P&K at this point. Finally, dealer sentiment remains positive as evidenced by early and large purchases in anticipation of another blockbuster fall application season.
Will India Get in the Phosphate Game?
India mostly watched from the sidelines during the first half of this year’s phosphate match. Phosphate prices have moved up from seasonal lows in May even with the game’s superstar on the sidelines. Nevertheless, a key to the second half will be India’s performance down the stretch.
Indian importers have delayed the bulk of their purchases for several reasons. Buyers cited uncertainties surrounding recent national elections and potential changes in subsidy policies by the new government, forecasts of a below-average monsoon, anticipation of large supplies from China following the opening of their low export tax window on May 16, and expectations of lower prices the longer they waited as reasons for delaying purchases.
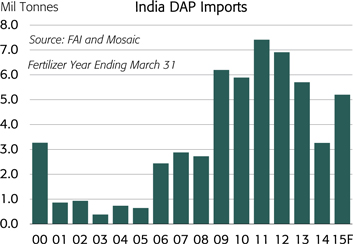
Major Indian importers indicate that they may need to buy less than 4.0 million tonnes of DAP in 2014/15. However, we project that, absent a complete monsoon failure, India still will need to import about 5.2 million tonnes this year due to continued strong on-farm demand, profitable import economics, and low inventories throughout the large retail channel. If this forecast is on target, we project that import arrivals from August through November would need to total 3.5 million tonnes or 1.2 million tonnes more than the same period a year ago.
How Much Phosphate Supply?
Several familiar supply uncertainties are expected to overhang the global phosphate market during the second half. In particular, supplies from China, Saudi Arabia, Morocco and the new Indian joint-venture acid plants in Tunisia and Jordan remain swing factors.
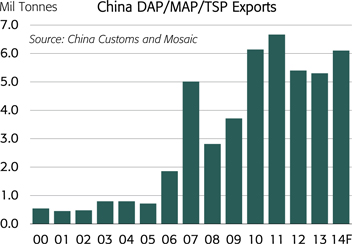
We project that China will export about 6.1 million tonnes of the leading phosphate products (DAP/MAP/TSP) this year, up nearly 800,000 tonnes from 5.3 million last year but less than the record 6.7 million in 2011. Exports during the first five months of 2014 already were up 218% or 1.2 million tonnes from the same period a year ago despite the delay in peak shipments to India. A seasonal surge of exports is expected before the low-tax window closes on October 15, particularly if India buys as much as forecast and demand remains strong in other regions.
Ma’aden is projected to produce and export about 2.3 million tonnes of DAP/MAP this year, up from 1.9 million last year but still less than capacity of about 2.9 million. It appears that the facility operates at high rates for a month or two but then encounters bottlenecks at various stages of production from rock beneficiation to rail transportation to phosphoric acid production.
OCP is expected to start up its first Jorf Phosphate Hub (JPH) later this year and may have some tonnage available from this facility before the end of this year. Two Indian JV acid plants in Tunisia and Jordan have started up, but performance reportedly is inconsistent due to normal start-up issues.
In the United States, the shut-down and permanent closure of PotashCorp’s Suwannee River plant this summer will reduce net phosphate supplies by approximately 215,000 tonnes P2O5 per year, so second-half supplies likely will drop by more than 100,000 tonnes.
Will the Potash Market Tighten Further?
Many Wall Street analysts expect that second half potash shipments will tail off much like a year ago. The situation this year is much different, however. Recall that Uralkali announced last July 30 that it had withdrawn from BPC, planned to execute a volume-over-price strategy, and expected prices to drop by approximately $100 to $300 per tonne at key destinations. This announcement for all intents and purposes caused movement to grind to a halt during the last half of 2013 as buyers waited to see how this new business model would play out.
Prices indeed have re-set to lower levels not so much as a result of the Uralkali announcement but rather due to supply and demand fundamentals (i.e. 12 million tonnes of new MOP capacity and flat demand over the last several years).
More moderate potash prices coupled with still relatively high commodity prices are powering a strong rebound in demand this year. As noted above, we are confident that global MOP shipments will jump more than 7% or nearly 4.0 million tonnes to 57 to 58 million tonnes this year.
Second-half prospects remain strong. Brazil imported nearly 3.5 million tonnes of MOP during the first five months of this year and is projected to import another 5.0 million during the rest of the year in order to hit our 2014 forecast of 8.5 million. The peak import season typically runs from May through October.
We project that China will import 6.5 million tonnes of MOP this year. Vessel deliveries are expected to total about 4.7 million tonnes. This total includes 3.0 million tonnes of base contract tonnage purchased in January as well as 1.7 million tonnes of optional tonnage that was mutually agreed to later in the first half. Rail deliveries are off to a slow start but still are projected to make up the remaining 1.8 million tonnes. Imports during the first five months totaled 3.3 million tonnes, and we expect similar volume to be shipped throughout the remainder of this year.
In India, we estimate that importers have contracted for more than 4.0 million tonnes of MOP for delivery during the fiscal year that ends on March 31, 2015. Imports during the first two months of the fiscal year (Apr-May) totaled just 380,000 tonnes, so more than 3.6 million tonnes are expected to ship during the remainder of the year with most of the tonnage expected to be delivered before the end of the calendar year. Given that both China ($305) and India ($322) have contracted for annual volumes at prices that are less than spot values, we expect shipments to these two large importing countries will reach our forecasts.
Finally, we expect another blockbuster fall application season in North America with shipments during the last seven months of this year totaling about 4.7 million tonnes, equal to movement during the same period a year ago.
As noted above, robust shipments coupled with planned or unplanned production outages last spring shrunk inventories held by North American producers to a level less than the seven-year Olympic average on May 31. We project that North American producer inventories will drop to the low end of the seven-year range during the last half of this year due to large contract commitments, continued strong spot sales prospects,