Attached files
| file | filename |
|---|---|
| EX-99.2 - PRESS RELEASE - VICTORY OILFIELD TECH, INC. | vyey_992.htm |
| 8-K - FORM 8-K - VICTORY OILFIELD TECH, INC. | vyey_8k.htm |
EXHIBIT 99.1

(OTCQX: VYEY)
Investor Presentation
GHS 100 Energy Conference, Chicago - June 2014

2
Forward-Looking and Cautionary Statements
This presentation contains forward-looking statements within the meaning of Section 21E of the Securities Exchange Act of 1934.
All statements, other than statements of historical facts, included in this press release that address activities, events or
developments that the Company expects, believes or anticipates will or may occur in the future are forward-looking statements.
These statements are based on certain assumptions made by the Company based on management’s experience, perception of
historical trends and technical analyses, current conditions, anticipated future developments and other factors believed to be
appropriate and reasonable by management. When used in this press release, the words “will,” “potential,” “believe,” “estimated,”
“intend,” “expect,” “may,” “should,” “anticipate,” “could,” “plan,” “project,” or their negatives, other similar expressions or the
statements that include those words, are intended to identify forward-looking statements, although not all forward-looking
statements contain such identifying words.
Among these forward-looking statements are statements regarding EURs, estimated BOE, estimated future gross undiscounted
cash flow and estimated drilling and completion costs. Such forward-looking statements are subject to a number of assumptions,
risks and uncertainties, many of which are beyond the control of the Company, which may cause actual results to differ materially
from those implied or expressed by the forward-looking statements, including but not limited to, changes to drilling plans and
schedules by the operators of prospects, overruns in costs of operations, hazards, delays, and any other difficulties related to
drilling for and producing oil or gas, the price of oil, NGLs, and gas, results of marketing and sales of produced oil and gas, estimates
made in evaluating reserves, competition, general economic conditions and the ability to manage and continue growth, and other
factors described in the Company Annual Report on Form 10-K for the fiscal year ended December 31, 2012 and any updates to
those risk factors set forth in the Company’s Quarterly Reports on Form 10-Q. Further information on such assumptions, risks and
uncertainties is available in the Company’s other filings with the Securities and Exchange Commission (“SEC”) that are available on
the SEC’s website at www.sec.gov, and on the Company’s website at www.vyey.com.
Any forward-looking statement speaks only as of the date on which such statement is made and the Company undertakes no
obligation to correct or update any forward-looking statement, whether as a result of new information, future events or otherwise,
except as required by applicable law.
obligation to correct or update any forward-looking statement, whether as a result of new information, future events or otherwise,
except as required by applicable law.

3
Company Profile
|
STOCK TICKER (OTCQX) 1
|
VYEY
|
|
Share Price
|
$0.35
|
|
Market Cap
|
$9.6 M
|
|
Shares Authorized
|
47.5 M
|
|
Shares Outstanding
|
27.5 M
|
|
Shares Held By Insiders
|
6.5 M
|
|
Float 2
|
21.0 M
|
|
Proved Reserves (PV-10)
|
$2.4 M
|
|
Proved Reserves (PV-0)
|
$4.2 M
|
|
Current Liquidity 4
|
>$25 M
|
|
2013 E&P Capex
|
~$2.0 M
|
|
2014 Estimated E&P Capex
|
$30.0 M
|
(1) As of 06/06/2014
(2) Includes 14.1 M shares held in certificate
(3) Proved reserves based on SEC case as of 1/1/2014
(4) Includes $25 million credit facility and cash on hand
(5) Based on 2013 10-K filed on March 28th, 2014
|
Mineral & Drilling Investments
|
81%
|
|
Proved Reserves (PV-10)
|
88%
|
|
Oil as a percentage of production
|
130%
|
|
Revenue from hydrocarbon sales
|
116%
|
Victory Energy Corporation
•High growth oil and gas E&P focused on
creating shareholder value through the
acquisition and development of assets in
the World Class Permian Basin
creating shareholder value through the
acquisition and development of assets in
the World Class Permian Basin
•The company currently holds interests in
high profile plays such as the Cline,
Wolfcamp, Mississippian and Fusselman
high profile plays such as the Cline,
Wolfcamp, Mississippian and Fusselman
•Victory is growing cash-flows through
sustainable low-risk vertical well
development
sustainable low-risk vertical well
development
•Established as Victory Energy in 2006 and
headquartered in Austin, Texas, with
additional technical resources located in
Midland, Texas
headquartered in Austin, Texas, with
additional technical resources located in
Midland, Texas
2012 - 2013 Year-over-Year Growth Rates 5
Operations Summary 3

4
Investor Highlights
• Permian Basin (Texas), Resource Focus
• Early stage rapid-growth company
• Oil and liquid rich gas focus, growing
reserves and cash flow
reserves and cash flow
• Experienced management team and
world-class operators
world-class operators
• Asset value upside (PUD) in the portfolio
• $35M in Capex access through Texas
Capital Bank credit facility and Aurora
Energy Partners
Capital Bank credit facility and Aurora
Energy Partners

5
Business Model
• Low-risk vertical well development on existing and acquired properties.
• Focus on well-known basins with break-even points below $55 per barrel of oil. 1
• Locate multi-well drilling opportunities that provide three or more years of drilling inventory.
• Focus acquisitions on lower risk development opportunities that offer significant seismic and
analogous well data support.
analogous well data support.
• Targets predictable resource plays with favorable operating environments, consistent reservoir
quality across multiple horizons, long-lived reserve characteristics and high drilling success rates.
quality across multiple horizons, long-lived reserve characteristics and high drilling success rates.
• Permian vertical wells typically deliver greater than $2 M of proved reserve value for every $1 M of
Capex spent to drill and complete a well. (“Capex multiple”). 2
Capex spent to drill and complete a well. (“Capex multiple”). 2
• Return of investment capital occurs in 12-24 months.
• Leverages both internal capabilities and key industry relationships to acquire non-operated, high-
grade working interest positions in predictable, low-to-moderate risk oil and gas prospects.
grade working interest positions in predictable, low-to-moderate risk oil and gas prospects.
• Target 5%-25% working interest in Permian Basin, liquids rich oil and gas prospects
• The operator must have an established track record and a team of management, geologists,
engineers and service providers who have worked together on similar plays.
engineers and service providers who have worked together on similar plays.
• The operator must have a significant portion of the risked working interest.
• Build-out of internal operating capacity to begin early 2015
• Through Texas Capital Bank credit facility and access to equity capital through Aurora Energy Partners,
the Company has access to $35M in investment capital.
the Company has access to $35M in investment capital.
(1) 2013 Standard & Poor’s Report
(2) Based on independent third party reserve reports and 2013 and Q1 2014 sales

6
Established Capital Sources for Sustained
Growth
Growth
• Financial relationship established in October 2011
• Members include sophisticated investors & boutique private equity
• $10 M private placement now underway (Navitus Partners)
• Issue of VYEY warrants with each investment provides additional
capital at a later date
capital at a later date
• Investors are represented on the Victory board of directors
AURORA ENERGY
PARTNERS
PARTNERS
(50/50 owned by Victory and Navitus)
• Midland banking relationship established in February 2014
• Agreement provides for $25 M credit facility for operations and
acquisitions
acquisitions
• Allows Victory to acquire capital as needed and when deployable
• Additional relationships will be developed as needed, which could
include a future VYEY institutional private equity round
include a future VYEY institutional private equity round
• Institutional round provides basis for moving to a larger exchange
BANKING AND OTHER
RELATIONSHIPS
RELATIONSHIPS

7
2014 Strategic Financial Deliverables
• Disciplined use of acquisition capital as needed and when deployable
• Short-term capital deployment focused on growing cash-flow
• Secondary capital deployment focused on upside development
• Leverage and balance private capital, equity and debt to provide
additional development funds into 2015
additional development funds into 2015
• Deploy $30 M of capital towards E&P development and acquisitions
• Create more than $60 M in proved reserves
• Target longer-life, quality prospects with improved PUD opportunity
• Expand strategic relationships, geographical reach and quality operators
• Focus on Permian Basin wells with 75% or better liquid profile
INCREASE
RESERVES
RESERVES
• Reduce F&D costs; shift investment mix to include higher working
interest projects with upside potential; focus more on oil and liquids rich gas
interest projects with upside potential; focus more on oil and liquids rich gas
• Continue to drive down G&A expenses as a percent of revenue
• Achieve higher annual production rates
• Maintain optimal balance of oil vs. liquids rich gas production
IMPROVE
RETURNS
RETURNS
MANAGE
BALANCE
BALANCE
SHEET

8
2013 Success Validates Capex Model
First Permian Acquisition
in March 2012. Spud January 2013.
(1) Proved reserves based on SEC case as of 1/1/2014
2011-2013 2012 vs 2013
Growth Rates CAGR Annual
Growth Rates CAGR Annual
}Net Proved Reserves 42% 81%
}Proved Reserves (PV-10) 50% 39%
}Mineral & Drilling Investment 87% 88%
$25,000
$589,395
$1,212,899
$2,278,032

9
2013 Permian Oil Focus is Accelerating Results
2011-2013 2012 vs 2013
Growth Rates CAGR Annual
Growth Rates CAGR Annual
}Oil as a percentage of production N/A 130%
}Revenue from hydrocarbon sales 55% 125%

10
Why Focus on the Permian Basin?
• The play is the largest oil field in the U.S. (Baker-Hughes
rig count & recoverable resources).
rig count & recoverable resources).
• Predictable vertical well economics deliver break-even
points at less than $55 per bbl (Midland Basin). 1
Standard & Poor’s 2013 Report
points at less than $55 per bbl (Midland Basin). 1
Standard & Poor’s 2013 Report
• Increased use of enhanced-recovery practices has
produced a substantial impact on U.S. oil production,
making up 71% of all oil production in Texas and 17% of
total U.S. production at the end of 2013.
produced a substantial impact on U.S. oil production,
making up 71% of all oil production in Texas and 17% of
total U.S. production at the end of 2013.
• The estimated ultimate recovery (EUR) for a Permian
Basin vertical well is between 100,000 and 150,000
BOE, with horizontal wells yielding averages from
350,000 BOE to more than 600,000.
Basin vertical well is between 100,000 and 150,000
BOE, with horizontal wells yielding averages from
350,000 BOE to more than 600,000.
• According to industry consultants, production in the
Permian Basin is estimated to grow 60% between now
and 2016, reaching a total of 1.8 million barrels per day.
Permian Basin is estimated to grow 60% between now
and 2016, reaching a total of 1.8 million barrels per day.
1 Standard & Poor’s 2013 Report
11
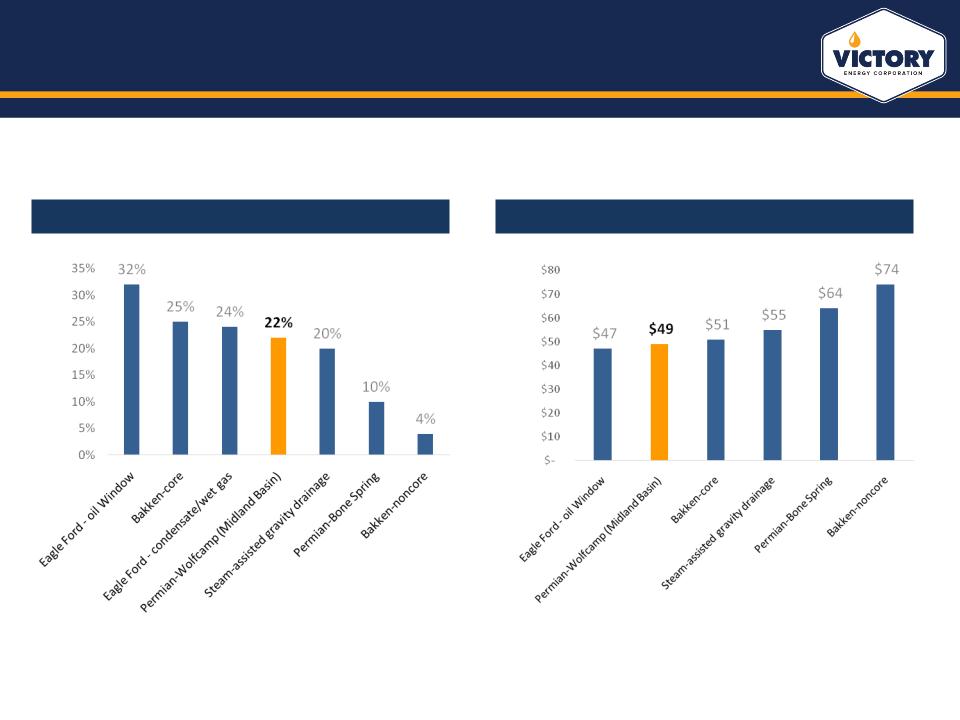
Predictable Economics Deliver Predictable Outcomes
Our current focus is on vertical wells with $49 - $55 WTI Oil Price Break Even
Estimated Internal Rates of Return By Play *
* Returns are based on Standard & Poor’s West Texas Intermediate price
assumptions of US$85 per barrel for 2013, US$80 for 2014, and US$75
thereafter.
assumptions of US$85 per barrel for 2013, US$80 for 2014, and US$75
thereafter.
S&P’s Estimated Break-Even WTI Oil Price By Play
US$/Barrel

12
As Learning Curve Improves, Horizontal Activity Increases
Source: Baker Hughes Rig Count November 2013

13
Horizontal Decision Metrics (Best Cost Curve Drives Choice)
• Deploy capital in the sweet spot
• Completion techniques for optimal EUR and lower
drilling costs provide more predictable returns
drilling costs provide more predictable returns
• Lower cost acreage positions remain available
• Geoscience and other technical data provide
solid guidance for analogous well log analysis
and soil testing.
solid guidance for analogous well log analysis
and soil testing.
Production and Ultimate Recovery Rates Improve
High
Low
Low
High
Early
Development
14
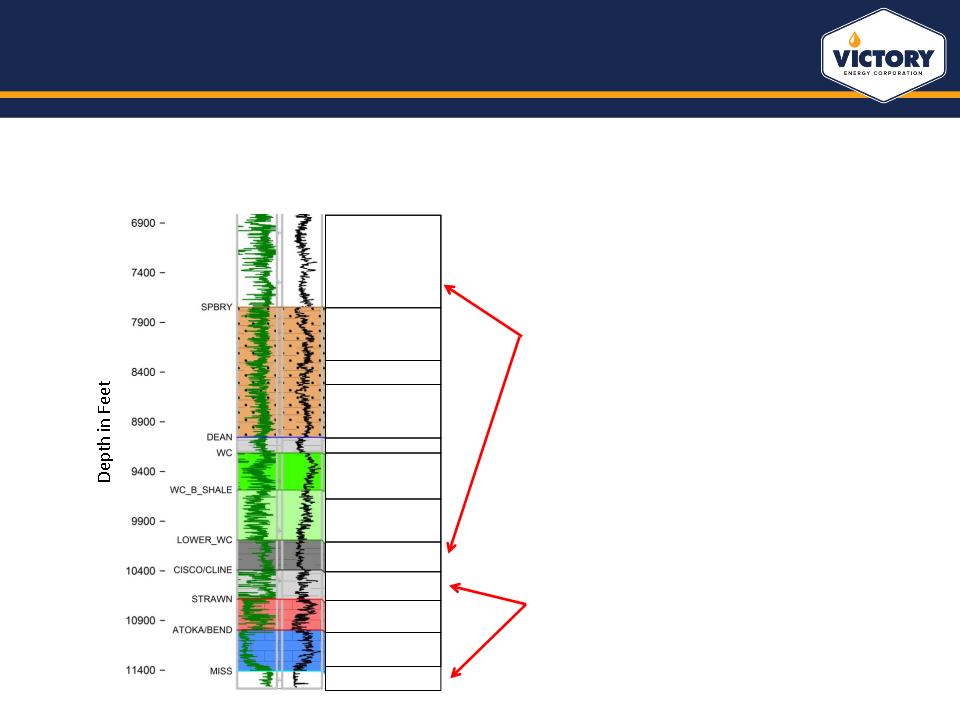
Opportunity for Secondary Development
The Permian is also attractive because it has multiple pay zones - some of which are
extremely amenable to horizontal drilling (Develop vertical now, horizontal later)
extremely amenable to horizontal drilling (Develop vertical now, horizontal later)
•Most Permian companies have been exploiting
“Wolfcamp” or “Clear Fork” plays using
inexpensive vertical wells with multiple frac
zones
“Wolfcamp” or “Clear Fork” plays using
inexpensive vertical wells with multiple frac
zones
•In some cases, these same zones are amenable
to much more effective horizontal techniques
(recent completions in the
Wolfcamp/Spraberry have yielded IP of 500-
3600 Boepd)
to much more effective horizontal techniques
(recent completions in the
Wolfcamp/Spraberry have yielded IP of 500-
3600 Boepd)
•Further upside still can come from successfully
exploiting “behind the pipe” pay-zones such as
the Mississippian or Cline using new
technologies
exploiting “behind the pipe” pay-zones such as
the Mississippian or Cline using new
technologies
Clear Fork
Upper Spraberry
Lower Spraberry
Jo Mill
Dean
Woldcamp A
Wolfcamp B
Wolfcamp C
Cline
Strawn
Atoka
Mississippian
15
Acquisition and Development Plan
1. Drill and complete available
development well locations on
current high-value
properties
development well locations on
current high-value
properties
2. Acquire producing property(s) in
the Midland and Central basins
with
the Midland and Central basins
with
• Over 12 months of
production history
production history
• $125,000 to $200,000 of monthly
cash-flow
cash-flow
• Additional upside from proved
undeveloped (PUD) drilling
locations
undeveloped (PUD) drilling
locations
3. Acquire additional properties with PDP valuations representing 75% or more of prospect
value
value
4. Sell properties with limited development upside and re-deploy capital to other properties
with production and three or more years of development
with production and three or more years of development

16
Lightnin’ Property
Disposition Details
• Acquired March 2012 (640 gross acres) for $480,256
• First well spud January 2013
• Cumulative Capex of $2,075,074
• Gross cumulative cash flows of $461,918
• Sold June 2014 for $4,021,400
63% internal rate of return (IRR)
Adding Value Through Disciplined Development
17
Disciplined Deployment of Capital
|
|
|
|
|
|
|
|
|
|
|
Lightnin' Sale
|
Fairway Purchase
|
Delta
|
Multiple
|
|
|
|
Permian Basin County
|
Glasscock (Tier 1)
|
Glasscock (Tier 1)
|
N/A
|
N/A
|
|
|
|
Purchase (Sale) Price
|
$ 4,080,000
|
$ 5,985,059
|
$ 1,905,059
|
1.5
|
|
|
|
Developed Acres
|
320
|
1,280
|
960
|
4.0
|
|
|
|
Undeveloped Acres
|
320
|
3,280
|
2,960
|
10.3
|
|
|
|
BOE/PD
|
32 (1)
|
64.43 (2)
|
32
|
2.0
|
|
|
|
PDP Wells
|
4
|
9
|
5
|
2.3
|
|
|
|
PUD Wells
|
2
|
8
|
6
|
4.0
|
|
|
|
Pro-Forma Sale (Purchase)
Price per Flowing BOE |
$ 127,500
|
$ 92,894
|
$ (33,983)
|
0.7
|
|
|
|
% Oil
|
72.9%
|
73.0%
|
0.1%
|
1.0
|
|
|
|
|
|
|
|
|
|
(1) Reflects Q1 and Q2 2014 production
(2) Based on third party reserve reports and internal forecasts

18
Pending Fairway Acquisition (Proved and Producing)
• Target Energy is selling a 10% WI (7.5% NRI) of its proven and producing Permian Basin asset
• The proven property is located within the “Core” Wolfberry and Fusselman acreage window of
Glasscock County Texas and has significant development upside
Glasscock County Texas and has significant development upside
• Purchase price of $5.9 million
• Current in-place development
– 4,560 gross non-contiguous acres in the central Midland Basin of the Permian
– 480 acres are held by production (HBP) with 5 vertical Wolfberry and 4 vertical Fusselman
producers
producers
– Current production to the net 10% working interest is 64 BOE/PD
• The operator has identified 40 additional drilling locations on the remaining development acreage in
the Wolfberry and Fusselman with attractive IRRs - >50%
the Wolfberry and Fusselman with attractive IRRs - >50%
– First 8 well locations will be drilled and completed in 2014 with individual AFE’s of $1.8 - $2.1M
– An additional 22 wells will be drilled and completed in 2015 and 2016, leaving an estimated 10
additional wells for future development
additional wells for future development
– $6.2M additional development capital is required over next 3 years (net the 10% working interest)
• Anticipated closing June 30th, 2014

19
Fairway Economic Plan & Assessment
• The company plans to acquire Fairway and improve the property’s current cash-flow and market
valuation via a three year or shorter development plan
valuation via a three year or shorter development plan
• Utilizing an independent third-party reserve report and a development model established by the current
operator, the company anticipates a significant financial return
operator, the company anticipates a significant financial return
• Total three year acquisition and development Capex of $12.1 million
• $5.9 million purchase price
• $6.2 million three year drilling and development plan
• Cash-flow and sale at end of three year period offers better than 60% IRR
• Total 3 year EBITDA of $8.3 million with $3.1 million occurring in year three
• Based on current comparable flowing barrel sales in this area ($115k - $152K), the company
anticipates a late 2016 or early 2017 sale of the asset
anticipates a late 2016 or early 2017 sale of the asset
• EOY 2016 daily flow rate estimate of 143 BOE to our NRI
– At $115,000 per flowing barrel the sale price is $16,4 million
– At $152,000 per flowing barrel, the sale price is $21.7 million
• That’s $24.7 to $30 million cash on cash return for the $12.1 million of investment

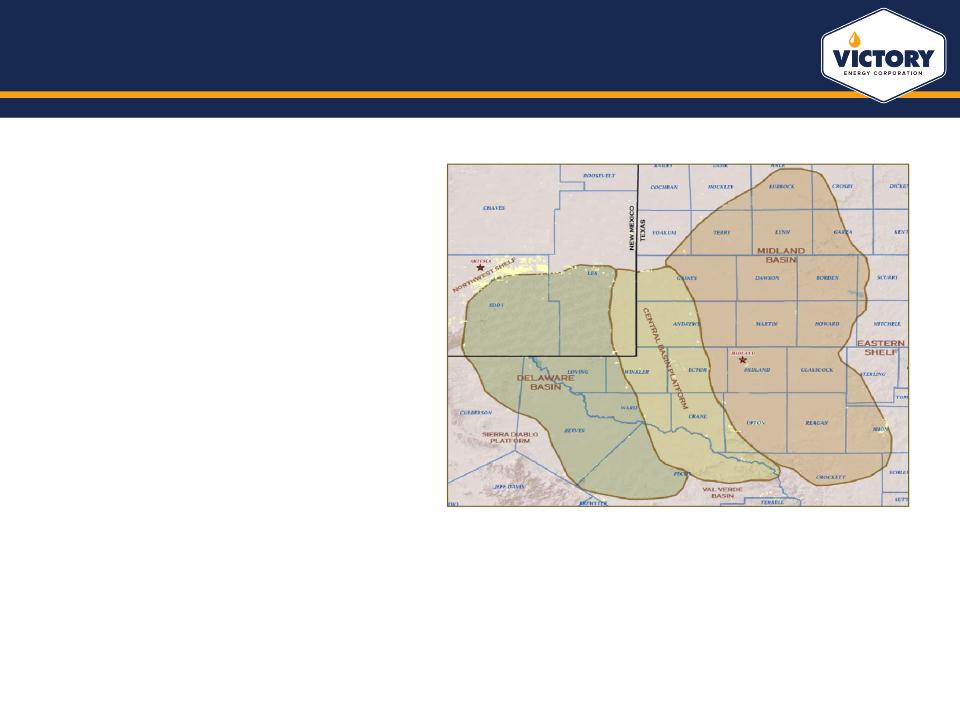
20
Fairway is in the Heart of the “Tier 1” Zone
Source: Pioneer 2013, 3Q Report
21
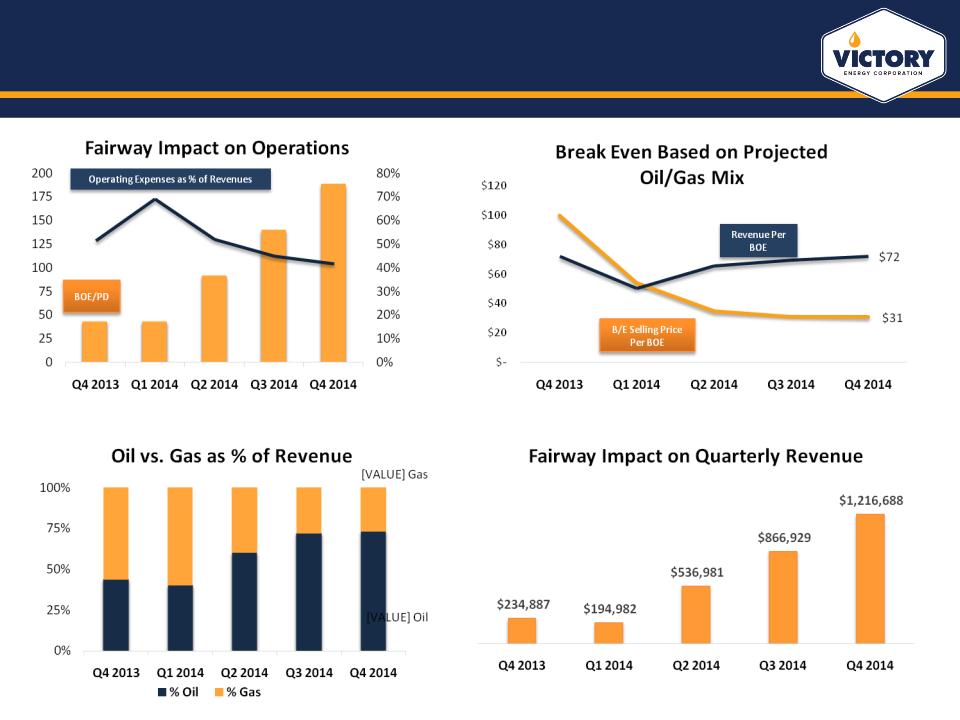
Fairway Impact on the Company
Production and economics based on May 2014 third-party reserve report

22
Bootleg Canyon (Proved and Producing)
Vertical Well Economic Summary
• Well cost to the 100% $1.55M
• Working Interest 5%
• Net Revenue Interest 3.75%
• Well Costs to working interest $78,000
• Return on capital multiple 7.79
Description
• Acquired April 2011 (over 5,000 acres)
• Located in Pecos County, TX
• Conventional drilling play (vertical)
• Three wells completed with seven remaining
o 2 oil wells with EUR of 187,240 BO
o 1 gas well flowing to sales with daily flow at 475 mcf
188,000 BOE
188,000 BOE
• 3D seismic supported
• Formation focus - Ellenberger (oil) & Connell (gas)
• Operator is V.F. Petroleum (Midland, TX)
Reserves and Production Model to 3.75% NRI
• Production estimated to occur through 2027
• Gross EUR (BO) per well 187,240 BO
• Net EUR (BO) per well 6,909 BO
• Gross EUR, ten wells 1,872,400 BO
• Net EUR, ten wells 69,090 BO
• Percent Oil 75%
• Percent Gas 25%

23
Adams Baggett Gas Field (Proved and Producing)
Per Well Economics
• Well cost to the 100% $600K
• Working Interest in 7 wells 100%
o Net Revenue Interest 75%
• Working Interest in 2 wells 50%
o Net Revenue Interest 38%
• High Btu premium price to market of 28%
Description
• Acquired 2008 (180 acres)
• Located in Crockett County, TX
• High Btu natural gas production
• Nine vertical gas wells completed and on production
with zero remaining locations available
with zero remaining locations available
• Formation focus - Canyon Sandstone (4,300-4,900’)
• Operator is Cambrian Management (Midland, TX)
Reserves and Production Model to 75% NRI
• Gross EUR for the field 937.48 MMcf
• Net EUR for the field 599.80 MMcf
• Estimated Net future cash
flow from proved reserves of $1.7M
flow from proved reserves of $1.7M

24
Experienced E&P Management
• Served as Victory’s COO from Jan. 2011 - Jan. 2012.
• 21 years of professional experience, seven in E&P.
• Previously held titles of Interim CEO, VP of Operations and VP
Investor Relations with another publicly traded E&P company.
Investor Relations with another publicly traded E&P company.
• Member of the first 20 employees at Dell Inc.
• Business Management and Business Marketing Southwest Texas
State University (now Texas State University). The University of
Texas Graduate School of Business Executive Education program,
The Aspen Institute and the Center for Creative Leadership.
State University (now Texas State University). The University of
Texas Graduate School of Business Executive Education program,
The Aspen Institute and the Center for Creative Leadership.
• Energy Finance Executive with 36 years of proven leadership in
financial and operational reporting, internal controls and SOX
compliance, tax, legal and information systems.
financial and operational reporting, internal controls and SOX
compliance, tax, legal and information systems.
• 20 years with Louisiana Land & Exploration Co
• 7 years experience with ConocoPhillips as a Director in upstream
accounting services
accounting services
• 4 years as Controller for Pioneer Natural Resoruces
• CAO with MagnumHunter and River Gas Corp.
• Over 35 years of oil and gas industry law centered on the upstream,
midstream and downstream activities of major and independent oil
companies.
midstream and downstream activities of major and independent oil
companies.
• His expertise encompasses all aspects of oil and gas operations.
• Recognized as one of the top oil and gas attorneys in the United
States.
States.
• Member of the Bar, State of Texas: a Life Fellow, Texas Bar
Association and Founding Fellow, Austin Bar Association.
Association and Founding Fellow, Austin Bar Association.
• Over 40 years of oil and gas experience in prospect evaluation,
acquisition, exploration, drilling, development and divestitures.
This includes 25 years of Management and Executive level
experience.
acquisition, exploration, drilling, development and divestitures.
This includes 25 years of Management and Executive level
experience.
• Mr. Hair is the founder and managing member of privately held
C&F Minerals LLC. He has run this privately owned company since
1985.
C&F Minerals LLC. He has run this privately owned company since
1985.
• Held the position of Division Land Manager for Samedan Oil
Corporation (NYSE - Noble Affiliates).
Corporation (NYSE - Noble Affiliates).
• Held the position of Exec. VP for Costilla Energy Inc. (NYSE)
• BBA in Accounting at The University of Houston, member of the
Permian Basin Landman’s Association, the Permian Basin Oil and
Gas Association and serves on the Board of Director’s for Habitat
for Humanity Permian Basin.
Permian Basin Landman’s Association, the Permian Basin Oil and
Gas Association and serves on the Board of Director’s for Habitat
for Humanity Permian Basin.
• The company also utilizes a team of third-party professionals on an
as-needed basis. This team includes geologists for property
evaluation, assessment and reservoir engineering resources for the
analysis of current and new properties. Each independent operator
utilized by the company also has their own array of targeted experts.
as-needed basis. This team includes geologists for property
evaluation, assessment and reservoir engineering resources for the
analysis of current and new properties. Each independent operator
utilized by the company also has their own array of targeted experts.

25
Investment Summary
• Proven management team with over 150 years of combined oil and gas experience
• Predictable IRRs offered by the largest resource play in the U.S. (Permian Basin)
• Access to proved producing properties and development project deal flow
• Strong balance sheet - excellent capital liquidity
o Low cost capital source via $25 M bank credit facility
o $10 M private placement through the Aurora partnership is underway
o Improving cash-flow and proved reserves from near-term acquisitions
• Ground-floor entry into fast growing publicly traded company
o 2013 revenue from hydrocarbon sales up 125% vs. EOY 2012
o 2013 proved reserves (PV-10) value up 39%+ vs. EOY 2012
o 2013 oil as a percent of production up 130% vs. EOY 2012
o Recent addition of new capital will accelerate future growth
• The opportunity pipeline and new technology deployment has combined to deliver lower F&D
costs; higher volumes, longer life assets, incremental revenue and higher EBITDA
costs; higher volumes, longer life assets, incremental revenue and higher EBITDA

26
Contacts
Investor Relations
Derek Gradwell
Senior Vice President, Natural Resources - MZ North America
Main: 212-301-7130
Direct: 512-270-6990
Email: dgradwell@mzgroup.us
www.mzgroup.us
Victory Energy Corporation
Kenneth Hill, CEO
Email: Kenny@vyey.com
Phone: (512) 347-7300
www.vyey.com