Attached files
| file | filename |
|---|---|
| 8-K - TAIWAN FUND INC | fp0010783_8k.htm |
Data as of 5/31/14
Manager's Commentary
Against the backdrop of a benign global financial environment, the Taiwan stock market (the "Market") continued to march on in May. The Taiwan Stock Index (the "Index") rallied another 3.24% (in Taiwan dollar terms), with the performance of the three major subsectors, electronics, financials and non-techs, returning 4.74%, 6.18% and -0.02% respectively, while the Fund's net asset value (the "NAV") advanced 5.12% (in US dollar terms) for the month.
Better than expected S&P 500 performance and persistent relaxation of global monetary policy should paint a rosy outlook for the export driven Taiwanese economy. The domestic environment also shows signals of a sustained recovery. The National Development Council's economic monitoring score hit 29 for April, the third consecutive month of "Green light" (stable growth) and the highest score in the past three years. Both business confidence and the labor market improved. All signals indicate a stable and positive economic outlook.
On the negative side, the most significant event during the month was Vietnam's anti-China riot on May 13, 2014. Despite the fact that this event was triggered by Vietnam and China's dispute over a Chinese company's offshore oil rig near the Paracel Islands, Taiwan stands to be the largest victim. Hundreds of Taiwanese owned factories in Vietnam were broken into, robbed or forced to close for days during the protest.
Vietnam is Taiwan's second largest outbound investment destination next to China. As of February 2014, the accumulated Taiwan investment in Vietnam had reached $28.5 billion USD. This makes Taiwan the fourth largest foreign investor in the country next to Japan, Singapore and South Korea. China, on the other hand, was the ninth largest foreign investor in Vietnam with total investment approximately $7.3 billion USD.
Unfortunately for Taiwan businessmen, Taiwan companies were the mob's prime target during the riot. This was due to the fact that many Vietnamese consider Taiwan as a part of China. Even more importantly, Taiwan companies in Vietnam often display signage with Chinese characters and employ Chinese managers, and as a result, were mistaken as Chinese companies. It is estimated that total loss could amount to $500 million USD. The majority of companies that suffered were non-tech names which partially explains the underperformance of non-tech stocks against the broader market.
For companies held by the Fund, Formosa Plastics (1301.TT), Eclat Textile (1476.TT), Sanitar (1817.TT) and Feng Tay Enterprise (9910.TT) have significant exposure to Vietnam. While all of the names suffered some loss due to break-ins or factory closures, the losses are still manageable at this point. We continue to hold positive views on the companies that operate in Vietnam as they stand to benefit from regional free-trade agreements. However, we believe most companies will need to diversify their manufacturing base in the long-run to reduce their business risk.
Investment Review
There have been substantial changes since we took over the management of the Fund in late February this year. Most notably, we have cut down the exposure on China plays and property-related names. Exposure to electronic stocks increased from 39% to nearly 49% to cater to the upward trend in the semiconductor and optoelectronics sectors.
One of the successful disposals during the period has been Yungtay Engineering (1507.TT). The company is the fifth largest electric elevator manufacturer in China. Yungtay has been a well-liked China play due to its solid management structure and the booming China property market. However, we believe the demanding valuation and the end of China’s property cycle make this stock unattractive. Yungtay accounted for nearly 5% of the Fund in February. We completed the disposal of the stock in early May, right before the collapse of its share price. Since then the share price has dropped by over 15% (in Taiwan dollar terms).
On the flip side, we sold PC Home Online (8044.TT) too early. PC Home is the largest on-line shopping store in Taiwan. We were bearish on the company because we believe demand for 3C (computer, communication, and consumer electronics) products will decrease; and rising warehousing and transportation costs will result in higher operating expenses. To our surprise, the growth in on-line grocery sales (including fast moving consumer goods and foods) not only rejuvenated topline sales, but also contributed to higher margins. The Fund sold the shares in mid-April and the share price has rallied since.
|
In Brief
|
|
Net asset value per share
|
$21.76
|
|
Market price
|
$19.76
|
|
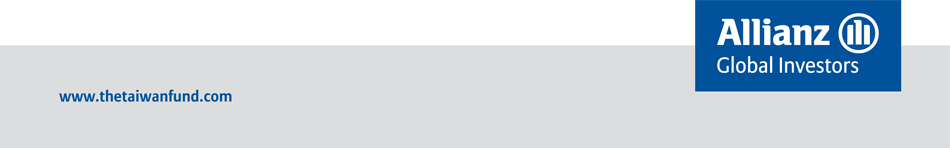
Premium/(discount)
|
-9.19%
|
|
Total net assets
|
$178.88 m
|
|
Market cap
|
$162.45 m
|
|
Source: State Street Bank and Trust Company
|
|
As of May 31, 2014
|
US$ return
|
|
Fund* %
|
TAIEX Total Return Index %
|
|
One Month
|
5.12%
|
3.98%
|
|
Three Months
|
3.67%
|
6.16%
|
|
One Year
|
16.24%
|
12.94%
|
|
Three years % pa
|
1.73%
|
2.36%
|
Returns are annualized, except for periods of less than one year.
*Source: State Street Bank and Trust Company.
NAV performance.
†Source: TWSE.
Past performance is no guarantee of future results.
|
Fund Details
|
|
|
Shares outstanding
|
8,221,259
|
|
Exchange listed
|
NYSE
|
|
Listing date
|
1986
|
|
Investment manager
|
Allianz Global Investors
U.S. LLC (AllianzGI U.S.)
|
|
Source: State Street Bank and Trust Company
|
|
 |
 |
|
Weimin Chang
|
Helena Pi
|
The Taiwan Fund, Inc.
Largan Precision (3008.TT), the dominant supplier for optical lenses used in mobile phone cameras, has been one of the successful new purchases. Largan Precision is a well-known mid-cap name with a solid operating record. The share price, however, has never been "cheap." We decided to add this name into the Fund because we believe its client structure has improved significantly over the last 12 months; hence we are likely to see a further upward revision in both revenue and margin. The Fund acquired shares in two tranches in March and April. Currently Largan Precision accounts for 3.1% of the Fund.
Eclat Textile (1476.TT), the largest elastic fabric and garment manufacturer in Taiwan detracted from performance. Eclat has enjoyed double digit growth on both the top and bottom line for several years which came back to haunt us when growth slowed and the stock was de-rated. Eclat continues to be in the Fund as we believe the secular story is not complete; however we have a more reasonable price target for the stock.
There has been further Fund transition since the beginning of May. Stocks with weightings under 1% have been largely eliminated to increase focus on conviction names. As a result, the number of names in the Fund has dropped from 64 to 52. We have also taken the opportunity to reduce the less liquid names, so the Fund has the ability to be more nimble when needed.
Another major move in the Fund has been to increase exposure to the financial sector. Year-to-date, the financial index has dropped 2.95%, underperforming the Market by 8.34%. The sector has been an underdog as the Market prefers higher growth tech names. Currently, the financial sector only accounts for 5% of the Market turnover, the lowest percentage in five years and far below its Index weighting of 13%. With solid balance sheets, an improved business outlook and reasonable valuations, we believe the downside is limited. We increased the Fund’s financial exposure from 3.6% to 8.5% during the month.
Taiwan Outlook
The low season for electronic companies is traditionally May to July. We expect this year to be no exception. Other than the seasonal dip, we are concerned with the demand in China. Both TV and mobile phone sales in China were below expectations during the holiday period in early May. Considering these factors, we are becoming more selective in electronic names, especially upstream semiconductors.
Apple plays are still favorable, including companies like Hon Hai Precision Industry (2317.TT), Largan Precision (3008.TT) and Catcher Technology (2474.TT). Apple is about to announce its new generation iPhone 6 in September. With much anticipated increased screen size and new operating system, we expect the iPhone 6 to be a huge success. To prepare for the launch, the Apple supply chain will likely begin warming up in early June.
We will be more cautious on companies that cater to China mobile phone demand. Until recently, the demand for mobile phone-related integrated circuits (“ICs”) has been very strong. However, the official sell through number suggests that smart phone demand in China is saturated. We see potential for semi- conductor inventory to pile up and future demand to be hampered, so we decreased our exposure in related names.
There are, however, still quite a few bright spots in the electronic hardware space. For example, we have been adding names in fiber optics networking, Bluetooth speaker box, internet and computer gaming. Most of them are niche players with sound governance and an exciting business outlook.
Tech names aside, we are increasingly interested in financial stocks as the sector is the leveraged play to the entire economy. We also like biotech and auto part names due to the strong business performance. Overall, we believe the Taiwan market is still healthy given the current liquidity environment and funda- mental outlook. Government policy is likely to be increasingly supportive because of the general election in November.
Objective
The Fund was launched on December 23, 1986 to allow US and other investors to access and participate in the growth of the economy and the stock market in Taiwan, the Republic of China. The Fund’s investment objective is to seek long-term capital appreciation primarily through investments in equity securities listed in Taiwan. The Fund is a diversified, closed-end management investment company listed on the New York Stock Exchange (NYSE) under the symbol ‘TWN’.
Taiwan, with its global market leadership in high technology goods and its significant investments throughout mainland China and Southeast Asian economies, is now an integral economic player in the Asia Pacific Region as well as around the world. Investing in Taiwan not only allows investors to capitalize on Taiwan’s dynamic economy, but also allows investors to reap the growth and investment potential of mainland China and other emerging economies of the region.
|
Performance (US$ Returns)
|
NAV %
|
Market Price %
|
|
One month
|
5.12%
|
5.33%
|
|
Three months
|
3.67%
|
4.49%
|
|
Three years % pa
|
1.73%
|
1.64%
|
|
Source: State Street Bank and Trust Company
|
||
|
Sector Allocation
|
|
|
|
|
Fund** %
|
Benchmark†† |
|
Semiconductor
|
17.6
|
21.6
|
|
Other Electronic
|
13.8
|
6.7
|
|
Electric Machinery
|
9.2
|
1.9
|
|
Finance and Insurance
|
8.5
|
13.3
|
|
Biotechnology and Medical Care
|
7.5
|
0.9
|
|
Trading and Consumers' Goods
|
4.9
|
1.8
|
|
Other
|
4.9
|
3.3
|
|
Optoelectronic
|
4.6
|
4.5
|
|
Computer and Peripheral Equipment
|
4.4
|
6.9
|
|
Electronic Products Distribution
|
4.2
|
1.0
|
|
Electronic Parts/Components
|
3.6
|
4.8
|
|
Building Material and Construction
|
2.8
|
1.9
|
|
Plastic
|
2.5
|
6.4
|
|
Textile
|
1.7
|
1.9
|
|
Shipping and Transportation
|
1.1
|
1.6
|
|
Oil, Gas and Electricity
|
1.1
|
2.9
|
|
Chemical
|
0.7
|
1.2
|
|
Glass and Ceramic
|
0.6
|
0.3
|
|
Information Service
|
0.5
|
0.2
|
|
Rubber
|
0.4
|
1.7
|
|
Cement
|
-
|
1.3
|
|
Food
|
-
|
1.8
|
|
Electrical and Cable
|
-
|
0.4
|
|
Paper and Pulp
|
-
|
0.3
|
|
Iron and Steel
|
-
|
2.3
|
|
Automobile
|
-
|
1.7
|
|
Communications and Internet
|
-
|
6.8
|
|
Tourism
|
-
|
0.6
|
|
**
|
Source: AllianzGI U.S.
|
|
††
|
Source: Bloomberg , Taiwan Stock Exchange (TWSE) industry classification
|
|
15 Largest Holdings
|
% of net assets
|
|
| Taiwan Semiconductor Manufacturing Co. Ltd. | 5.9 | |
|
Hon Hai Precision Industry Co., Ltd.
|
4.3
|
|
|
WT Microelectronics Co., Ltd.
|
|
4.2
|
|
YungShin Global Holding Corp.
|
3.9
|
|
|
Aurora Corp., Inc.
|
|
3.8
|
|
Novatek Microelectronics Corp. Ltd.
|
3.7
|
|
|
Mercuries & Associates, Ltd.
|
|
3.5
|
|
Largan Precision Co., Ltd.
|
|
3.1
|
|
Advantech Co., Ltd.
|
|
3.1
|
|
CTBC Financial Holding Co., Ltd.
|
3.0
|
|
|
Cathay Financial Holding Co., Ltd.
|
2.9
|
|
|
Elite Advanced Laser Corp
|
|
2.7
|
|
Formosa Plastics Corp.
|
|
2.5
|
|
Delta Electronics Inc.
|
|
2.2
|
|
Hiwin Technologies Corp.
|
|
2.1
|
Source: State Street Bank and Trust Company.
The Taiwan Fund, Inc.
|
Average Annual Returns
|
||||||||
|
|
One Month
|
Three Months
|
YTD
|
1 Year
|
3 Year
|
5 Year
|
10 Year
|
Inception
|
|
NAV*
|
5.12%
|
3.67%
|
1.92%
|
16.24%
|
1.73%
|
11.28%
|
7.30%
|
8.96%
|
|
Market Price*
|
5.33%
|
4.49%
|
2.28%
|
18.32%
|
1.64%
|
9.94%
|
7.99%
|
7.25%
|
|
TAIEX Index
|
3.97%
|
6.15%
|
4.75%
|
9.71%
|
-1.18%
|
7.41%
|
5.37%
|
-
|
|
TAIEX Total Return Index
|
3.98%
|
6.16%
|
4.76%
|
12.94%
|
2.36%
|
11.10%
|
9.32%
|
-
|
|
MSCI Taiwan Index
|
3.94%
|
8.11%
|
6.33%
|
11.79%
|
1.74%
|
9.79%
|
6.55%
|
-
|
Returns are annualized, except for periods of less than one year.
*Source: State Street Bank and Trust Company. Launch date December 23, 1986. Returns for the Fund are historical total returns that reflect changes in net asset value and market price per share during each period and assume that dividends and capital gains, if any, were reinvested. Net asset value is total assets less total liabilities divided by the number of shares outstanding. NAV performance includes the deduction of management fees and other expenses. Market price performance does not include the deduction of expenses and would be lower had expenses been deducted. NAV and market price returns do not reflect broker sales charges or commissions, which would reduce returns.
†Source: MSCI for the MSCI Taiwan Index and TWSE for the TAIEX Total Return Index and the TAIEX Index. For a full description of each index please see the index descriptions section. It is not possible to invest directly in an index.
Returns for the TAIEX Index are not total returns and reflect only changes in the share price but do not assume that cash dividends, if any, were reinvested, and thus are not strictly comparable to the Funds returns.
The TAIEX Total Return Index commenced January 1, 2003. Past performance is no guarantee of future returns.
|
Sector
|
Company
(BGB ticker)
|
Price NT$
|
Holding
|
Value US$
|
% of
net assets
|
|
Semiconductor
|
|
|
|
|
17.6
|
|
Taiwan Semiconductor Manufacturing Co., Ltd.
|
2330 TT Equity
|
119.5
|
2626000
|
10465292
|
5.9
|
|
Novatek Microelectronics Corp. Ltd.
|
3034 TT Equity
|
153.5
|
1275000
|
6526905
|
3.7
|
|
Hermes Microvision Inc.
|
3658 TT Equity
|
1200.0
|
82000
|
3281586
|
1.8
|
|
King Yuan Electronics Co., Ltd.
|
2449 TT Equity
|
26.0
|
3400000
|
2948091
|
1.6
|
|
MPI Corp.
|
6223 TT Equity
|
94.0
|
937000
|
2937353
|
1.6
|
|
MediaTek, Inc.
|
2454 TT Equity
|
487.0
|
162000
|
2631072
|
1.5
|
|
RichTek Technology Corp.
|
6286 TT Equity
|
173.0
|
450000
|
2596255
|
1.5
|
|
|
|
|
|
|
|
|
Other Electronics
|
|
|
|
|
13.8
|
|
Hon Hai Precision Industry Co., Ltd.
|
2317 TT Equity
|
92.4
|
2491000
|
7675990
|
4.3
|
|
Aurora Corp., Inc.
|
2373 TT Equity
|
57.9
|
3569000
|
6891501
|
3.8
|
|
Elite Advanced Laser Corp.
|
3450 TT Equity
|
135.5
|
1084000
|
4898434
|
2.7
|
|
Catcher Technology Co., Ltd.
|
2474 TT Equity
|
268.0
|
398000
|
3557186
|
2.0
|
|
Acter Co., Ltd.
|
5536 TT Equity
|
104.5
|
522000
|
1819179
|
1.0
|
|
|
|
|
|
|
|
|
Electric Machinery
|
|
|
|
|
9.2
|
|
Hiwin Technologies Corp.
|
2049 TT Equity
|
308.0
|
373000
|
3831319
|
2.1
|
|
Yeong Guan Energy Technology Group Co., Ltd.
|
1589 TT Equity
|
144.0
|
565000
|
2713311
|
1.5
|
|
Good Friend International Holdings, Inc., TDR
|
912398 TT Equity
|
9.9
|
6990000
|
2303153
|
1.3
|
|
Basso Industry Corp.
|
1527 TT Equity
|
41.8
|
1550000
|
2160711
|
1.2
|
|
Cub Elecparts Inc.
|
2231 TT Equity
|
331.0
|
168000
|
1854497
|
1.1
|
|
Actron Technology Corp.
|
8255 TT Equity
|
135.0
|
408000
|
1836888
|
1.0
|
|
Airtac International Group
|
1590 TT Equity
|
326.0
|
160000
|
1739507
|
1.0
|
|
Depo Auto Parts Industrial Co., Ltd.
|
6605 TT Equity
|
132.0
|
1000
|
4402
|
0.0
|
|
|
|
|
|
|
|
|
Finance and Insurance
|
|
|
|
|
8.5
|
|
CTBC Financial Holding Co., Ltd.
|
2891 TT Equity
|
19.1
|
8500000
|
5414284
|
3.0
|
|
Cathay Financial Holding Co., Ltd.
|
2882 TT Equity
|
45.9
|
3340000
|
5112671
|
2.9
|
|
Fubon Financial Holding Co., Ltd.
|
2881 TT Equity
|
43.2
|
1992000
|
2866546
|
1.6
|
|
Yuanta Financial Holding Co., Ltd.
|
2885 TT Equity
|
15.7
|
3476000
|
1814190
|
1.0
|
|
|
|
|
|
|
|
|
Biotechnology and Medical Care
|
|
|
|
|
7.5
|
|
YungShin Global Holding Corp.
|
3705 TT Equity
|
67.8
|
3129000
|
7074959
|
3.9
|
|
Formosa Laboratories Inc.
|
4746 TT Equity
|
81.2
|
955000
|
2586117
|
1.4
|
|
Johnson Health Tech Co., Ltd.
|
1736 TT Equity
|
93.6
|
638000
|
1991522
|
1.1
|
|
Center Laboratories Inc.
|
4123 TT Equity
|
93.9
|
600000
|
1878908
|
1.1
|
continued on next page
The Taiwan Fund, Inc.
|
Sector
|
Company
(BGB ticker)
|
Price NT$
|
Holding
|
Value US$
|
% of net assets
|
|
Trading and Consumer Goods
|
|
|
|
|
4.9
|
|
Mercuries & Associates, Ltd.
|
2905 TT Equity
|
19.1
|
9912429
|
6297436
|
3.5
|
|
Test-Rite International Co., Ltd.
|
2908 TT Equity
|
21.7
|
3576260
|
2588079
|
1.4
|
|
|
|
|
|
|
|
|
Other
|
|
|
|
|
4.9
|
|
Kuo Toong International Co., Ltd.
|
8936 TT Equity
|
50.9
|
1488000
|
2525861
|
1.4
|
|
Nan Liu Enterprise Co., Ltd.
|
6504 TT Equity
|
168.0
|
409000
|
2291507
|
1.3
|
|
Feng TAY Enterprise Co., Ltd.
|
9910 TT Equity
|
85.4
|
780000
|
2221474
|
1.2
|
|
Nak Sealing Technologies Corp.
|
9942 TT Equity
|
142.0
|
378000
|
1790065
|
1.0
|
|
|
|
|
|
|
|
|
Optoelectronic
|
|
|
|
|
4.6
|
|
Largan Precision Co., Ltd.
|
3008 TT Equity
|
1960.0
|
86000
|
5621384
|
3.1
|
|
Epistar Corp.
|
2448 TT Equity
|
68.0
|
1204000
|
2730386
|
1.5
|
|
|
|
|
|
|
|
|
Computer and Peripheral Equipment
|
|
|
|
|
4.4
|
|
Advantech Co., Ltd.
|
2395 TT Equity
|
222.0
|
738100
|
5464581
|
3.1
|
|
Micro-Star International Co., Ltd.
|
2377 TT Equity
|
44.6
|
1546000
|
2299498
|
1.3
|
|
|
|
|
|
|
|
|
Electronic Products Distribution
|
|
|
|
|
4.2
|
|
WT Microelectronics Co., Ltd.
|
3036 TT Equity
|
44.0
|
5098900
|
7482003
|
4.2
|
|
|
|
|
|
|
|
|
Electronic Parts/Components
|
|
|
|
|
3.6
|
|
Delta Electronics Inc.
|
2308 TT Equity
|
195.0
|
592000
|
3849861
|
2.2
|
|
King Slide Works Co., Ltd.
|
2059 TT Equity
|
410.0
|
187000
|
2556902
|
1.4
|
|
|
|
|
|
|
|
|
Building Material and Construction
|
|
|
|
|
2.8
|
|
King's Town Construction Co., Ltd.
|
2524 TT Equity
|
24.9
|
3759764
|
3122113
|
1.8
|
|
Goldsun Development & Construction Co., Ltd.
|
2504 TT Equity
|
10.6
|
5141980
|
1809138
|
1.0
|
|
|
|
|
|
|
|
|
Plastic
|
|
|
|
|
2.5
|
|
Formosa Plastics Corp.
|
1301 TT Equity
|
76.7
|
1720000
|
4399593
|
2.5
|
|
|
|
|
|
|
|
|
Textile
|
|
|
|
|
1.7
|
|
Eclat Textile Co., Ltd.
|
1476 TT Equity
|
310.0
|
293000
|
3029131
|
1.7
|
|
|
|
|
|
|
|
|
Shipping and Transportation
|
|
|
|
|
1.1
|
|
Taiwan High Speed Rail Corp.
|
2633 TT Equity
|
4.7
|
12597600
|
1961975
|
1.1
|
|
Formosa Petrochemical Corp.
|
6505 TT Equity
|
73.3
|
782000
|
1911611
|
1.1
|
|
|
|
|
|
|
|
|
Chemical
|
|
|
|
|
0.7
|
|
Swancor Ind Co., Ltd.
|
4733 TT Equity
|
107.0
|
345000
|
1231095
|
0.7
|
|
|
|
|
|
|
|
|
Glass and Ceramic
|
|
|
|
|
0.6
|
|
Sanitar Co., Ltd.
|
1817 TT Equity
|
34.4
|
864000
|
991199
|
0.6
|
|
|
|
|
|
|
|
|
Information Services
|
|
|
|
|
0.5
|
|
Addcn Technology Co., Ltd.
|
5287 TT Equity
|
393.5
|
70000
|
918611
|
0.5
|
|
|
|
|
|
|
|
|
Rubber
|
|
|
|
|
0.4
|
|
Kenda Rubber Industrial Co., Ltd.
|
2106 TT Equity
|
68.8
|
333000
|
764049
|
0.4
|
The Taiwan Fund, Inc.
Index Descriptions
TAIEX Index
The TWSE, or TAIEX Index is a capitalization-weighted index of all listed common shares traded on the Taiwan Stock Exchange. The Index was based in 1966 and does not include re-invested dividends.
TAIEX Total Return Index
The TAIEX Total Return Index is a capitalization-weighted index of all listed common shares traded on the Taiwan Stock Exchange, based in 1966, which includes re-invested dividends.
MSCI Taiwan Index
The MSCI Total Return Taiwan Index is a free-float adjusted market capitalization index. The Index represents Taiwanese companies that are available to investors worldwide. The Index has a base date of December 31, 1987. As of November 30, 2013, it contained 107 constituents.
Important Information
This document is issued and approved by Allianz Global Investors U.S. LLC ("AllianzGI U.S."), as investment manager of The Taiwan Fund, Inc. (the 'Fund'). AllianzGI U.S. is an investment manager registered with the U.S. Securities and Exchange Commission. Information herein is believed to be reliable but has not been verified by AllianzGI U.S. AllianzGI U.S. makes no representation or warranty and does not accept any responsibility in relation to such information or for opinion or conclusion which the reader may draw from this newsletter.
The Fund is classified as a diversified investment company under the US Investment Company Act of 1940 as amended. It meets the criteria of a closed ended US fund and its shares are listed on the New York Stock Exchange. AllianzGI U.S. has been appointed investment manager to the Fund.
This newsletter does not constitute an offer of shares. Closed-end funds, unlike open-end funds, are not continuously offered. After the initial public offering, shares are bought and sold on the open market through a stock exchange. AllianzGI U.S., its ultimate and intermediate holding companies, subsidiaries, affiliates, clients, directors or staff may, at any time, have a position in the market referred to herein, and may buy or sell securities, currencies, or any other financial instruments in such markets. The information or opinion expressed in this newsletter should not be construed to be a recommendation to buy or sell any security, including the securities, commodities, currencies or financial instruments referred to herein.
Portfolio holdings are subject to change daily.
It should not be assumed that any of the securities transactions or holdings discussed here were or will prove to be profitable, or that the investment recommendations or decisions we make in the future will be profitable or will equal the investment performance of the securities discussed herein.
Investing in the Fund involves certain considerations in addition to the risks normally associated with making investments in securities. The value of the shares issued by the Fund, and the income from them, may go down as well as up and there can be no assurance that upon sale, or otherwise, investors will receive back the amount originally invested. There can be no assurance that you will receive comparable performance returns. Movements in foreign exchange rates may have a separate effect, unfavorable as well as favorable, on the gain or loss otherwise experienced on an investment. Past performance is not a guide to future returns. Accordingly, the Fund is only suitable for investment by investors who are able and willing to withstand the total loss of their investment. In particular, prospective investors should consider the following risks:
Discretionary investment is not risk-free. The past operating performance does not guarantee a minimum return for the discretionary investment fund. Apart from exercising the duty of care of a prudent adviser, Allianz Global Investors will not be responsible for the profit or loss of the discretionary investment fund, nor guarantee a minimum return.
|
■
|
It should be noted that investment in the Fund is only suitable for sophisticated investors who are aware of the risk of investing in Taiwan and should be regarded as long term. Funds which invest in one country carry a higher degree of risk than those with portfolios diversified across a number of markets.
|
|
■
|
Investment in the securities of smaller and unquoted companies can involve greater risk than is customarily associated with investment in larger, more established, companies. In particular, smaller companies often have limited product lines, markets or financial resources and their management may be dependent on a smaller number of key individuals. In addition, the market for stock in smaller companies is often less liquid than that for stock in larger companies, bringing with it potential difficulties in acquiring, valuing and disposing of such stock. Proper information for determining their value, or the risks to which they are exposed, may not be available.
|
|
■
|
Investments within emerging markets such as Taiwan can be of higher risk. Many emerging markets, and the companies quoted on their stock exchanges, are exposed to the risks of political, social and religious instability, expropriation of assets or nationalization, rapid rates of inflation, high interest rates, currency depreciation and fluctuations and changes in taxation which may affect the Fund's income and the value of its investments.
|
|
■
|
The marketability of quoted shares may be limited due to foreign investment restrictions, wide dealing spreads, exchange controls, foreign ownership restrictions, the restricted opening of stock exchanges and a narrow range of investors. Trading volume may be lower than on more developed stockmarkets, and equities are less liquid. Volatility of prices can also be greater than in more developed stockmarkets. The infrastructure for clearing, settlement and registration on the primary and secondary markets may be undeveloped. Under certain circumstances, there may be delays in settling transactions in some of the markets.
|
The Taiwan Fund, Inc., c/o State Street Bank and Trust Company, 1 Lincoln Street, P.O. Box 5049, Boston, MA, 02206. www.thetaiwanfund.com
|
Investment Products: Not FDIC Insured | May Lose Value | Not Bank Guaranteed
|
AGI-2014-06-09-9865 | FS-TWF-0514
|