Attached files
| file | filename |
|---|---|
| 8-K - FORM 8-K - PUBLIC SERVICE ENTERPRISE GROUP INC | d745283d8k.htm |
 2
Forward-Looking Statement
The forward-looking statements contained in this report are intended to
qualify for the safe harbor provisions of Section 27A of the Securities Act of 1933, as amended, and Section 21E
of the Securities Exchange Act of 1934, as amended.
All of the forward-looking statements made in this report are qualified by
these cautionary statements and we cannot assure you that the results or developments anticipated by
management will be realized or even if realized, will have the expected
consequences to, or effects on, us or our business prospects, financial condition or results of operations. Readers
are cautioned not to place undue reliance on these forward-looking
statements in making any investment decision. Forward-looking statements made in this report apply only as of the
date of this report. While we may elect to update forward-looking
statements from time to time, we specifically disclaim any obligation to do so, even if internal estimates change, unless
otherwise required by applicable securities laws.
adverse changes in the demand for or the price of the capacity and energy that
we sell into wholesale electricity markets,
adverse changes in energy industry law, policies and regulation, including
market structures and a potential shift away from competitive markets toward subsidized market
mechanisms, transmission planning and cost allocation rules, including rules
regarding how transmission is planned and who is permitted to build transmission in the future,
and reliability standards,
changes in nuclear regulation and/or general developments in the nuclear power
industry, including various impacts from any accidents or incidents experienced at our
facilities or by others in the industry, that could limit operations of our
nuclear generating units, actions or activities at one of our nuclear units located on a multi-unit
site that might adversely affect our ability to continue to operate that unit or other units located at the
same site,
any inability to balance our energy obligations, available supply and risks,
any deterioration in our credit quality or the credit quality of our
counterparties,
any inability to achieve, or continue to sustain, our expected levels of
operating performance, any equipment failures, accidents, severe weather events or other incidents
that impact our ability to provide safe and reliable service to our customers, and any inability to
obtain sufficient coverage or recover proceeds of insurance with respect to
such events, increases in competition in energy supply markets as well as competition for
certain transmission projects, any inability of our transmission and distribution businesses to obtain
adequate and timely rate relief and regulatory approvals from federal and state regulators,
changes in federal and state environmental regulations and enforcement that
could increase our costs or limit our operations, availability of capital and credit at commercially reasonable terms and
conditions and our ability to meet cash needs,
changes in the cost of, or interruption in the supply of, fuel and other
commodities necessary to the operation of our generating units,
delays in receipt of necessary permits and approvals for our construction and
development activities,
delays or unforeseen cost escalations in our construction and development
activities,
acts of terrorism, cybersecurity attacks or intrusions that could adversely
impact our businesses,
any inability to realize anticipated tax benefits or retain tax credits,
challenges associated with recruitment and/or retention of a qualified
workforce,
adverse performance of our decommissioning and defined benefit plan trust fund
investments and changes in funding requirements, and
changes in technology, such as distributed generation and micro grids, and
greater reliance on these technologies and changes in customer behaviors, including energy
efficiency,net-metering and demand response.
Certain of the matters discussed in this report about our and our subsidiaries'
future performance, including, without limitation, future revenues, earnings, strategies, prospects, consequences and all
other statements that are not purely historical constitute
“forward-looking statements” within the meaning of the Private Securities Litigation Reform Act of 1995. Such forward-looking statements are
subject to risks and uncertainties, which could cause actual results to differ
materially from those anticipated. Such statements are based on management's beliefs as well as assumptions made by
and information currently available to management. When used herein, the words
“anticipate,” “intend,” “estimate,” “believe,” “expect,” “plan,” “should,” “hypothetical,” “potential,” “forecast,”
“project,” variations of such words and similar expressions are
intended to identify forward-looking statements. Factors that may cause actual results to differ are often presented with the forward-
looking statements themselves. Other factors that could cause actual results to
differ materially from those contemplated in any forward-looking statements made by us herein are discussed in filings
we make with the United States Securities and Exchange Commission (SEC),
including our Annual Report on Form 10-K and subsequent reports on Form 10-Q and Form 8-K and available on our
website: http://www.pseg.com. These factors include, but are not limited to: EXHIBIT 99 |
 GAAP Disclaimer
PSEG presents Operating Earnings in addition to its Income from Continuing
Operations/Net Income reported in accordance with accounting principles
generally accepted in the United States (GAAP). Operating Earnings is a
non- GAAP financial measure that differs from Income from Continuing
Operations/Net Income because it excludes gains or losses associated
with Nuclear Decommissioning Trust (NDT), Mark-to-Market (MTM)
accounting, and other material one-time items. PSEG presents
Operating Earnings because management believes that it is appropriate
for investors to consider results excluding these items in addition to
the results reported in accordance with GAAP. PSEG believes that the
non-GAAP financial measure of Operating Earnings provides a
consistent and comparable measure of performance of its businesses to
help shareholders understand performance trends. This information is
not intended to be viewed as an alternative to GAAP information.
Slides A and B at the end of this presentation include a list of
items excluded
from Income from Continuing Operations/Net Income to reconcile to Operating
Earnings, with a reference to that slide included on each of the
slides where the
non-GAAP information appears.
These
materials
and
other
financial
releases
can
be
found
on
the
pseg.com
website under the investor tab, or at http://investor.pseg.com/
3 |
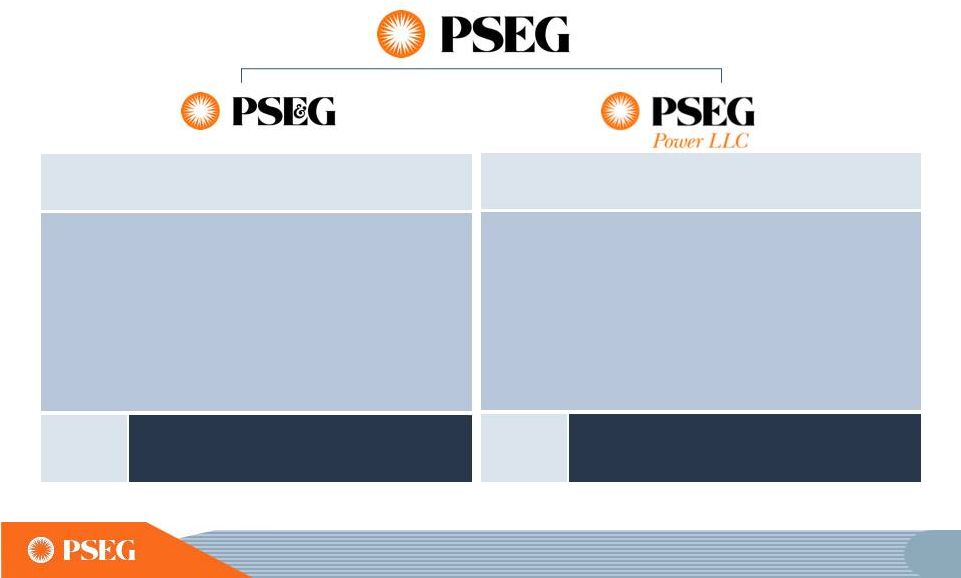 Two complementary businesses
Strong asset platform, performing well and positioned for the future
Strategy:
Fuel
diverse
fleet
is
geographically
and environmentally well positioned, with
investments to enhance competitiveness
Value
Proposition:
Provides
substantial
free cash flow in current environment
and poised for price recovery
Assets $12B
Operating Earnings $710M
Regional Competitive Generation
Strategy:
Positioned
to
meet
customers’
needs as we respond to state and federal
energy policy and economic growth objectives
Value
Proposition:
An
$11.3
billion
infrastructure
program
–
focused
on
transmission
–
that
is
expected
to
produce
double-digit rate base growth through 2016
Assets $20B
Operating Earnings $612M
Electric & Gas Delivery
and Transmission
2013
2013
6
ASSETS AND OPERATING EARNINGS ARE FOR THE YEAR ENDED 12/31/2013.
PSE&G AND POWER DO NOT ADD TO TOTAL DUE TO PARENT, PSEG LONG ISLAND AND
ENERGY HOLDINGS ACTIVITY. SEE SLIDE A FOR ITEMS EXCLUDED FROM INCOME
FROM CONTINUING OPERATIONS/NET INCOME TO RECONCILE TO OPERATING
EARNINGS. |
 Delivering on commitments and pursuing
opportunities for growth
Operational
Excellence
•
Power: Record 2013 output at Linden CCGT and Salem 2;
nuclear capacity factor greater than 90% for
straight
year
•
PSE&G: Mid-Atlantic Reliability Award
(12
th
consecutive
year)
•
PSEG Long Island: Went “live”
on January 1, 2014
•
PSEG: Cost-control benefits continue
Financial
Strength
•
Strong cash flows supported credit rating increases
•
Pension more than fully funded
•
Dividend increased
Disciplined
Investment
•
PSE&G
Transmission capital program execution and growth
Energy Strong infrastructure program
underway
Solar 4 All Extension and Solar Loan III programs
•
Power: Investments to enhance the fleet’s competitiveness
– 130 MW Nuclear uprate, 150 MW CCGT uprate and efficiency
improvement
7
9
th |
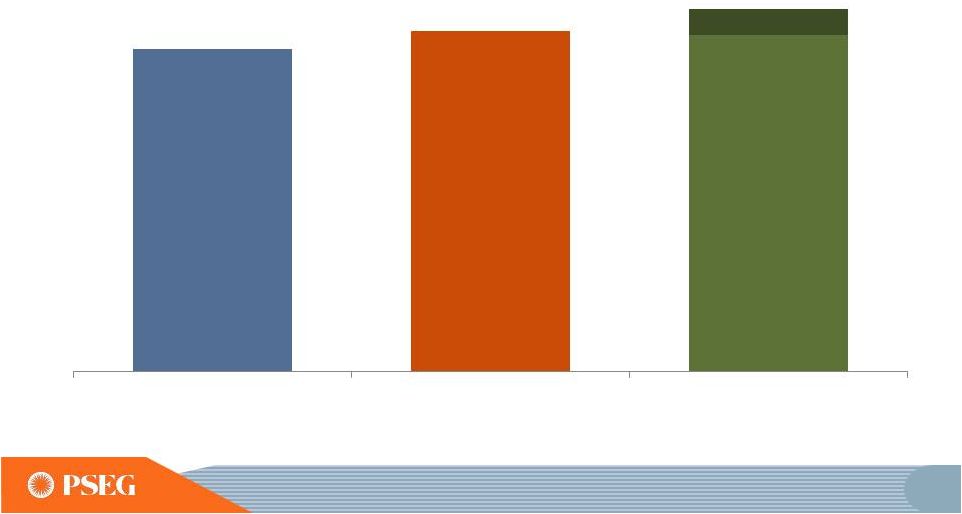 8
Maintaining PSEG 2014 Operating Earnings
Guidance
SEE SLIDE A FOR ITEMS EXCLUDED FROM INCOME FROM CONTINUING
OPERATIONS/NET INCOME TO RECONCILE TO OPERATING
EARNINGS. $2.44
$2.58
$2.55
-
$2.75E
Reflects increased level of utility investment, pension savings and assumes
normal weather and unit operations for the rest of year
2012
2013
2014 Guidance
E = ESTIMATE. |
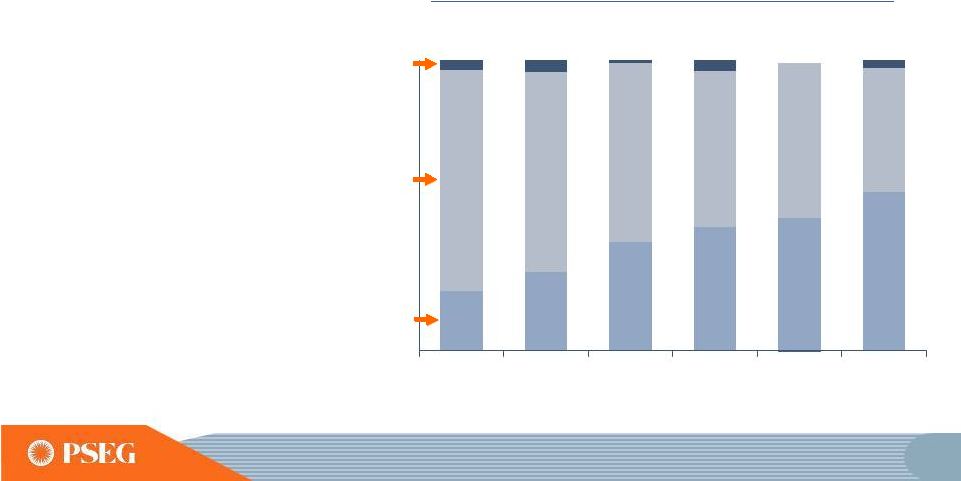 Operating Earnings Mix
Long term investment program has driven increased earnings
contribution from stable, regulated business
*SEE SLIDE A FOR ITEMS EXCLUDED FROM INCOME FROM
CONTINUING OPERATIONS/ NET INCOME TO RECONCILE TO OPERATING EARNINGS;
DISCONTINUED OPERATIONS REFLECT TEXAS. E=ESTIMATE ** 2014
PERCENTS USE MIDPOINT OF EARNINGS GUIDANCE. Power’s
diverse
fuel
mix
and dispatch flexibility
continues to generate
earnings and free cash flow
PSE&G’s
investment
in
transmission has
diversified its asset base
and, coupled with other
investments
and cost controls,
supported compound
annual earnings growth of
~18% over 2009 –
2013
Operating Earnings* Contribution by Subsidiary (%)
PSE&G
Power
Other
$2.44
$2.58
$2.55 -
$2.75E
$3.12
$2.74
$3.09
2009
2010
2011
2012
2013
2014E**
9
20%
27%
38%
43%
47%
54%
76%
69%
62%
54%
54%
43% |
 Energy Strong Agreement reached with all parties
Agreement recognizes the benefits of system investments that prevent or
shorten outages
Supports $1.22 billion capital program over several years on reasonable terms:
$1 billion recovered through accelerated, rate recovery mechanism
-
$820 million Electric
-
$400 million Gas
Allows PSE&G to earn a 9.75% ROE on the $1 billion recovered on
accelerated basis Requires PSE&G to file a base rate case by
November 2017 Approved by the NJBPU in May 2014
Over 100 New Jersey municipalities supported Energy Strong
Energy Strong agreement clears path for PSE&G to begin the initial phase of
this robust capital program
Energy Strong Agreement
benefits of system investments
recognizes
12 |
 PSEG Q1 2014 Financial Highlights
Operating earnings of $1.01 vs. $0.85 per share in Q1 2013 Power benefited from higher market pricing, market volatility and
increased output
Increased contribution to earnings from PSE&G’s investment in
transmission
Focused on maintaining operating efficiency and customer reliability PSE&G expected to grow at double-digit rate in 2014 and provide
over 50% of operating earnings
Positive cash from Power and increasing cash flow from PSE&G supports
dividend growth and funds capital spending program without the need to
issue equity
Increased common dividend to indicative annual rate of $1.48 per share in Q1
2014
Debt as a percentage of capital was 41% at March 31, 2014
Financial position remains strong
Executing existing 5-year, $6.8 billion transmission capital spending program
on budget and on schedule
Maintaining 2014 operating earnings guidance of $2.55 - $2.75 per
share
Power recognized a liability in the quarter related to its discovery that it
incorrectly calculated certain components of its cost-based bids for
certain generating units in the PJM energy market, with resulting over-collection of revenues
related to its fossil fleet. Power has notified FERC, PJM and the PJM Independent
Market Monitor of this issue, which is still under review; we are unable
to estimate the ultimate impact or predict any resulting penalties or other costs
associated with the matter at this time Agreement on PSE&G’s Energy Strong infrastructure program to invest
$1.22 billion over 2014 – 2018, awaiting final NJBPU approval Strong Q1 Earnings
17 |
 Energy Strong Agreement supports
customers’
needs in the aftermath of Superstorm Sandy
•
Settled with NJBPU Staff and all other parties in May 2014
for $1.22 billion; approved by the NJBPU in May 2014
•
Program addresses system resiliency and hardening by:
$620 million to raise, relocate or protect 29 switching and substations
that were damaged by water in recent storms
$350 million to replace and modernize 250 miles of low-pressure, cast
iron gas mains in or near flood areas
$100 million to create redundancy in the electric system, reducing
outages when damage occurs
$100 million to deploy smart grid technologies to better monitor
system
operations to increase our ability to more swiftly deploy repair
teams
$50 million to protect five natural gas metering stations and a liquefied
natural gas station affected by Sandy or located in flood zones
28 |
 PSE&G’s 2014 operating earnings
to benefit from increased investment in transmission and
on-going cost control
E=ESTIMATE
*SEE
SLIDE
A
FOR
ITEMS
EXCLUDED
FROM
INCOME
FROM
CONTINUING
OPERATIONS/NET INCOME TO RECONCILE TO OPERATING EARNINGS.
PSE&G Operating Earnings*
($ Millions)
43 |
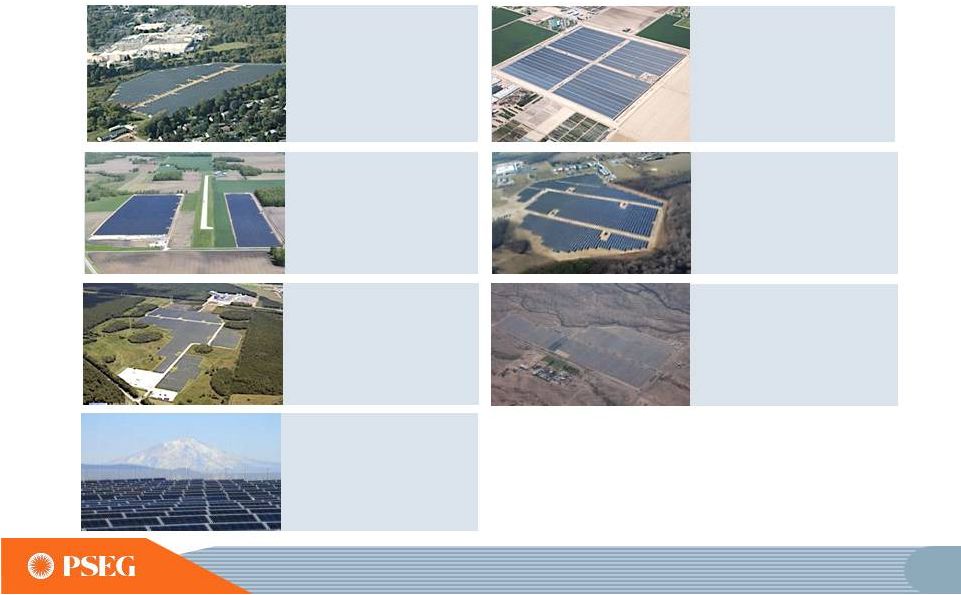 Hackettstown (Mars)
New Jersey (2 MW)
COD September 2009
Thin film panels –
fixed tilt
Investment $13 million
15 year PPA with Mars, Inc.
Wyandot
Ohio (12 MW)
COD May 2010
Thin film panels –
fixed tilt
Investment $45 million
20 year PPA with AEP
JEA
Florida (15 MW)
COD September 2010
Thin film panels –
fixed tilt
Investment $59 million
30 year PPA with JEA
Queen Creek
Arizona (25 MW)
COD October 2012
Polycrystalline -
single axis
tracker
Investment $79 million
20 year PPA with SRP
Milford
Delaware (15 MW)
COD December 2012
Polycrystalline -
fixed tilt
Investment $49 million
20 year PPA with DEMEC
Badger I
Arizona (19 MW)
COD November 2013
Polycrystalline -
single axis
tracker
Investment $50 million
30 year PPA with APS
•
Continue to seek high quality projects with
creditworthy off-takers.
•
Solar portfolio delivers strong EBITDA post-
construction period.
PSEG Solar Source owns 92 MW of
operating solar facilities
Shasta A & B
California (4 MW)
COD March 2014
Polycrystalline -
single axis
tracker
Investment $13 million
20 year PPAs with PG&E
66 |
 Improving Operating Earnings
and increased contribution from PSE&G
PSEG Operating Earnings
$ Millions (except EPS)
2012
2013
2014E
PSE&G
$528
$612
$705 -
$745
PSEG Power
$663
$710
$550 -
$610
Other
$45
($13)
$35 -
$40
Operating Earnings*
$1,236
$1,309
$1,290 -
$1,395
Operating EPS*
$2.44
$2.58
$2.55
-
$2.75
Regulated % of Earnings
43%
47%
53%
-
55%
*
SEE SLIDE A FOR ITEMS EXCLUDED FROM INCOME FROM CONTINUING OPERATIONS/NET
INCOME TO RECONCILE TO OPERATING EARNINGS.
NOTE: 2012 OPERATING EARNINGS RE-STATED FOR TRANSFER OF ASSETS FROM PSEG
HOLDINGS TO PSEG POWER. E=ESTIMATE.
98 |
 Items Excluded from Income from Continuing
Operations/Net Income to Reconcile to Operating Earnings
PLEASE SEE PAGE 3 FOR AN EXPLANATION OF PSEG’S USE OF OPERATING EARNINGS
AS A NON-GAAP FINANCIAL MEASURE AND HOW IT DIFFERS FROM NET
INCOME. (a)
Includes the financial impact from positions with forward delivery
months. A
2013
2012
2011
2010
2009
2008
Earnings
Impact
($
Millions)
Operating Earnings
1,309
$
1,236
$
1,389
$
1,584
$
1,567
$
1,478
$
Gain (Loss) on Nuclear Decommissioning Trust (NDT)
Fund Related Activity (PSEG Power)
40
52
50
46
9
(71)
Gain
(Loss)
on
Mark-to-Market
(MTM)
(a)
(PSEG Power)
(74)
(10)
107
(1)
(11)
14
Lease Transaction Activity (PSEG Enterprise/Other)
-
36
(173)
-
29
(490)
Storm O&M (PSEG Power)
(32)
(39)
-
-
-
-
Market Transition Charge Refund (PSE&G)
-
-
-
(72)
-
-
Gain (Loss) on Asset Sales and Impairments (PSEG Enterprise/Other)
-
-
34
-
-
(13)
Income from Continuing Operations
1,243
$
1,275
$
1,407
$
1,557
$
1,594
$
918
$
Discontinued Operations
-
-
96
7
(2)
270
Net Income
1,243
$
1,275
$
1,503
$
1,564
$
1,592
$
1,188
$
Fully Diluted Average Shares Outstanding (in Millions)
508
507
507
507
507
508
Per
Share
Impact
(Diluted)
Operating Earnings
2.58
$
2.44
$
2.74
$
3.12
$
3.09
$
2.91
$
Gain (Loss) on NDT Fund Related Activity (PSEG Power)
0.08
0.10
0.10
0.09
0.02
(0.14)
Gain
(Loss)
on
MTM
(a)
(PSEG Power)
(0.14)
(0.02)
0.21
-
(0.02)
0.03
Lease Transaction Activity (PSEG Enterprise/Other)
-
0.07
(0.34)
-
0.05
(0.96)
Storm O&M (PSEG Power)
(0.07)
(0.08)
-
-
-
-
Market Transition Charge Refund (PSE&G)
-
-
-
(0.14)
-
-
Gain (Loss) on Asset Sales and Impairments (PSEG Enterprise/Other)
-
-
0.06
-
-
(0.03)
Income from Continuing Operations
2.45
$
2.51
$
2.77
$
3.07
$
3.14
$
1.81
$
Discontinued Operations
-
-
0.19
0.01
-
0.53
Net Income
2.45
$
2.51
$
2.96
$
3.08
$
3.14
$
2.34
$
For the Year Ended
December 31,
(Unaudited)
PUBLIC SERVICE ENTERPRISE GROUP INCORPORATED
Reconciling Items, net of tax |
 Items Excluded from Net Income to Reconcile to Operating Earnings
PLEASE SEE PAGE 3 FOR AN EXPLANATION OF PSEG’S USE OF OPERATING EARNINGS
AS A NON-GAAP FINANCIAL MEASURE AND HOW IT DIFFERS FROM NET
INCOME. Attachment 10
2014
2013
2013
2012
Earnings Impact ($ Millions)
Operating Earnings
515
$
433
$
1,309
$
1,236
$
Gain (Loss) on Nuclear Decommissioning Trust (NDT)
Fund Related Activity (PSEG Power)
9
9
40
52
Gain (Loss) on Mark-to-Market (MTM)
(a)
(PSEG Power)
(132)
(105)
(74)
(10)
Lease Related Activity (PSEG Enterprise/Other)
-
-
-
36
Storm O&M, net of insurance recoveries (PSEG Power)
(6)
(17)
(32)
(39)
Net Income
386
$
320
$
1,243
$
1,275
$
Fully Diluted Average Shares Outstanding (in Millions)
508
507
508
507
Per Share Impact (Diluted)
Operating Earnings
1.01
$
0.85
$
2.58
$
2.44
$
Gain (Loss) on NDT Fund Related Activity (PSEG Power)
0.02
0.02
0.08
0.10
Gain (Loss) on MTM
(a)
(PSEG Power)
(0.26)
(0.21)
(0.14)
(0.02)
Lease Related Activity (PSEG Enterprise/Other)
-
-
-
0.07
Storm O&M, net of insurance recoveries (PSEG Power)
(0.01)
(0.03)
(0.07)
(0.08)
Net Income
0.76
$
0.63
$
2.45
$
2.51
$
(a) Includes the financial impact from positions with forward delivery
months. PUBLIC SERVICE ENTERPRISE GROUP INCORPORATED
Reconciling Items, net of tax
Three Months Ended
Year Ended
March 31,
December 31,
(Unaudited)
B |