Attached files
| file | filename |
|---|---|
| 8-K - 8-K - NTELOS HOLDINGS CORP. | d744512d8k.htm |
 NASDAQ: NTLS
Investor Presentation
June 2014
Exhibit 99.1 |
 Presentation
of
Financial
and
Other
Important
Information
USE OF NON-GAAP FINANCIAL MEASURES
Included
in
this
presentation
are
certain
non-GAAP
financial
measures
that
are
not
determined
in
accordance
with
US
generally
accepted
accounting
principles
(“GAAP”).
These
financial
performance
measures
are
not
indicative
of
cash
provided
or
used
by
operating
activities
and
exclude
the
effects
of
certain
operating,
capital
and
financing
costs
and
may
differ
from
comparable
information
provided
by
other
companies,
and
they
should
not
be
considered
in
isolation,
as
an
alternative
to,
or
more
meaningful
than
measures
of
financial
performance
determined
in
accordance
with
US
generally
accepted
accounting
principles.
These
financial
performance
measures
are
commonly
used
in
the
industry
and
are
presented
because
NTELOS
believes
they
provide
relevant
and
useful
information
to
investors.
NTELOS
utilizes
these
financial
performance
measures
to
assess
its
ability
to
meet
future
capital
expenditure
and
working
capital
requirements,
to
incur
indebtedness
if
necessary,
and
to
fund
continued
growth.
NTELOS
also
uses
these
financial
performance
measures
to
evaluate
the
performance
of
its
business,
for
budget
planning
purposes
and
as
factors
in
its
employee
compensation
programs.
Adjusted
EBITDA
is
defined
as
net
income
attributable
to
NTELOS
Holdings
Corp.
before
interest,
income
taxes,
depreciation
and
amortization,
accretion
of
asset
retirement
obligations,
deferred
SNA
revenue,
gain/loss
on
derivatives,
net
income
attributable
to
non-controlling
interests,
other
expenses/income,
equity
based
compensation
charges,
business
separation
charges,
gain/loss
on
sale
of
assets,
secondary
offering
costs
and
net
loss
from
discontinued
operations
and
costs
related
to
the
separation
of
the
wireless
and
wireline
companies.
SPECIAL
NOTE
REGARDING
FORWARD-LOOKING
STATEMENTS
Any
statements
contained
in
this
presentation
that
are
not
statements
of
historical
fact,
including
statements
about
our
beliefs
and
expectations,
are
forward-looking
statements
and
should
be
evaluated
as
such.
The
words
“anticipates,”
“believes,”
“expects,”
“intends,”
“plans,”
“estimates,”
“targets,”
“projects,”
“should,”
“may,”
“will”
and
similar
words
and
expressions
are
intended
to
identify
forward-looking
statements.
Such
forward-looking
statements
reflect,
among
other
things,
our
current
expectations,
plans
and
strategies,
and
anticipated
financial
results,
all
of
which
are
subject
to
known
and
unknown
risks,
uncertainties
and
factors
that
may
cause
our
actual
results
to
differ
materially
from
those
expressed
or
implied
by
these
forward-looking
statements.
Many
of
these
risks
are
beyond
our
ability
to
control
or
predict.
Because
of
these
risks,
uncertainties
and
assumptions,
you
should
not
place
undue
reliance
on
these
forward-looking
statements.
Furthermore,
forward-looking
statements
speak
only
as
of
the
date
they
are
made.
We
do
not
undertake
any
obligation
to
update
or
review
any
forward-looking
information,
whether
as
a
result
of
new
information,
future
events
or
otherwise.
Important
factors
with
respect
to
any
such
forward-looking
statements,
including
certain
risks
and
uncertainties
that
could
cause
actual
results
to
differ
from
those
contained
in
the
forward-looking
statements,
include,
but
are
not
limited
to:
our
ability
to
attract
and
retain
retail
subscribers
to
our
services;
our
dependence
on
our
strategic
relationship
with
Sprint
Corporation
(“Sprint”);
a
potential
increase
in
roaming
rates
and
wireless
handset
subsidy
costs;
rapid
development
and
intense
competition
in
the
telecommunications
industry;
our
ability
to
finance,
design,
construct
and
realize
the
benefits
of
any
planned
network
technology
upgrade;
our
ability
to
acquire
or
gain
access
to
additional
spectrum;
the
potential
to
experience
a
high
rate
of
customer
turnover;
the
potential
for
competitors
to
build
networks
in
our
markets;
cash
and
capital
requirements;
operating
and
financial
restrictions
imposed
by
our
credit
agreement;
adverse
economic
conditions;
federal
and
state
regulatory
fees,
requirements
and
developments;
loss
of
ability
to
use
our
current
cell
sites;
our
continued
reliance
on
indirect
channels
of
retail
distribution;
our
reliance
on
certain
suppliers
and
vendors;
and
other
unforeseen
difficulties
that
may
occur.
These
risks
and
uncertainties
are
not
intended
to
represent
a
complete
list
of
all
risks
and
uncertainties
inherent
in
our
business,
and
should
be
read
in
conjunction
with
the
more
detailed
cautionary
statements
and
risk
factors
included
in
our
SEC
filings,
including
our
most
recent
Annual
Report
filed
on
Form
10-K.
2 |
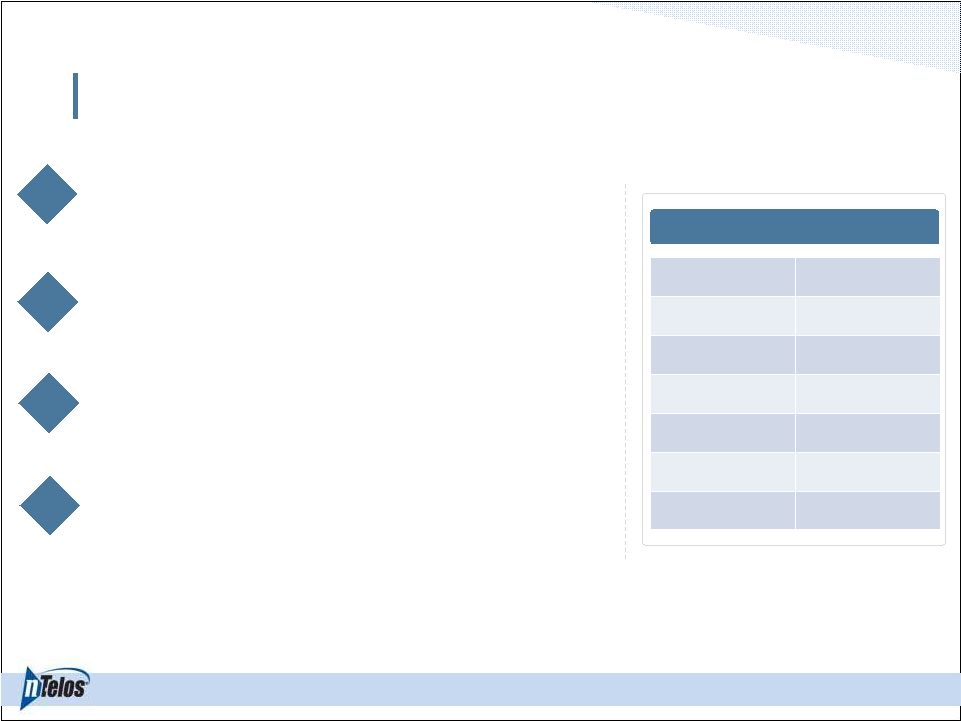 Leading “pure-play”
publicly traded regional wireless carrier
8.0
million
operational
market
POPs
;
6.0
million
covered
POPs;
468,000 subscribers
Exclusive wholesale network provider for Sprint in WV and
Western Va. through 2022
Branded retail business and wholesale business with significant
recurring revenue
Company Overview
3
About nTelos
Headquarters
Waynesboro,
Va.
Ticker
NTLS
Exchange
NASDAQ
Price
$12.81
Market Cap
$278 million
Shares
21.7 million
52 Week Range
$11.20 –
$23.03
1
9.0 million licensed POPs
As of June 9, 2014
1 |
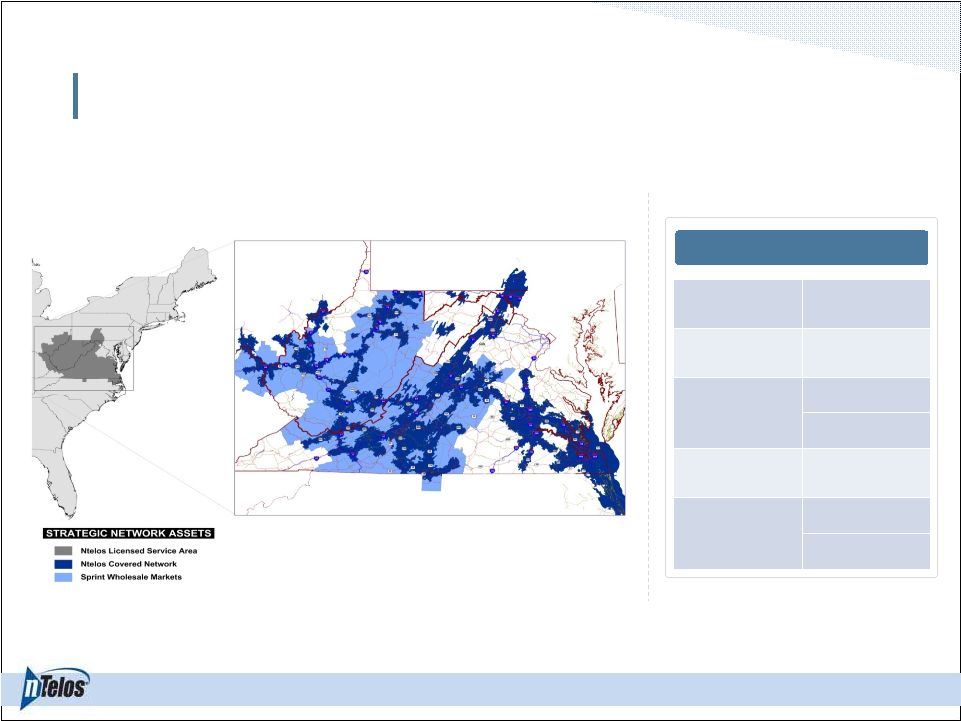 4
nTelos Network
Operational Footprint
Operational
POPs
8.0 million
Covered
POPs
6.0 million
MHz POPs
nTelos: 186.9M PCS
62.4M 2.5 GHz
Sprint: 69.4M PCS
20.3M 800 MHz
Total Cell
Sites
1,444
Spectrum
nTelos: AWS / PCS /
2.5 GHz
Sprint: 800 MHz /
PCS / 2.5 GHz |
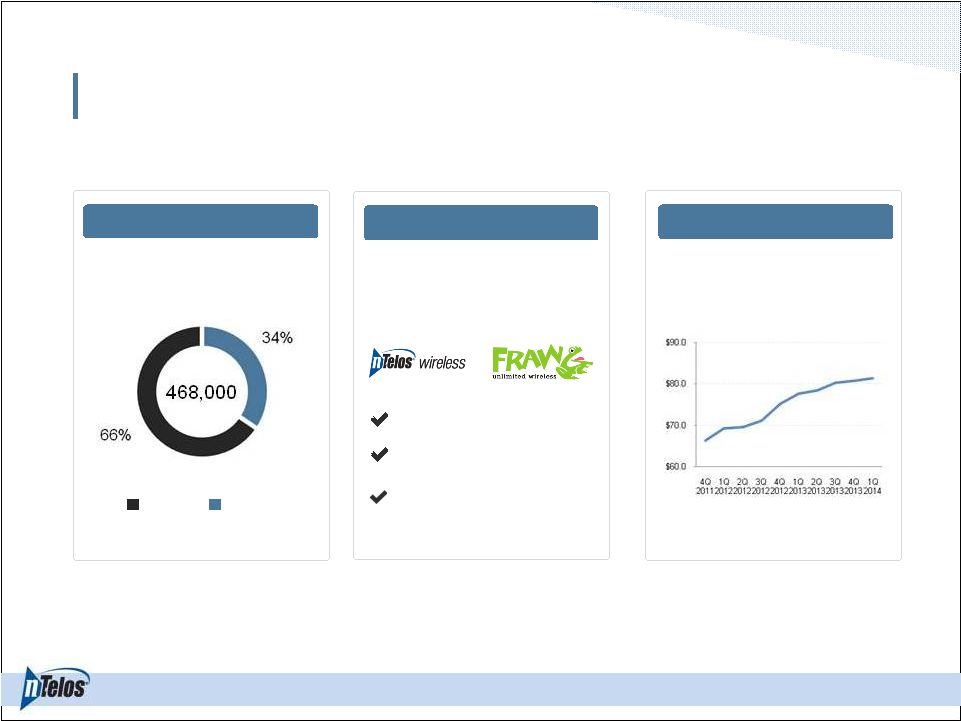 5
Retail
Subscriber Base
Prepay
Retail
subscriber
base
comprised
of
two-thirds
postpay,
one-third
prepay
Postpay
Revenue
Retail
revenues
of
$81.4
million
in
1Q
14,
or
67%
of
total
revenues
Platform
130 branded retail locations
705 total points of distribution
Robust retail lineup including
iPhone, Samsung Galaxy, and
Moto X
nTelos
operates
the
postpay
business
under
NTELOS
brand
and
prepay
under
the
FRAWG
brand |
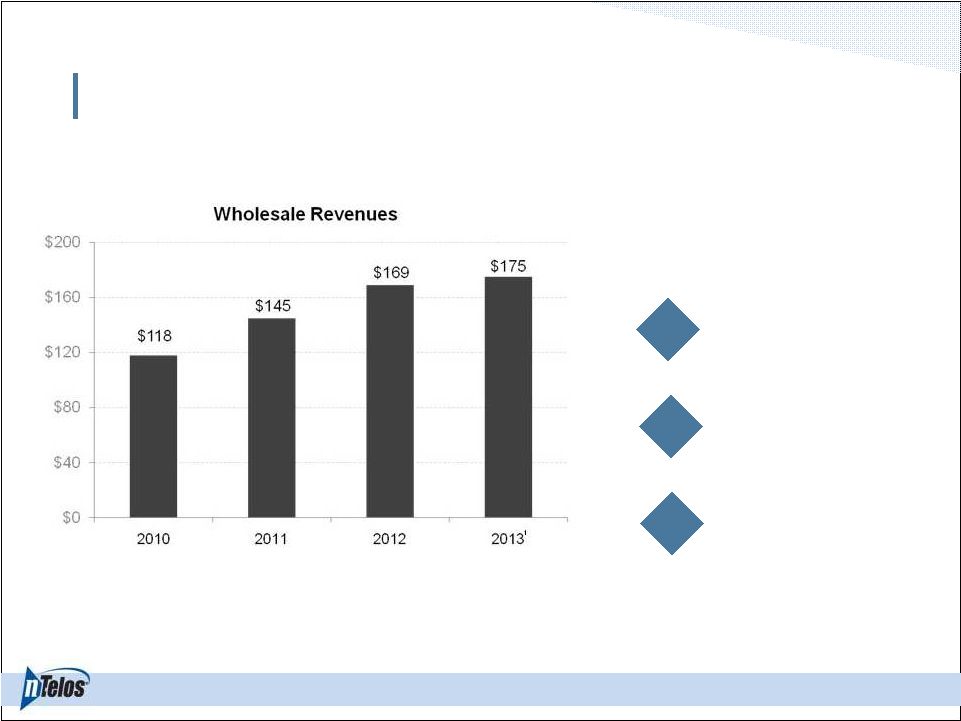 6
Wholesale
nTelos
provides
wholesale
services
to
other
wireless
carriers.
The
primary
source
of
wholesale
revenues
comes
from
the
Strategic
Network
Alliance
(SNA)
with
Sprint.
Wholesale Business
SNA covers 2.1 mm
covered POPs in West
Virginia and western
Virginia; 853
cell sites
SNA revenue accounted
for 97%
of wholesale
revenues in 1Q14
Wholesale and other
revenue accounted for
34%
of total revenues in
1Q14
1
Includes $9.0 million from September 2013 SNA Settlement with Sprint
|
 Unique retail / wholesale business model
One
of
the
few
remaining
“pure-play”
regional
wireless
carriers
Value Drivers
7
Strategic
set
of
assets
–
network,
spectrum
portfolio,
retail
subscriber
base,
rural
and
top
40
US
wireless markets
Actively investing in network and strategy to drive next phase of growth
Long
term
strategic
relationship
with
Sprint
–
provides
platform
for
stability,
growth
and
increased optionality |
 Expand wholesale relationships
Partnerships
Investments –
Strategic Assets
Executing on wholesale / retail strategy
NTELOS Strategy –
Catalyst for Growth
8
Long term value creation and
cash flow generation
Improved strategic optionality
for all stakeholders
Sprint extension and expansion
Further collaboration with Sprint
DISH
Other opportunities
Improve retail margins to create value
Market and revenue share growth
Greater efficiencies
Focus on customer experience
Network
Devices
Differentiated value proposition
Sprint
Dish
Owned Spectrum
4G LTE Network
Recurring revenue
468,000 subscribers
1
2 |
 Expand wholesale relationships
Partnerships
Investments –
Strategic Assets
Executing on wholesale / retail strategy
NTELOS Strategy –
Catalyst for Growth
9
Long term value creation and
cash flow generation
Sprint extension and expansion
Further collaboration with Sprint
DISH
Other opportunities
Improve retail margins to create value
Market and revenue share growth
Greater efficiencies
Focus on customer experience
Network
Devices
Differentiated value proposition
Sprint
Dish
Owned Spectrum
4G LTE Network
Recurring revenue
468,000 subscribers
1
2
Improved strategic optionality
for all stakeholders |
 Retail Subscriber Growth
10
Addition of iconic device
Wholesale uncertainty
Platform for retail growth
Brand and retail revitalization
Source: UBS (US Wireless 411, May 20, 2014)
nTelos is the only regional wireless carrier to grow subscriber base since end of
2011 Retail acceleration |
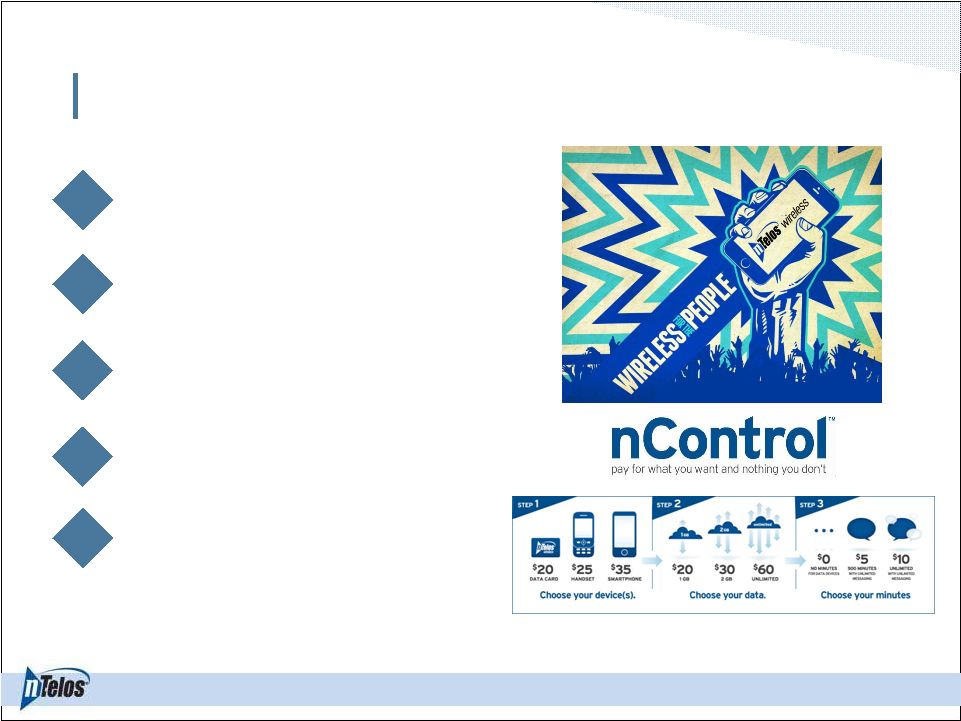 Retail Growth Drivers Going Forward
nControl
4G LTE service expansion
Device financing program (EIP)
Competitive handset lineup
Savings, Simplicity and Service
11 |
 Partnerships
Investments –
Strategic Assets
Executing on wholesale / retail strategy
NTELOS Strategy –
Catalyst for Growth
12
Long term value creation and
cash flow generation
Improve retail margins to create value
Market and revenue share growth
Greater efficiencies
Focus on customer experience
Network
Devices
Differentiated value proposition
Sprint
Dish
Owned Spectrum
4G LTE Network
Recurring revenue
468,000 subscribers
1
2
Improved strategic optionality
for all stakeholders
Expand wholesale relationships
Sprint extension and expansion
Further collaboration with Sprint
DISH
Other opportunities |
 Sprint Agreement –
Platform For Growth
13
Terms
Previous SNA
Amended SNA (May 22, 2014)
Expiration
July 31, 2015
December 31, 2022
Coverage Area
•
2.1 mm covered POPs in West Virginia and western
Virginia
•
853 cell sites
•
36,800 square miles
•
2.1 mm covered POPs in West Virginia and western
Virginia
•
853 cell sites
•
36,800 square miles
Network
2G/3G
2G/3G/4G LTE / future feature upgrades
Spectrum
1.9 PCS (nTelos)
800/1.9/2.5 (nTelos & Sprint)
Anticipated 4G LTE
Buildout Timeline
N/A
Expect to be completed no later than May 2017
Nationwide Roaming
2G/3G
2G/3G/4G LTE
Exclusivity
•
Exclusive wholesale provider in SNA territory
•
Can sign wholesale agreements with other carriers
•
Exclusive wholesale provider in SNA territory
•
Can sign wholesale agreements with other carriers
Equipment Vendor
Relationships
None
Leverage Sprint’s device and equipment relationships
Incremental
Investment
Agreed to build 3G EVDO network
Agreed
to
build
4G
LTE
network
($150mm
-
$175mm) |
 Offers
nTelos
and
Sprint
customers
most
robust
LTE
experience
in
SNA
territory
Solidifies Sprint relationship for nine years and allows for additional
collaboration Extended Agreement –
Beneficial Impact
Contributes significant and recurring wholesale revenues to nTelos
Leverages Sprint’s spectrum holdings and vendor relationships
Provides nTelos with platform for additional wholesale business
opportunities 14
Attracts high-value customers to utilize network
Supports customer value by delivering Savings, Simplicity and Service
|
 NTELOS Strategy –
Catalyst for Growth
15
Long term value creation and
cash flow generation
Improve retail margins to create value
Market and revenue share growth
Greater efficiencies
Focus on customer experience
Network
Devices
Differentiated value proposition
1
2
Partnerships
Investments
–
Strategic
Assets
Executing on wholesale / retail strategy
Sprint
Dish
Owned Spectrum
4G LTE Network
Recurring revenue
468,000 subscribers
Expand wholesale relationships
Sprint extension and expansion
Further collaboration with Sprint
DISH
Other opportunities
Improved strategic optionality
for all stakeholders |
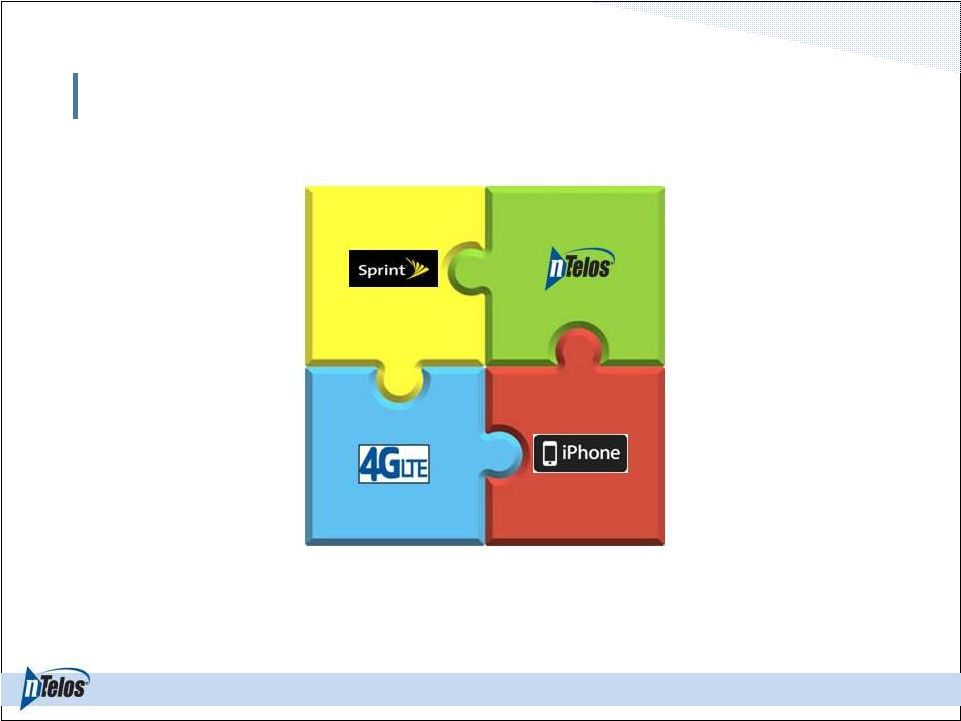 Evolution of nTelos
16 |
 Financial Overview |
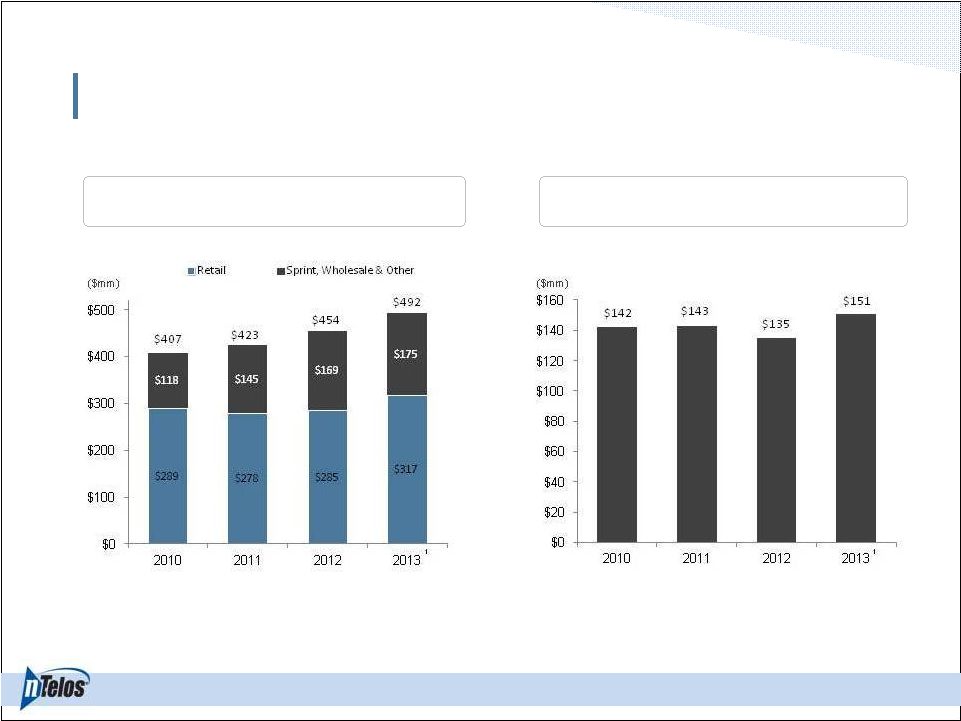 Historical Financial Overview
18
Revenue
Adjusted EBITDA
1
Includes $9.0 million of revenues and $9.6 million of EBITDA related to September
2013 SNA Settlement with Sprint . |
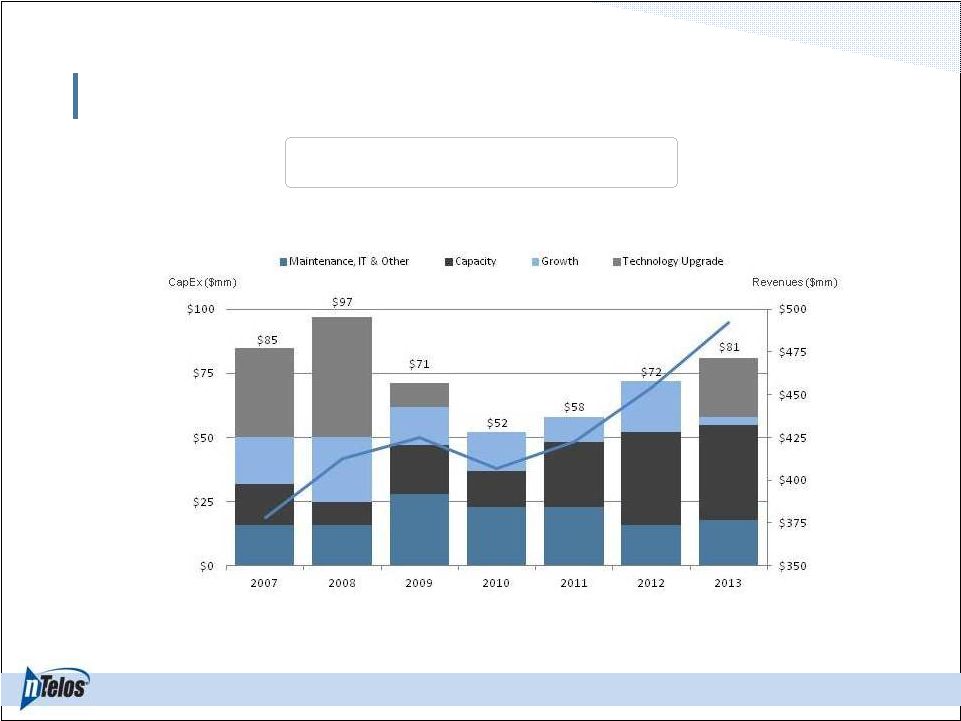 Capital Expenditure
19
CapEx vs. Revenues
Note: Excludes wireline revenue generated and capex incurred prior to October 2011
business separation |
  Capitalization Overview
20
($ in millions)
March 31, 2014
Cash, unrestricted
$121.0
Total Debt
$528.9
Net Debt
$407.9
LTM Adjusted EBITDA
$147.4
Secured Term Loan
$528.0
Net Debt Leverage
2.8x |
 Business Outlook
21
($ in millions)
2014 (Old)
2014 (New)
2015E
SNA Adjusted Revenue
(1)
~ $160
$150-$154
5% -
10%
Incremental SNA LTE CapEx
(2)
N/A
$25
$50-$60
Adjusted EBITDA
(1)
$140-$150
$128-$135
Flat
Total CapEx
$85-$95
$110-$120
$110-$125
1
SNA Adjusted Revenue and Adjusted EBITDA are adjusted for the impact of
recognizing a portion of the billed SNA contract revenues on a
straight
line
basis.
The
deferred
SNA
contract
revenue
for
2014
and
2015
is
expected
to
be
$8.2
million
and
$11.0
million,
respectively.
2
Remaining $75.0 million to $90.0 million of Incremental SNA LTE CapEx spend in
2016-2017. Note: FY 2014 (New) Adjusted EBITDA and Total CapEx
ranges as of May 22, 2014. Cash (3/31/14)
$121 |
 Appendix |
 23
Adjusted EBITDA Reconciliation
NTELOS Holdings Corp.
Reconciliation of Net Income Attributable to NTELOS Holdings Corp. to Adjusted EBITDA
Year Ended:
(In thousands)
2013
2012
2011
2010
Net Income Attributable to NTELOS Holdings Corp.
24,678
$
18,387
$
(23,715)
$
44,808
$
Net income attributable to noncontrolling interests
2,061
1,941
(1,769)
(1,417)
Net Income
26,739
20,328
(21,946)
46,225
Discontinued operations, net
-
-
(45,386)
16,882
Income from continuing operations
26,739
20,328
23,440
29,343
Interest expense
29,743
22,944
23,380
24,728
Loss (gain) on derivatives
-
-
264
147
Income taxes
18,544
12,676
16,363
20,251
Corporate financing fees
-
-
1,567
-
Other expense (income), net
810
7,194
1,240
413
Operating income
75,836
63,142
66,254
74,882
Depreciation and amortization
72,944
63,258
63,083
58,016
Gain on sale of intangible assets
(4,442)
-
-
-
Accretion of asset retirement obligations
622
637
658
770
Equity-based compensation
5,553
6,029
6,072
5,270
Acquisition related charges
-
-
-
2,815
Business separation and advisory charges
375
1,660
6,997
352
Adjusted EBITDA
150,888
$
134,726
$
143,064
$
142,105
$
1
Charges for legal and consulting services in connection with the separation of the Company's
wireless and wireline operations in 2011. 2
Charges for advisory fees for secondary offering in 2013.
2
1
1
1 |