Attached files
| file | filename |
|---|---|
| 8-K - 8-K - ARCH RESOURCES, INC. | a14-15655_18k.htm |
Exhibit 99.1
|
|
The Future of U.S. Thermal Coal John Eaves President and CEO, Arch Coal, Inc. |
|
|
Slide 2 Forward-Looking Information This presentation contains “forward-looking statements” – that is, statements related to future, not past, events. In this context, forward-looking statements often address our expected future business and financial performance, and often contain words such as “expects,” “anticipates,” “intends,” “plans,” “believes,” “seeks,” or “will.” Forward-looking statements by their nature address matters that are, to different degrees, uncertain. For us, particular uncertainties arise from changes in the demand for our coal by the domestic electric generation industry; from legislation and regulations relating to the Clean Air Act and other environmental initiatives; from operational, geological, permit, labor and weather-related factors; from fluctuations in the amount of cash we generate from operations; from future integration of acquired businesses; and from numerous other matters of national, regional and global scale, including those of a political, economic, business, competitive or regulatory nature. These uncertainties may cause our actual future results to be materially different than those expressed in our forward-looking statements. We do not undertake to update our forward-looking statements, whether as a result of new information, future events or otherwise, except as may be required by law. For a description of some of the risks and uncertainties that may affect our future results, you should see the risk factors described from time to time in the reports we file with the Securities and Exchange Commission. |
|
|
Arch’s Asset Portfolio |

|
|
Arch is the most diversified U.S. coal producer, and the No. 2 reserve holder in the nation Slide 4 Based on 2013 10-K filing *Pro forma for the sale of the Hazard complex on 3/5/14 Powder River Basin 3,198 million tons of reserves 5+ Billion Ton Reserve Base Appalachia 430 Met/PCI 590* Thermal million tons of reserves Bituminous Thermal 1,022 million tons of reserves Arch serves customers in more than 20 countries. Our power generation business serves 159 power plants in 36 states as well as coal-based power plants on five continents, while our international coking coal platform serves steel facilities around the world. |
|
|
Arch’s asset base includes a leading, low-cost Powder River Basin position with meaningful available capacity Arch has a strong position in the PRB, the nation’s largest coal supply basin Primarily 8800-Btu, low-sulfur product Available capacity to bring back volume as demand returns Expect PRB to expand domestically Pursuing export growth off West Coast Slide 5 Sources: ACI, MSHA Southern Powder River Basin (2013 production, in millions of tons) |
|
|
Arch is expanding its metallurgical coal platform – and improving its coking coal quality Slide 6 Higher Quality Metallurgical Sales as a Percent of Total Metallurgical Tons (Higher quality is defined as Low-Vol/High-Vol A coal) Metallurgical Sales as a Percent of Appalachian Tons |
|
|
Slide 7 Arch commences operation of Leer longwall All major Leer mine infrastructure, including the preparation plant and rail loadout, is up and running Longwall began operating in late 2013, with a smooth ramp up during 1Q14 to an annualized pace of around 3 million tons Arch is projecting lower overall cash costs per ton in Appalachia for 2014, benefiting from the start of Leer’s longwall Prep Plant & Train Loadout |

|
|
Arch’s Bituminous Thermal segment serves diverse domestic and seaborne coal markets West Elk is a low-cost, valuable asset with a broad domestic and international customer base Viper operation is a low-cost and highly competitive mine in Illinois Arch also owns a 49% equity stake in Knight Hawk Coal*, an established producer of low-chlorine coal in the Illinois Basin Fully permitted Lost Prairie reserves represent a future organic growth opportunity in the Illinois Basin Slide 8 1,022 million tons of reserves West Elk in Colorado Viper in Illinois Knight Hawk* Lost Prairie Reserves Macoupin Reserves *Results not included in segment, reserves based on 2013 10-K filing |

|
|
1 billion tons Slide 9 Arch expects to play a larger role in the expanding seaborne coal trade East Coast DTA port in VA Throughput options at other ports Arch’s capacity could approach 10 million tons by 2015 Sources: Wood Mackenzie, ACI 2020P ~1.7 billion tons ~7 million tons 2011 ~30 million tons Seaborne coal trade Arch’s export volumes West Coast MBT port in WA Agreement with Ridley in BC, Canada Pursuing additional throughput options at ports along West Coast Gulf Coast River terminals in Illinois Agreement with Kinder Morgan in LA and TX Throughput options at other ports (plus mid-streaming) ~13 million tons 2012 2013 ~11.5 million tons 1.35 billion tons |

|
|
Slide 10 and is working to expand West Coast port access to Pacific Rim markets Millennium Bulk Terminals Arch has a 38% stake in MBT, a brownfield redevelopment site in Longview, WA 44 million tonnes of throughput at planned full capacity Strong support from local elected officials, labor and community at large Labor agreements/MOUs in place EIS process well under way and state publicly projects a 12-to-14 month process Additional options for exporting Powder River Basin coal Work is under way to add more than 100 million tonnes of throughput in the U.S. Pacific Northwest, including MBT Efforts to expand or construct capacity in Canada and Mexico are proceeding |

|
|
Arch is pursuing a successful strategy to mitigate the impact of long-term domestic headwinds Slide 11 Divested thermal assets in Utah that required substantial sustaining capital and lacked major access to seaborne coal trade Idled or sold thermal assets in CAPP that were captive to domestic market or weren’t cost competitive Continue to invest in sustainable thermal assets that are low in cost, have broad market reach, and can access the growing seaborne thermal coal trade Building a diversified platform of thermal and metallurgical coal assets that provide a balanced earnings stream, broader customer base and leverage to multiple markets |
|
|
Global Coal Market Update |
|
|
Coal has been the world’s fastest-growing major fuel source for more than a decade Slide 13 Source: BP Statistical Review of World Energy 2013 Change in Global Energy Consumption between 2002 and 2012 (percent change based on millions of tonnes of oil equivalent) Coal Hydro Natural Gas Oil Nuclear -8% |
|
|
Slide 14 Nations around the world are building coal-based power plants to fuel electricity needs Africa Europe CIS Countries Other Asia 33 Latin America 1 China 66 71 India 12 12 3 Under construction* 198 GW 584 mm tonnes Planned by 2018 228 GW 673 mm tonnes New Coal-Fueled Generation Coming Online by 2018 Capacity under construction, in GW, from 2014-2018 Online in 2014 105 GW 310 mm tonnes Sources: ACI and Platts International *Includes capacity expected to come online in 2014 Online in 2013 133 GW 392 mm tonnes |
|
|
Slide 15 The trend of increased coal imports is unmistakable and not confined to India and China Sources: ACI, McCloskey, India Coal Market Watch Data, Bloomberg, KoVor, Associated Press of Pakistan, IEA China net imports (in millions of metric tonnes) India net imports (in millions of metric tonnes) 27 165 (68) 320 Thermal Met Thermal Met Coal consumption in Southeast Asia is projected to grow by ~5% per year through 2035 – tripling to approximately 400 million tons over that time frame Various sources project that South Korea’s thermal imports could increase by 60 million tonnes or more by 2022 Japan’s coal use rose 15% in 2013; two new coal plants came online in Dec. 2013; and coal is increasingly viewed as a strategic substitute for nukes The Pakistani government has announced plans to add nearly 10 GWs of new coal-based capacity |
|
|
European coal consumption remains strong despite regulatory pressures With natural gas prices at nearly twice the level prevailing in the U.S., Europe is consuming more coal Regulatory pressures are intensifying, but declining indigenous production is expected to more than offset the impact on import demand Germany’s coal consumption reached a five-year high in 2013 Slide 16 Sources: IEA, IHS CERA, McCloskey and ACI Coal Burn in Europe (in millions of metric tonnes) 2009 2013P |
|
|
Gulf Coast 63 East Coast 86 Projected Capacity The U.S. is investing in new terminals to satisfy long-term global coal demand NS/Lamberts 29 DTA 18 CNX Marine 14 Pier IX 13 CSX/Curtis Bay 12 Ridley*** 4 Westshore*** 4 CA 3 Pacific Northwest** 30 Mobile 16 Other AL 5 U.S. Exports (in millions of tonnes) Sources: ACI, NMA, Port Terminal Presentations *Includes overland shipments to Canada/Mexico **Total capacity expected to be ~100 million tons over time ***Capacity available for U.S. sourced volumes Slide 17 Deepwater 10 IMT 15 United 10 Burnside 9 Convent 7 Mid-streaming 22 Great Lakes 6 West Coast 41 Southwest 10 Midwest 6 Southeast 21 Actual |
|
|
The U.S. has played a relatively modest role in seaborne markets until now. We believe that will change. The U.S. industry is poised to play an expanding role in seaborne coal markets Seaborne demand growth is certain to continue Rising global cost curve renders U.S. increasingly competitive Large coal reserves Relatively low CAPEX and stable OPEX Highly reliable supplier Cornerstone for Atlantic Basin market Compelling source of diversification for Pacific Rim Slide 18 |

|
|
Domestic Coal Market Outlook |
|
|
(in millions of tons) 2014P directional change Power generation use U.S. coal exports Industrial use Domestic metallurgical U.S. demand Domestic supply Imports U.S. supply Year-end stockpiles Slide 20 142 Arch sees improving trends in U.S. coal markets during 2014 Sources: EIA, IHS CERA and ACI Positive market trends are building in 2014: Power generation was up 5% through March U.S. coal consumption was up 9% through March U.S. coal production through March was flat vs. 1Q13 levels Even with modest growth in U.S. coal supply during 2014, additional stockpile drawdown is occurring as demand continues to grow |
|
|
U.S. coal stockpiles continue to decline in 2014, reaching levels not seen since 2006 Slide 21 Sources: EIA, EVA and ACI Estimated Coal Stockpile Levels at U.S. Power Generators (in millions of tons, at December 31) 87 million ton decline from peak levels We could see another 10+ million ton drop in stockpiles by the end of the 2014 summer burn season, which would bring inventories down to levels not seen since 2005 Stockpiles at PRB customers fell to 45 days of supply in March 2014, below the normal range of 50-55 days of supply |
|
|
The economics of coal — particularly in the PRB — are compelling in today’s natural gas market Slide 22 Sources: ACI, EIA, Ventyx PRB Parity with Natural Gas* (coal = $ per ton; gas = $ per million Btu) *Assumes transportation charge of $20 to $25 per ton; incremental non-fuel costs; and appropriate heat rate differentials for NGCC plants and coal plants. Natural Gas Powder River Basin coal remains the most cost competitive fossil fuel source in the U.S. PRB stocks could decline further due to favorable weather trends and disruptions in rail service Natural gas prices are averaging above $4.50 per million Btu so far this year, and could remain elevated due to additional demand and low storage levels |
|
|
Powder River Basin Days of Supply Stockpiles at PRB customers are at the low end of the historical 10-year range Days of supply at PRB customers in April were ~50 days of supply PRB pricing is trending above 2013 levels Slide 23 Stockpiles at Powder River Basin customers are liquidating at a fast pace Sources: ICAP, EVA and ACI 2014 Jan Feb Mar Apr May Jun Jul Aug Sep Oct Nov Dec 2013 2014 8800 PRB pricing 2013 8800 PRB pricing Powder River Basin 8800 Prompt Month Pricing |

|
|
Slide 24 Over the longer term, Arch expects ~60 GW of coal-based generating capacity to retire by 2018, but the impact on coal consumption will not be as large Sources: Wood Mackenzie, SNL and ACI *Excluding Canyon Fuel Coal Consumption for Power Generation (based on 2013 data) Supply Delivered to At-Risk Plants in 2013 (per coal basin, as percent of each basin’s supply) ~ 75 million tons ~10 million tons* Coal Consumed at Surviving Plants Coal Consumed at Plants Expected to Retire Illinois Basin/ Other Coal Supplied by Arch to Plants Expected to Retire PRB and ILB basins are least impacted by coal plant closures |
|
|
The coal plants expected to retire are generally older, less efficient and less utilized Once those plants retire, that generation will migrate elsewhere including to surviving coal plants Coal fleet has run at much higher utilization rates in the past – and larger, surviving plants retrofitted with modern control technologies should operate at much higher capacity factors Slide 25 Sources: Ventyx, ACI Average Coal Plant Utilization (Capacity factors) 73% ~63% The potential offset to expected coal plant closures is the demonstrated ability to run the surviving coal fleet at higher utilization levels All coal units ~260 GW surviving post 2018 ~60 GW retiring by 2018 ~37% 2007 2013 |
|
|
Future of Coal |
|
|
Slide 27 Low temperatures this past winter have focused greater attention on the important role of U.S. coal This winter has served as a further reminder that power markets are hard to predict – and that diversity and redundancy have value AEP has indicated that 89% of the units slated for retirement in its system – totaling 7 GWs – were operating during winter’s cold spell Southern Company stated that 75% of its to-be-retired units operated during the first cold snap and 90% did so during the second storm Luminant announced plans for the early restart of two units previously expected to be needed only during the summer months Arch has heard similar stories from many other customers |
|
|
Slide 28 Despite the “headline risk” for coal producers, proposed GHG regulations are in a formative stage The final rule is likely to be markedly different from the proposal States have ultimate authority in setting a standard of performance and implementing the rule Many states have already signaled their intent to reject any plan that drives up costs and forces plants to close prematurely States will have until at least June 2017 (during the next Administration) to propose a plan Should a future Administration elect to reject a state plan, a multi-year legal battle will ensue At present, we don’t expect the new GHG regulations to have an impact on domestic coal consumption in the five-year time frame – and potentially much longer |
|
|
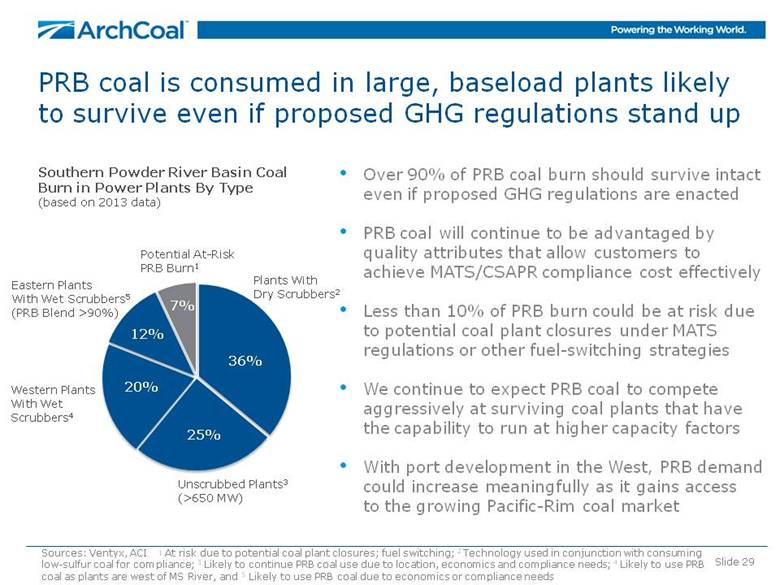
Slide 29 PRB coal is consumed in large, baseload plants likely to survive even if proposed GHG regulations stand up Southern Powder River Basin Coal Burn in Power Plants By Type (based on 2013 data) Western Plants With Wet Scrubbers4 Eastern Plants With Wet Scrubbers5 (PRB Blend >90%) Potential At-Risk PRB Burn1 36% 20% 25% Over 90% of PRB coal burn should survive intact even if proposed GHG regulations are enacted PRB coal will continue to be advantaged by quality attributes that allow customers to achieve MATS/CSAPR compliance cost effectively Less than 10% of PRB burn could be at risk due to potential coal plant closures under MATS regulations or other fuel-switching strategies We continue to expect PRB coal to compete aggressively at surviving coal plants that have the capability to run at higher capacity factors With port development in the West, PRB demand could increase meaningfully as it gains access to the growing Pacific-Rim coal market 12% Plants With Dry Scrubbers2 Unscrubbed Plants3 (>650 MW) 7% Sources: Ventyx, ACI 1 At risk due to potential coal plant closures; fuel switching; 2 Technology used in conjunction with consuming low-sulfur coal for compliance; 3 Likely to continue PRB coal use due to location, economics and compliance needs; 4 Likely to use PRB coal as plants are west of MS River, and 5 Likely to use PRB coal due to economics or compliance needs |
|
|
The U.S. has made remarkable progress in reducing emissions of conventional pollutants over the past 40-plus years New plants with all required emission control technology capture 90%-98% of criteria pollutants Coal-based emissions have declined significantly since 1970, and we expect similar success with CO2 Sources: NMA, EPA, EIA Emissions = Nitrogen Oxide (NOx), Sulfur Dioxide (SO2), Particulate Matter (PM10) Slide 30 |
|
|
Slide 31 While we are confident we can achieve the same success with GHGs, we’re not there yet Each aspect of carbon capture, utilization and storage (CCUS) has been demonstrated, but not in an integrated system Kemper County and Boundary Dam 3 are scheduled to come online during 2014 While subsidized and expensive, their start-up will represent progress The goal is to ensure commercial availability in the 2020s and we believe that’s achievable Source: Public releases |
|
|
Slide 32 U.S. cannot address climate concerns unilaterally There is no realistic path to a low-carbon future without a low-carbon fossil fuel solution Investment is the key to moving such technology forward and thus it’s critical to have a regulatory regime that is well-aligned with the technology pathway Limiting coal use in the U.S. is likely to impede, rather than accelerate, investment in advanced technologies CCUS is an essential mitigation tool, and we need to accelerate our efforts for large-scale deployment during the 2020s Technology is the ultimate solution to addressing climate challenge |