Attached files
| file | filename |
|---|---|
| 8-K - 8-K - EMPIRE DISTRICT ELECTRIC CO | a14-15674_18k.htm |
Exhibit 99.1
|
|
First Quarter 2014 Analyst Presentation 6/18/14 The Empire District Electric Company |
|
|
1 Forward Looking Statements This presentation discusses various matters that are “forward-looking statements” intended to qualify for the safe harbor from liability established by the Private Securities Litigation Reform Act of 1995. Such statements address or may address future plans, objectives, expectations and events or conditions concerning various matters such as capital expenditures, earnings, pension and other costs, competition, litigation, our construction program, our generation plans, our financing plans, potential acquisitions, rate and other regulatory matters, liquidity and capital resources and accounting matters. Forward-looking statements may contain words like “anticipate”, “believe”, “expect”, “project”, “objective” or similar expressions to identify them as forward-looking statements. Factors that could cause actual results to differ materially from those currently anticipated in such statements include: . weather, business and economic conditions and other factors which may impact sales volumes and customer growth; . the costs and other impacts resulting from natural disasters, such as tornados and ice storms; . the amount, terms and timing of rate relief we seek and related matters; . the results of prudency and similar reviews by regulators of costs we incur, including capital expenditures and fuel and purchased power costs, including any regulatory disallowances that could result from prudency reviews; . unauthorized physical or virtual access to our facilities and systems and acts of terrorism, including, but not limited to, cyber-terrorism; . legislation and regulation, including environmental regulation (such as NOx, SO2, mercury, ash and CO2) and health care regulation; . the periodic revision of our construction and capital expenditure plans and cost and timing estimates . costs and activities associated with markets and transmission, including the Southwest Power Pool (SPP) regional transmission organization (RTO) transmission development, and SPP Day-Ahead Market; . the impact of energy efficiency and alternative energy sources; . electric utility restructuring; . spending rates, terminal value calculations and other factors integral to the calculations utilized to test the impairment of goodwill, in addition to market and economic conditions which could adversely affect the analysis and ultimately negatively impact earnings; . volatility in the credit, equity and other financial markets and the resulting impact on our short term debt costs and our ability to issue debt or equity securities, or otherwise secure funds to meet our capital expenditure, dividend and liquidity needs; . the effect of changes in our credit ratings on the availability and cost of funds; . the performance of our pension assets and other post employment benefit plan assets and the resulting impact on our related funding commitments; . our exposure to the credit risk of our hedging counterparties; . the cost and availability of purchased power and fuel, including costs and activities associated with the SPP Day-Ahead Market, and the results of our activities (such as hedging) to reduce the volatility of such costs; . interruptions or changes in our coal delivery, gas transportation or storage agreements or arrangements; . operation of our electric generation facilities and electric and gas transmission and distribution systems, including the performance of our joint owners; . changes in accounting requirements; . costs and effects of legal and administrative proceedings, settlements, investigations and claims; . performance of acquired businesses; and . other circumstances affecting anticipated rates, revenues and costs. All such factors are difficult to predict, contain uncertainties that may materially affect actual results, and may be beyond our control. New factors emerge from time to time and it is not possible for management to predict all such factors or to assess the impact of each such factor on us. Any forward-looking statement speaks only as of the date on which such statement is made, and we do not undertake any obligation to update any forward-looking statement to reflect events or circumstances after the date on which such statement is made. We caution you that any forward-looking statements are not guarantees of future performance and involve known and unknown risk, uncertainties and other factors which may cause our actual results, performance or achievements to differ materially from the facts, results, performance or achievements we have anticipated in such forward-looking statements. |
|
|
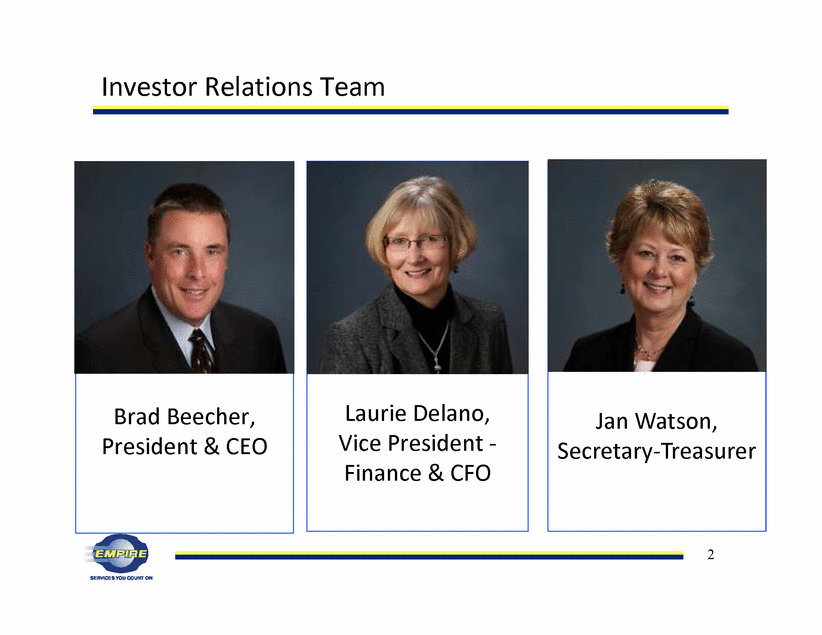
2 Brad Beecher, President & CEO Laurie Delano, Vice President - Finance & CFO Investor Relations Team Jan Watson, Secretary-Treasurer |
|
|
3 Company Overview |
|
|
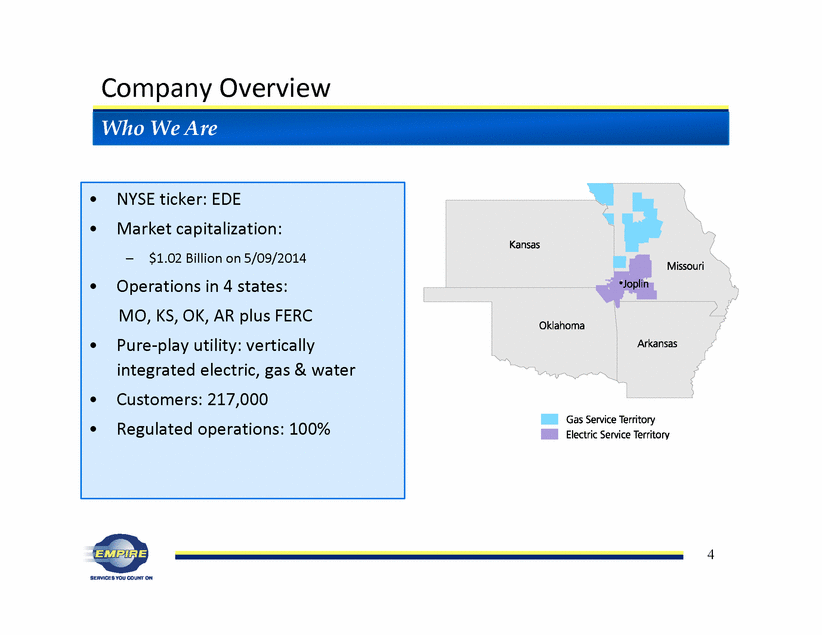
4 Company Overview • NYSE ticker: EDE • Market capitalization: – $1.02 Billion on 5/09/2014 • Operations in 4 states: MO, KS, OK, AR plus FERC • Pure-play utility: vertically integrated electric, gas & water • Customers: 217,000 • Regulated operations: 100% Who We Are |
|
|
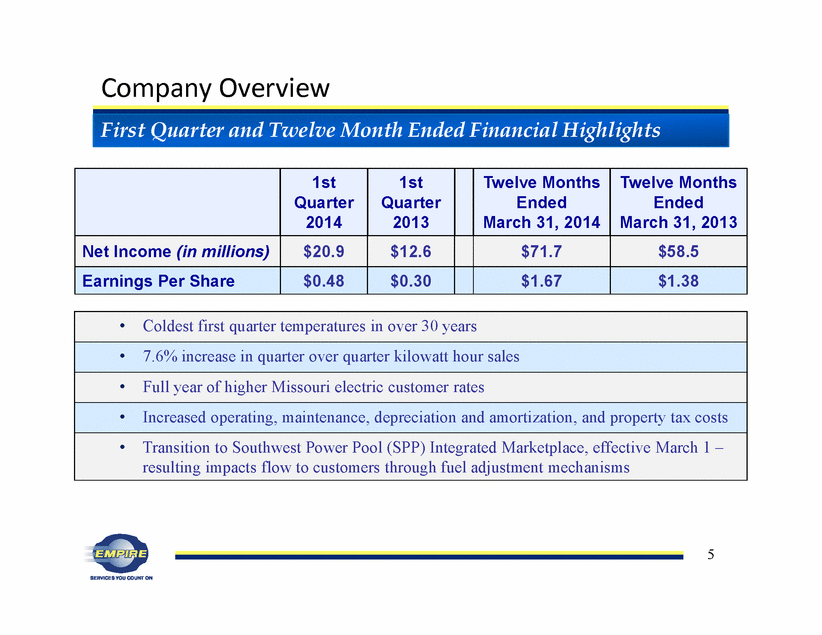
5 Company Overview First Quarter and Twelve Month Ended Financial Highlights 1st Quarter 2014 1st Quarter 2013 Twelve Months Ended March 31, 2014 Twelve Months Ended March 31, 2013 Net Income (in millions) $20.9 $12.6 $71.7 $58.5 Earnings Per Share $0.48 $0.30 $1.67 $1.38 • Coldest first quarter temperatures in over 30 years • 7.6% increase in quarter over quarter kilowatt hour sales • Full year of higher Missouri electric customer rates • Increased operating, maintenance, depreciation and amortization, and property tax costs • Transition to Southwest Power Pool (SPP) Integrated Marketplace, effective March 1 – resulting impacts flow to customers through fuel adjustment mechanisms |
|
|
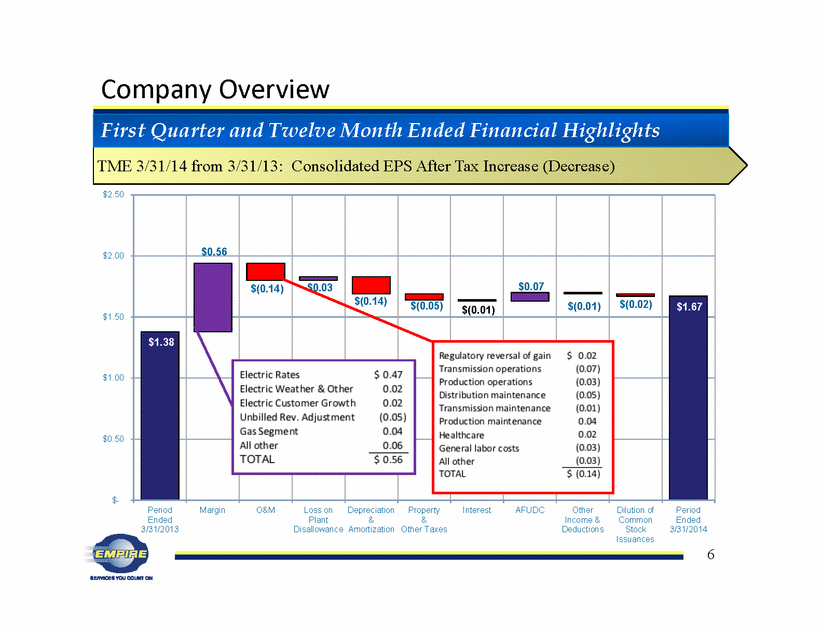
6 Company Overview $0.56 $0.03 $0.07 $(0.14) $(0.14) $(0.05) $(0.01) $(0.01) $(0.02) $1.38 $1.67 $- $0.50 $1.00 $1.50 $2.00 $2.50 Period Ended 3/31/2013 Margin O&M Loss on Plant Disallowance Depreciation & Amortization Property & Other Taxes Interest AFUDC Other Income & Deductions Dilution of Common Stock Issuances Period Ended 3/31/2014 TME 3/31/14 Bridget from 3/31/2013: Consolidated EPS after tax increase (decrease) TME 3/31/14 from 3/31/13: Consolidated EPS After Tax Increase (Decrease) First Quarter and Twelve Month Ended Financial Highlights |
|
|
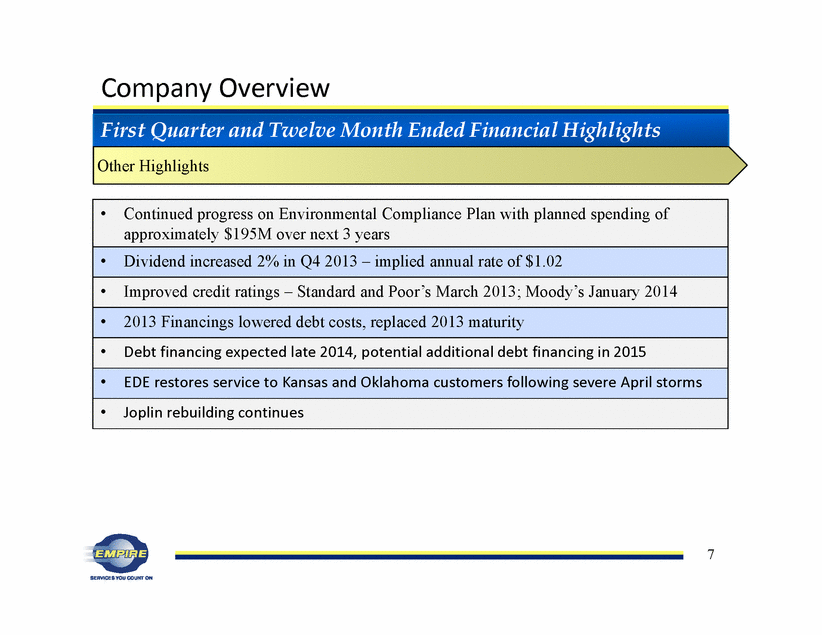
7 Company Overview First Quarter and Twelve Month Ended Financial Highlights • Continued progress on Environmental Compliance Plan with planned spending of approximately $195M over next 3 years • Dividend increased 2% in Q4 2013 – implied annual rate of $1.02 • Improved credit ratings – Standard and Poor’s March 2013; Moody’s January 2014 • 2013 Financings lowered debt costs, replaced 2013 maturity • Debt financing expected late 2014, potential additional debt financing in 2015 • EDE restores service to Kansas and Oklahoma customers following severe April storms • Joplin rebuilding continues Other Highlights |
|
|
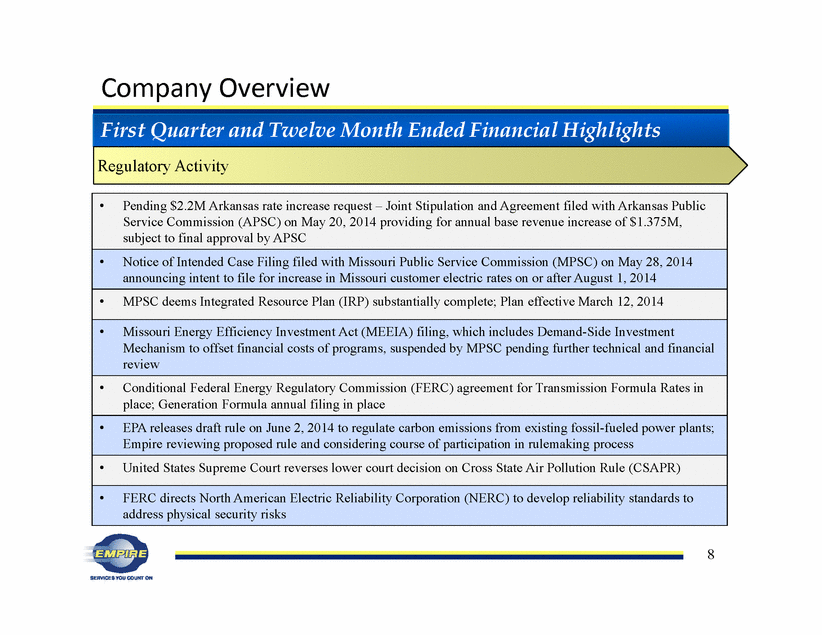
8 Company Overview First Quarter and Twelve Month Ended Financial Highlights • Pending $2.2M Arkansas rate increase request – Joint Stipulation and Agreement filed with Arkansas Public Service Commission (APSC) on May 20, 2014 providing for annual base revenue increase of $1.375M, subject to final approval by APSC • Notice of Intended Case Filing filed with Missouri Public Service Commission (MPSC) on May 28, 2014 announcing intent to file for increase in Missouri customer electric rates on or after August 1, 2014 • MPSC deems Integrated Resource Plan (IRP) substantially complete; Plan effective March 12, 2014 • Missouri Energy Efficiency Investment Act (MEEIA) filing, which includes Demand-Side Investment Mechanism to offset financial costs of programs, suspended by MPSC pending further technical and financial review • Conditional Federal Energy Regulatory Commission (FERC) agreement for Transmission Formula Rates in place; Generation Formula annual filing in place • EPA releases draft rule on June 2, 2014 to regulate carbon emissions from existing fossil-fueled power plants; Empire reviewing proposed rule and considering course of participation in rulemaking process • United States Supreme Court reverses lower court decision on Cross State Air Pollution Rule (CSAPR) • FERC directs North American Electric Reliability Corporation (NERC) to develop reliability standards to address physical security risks Regulatory Activity |
|
|
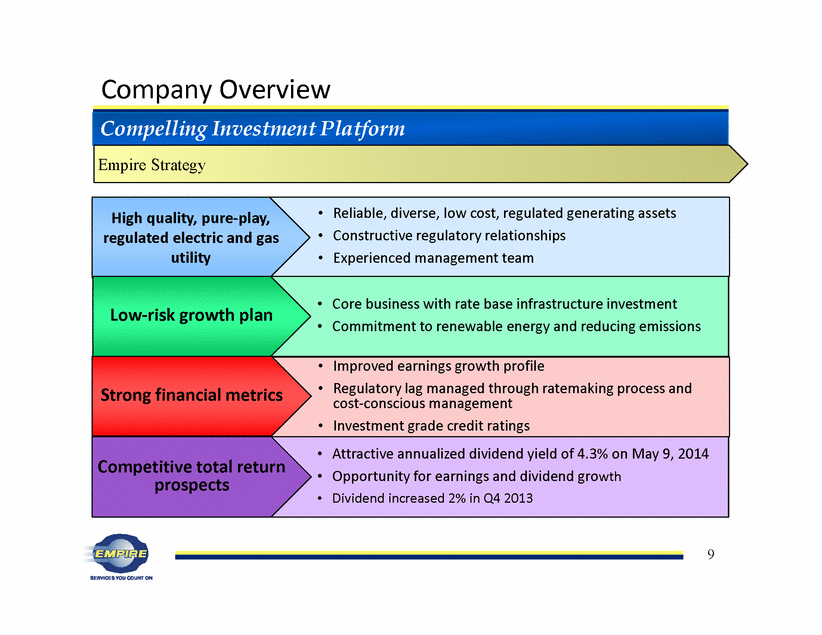
9 • Core business with rate base infrastructure investment • Commitment to renewable energy and reducing emissions Company Overview • Reliable, diverse, low cost, regulated generating assets • Constructive regulatory relationships • Experienced management team High quality, pure-play, regulated electric and gas utility Compelling Investment Platform Low-risk growth plan Improved earnings growth profile • • Regulatory lag managed through ratemaking process and cost-conscious management • Investment grade credit ratings • Attractive annualized dividend yield of 4.3% on May 9, 2014 • Opportunity for earnings and dividend growth • Dividend increased 2% in Q4 2013 Strong financial metrics Competitive total return prospects Empire Strategy |
|
|
10 Pure-Play Regulated Electric and Gas Utility |
|
|
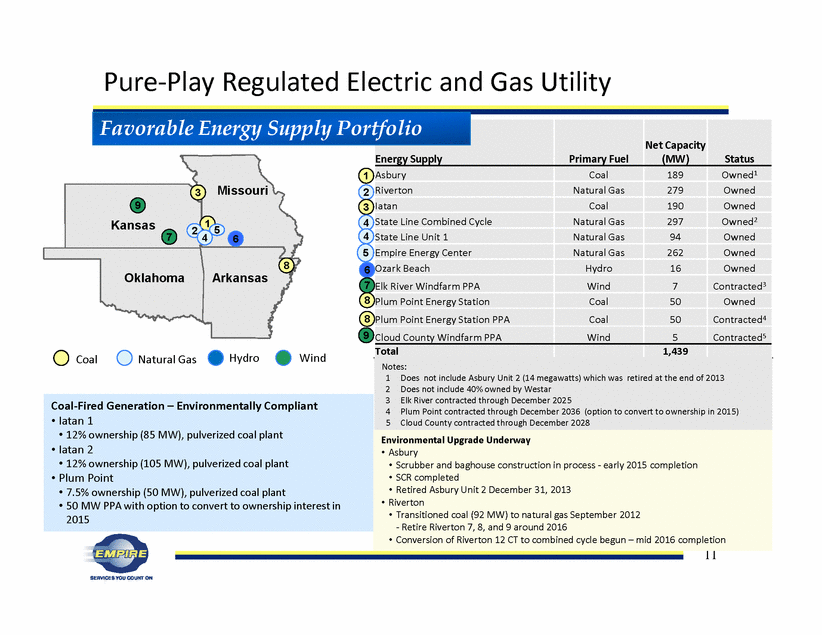
11 Energy Supply Primary Fuel Net Capacity (MW) Status Asbury Coal 189 Owned1 Riverton Natural Gas 279 Owned Iatan Coal 190 Owned State Line Combined Cycle Natural Gas 297 Owned2 State Line Unit 1 Natural Gas 94 Owned Empire Energy Center Natural Gas 262 Owned Ozark Beach Hydro 16 Owned Elk River Windfarm PPA Wind 7 Contracted3 Plum Point Energy Station Coal 50 Owned Plum Point Energy Station PPA Coal 50 Contracted4 Cloud County Windfarm PPA Wind 5 Contracted5 Total 1,439 Notes: 1 Does not include Asbury Unit 2 (14 megawatts) which was retired at the end of 2013 2 Does not include 40% owned by Westar 3 Elk River contracted through December 2025 4 Plum Point contracted through December 2036 (option to convert to ownership in 2015) 5 Cloud County contracted through December 2028 Favorable Energy Supply Portfolio Coal-Fired Generation – Environmentally Compliant • Iatan 1 • 12% ownership (85 MW), pulverized coal plant • Iatan 2 • 12% ownership (105 MW), pulverized coal plant • Plum Point • 7.5% ownership (50 MW), pulverized coal plant • 50 MW PPA with option to convert to ownership interest in 2015 Kansas 9 7 Oklahoma Arkansas 8 Missouri 3 6 1 2 4 5 1 2 3 4 5 6 7 9 8 8 Coal Natural Gas Hydro Wind Environmental Upgrade Underway • Asbury • Scrubber and baghouse construction in process - early 2015 completion • SCR completed • Retired Asbury Unit 2 December 31, 2013 • Riverton • Transitioned coal (92 MW) to natural gas September 2012 - Retire Riverton 7, 8, and 9 around 2016 • Conversion of Riverton 12 CT to combined cycle begun – mid 2016 completion Pure-Play Regulated Electric and Gas Utility 4 8 |
|
|
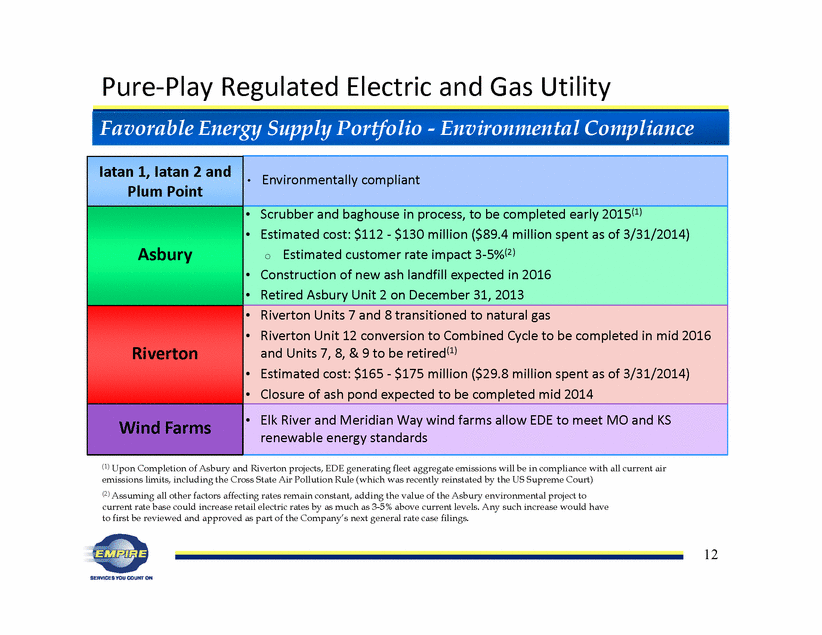
12 • Environmentally compliant • Elk River and Meridian Way wind farms allow EDE to meet MO and KS renewable energy standards Scrubber and baghouse in process, to be completed early 2015(1) • • Estimated cost: $112 - $130 million ($89.4 million spent as of 3/31/2014) o Estimated customer rate impact 3-5%(2) • Construction of new ash landfill expected in 2016 • Retired Asbury Unit 2 on December 31, 2013 Pure-Play Regulated Electric and Gas Utility Favorable Energy Supply Portfolio - Environmental Compliance Iatan 1, Iatan 2 and Plum Point Asbury • Riverton Units 7 and 8 transitioned to natural gas • Riverton Unit 12 conversion to Combined Cycle to be completed in mid 2016 and Units 7, 8, & 9 to be retired(1) • Estimated cost: $165 - $175 million ($29.8 million spent as of 3/31/2014) • Closure of ash pond expected to be completed mid 2014 Riverton (2) Assuming all other factors affecting rates remain constant, adding the value of the Asbury environmental project to current rate base could increase retail electric rates by as much as 3-5% above current levels. Any such increase would have to first be reviewed and approved as part of the Company’s next general rate case filings. Wind Farms (1) Upon Completion of Asbury and Riverton projects, EDE generating fleet aggregate emissions will be in compliance with all current air emissions limits, including the Cross State Air Pollution Rule (which was recently reinstated by the US Supreme Court) |
|
|
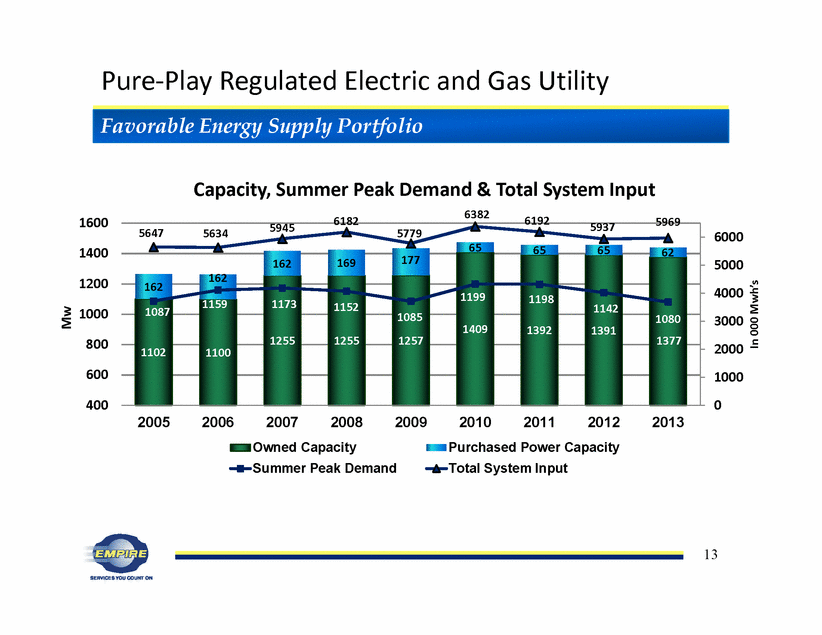
13 Pure-Play Regulated Electric and Gas Utility 1102 1100 1255 1255 1257 1409 1392 1391 1377 162 162 162 169 177 65 65 65 62 1087 1159 1173 1152 1085 1199 1198 1142 1080 5647 5634 5945 6182 5779 6382 6192 5937 5969 0 1000 2000 3000 4000 5000 6000 400 600 800 1000 1200 1400 1600 2005 2006 2007 2008 2009 2010 2011 2012 2013 In 000 Mwh’s Capacity, Summer Peak Demand & Total System Input Owned Capacity Purchased Power Capacity Summer Peak Demand Total System Input Favorable Energy Supply Portfolio Mw |
|
|
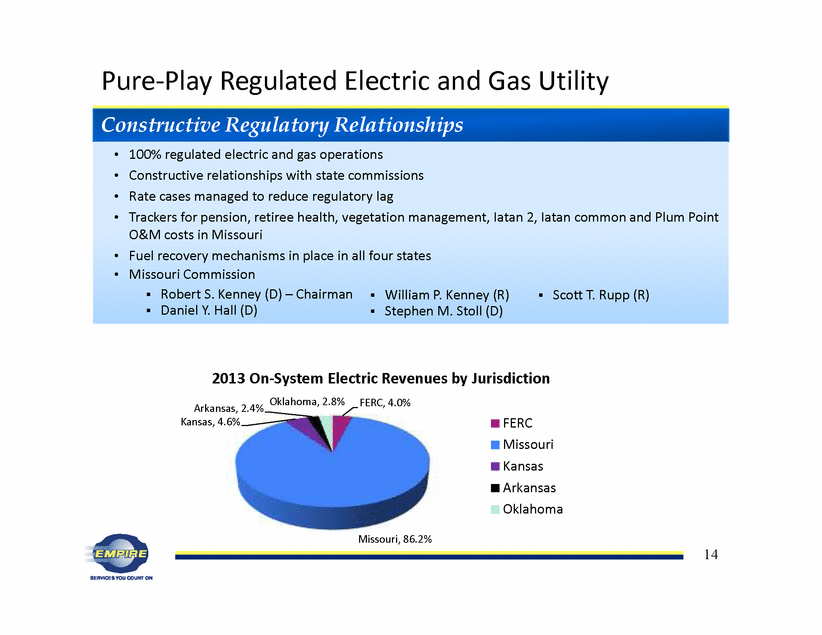
14 Pure-Play Regulated Electric and Gas Utility Constructive Regulatory Relationships • 100% regulated electric and gas operations • Constructive relationships with state commissions • Rate cases managed to reduce regulatory lag • Trackers for pension, retiree health, vegetation management, Iatan 2, Iatan common and Plum Point O&M costs in Missouri • Fuel recovery mechanisms in place in all four states • Missouri Commission Robert S. Kenney (D) – Chairman Daniel Y. Hall (D) FERC, 4.0% Missouri, 86.2% Kansas, 4.6% Arkansas, 2.4% Oklahoma, 2.8% FERC Missouri Kansas Arkansas Oklahoma 2013 On-System Electric Revenues by Jurisdiction William P. Kenney (R) Stephen M. Stoll (D) Scott T. Rupp (R) |
|
|
15 Low-Risk Growth Plan |
|
|
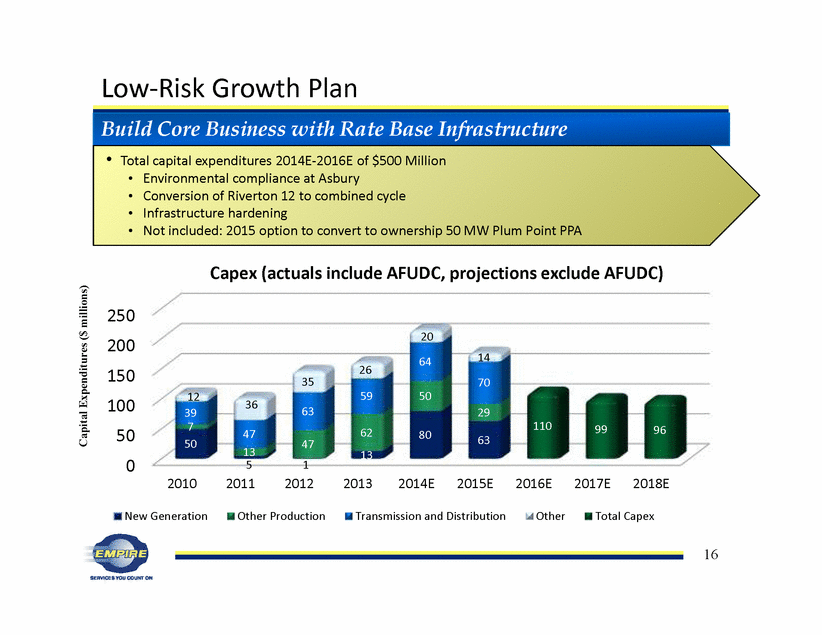
16 Low-Risk Growth Plan Build Core Business with Rate Base Infrastructure 0 50 100 150 200 250 2010 2011 2012 2013 2014E 2015E 2016E 2017E 2018E 50 5 1 13 80 63 7 13 47 62 50 29 39 47 63 59 64 70 12 36 35 26 20 14 110 99 96 Capex (actuals include AFUDC, projections exclude AFUDC) New Generation Other Production Transmission and Distribution Other Total Capex Capital Expenditures ($ millions) • Total capital expenditures 2014E-2016E of $500 Million • Environmental compliance at Asbury • Conversion of Riverton 12 to combined cycle • Infrastructure hardening • Not included: 2015 option to convert to ownership 50 MW Plum Point PPA |
|
|
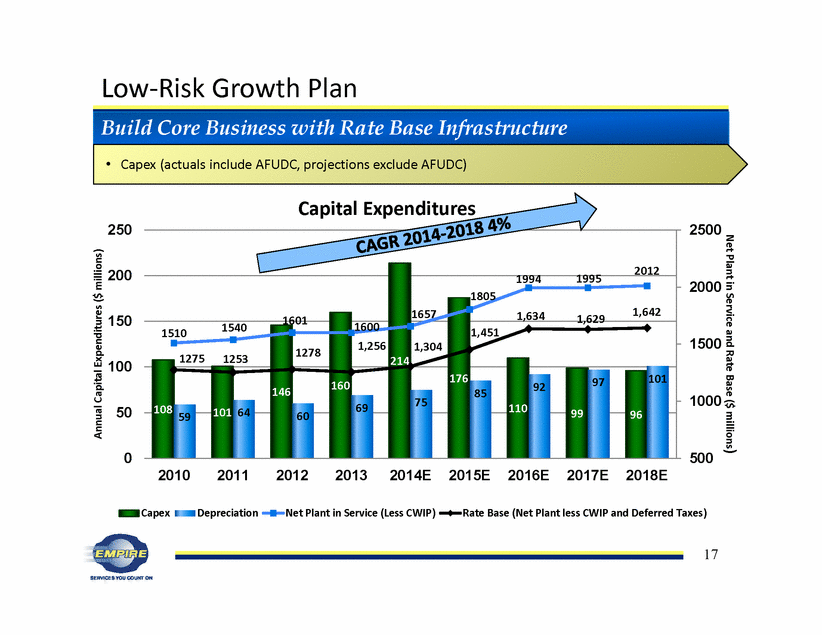
17 108 101 146 160 214 176 110 99 96 59 64 60 69 75 85 92 97 101 1510 1540 1601 1600 1657 1805 1994 1995 2012 1275 1253 1278 1,256 1,304 1,451 1,634 1,629 1,642 500 1000 1500 2000 2500 0 50 100 150 200 250 2010 2011 2012 2013 2014E 2015E 2016E 2017E 2018E Net Plant in Service and Rate Base ($ millions) Annual Capital Expenditures ($ millions) Capital Expenditures Capex Depreciation Net Plant in Service (Less CWIP) Rate Base (Net Plant less CWIP and Deferred Taxes) Low-Risk Growth Plan Build Core Business with Rate Base Infrastructure • Capex (actuals include AFUDC, projections exclude AFUDC) |
|
|
18 Strong Financial Metrics |
|
|
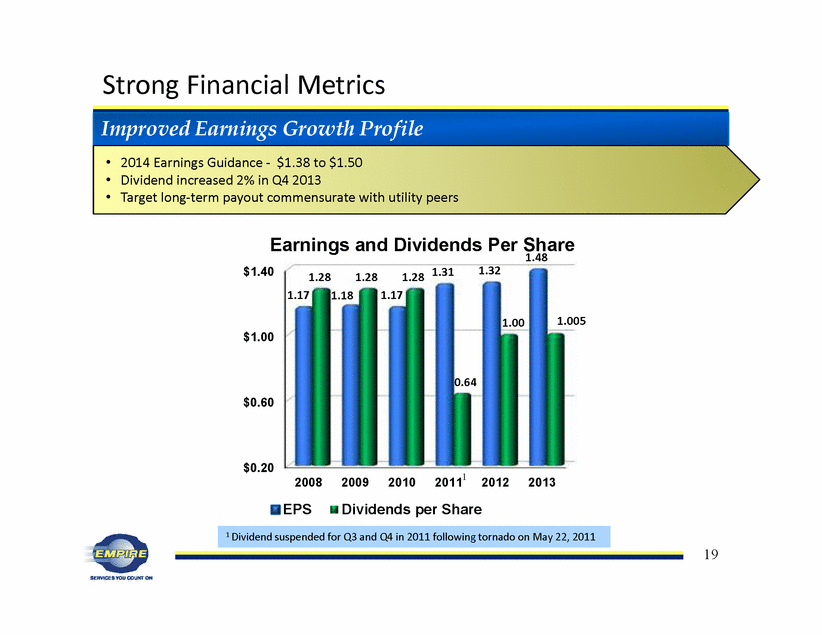
19 Strong Financial Metrics $0.20 $0.60 $1.00 $1.40 2008 2009 2010 2011 2012 2013 1.17 1.18 1.17 1.31 1.32 1.48 1.28 1.28 1.28 0.64 1.00 1.005 Earnings and Dividends Per Share EPS Dividends per Share 1 1 Dividend suspended for Q3 and Q4 in 2011 following tornado on May 22, 2011 Improved Earnings Growth Profile • 2014 Earnings Guidance - $1.38 to $1.50 • Dividend increased 2% in Q4 2013 • Target long-term payout commensurate with utility peers |
|
|
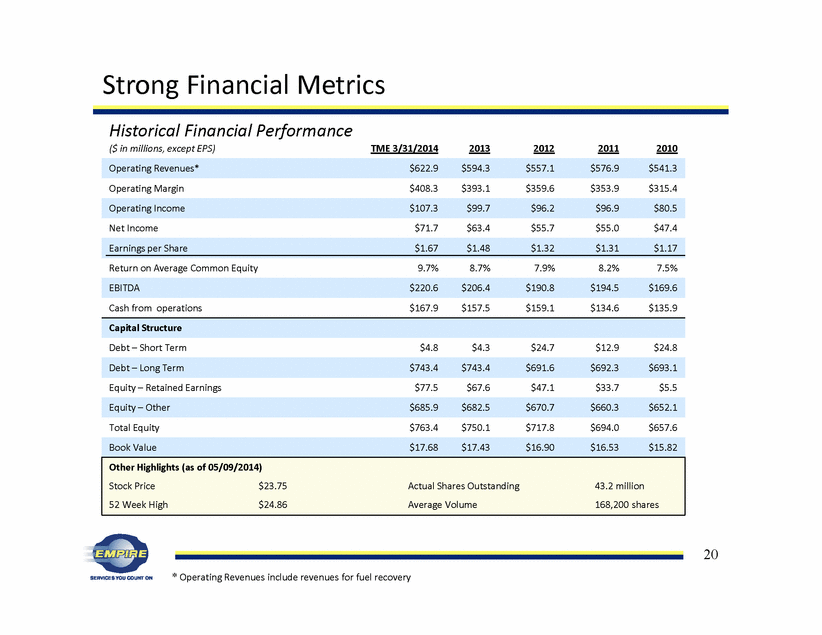
20 Historical Financial Performance * Operating Revenues include revenues for fuel recovery ($ in millions, except EPS) TME 3/31/2014 2013 2012 2011 2010 Operating Revenues* $622.9 $594.3 $557.1 $576.9 $541.3 Operating Margin $408.3 $393.1 $359.6 $353.9 $315.4 Operating Income $107.3 $99.7 $96.2 $96.9 $80.5 Net Income $71.7 $63.4 $55.7 $55.0 $47.4 Earnings per Share $1.67 $1.48 $1.32 $1.31 $1.17 Return on Average Common Equity 9.7% 8.7% 7.9% 8.2% 7.5% EBITDA $220.6 $206.4 $190.8 $194.5 $169.6 Cash from operations $167.9 $157.5 $159.1 $134.6 $135.9 Capital Structure Debt – Short Term $4.8 $4.3 $24.7 $12.9 $24.8 Debt – Long Term $743.4 $743.4 $691.6 $692.3 $693.1 Equity – Retained Earnings $77.5 $67.6 $47.1 $33.7 $5.5 Equity – Other $685.9 $682.5 $670.7 $660.3 $652.1 Total Equity $763.4 $750.1 $717.8 $694.0 $657.6 Book Value $17.68 $17.43 $16.90 $16.53 $15.82 Strong Financial Metrics Other Highlights (as of 05/09/2014) Stock Price $23.75 Actual Shares Outstanding 43.2 million 52 Week High $24.86 Average Volume 168,200 shares |
|
|
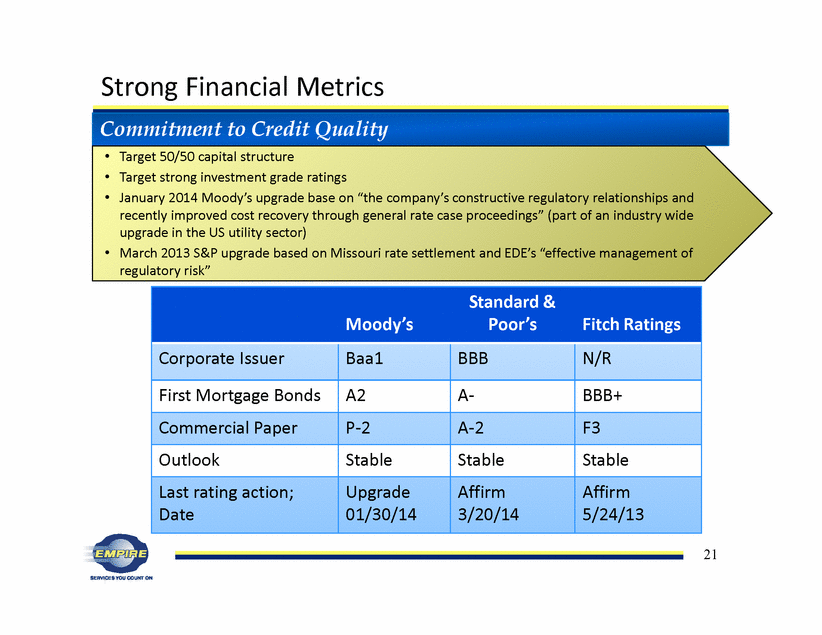
21 Moody’s Standard & Poor’s Fitch Ratings Corporate Issuer Baa1 BBB N/R First Mortgage Bonds A2 A- BBB+ Commercial Paper P-2 A-2 F3 Outlook Stable Stable Stable Last rating action; Date Upgrade 01/30/14 Affirm 3/20/14 Affirm 5/24/13 Commitment to Credit Quality Strong Financial Metrics Commitment to Credit Quality • Target 50/50 capital structure • Target strong investment grade ratings • January 2014 Moody’s upgrade base on “the company’s constructive regulatory relationships and recently improved cost recovery through general rate case proceedings” (part of an industry wide upgrade in the US utility sector) • March 2013 S&P upgrade based on Missouri rate settlement and EDE’s “effective management of regulatory risk” |
|
|
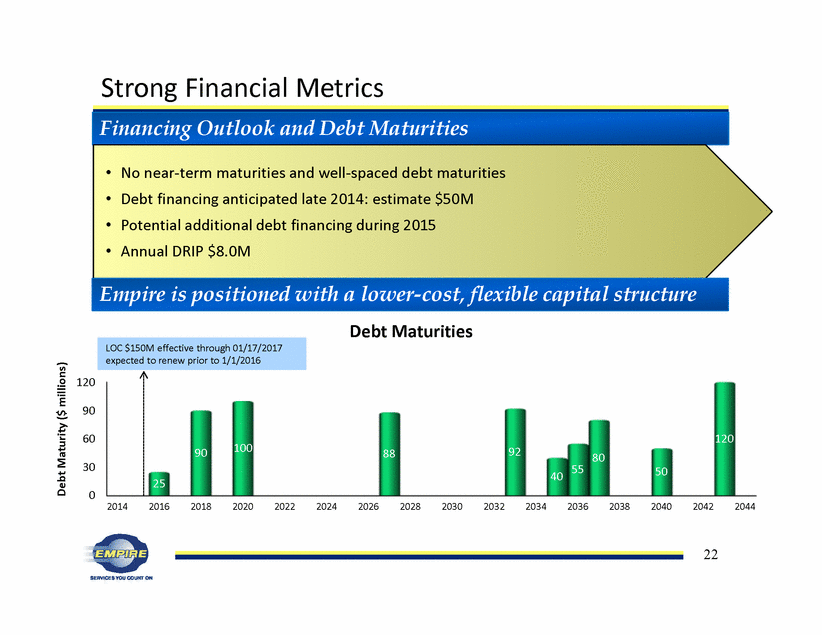
22 Strong Financial Metrics Financing Outlook and Debt Maturities 0 30 60 90 120 2014 2016 2018 2020 2022 2024 2026 2028 2030 2032 2034 2036 2038 2040 2042 2044 25 90 100 88 92 40 55 80 50 120 Debt Maturity ($ millions) Debt Maturities LOC $150M effective through 01/17/2017 expected to renew prior to 1/1/2016 • No near-term maturities and well-spaced debt maturities • Debt financing anticipated late 2014: estimate $50M • Potential additional debt financing during 2015 • Annual DRIP $8.0M Empire is positioned with a lower-cost, flexible capital structure |
|
|
23 Competitive Total Return Prospects |
|
|
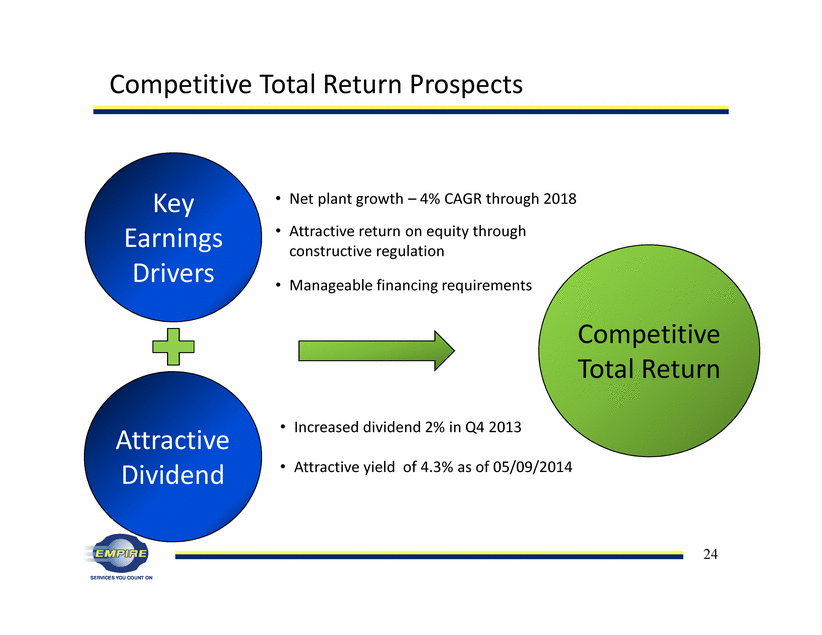
24 Competitive Total Return Prospects Key Earnings Drivers Attractive Dividend Competitive Total Return • Net plant growth – 4% CAGR through 2018 • Attractive return on equity through constructive regulation • Manageable financing requirements • Increased dividend 2% in Q4 2013 • Attractive yield of 4.3% as of 05/09/2014 |
|
|
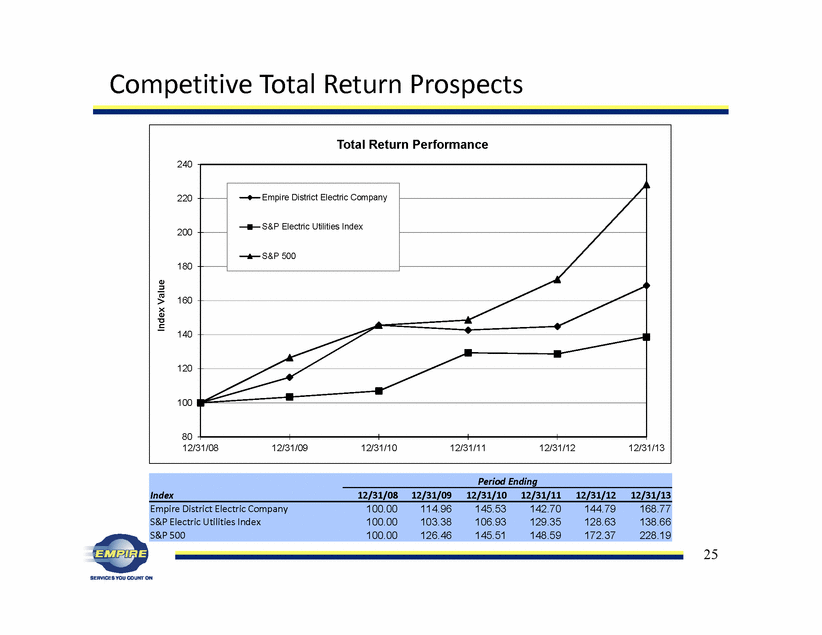
25 Competitive Total Return Prospects Period Ending Index 12/31/08 12/31/09 12/31/10 12/31/11 12/31/12 12/31/13 Empire District Electric Company 100.00 114.96 145.53 142.70 144.79 168.77 S&P Electric Utilities Index 100.00 103.38 106.93 129.35 128.63 138.66 S&P 500 100.00 126.46 145.51 148.59 172.37 228.19 80 100 120 140 160 180 200 220 240 12/31/08 12/31/09 12/31/10 12/31/11 12/31/12 12/31/13 Index Value Total Return Performance Empire District Electric Company S&P Electric Utilities Index S&P 500 |
|
|
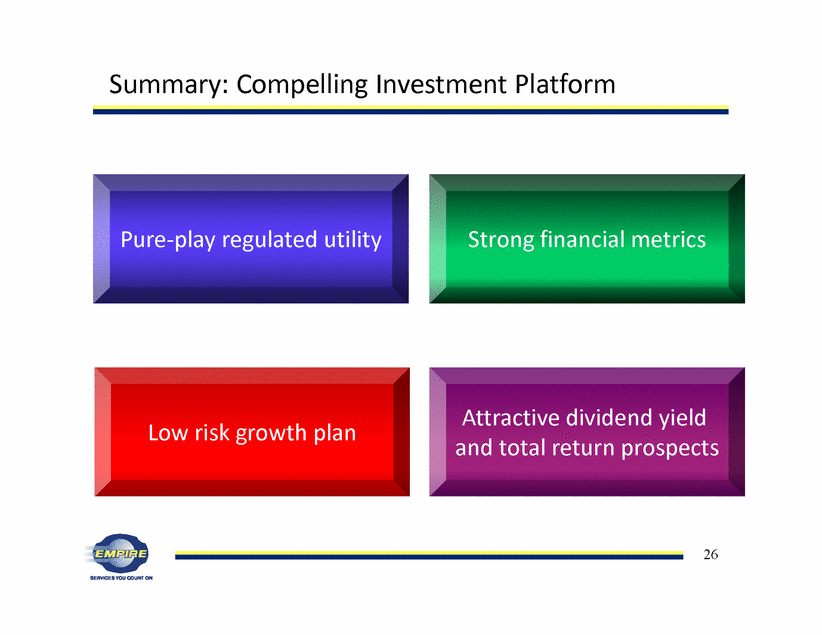
26 Summary: Compelling Investment Platform Pure-play regulated utility Low risk growth plan Strong financial metrics Attractive dividend yield and total return prospects |
|
|
27 • Regulated Electric and Gas Utility Data • Generation Mix • Electric Customer Growth • Residential Rates • State Commission Profiles • Management and Organization • Management Biographies • Contact Information Supplemental Materials |
|
|
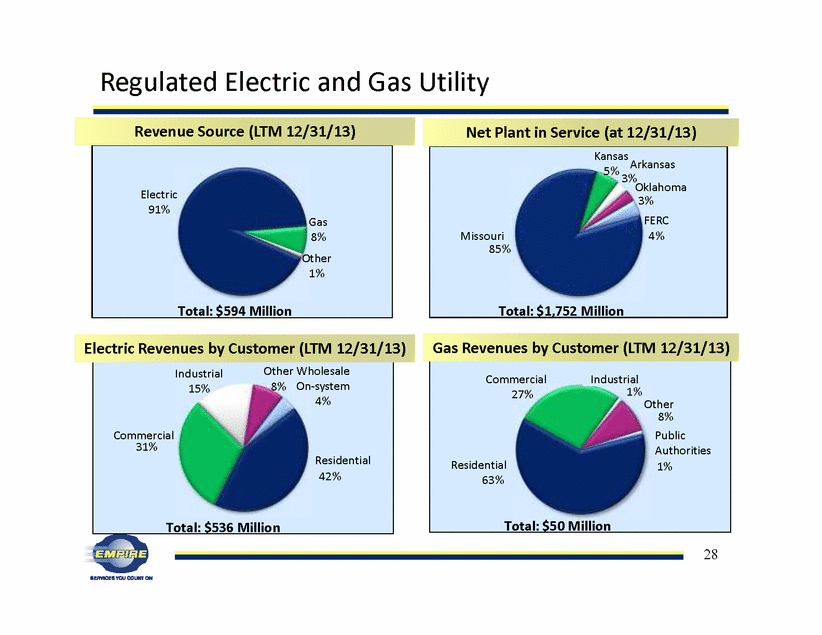
28 85% Kansas 5% 3% 3% FERC 4% Total: $1,752 Million Missouri Arkansas Regulated Electric and Gas Utility Net Plant in Service (at 12/31/13) Electric 91% Gas 8% Other 1% Total: $594 Million Oklahoma Revenue Source (LTM 12/31/13) 42% 31% Industrial 15% Other 8% Wholesale On-system 4% Commercial Residential Total: $536 Million Electric Revenues by Customer (LTM 12/31/13) Commercial 27% Residential 63% Total: $50 Million 1% Public Authorities 8% Industrial Other 1% Gas Revenues by Customer (LTM 12/31/13) |
|
|
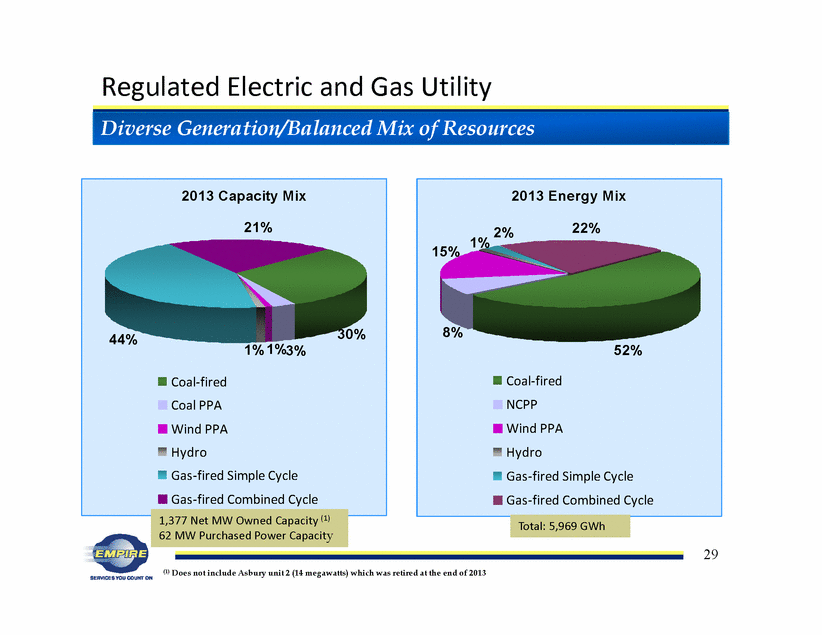
29 2013 Capacity Mix 21% 44% 1% 3% 30% 1% Coal-fired Coal PPA Wind PPA Hydro Gas-fired Simple Cycle Gas-fired Combined Cycle 2013 Energy Mix 22% 15% 52% 8% 1% 2% Coal-fired NCPP Wind PPA Hydro Gas-fired Simple Cycle Gas-fired Combined Cycle Regulated Electric and Gas Utility Diverse Generation/Balanced Mix of Resources 1,377 Net MW Owned Capacity (1) 62 MW Purchased Power Capacity Total: 5,969 GWh (1) Does not include Asbury unit 2 (14 megawatts) which was retired at the end of 2013 |
|
|
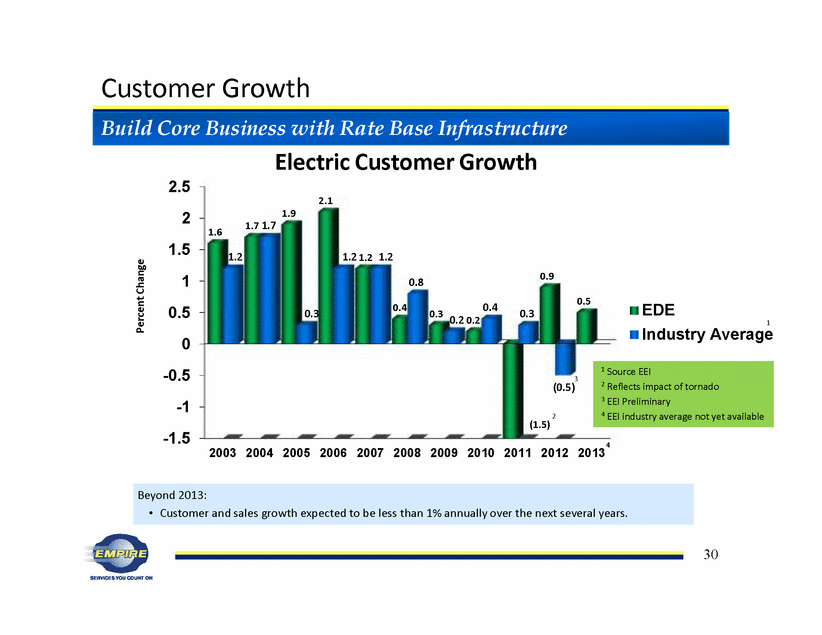
30 Customer Growth Electric Customer Growth -1.5 -1 -0.5 0 0.5 1 1.5 2 2.5 2003 2004 2005 2006 2007 2008 2009 2010 2011 2012 2013 1.6 1.7 1.9 2.1 1.2 0.4 0.3 0.2 (1.5) 0.9 0.5 1.2 1.7 0.3 1.2 1.2 0.8 0.2 0.4 0.3 (0.5) Percent Change EDE Industry Average 1 Source EEI 2 Reflects impact of tornado 3 EEI Preliminary 4 EEI industry average not yet available 2 3 1 Beyond 2013: • Customer and sales growth expected to be less than 1% annually over the next several years. Build Core Business with Rate Base Infrastructure 4 |
|
|
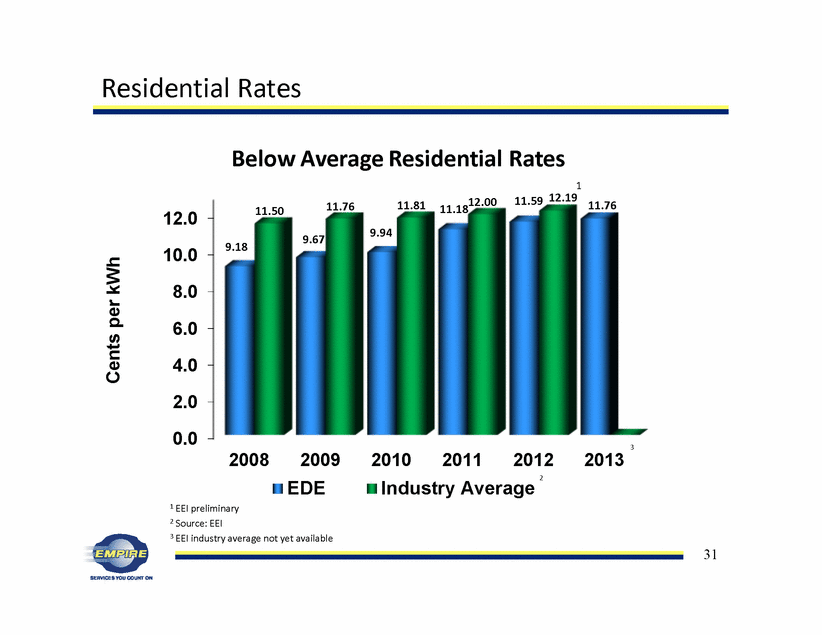
31 0.0 2.0 4.0 6.0 8.0 10.0 12.0 2008 2009 2010 2011 2012 2013 9.18 9.67 9.94 11.18 11.59 11.76 11.50 11.76 11.81 12.00 12.19 Cents per kWh EDE Industry Average 3 BelowAverage Residential Rates Residential Rates 1 EEI preliminary 2 Source: EEI 3 EEI industry average not yet available 2 1 |
|
|
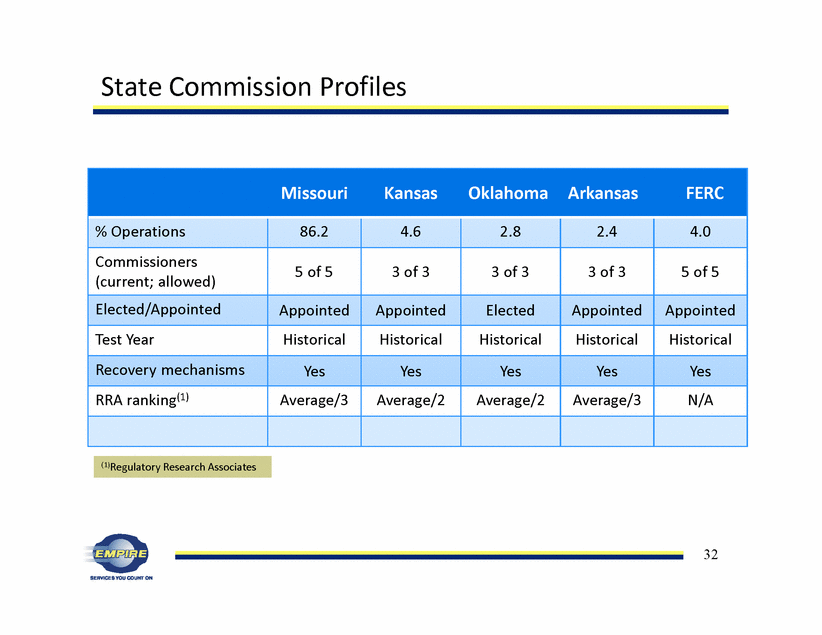
32 Missouri Kansas Oklahoma Arkansas FERC % Operations 86.2 4.6 2.8 2.4 4.0 Commissioners (current; allowed) 5 of 5 3 of 3 3 of 3 3 of 3 5 of 5 Elected/Appointed Appointed Appointed Elected Appointed Appointed Test Year Historical Historical Historical Historical Historical Recovery mechanisms Yes Yes Yes Yes Yes RRA ranking(1) Average/3 Average/2 Average/2 Average/3 N/A State Commission Profiles (1)Regulatory Research Associates |
|
|
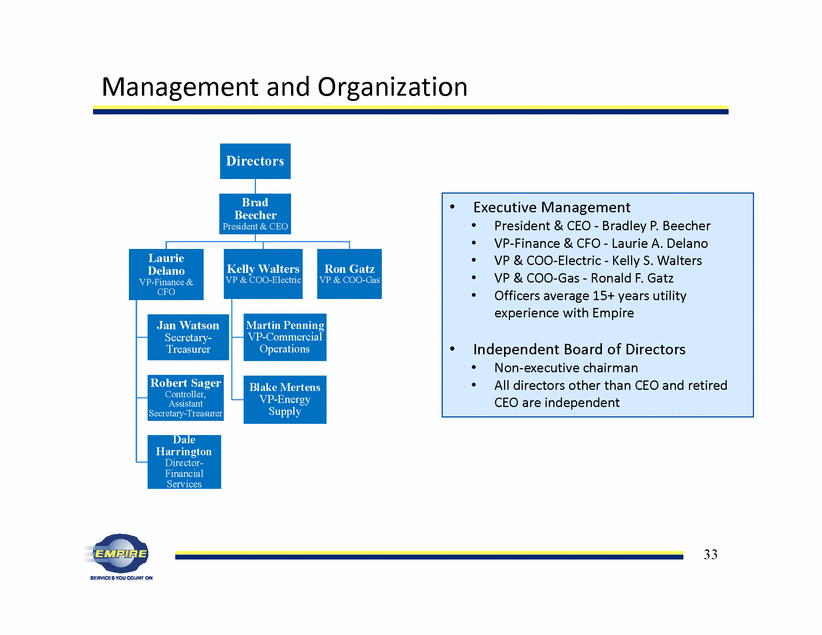
33 • Executive Management • President & CEO - Bradley P. Beecher • VP-Finance & CFO - Laurie A. Delano • VP & COO-Electric - Kelly S. Walters • VP & COO-Gas - Ronald F. Gatz • Officers average 15+ years utility experience with Empire • Independent Board of Directors • Non-executive chairman • All directors other than CEO and retired CEO are independent Management and Organization Directors Brad Beecher President & CEO Laurie Delano VP-Finance & CFO Jan Watson Secretary- Treasurer Robert Sager Controller, Assistant Secretary-Treasurer Dale Harrington Director- Financial Services Kelly Walters VP & COO-Electric Martin Penning VP-Commercial Operations Blake Mertens VP-Energy Supply Ron Gatz VP & COO-Gas |
|
|
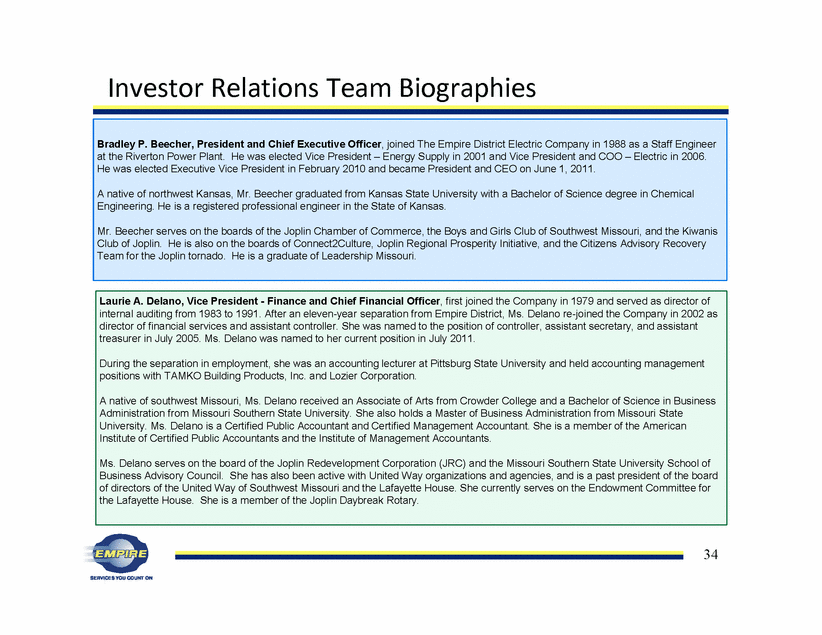
34 Investor Relations Team Biographies Bradley P. Beecher, President and Chief Executive Officer, joined The Empire District Electric Company in 1988 as a Staff Engineer at the Riverton Power Plant. He was elected Vice President – Energy Supply in 2001 and Vice President and COO – Electric in 2006. He was elected Executive Vice President in February 2010 and became President and CEO on June 1, 2011. A native of northwest Kansas, Mr. Beecher graduated from Kansas State University with a Bachelor of Science degree in Chemical Engineering. He is a registered professional engineer in the State of Kansas. Mr. Beecher serves on the boards of the Joplin Chamber of Commerce, the Boys and Girls Club of Southwest Missouri, and the Kiwanis Club of Joplin. He is also on the boards of Connect2Culture, Joplin Regional Prosperity Initiative, and the Citizens Advisory Recovery Team for the Joplin tornado. He is a graduate of Leadership Missouri. Laurie A. Delano, Vice President - Finance and Chief Financial Officer, first joined the Company in 1979 and served as director of internal auditing from 1983 to 1991. After an eleven-year separation from Empire District, Ms. Delano re-joined the Company in 2002 as director of financial services and assistant controller. She was named to the position of controller, assistant secretary, and assistant treasurer in July 2005. Ms. Delano was named to her current position in July 2011. During the separation in employment, she was an accounting lecturer at Pittsburg State University and held accounting management positions with TAMKO Building Products, Inc. and Lozier Corporation. A native of southwest Missouri, Ms. Delano received an Associate of Arts from Crowder College and a Bachelor of Science in Business Administration from Missouri Southern State University. She also holds a Master of Business Administration from Missouri State University. Ms. Delano is a Certified Public Accountant and Certified Management Accountant. She is a member of the American Institute of Certified Public Accountants and the Institute of Management Accountants. Ms. Delano serves on the board of the Joplin Redevelopment Corporation (JRC) and the Missouri Southern State University School of Business Advisory Council. She has also been active with United Way organizations and agencies, and is a past president of the board of directors of the United Way of Southwest Missouri and the Lafayette House. She currently serves on the Endowment Committee for the Lafayette House. She is a member of the Joplin Daybreak Rotary. |
|
|
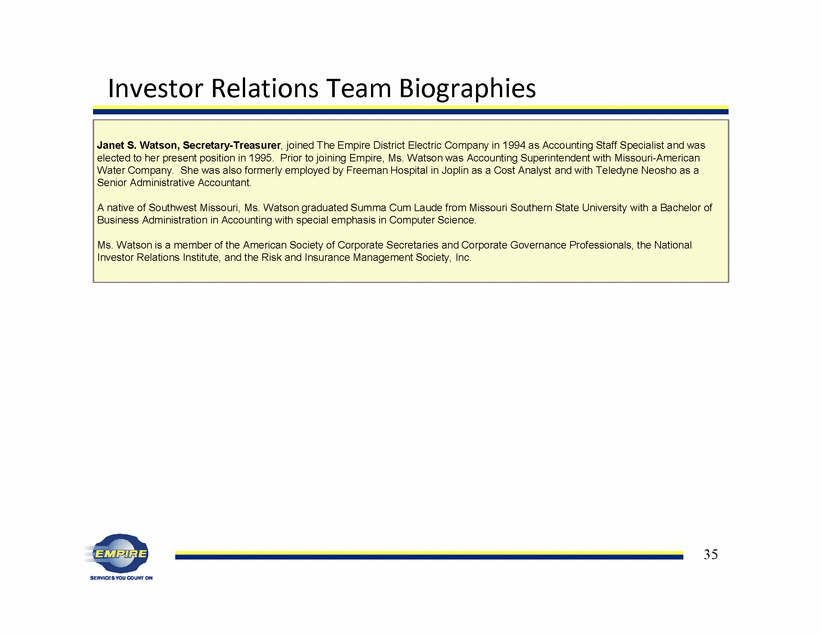
35 Investor Relations Team Biographies Janet S. Watson, Secretary-Treasurer, joined The Empire District Electric Company in 1994 as Accounting Staff Specialist and was elected to her present position in 1995. Prior to joining Empire, Ms. Watson was Accounting Superintendent with Missouri-American Water Company. She was also formerly employed by Freeman Hospital in Joplin as a Cost Analyst and with Teledyne Neosho as a Senior Administrative Accountant. A native of Southwest Missouri, Ms. Watson graduated Summa Cum Laude from Missouri Southern State University with a Bachelor of Business Administration in Accounting with special emphasis in Computer Science. Ms. Watson is a member of the American Society of Corporate Secretaries and Corporate Governance Professionals, the National Investor Relations Institute, and the Risk and Insurance Management Society, Inc. |
|
|
36 Empire District Electric Company 602 S. Joplin Avenue Joplin, MO 64801 www.empiredistrict.com Jan Watson Office: 417-625-5108 Cell: 417-850-7903 jwatson@empiredistrict.com Laurie Delano Office: 417-625-5127 Cell: 417-291-4397 ldelano@empiredistrict.com Contact Us |
|
|
37 Making lives better every day with reliable energy and service |

