Attached files
| file | filename |
|---|---|
| 8-K - CHINA FUND INC | fp0010759_8k.htm |
|
May 31, 2014
|
Monthly Insight
The China Fund, Inc. (CHN)
|
|
Investment Objective
|
The investment objective of the Fund is to achieve long term capital appreciation. The Fund seeks to achieve its objective through investment in the equity securities of companies and other entities with significant assets, investments, production activities, trading or other business interests in China or which derive a significant part of their revenue from China.
The Fund has an operating policy that the Fund will invest at least 80% of its assets in China companies. For this purpose, 'China companies' are (i) companies for which the principal securities trading market is in China; (ii) companies for which the principal securities trading market is outside of China or in companies organized outside of China, that in both cases derive at least 50% of their revenues from goods or services sold or produced, or have a least 50% of their assets in China; or (iii) companies organized in China. Under the policy, China means the People's Republic of China, including Hong Kong, and Taiwan. The Fund will provide its stockholders with at least 60 days' prior notice of any change to this policy.
|
Performance Overview
|
|
Performance History
|
1 month
|
3 months
|
YTD
|
1 Year
|
3 Years
(p.a.)
|
5 Years (p.a.)
|
10 Years (p.a.)
|
Since
Inception
|
|
NAV (%)
|
2.58
|
1.23
|
-0.09
|
7.94
|
0.81
|
11.36
|
14.09
|
10.81
|
|
Market price (%)
|
2.42
|
1.60
|
-2.26
|
10.19
|
0.27
|
8.97
|
11.36
|
9.78
|
|
Benchmark (%)
|
4.50
|
3.83
|
0.95
|
8.28
|
1.59
|
8.41
|
9.92
|
N/A
|
|
Performance History
|
2013
|
2012
|
2011
|
2010
|
2009
|
2008
|
2007
|
2006
|
|
NAV (%)
|
17.03
|
12.07
|
-24.37
|
27.25
|
72.82
|
-46.95
|
86.20
|
57.10
|
|
Market price (%)
|
11.48
|
20.46
|
-27.51
|
23.60
|
72.19
|
-40.65
|
50.24
|
65.67
|
|
Benchmark (%)
|
7.25
|
22.65
|
-18.36
|
13.60
|
67.12
|
-49.37
|
37.97
|
39.50
|
Source : State Street Bank and Trust Company. Source for index data: MSCI as at May 31, 2014. Total investment returns are historical and do not guarantee future results. Total investment returns reflect changes in net asset value and market price per share during each period and assumes that dividends and capital gains distributions, if any, were reinvested. The net asset value (NAV) percentages are not an indication of the performance of a shareholder's investment in the Fund, which is based on market price. NAV performance includes the deduction of management fees and other expenses. Market price performance does not include the deduction of brokerage commissions and other expenses of trading shares and would be lower had such commissions and expenses been deducted.
|
Portfolio Analysis
|
|
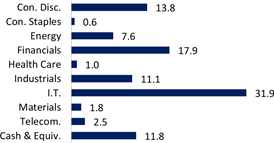
Sector allocation (%)
|
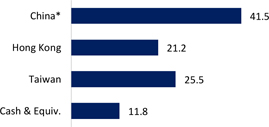
Country allocation (%)
|
 |
 |
|
Source: State Street Bank and Trust Company as at May 31, 2014.
|
* China includes A-shares (0.0%), A-share equity linked securities (8.3%), B-shares (0.0%), H-shares (20.7%) and Red-chips (12.5%).
|

The China Fund, Inc. (CHN)
|
Portfolio Analysis (continued)
|
|
Top 10 Holdings
|
Sector
|
%
|
|
China Minsheng Banking Corp., Ltd.
|
Financials
|
4.9
|
|
Beijing Enterprises Holdings, Ltd.
|
Industrials
|
4.0
|
|
Hutchison Whampoa, Ltd.
|
Industrials
|
3.6
|
|
Taiwan Semiconductor Manufacturing Co., Ltd.
|
Information Technology
|
3.4
|
|
Li & Fung, Ltd.
|
Consumer Discretionary
|
3.4
|
|
PetroChina Co., Ltd.
|
Energy
|
3.2
|
|
Delta Electronics, Inc.
|
Information Technology
|
3.1
|
|
Tong Hsing Electronic Industries, Ltd.
|
Information Technology
|
3.0
|
|
Hermes Microvision, Inc.
|
Information Technology
|
3.0
|
|
Hong Kong Exchanges and Clearing, Ltd.
|
Financials
|
3.0
|
|
Total
|
34.6
|
|
Source: State Street Bank and Trust Company as at May 31, 2014.
|
Fund Details
|
|
NAV
|
$23.02
|
|
Market price
|
$20.34
|
|
Premium/Discount
|
-11.64%
|
|
Market cap
|
US$318.97m
|
|
Shares outstanding
|
15,682,029
|
|
Exchange listed
|
NYSE
|
|
Listing date
|
July 10, 1992
|
|
Benchmark
|
MSCI Golden Dragon Index (Total Return)
|
|
Fund Manager
|
Christina Chung
|
|
Listed and direct investment manager
|
Allianz Global Investors U.S. LLC
|
Source: State Street Bank and Trust Company as at May 31, 2014.
|
Distribution History (10 years)
|
|
Declaration
date
|
Ex-dividend
date
|
Record
date
|
Payable
date
|
Dividend/
Share
|
Income
|
Long-term
Capital
|
Short-term
Capital
|
|
13 Dec 2013
|
19 Dec 2013
|
23 Dec 2013
|
27 Dec 2013
|
3.3140
|
0.4387
|
2.8753
|
0.0000
|
|
10 Dec 2012
|
20 Dec 2012
|
24 Dec 2012
|
28 Dec 2012
|
3.2517
|
0.3473
|
2.9044
|
0.0000
|
|
8 Dec 2011
|
21 Dec 2011
|
23 Dec 2011
|
29 Dec 2011
|
2.9964
|
0.1742
|
2.8222
|
0.0000
|
|
8 Dec 2010
|
21 Dec 2010
|
24 Dec 2010
|
29 Dec 2010
|
2.2742
|
0.3746
|
1.8996
|
0.0000
|
|
9 Dec 2009
|
22 Dec 2009
|
24 Dec 2009
|
29 Dec 2009
|
0.2557
|
0.2557
|
0.0000
|
0.0000
|
|
8 Dec 2008
|
22 Dec 2008
|
24 Dec 2008
|
23 Jan 2009
|
5.8174
|
0.4813
|
5.3361
|
0.0000
|
|
7 Dec 2007
|
19 Dec 2007
|
21 Dec 2007
|
25 Jan 2008
|
12.1200
|
0.2800
|
9.0000
|
2.8400
|
|
8 Dec 2006
|
19 Dec 2006
|
21 Dec 2006
|
29 Dec 2006
|
4.0117
|
0.2996
|
2.7309
|
0.9812
|
|
9 Dec 2005
|
19 Dec 2005
|
21 Dec 2005
|
29 Dec 2005
|
2.5119
|
0.2172
|
2.2947
|
0.0000
|
|
13 Dec 2004
|
20 Dec 2004
|
22 Dec 2004
|
7 Jan 2005
|
3.5701
|
0.1963
|
3.2664
|
0.1074
|
Source: State Street Bank and Trust Company as at December 31, 2013. Dividend/Share includes Income, Long-term Capital gains and Short-term Capital gains.
2
The China Fund, Inc. (CHN)
The China Fund Inc. NAV Performance of USD $10,000 since inception (with dividends reinvested at NAV price)
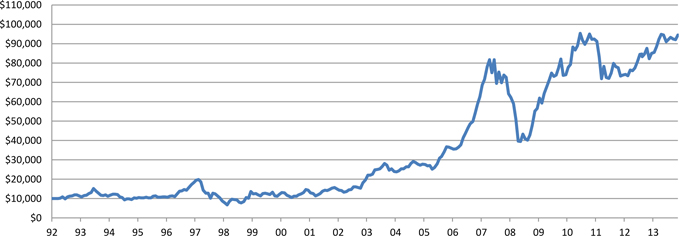
Past performance is not a guide to future returns.
Source: State Street Bank and Trust Company as at May 31, 2014.
The China Fund Inc. Premium / Discount
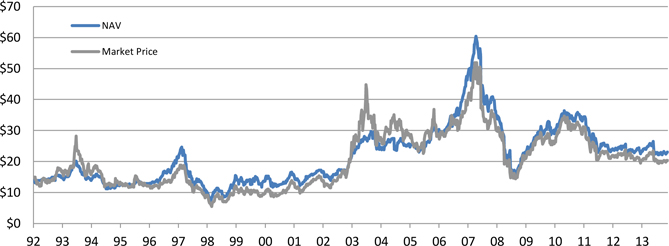
Past performance is not a guide to future returns.
Source: State Street Bank and Trust Company as at May 31, 2014.
3
The China Fund, Inc. (CHN)
Manager’s Commentary
Market Review
Chinese equity markets rebounded strongly in May. The macroeconomic data from China continued to be lackluster but showed signs of stabilization. New capital market guidelines and the announcement of other mini-stimulus measures, including social housing, railway construction and tax incentives for small and micro-sized enterprises, may alleviate concern about the economy weakening further. The HSBC China Flash Purchasing Managers’ Index (“PMI”) climbed to a five-month high of 49.7 in May. Although it did help the market sentiment, too much should not be read into the pick- up. The share price of Macau gaming stocks were adversely affected by the concerns over the clampdown on Unionpay, junket operator problems and visa restrictions, while Hong Kong property stocks rallied after the Hong Kong government made a minor adjustment to the double stamp duty rules.
In Taiwan, as economic fundamentals continued to improve, the Taiwan Taiex Index rose above 9,000 points after consolidating since late April. Technology stocks continued to lead the market.
Fund Review
The Fund underperformed the benchmark for the month. Stock selection in information technology and financials detracted the most in terms of relative returns, while stock selection in consumer discretionary contributed the most. Two of the top detractors for the month were Hermes Microvision and Beijing Enterprise. Their share prices dropped (in US dollar terms) a moderate 3.3% and 1.7% respectively. However, given the Fund’s weighting in both companies, their underperformance was meaningful to the Fund. There was no specific or material news on either company during the month to justify the underperformance. The top contributor was Advantech, a Taiwanese computer hardware company. The company reported better than expected results for the first quarter of 2014 and expects its strong sales momentum and margins to be sustainable going forward.
Key Transaction
We continued to add exposure to China Minsheng Bank. Minsheng’s H-shares are trading at a discount to the A shares and this could narrow over time with the launch of the Shanghai-HK Stock Connect scheme. The increase was financed from a reduction of exposure to Industrial & Commercial Bank of China (ICBC), with no overall change in the exposure to the Chinese banking sector for the Fund.
Outlook
We believe that the Hong Kong/China equity markets will continue to be range-bound. On the positive side, the Chinese economy is showing signs of stabilization of late. This, together with selective policy fine-tuning in an attempt to engineer an economic soft landing in China, will help to underpin market sentiment. However, the market upside could be capped by the relatively weak economic outlook in China and continued geo-political risk in the Asian region. While there are talks of reform initiatives in various areas such as State Owned Enterprise reform and the opening up of many industries to private participation, there is still a lack of clarity in the implementation of these reforms. One significant development was the announcement of Shanghai-HK Stock Connect scheme to be launched in October 2014. This is a significant milestone in the opening up of China’s financial markets and the internationalization of the renminbi. While we are positive on this development, we believe that investors will wait for more progress on reforms before they turn positive towards the Hong Kong/China equity market.
Against this backdrop, we continue to focus on structural growth sectors but will be very selective in stock positioning. We are focusing on market leaders that have relatively better execution ability. Meanwhile, as the Chinese economy is showing signs of stabilization and the global economy is showing a moderate recovery, we will selectively position the Fund’s portfolio in some cyclical stocks that we believe have been oversold and hence are at the lower end of their valuations.
In Taiwan, while we expect the demand for technology products to remain strong in the coming quarter, we are closely monitoring the supply chain inventory and end sales.
Source : Allianz Global Investors U.S. LLC as at May 31, 2014.
The China Fund, Inc. (CHN)
Portfolio Holdings
|
CUSIP
|
Security Description
|
Cost Base
|
Base MV
|
Shares
|
Percentage of Net
Assets
|
|
B57JY2909
|
China Minsheng Banking Corp., Ltd.
|
18,832,696
|
17,680,732
|
17,220,500
|
4.9
|
|
608169900
|
Beijing Enterprises Holdings, Ltd.
|
12,981,141
|
14,527,158
|
1,683,500
|
4.0
|
|
644806002
|
Hutchison Whampoa, Ltd.
|
10,763,479
|
13,053,993
|
975,000
|
3.6
|
|
688910900
|
Taiwan Semiconductor Manufacturing Co., Ltd.
|
8,470,505
|
12,414,083
|
3,115,000
|
3.4
|
|
628625907
|
Li & Fung, Ltd.
|
12,020,152
|
12,334,331
|
8,538,000
|
3.4
|
|
622657906
|
PetroChina Co., Ltd.
|
9,815,518
|
11,386,302
|
9,564,000
|
3.2
|
|
626073902
|
Delta Electronics, Inc.
|
5,764,359
|
11,204,916
|
1,723,000
|
3.1
|
|
B1L8PB906
|
Tong Hsing Electronic Industries, Ltd.
|
9,584,674
|
10,925,931
|
2,067,000
|
3.0
|
|
B3WH02907
|
Hermes Microvision, Inc.
|
7,867,215
|
10,765,203
|
269,000
|
3.0
|
|
626735906
|
Hong Kong Exchanges and Clearing, Ltd.
|
10,237,199
|
10,748,759
|
576,300
|
3.0
|
|
BMMV2K903
|
Tencent Holdings Ltd
|
4,058,182
|
10,434,011
|
743,500
|
2.9
|
|
637248907
|
MediaTek, Inc.
|
7,101,686
|
10,183,222
|
627,000
|
2.8
|
|
17313A533
|
Gree Electric Appliances, Inc. Access Product (expiration 01/16/15)
|
6,453,442
|
9,225,824
|
1,838,546
|
2.6
|
|
607355906
|
China Mobile, Ltd.
|
9,169,619
|
9,048,718
|
925,500
|
2.5
|
|
671815900
|
Qingling Motors Co., Ltd.
|
8,718,221
|
8,965,019
|
28,960,000
|
2.5
|
|
B01FLR903
|
Ping An Insurance (Group) Company of China, Ltd.
|
9,814,375
|
8,904,780
|
1,153,500
|
2.5
|
|
B00G0S903
|
CNOOC, Ltd.
|
10,305,318
|
8,825,405
|
5,160,000
|
2.4
|
|
658444906
|
Merida Industry Co., Ltd.
|
7,537,957
|
8,740,224
|
1,260,000
|
2.4
|
|
635186901
|
Digital China Holdings, Ltd.
|
14,791,043
|
8,084,247
|
8,865,000
|
2.2
|
|
B1DYPZ905
|
China Merchants Bank Co., Ltd.
|
9,119,881
|
7,942,338
|
4,312,000
|
2.2
|
|
645166901
|
Largan Precision Co., Ltd.
|
3,937,557
|
7,713,061
|
118,000
|
2.1
|
|
674347901
|
Semiconductor Manufacturing International Corp.
|
7,943,834
|
6,784,733
|
79,698,000
|
1.9
|
|
B2R2ZC908
|
CSR Corp., Ltd.
|
6,594,509
|
6,505,451
|
8,802,000
|
1.8
|
|
663094902
|
China Everbright International, Ltd.
|
2,622,673
|
6,029,347
|
4,736,000
|
1.7
|
|
600245005
|
ASM Pacific Technology, Ltd.
|
5,602,176
|
5,788,282
|
516,700
|
1.6
|
|
B58J1S907
|
Chailease Holding Co., Ltd.
|
5,196,680
|
5,353,908
|
2,132,000
|
1.5
|
|
620267906
|
Advantech Co., Ltd.
|
1,978,619
|
4,679,062
|
632,000
|
1.3
|
|
ACI009HH0
|
China Suntien Green Energy Corp., Ltd.
|
4,612,718
|
4,337,084
|
12,785,000
|
1.2
|
|
674842901
|
Ruentex Development Co., Ltd.
|
1,734,514
|
4,216,695
|
2,298,904
|
1.1
|
|
635415904
|
Epistar Corp.
|
4,361,736
|
4,109,186
|
1,812,000
|
1.1
|
|
B633D9904
|
Zhongsheng Group Holdings, Ltd.
|
3,919,603
|
3,776,159
|
2,996,500
|
1.0
|
|
ACI07LD80
|
Dongxu Optoelectronic Technology Co., Ltd. Access Product
(expiration 06/30/15)
|
2,846,947
|
3,772,094
|
2,888,280
|
1.0
|
|
17314W591
|
Jiangsu Hengrui Medicine Co., Ltd. Access Product (expiration 01/16/15)
|
3,554,123
|
3,655,841
|
696,351
|
1.0
|
|
913BMZ902
|
Ping An Insurance (Group) Company of China, Ltd. Access Product (expiration 06/30/15)
|
3,600,309
|
3,503,109
|
541,933
|
1.0
|
|
B16NHT900
|
Shui On Land, Ltd.
|
4,771,127
|
3,466,090
|
13,172,500
|
1.0
|
|
B236JB905
|
Tiangong International Co., Ltd.
|
5,449,044
|
3,384,790
|
18,480,000
|
0.9
|
|
ACI07WMD5
|
China International Travel Service Corp., Ltd. Access Product
(expiration 08/25/15)
|
3,801,918
|
3,227,844
|
626,632
|
0.9
|
|
B45BF9907
|
Sanan Optoelectronics Co., Ltd. Access Product (expiration date 02/15/16)
|
3,541,260
|
3,223,078
|
871,809
|
0.9
|
|
B0Y91C906
|
China National Building Material Co., Ltd.
|
3,862,621
|
3,194,459
|
3,538,000
|
0.9
|
|
665157905
|
Comba Telecom Systems Holdings, Ltd.
|
7,615,377
|
3,106,490
|
11,150,000
|
0.9
|
|
B688XD907
|
Beijing Jingneng Clean Energy Co., Ltd.
|
3,525,009
|
2,818,853
|
6,244,000
|
0.8
|
|
B1G1QD902
|
Industrial & Commercial Bank of China, Ltd.
|
2,696,755
|
2,800,472
|
4,325,000
|
0.8
|
|
ACI0873X6
|
Shanghai Jahwa United Co., Ltd. Access Product (expiration 06/12/17)
|
2,654,660
|
2,416,445
|
460,100
|
0.7
|
|
651795908
|
Natural Beauty Bio-Technology, Ltd.
|
4,906,910
|
2,246,176
|
47,710,000
|
0.6
|
|
42751U205
|
Hermes Microvision, Inc. GDR
|
1,368,073
|
1,875,766
|
46,900
|
0.5
|
|
B5SRR0900
|
Shanghai Jahwa United Co., Ltd. Access Product (expiration 01/16/15)
|
1,113,416
|
1,017,312
|
193,700
|
0.3
|
|
ACI0090H8
|
Zong Su Foods
|
15,000,034
|
-
|
2,677
|
0.0
|
Source: State Street Bank and Trust Company as at May 31, 2014.
5
The China Fund, Inc. (CHN)
Important Information
The Fund seeks to achieve its objective through investment in the equity securities of companies and other entities with significant assets, investments, production activities, trading or other business interests in China or which derive a significant part of their revenue from China. Investing in non-U.S. securities entails additional risks, including political and economic risk and the risk of currency fluctuations, as well as lower liquidity. These risks, which can result in greater price volatility, will generally be enhanced in less diversified funds that concentrate investments in a particular geographic region.
The information contained herein has been obtained from sources believed to be reliable but Allianz Global Investors U.S. LLC and its affiliates do not warrant the information to be accurate, complete or reliable. The opinions expressed herein are subject to change at any time and without notice. Past performance is not indicative of future results. This material is not intended as an offer or solicitation for the purchase or sale of any financial instrument. Investors should consider the investment objectives, risks, charges and expenses of any mutual fund carefully before investing. This and other information is contained in the fund’s annual and semiannual reports, proxy statement and other fund information, which may be obtained by contacting your financial advisor or visiting the fund’s websi te at www.chinafundinc.com. This information is unaudited and is intended for informational purposes only. It is presented only to provide information on the Fund’s holdings, performance and strategies. The Fund is a closed-end exchange traded management investment company. This material is presented only to provide information and is not intended for trading purposes. Closed-end funds, unlike open-end funds, are not continuously offered. After the initial public offering by a closed-end fund, its shares can be purchased and sold on the open market through a stock exchange, where shares may trade at a premium or a discount. The market price of holdings is subject to change daily.
6