Attached files
| file | filename |
|---|---|
| 8-K - 8-K - Mead Johnson Nutrition Co | a14-15481_18k.htm |
Exhibit 99.1
|
|
Deutsche Bank Conference 18 June 2014 Paris Kasper Jakobsen President and CEO Pete Leemputte Executive VP and CFO |

|
|
Safe Harbor Statement Forward-Looking Statements Certain statements in this presentation are forward-looking as defined in the Private Securities Litigation Reform Act of 1995. These forward-looking statements may be identified by the fact they use words such as “should,” “expect,” “anticipate,” “estimate,” “target,” “may,” “project,” “guidance,” “intend,” “plan,” “believe” and other words and terms of similar meaning and expression. Such statements are likely to relate to, among other things, a discussion of goals, plans and projections regarding financial position, results of operations, cash flows, market position, product development, product approvals, sales efforts, expenses, capital expenditures, performance or results of current and anticipated products and the outcome of contingencies such as legal proceedings and financial results. Forward-looking statements can also be identified by the fact that they do not relate strictly to historical or current facts. Such forward-looking statements are based on current expectations that involve inherent risks, uncertainties and assumptions that may cause actual results to differ materially from expectations as of the date of this presentation. These risks include, but are not limited to: (1) the ability to sustain brand strength, particularly the Enfa family of brands; (2) the effect on the company's reputation of real or perceived quality issues; (3) the effect of regulatory restrictions related to the company’s products; (4) the adverse effect of commodity costs; (5) increased competition from branded, private label, store and economy-branded products; (6) the effect of an economic downturn on consumers' purchasing behavior and customers' ability to pay for product; (7) inventory reductions by customers; (8) the adverse effect of changes in foreign currency exchange rates; (9) the effect of changes in economic, political and social conditions in the markets where we operate; (10) changing consumer preferences; (11) the possibility of changes in the Women, Infant and Children (WIC) program, or participation in WIC; (12) legislative, regulatory or judicial action that may adversely affect the company's ability to advertise its products or maintain product margins; and (13) the ability to develop and market new, innovative products. For additional information regarding these and other factors, see the company’s filings with the United States Securities and Exchange Commission (the SEC), including its most recent Annual Report on Form 10-K, which filings are available upon request from the SEC or at www.meadjohnson.com. The company cautions readers not to place undue reliance on any forward-looking statements, which speak only as of the date made. The company undertakes no obligation to publicly update any forward-looking statement, whether as a result of new information, future events or other otherwise. Factors Affecting Comparability—Non-GAAP Financial Measures This presentation contains non-GAAP financial measures, which may include non-GAAP net sales, gross profit, certain components of operating expenses including selling, general and administrative, research and development and other expenses-net, EBIT, earnings and earnings per share information. The items included in GAAP measures, but excluded for the purpose of determining the above listed non-GAAP financial measures, include significant income/expenses not indicative of on-going results, including the related tax effect. The above listed non-GAAP measures represent an indication of the company’s underlying operating results and are intended to enhance an investor’s overall understanding of the company’s financial performance. In addition, this information is among the primary indicators the company uses as a basis for evaluating company performance, setting incentive compensation targets and planning and forecasting of future periods. This information is not intended to be considered in isolation or as a substitute for financial measures prepared in accordance with GAAP. Tables that reconcile non-GAAP to GAAP disclosure are included in the Appendix. For more information: Kathy MacDonald Vice President – Investor Relations Mead Johnson Nutrition Company 847-832-2182 kathy.macdonald@mjn.com June 2014 1 |

|
|
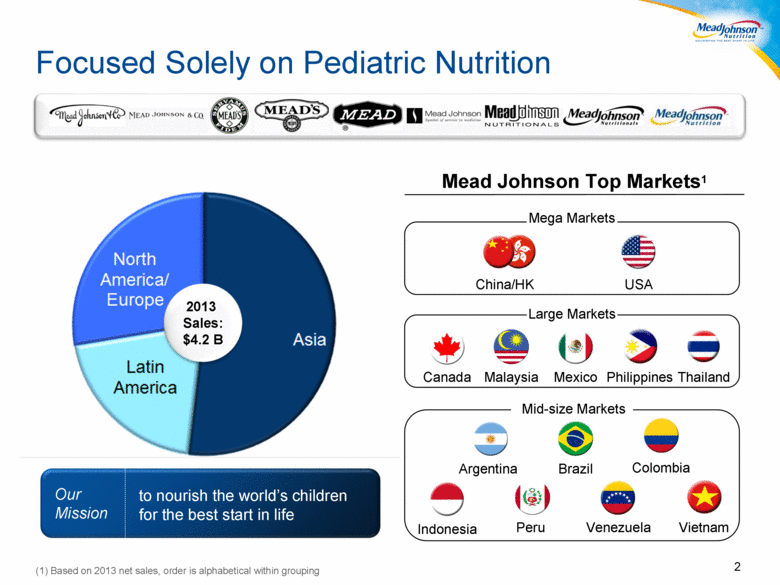
Focused Solely on Pediatric Nutrition Our Mission to nourish the world’s children for the best start in life 2013 Sales: $4.2 B (1) Based on 2013 net sales, order is alphabetical within grouping 2 Mead Johnson Top Markets1 Our Vision Mega Markets Mexico Canada Large Markets Malaysia Philippines Thailand Argentina Mid-size Markets Brazil Indonesia Peru Venezuela Vietnam USA China/HK Colombia |
|
|
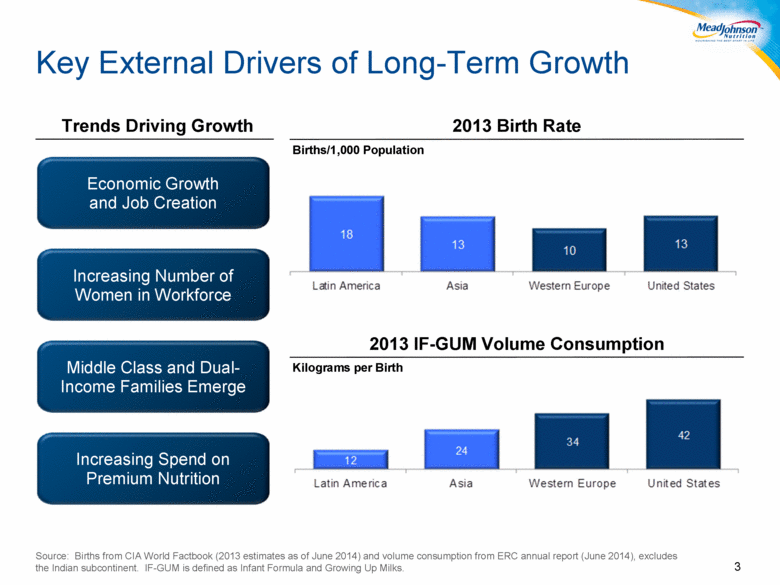
Key External Drivers of Long-Term Growth 3 Source: Births from CIA World Factbook (2013 estimates as of June 2014) and volume consumption from ERC annual report (June 2014), excludes the Indian subcontinent. IF-GUM is defined as Infant Formula and Growing Up Milks. Economic Growth and Job Creation Increasing Spend on Premium Nutrition Increasing Number of Women in Workforce Middle Class and Dual-Income Families Emerge Trends Driving Growth Kilograms per Birth Births/1,000 Population 2013 Birth Rate 2013 IF-GUM Volume Consumption |
|
|
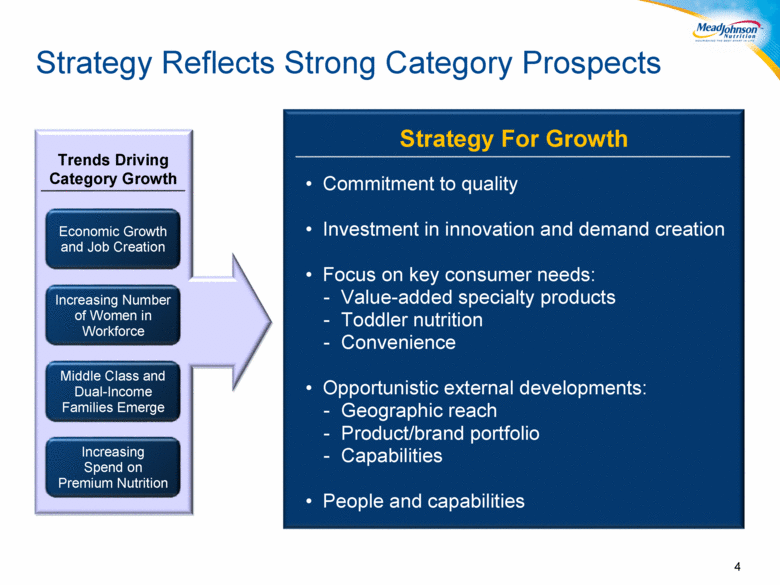
Strategy Reflects Strong Category Prospects 4 Economic Growth and Job Creation Increasing Spend on Premium Nutrition Increasing Number of Women in Workforce Middle Class and Dual-Income Families Emerge Trends Driving Category Growth Commitment to quality Investment in innovation and demand creation Focus on key consumer needs: Value-added specialty products Toddler nutrition Convenience Opportunistic external developments: Geographic reach Product/brand portfolio Capabilities People and capabilities Strategy For Growth |
|
|
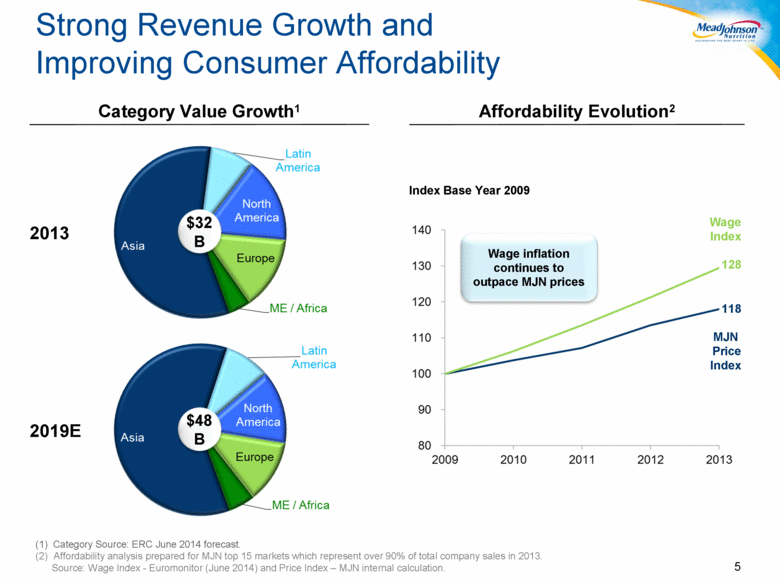
5 (1) Category Source: ERC June 2014 forecast. Affordability analysis prepared for MJN top 15 markets which represent over 90% of total company sales in 2013. Source: Wage Index - Euromonitor (June 2014) and Price Index – MJN internal calculation. Wage Index 128 118 MJN Price Index Wage inflation continues to outpace MJN prices Category Value Growth1 Affordability Evolution2 Index Base Year 2009 2013 $32B Strong Revenue Growth and Improving Consumer Affordability 2019E $48 B |
|
|
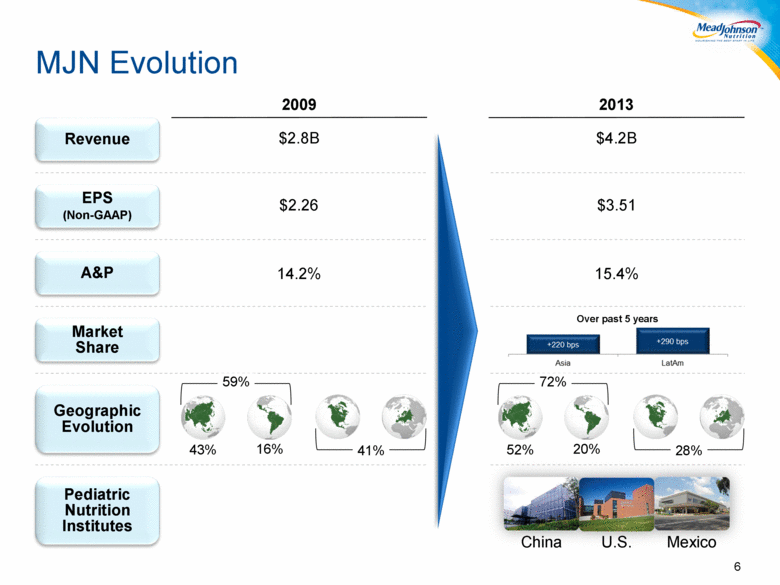
MJN Evolution 6 Revenue EPS (Non-GAAP) Geographic Evolution Pediatric Nutrition Institutes $2.8B $2.26 2009 2013 $4.2B $3.51 16% 43% 59% 20% 52% 72% A&P Market Share 14.2% 15.4% Over past 5 years China U.S. Mexico 41% 28% |
|
|
Scientific Excellence 7 R&D spending increased from 2% to ~ 2.5% of sales Annual spend now $100+ million Technologies Applying scientific insight Research Advancing leading edge research Exchange Collaborating within scientific communities Education Sharing knowledge of breakthroughs |

|
|
Translating Insights into Nutrition Solutions 8 Growing Up Milks The challenge faced by many toddlers: Consume only 1/3 of recommended daily DHA Ingest foods that cause glucose levels to spike Our product solution: DHA at expert recommended levels Clinically proven steady glucose supply Formulations References: Growing Up Milks: Proprietary Information – Blood glucose responses elicited by the five different test meals under investigation by MJN. Specialty Products: 1. Berni Canani R et al. J Pediatr. 2013 Apr 10. pii: S0022-3476(13)00284-9. doi: 10.1016/j.jpeds.2013.03.008. [Epub ahead of print.] 2. Lothe L et al. Pediatrics. 1989;83:262-266. 3. Wood RA. Pediatrics. 2003;111:1631-1637. 4. Høst A et al. Allergy. 1990;45:587-596. 5. Bishop JM et al. J Pediatr. 1990;116:862-867. 6. Koletzko S et al. J Pediatr Gastroenterol Nutr. 2012;55:221-229. Specialty Products The challenge faced by some infants: Long-lasting cow’s milk allergy Our product solution: Nutramigen LGG helped 4 out of 5 infants build a tolerance within 12 months |

|
|
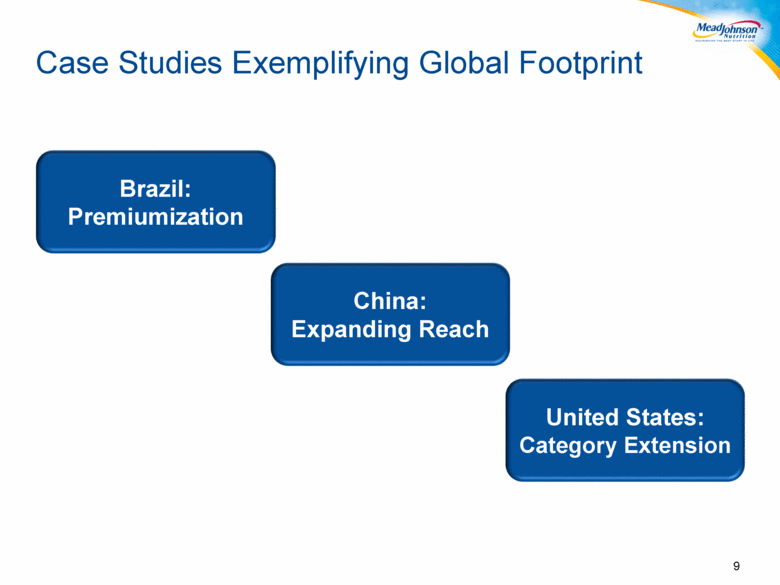
9 Brazil: Premiumization United States: Category Extension China: Expanding Reach Case Studies Exemplifying Global Footprint |
|
|
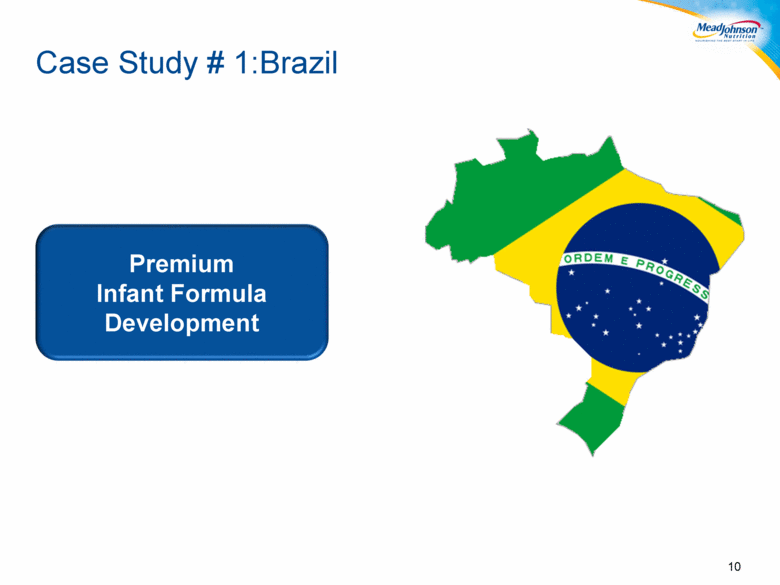
Case Study # 1:Brazil 10 Premium Infant Formula Development |
|
|
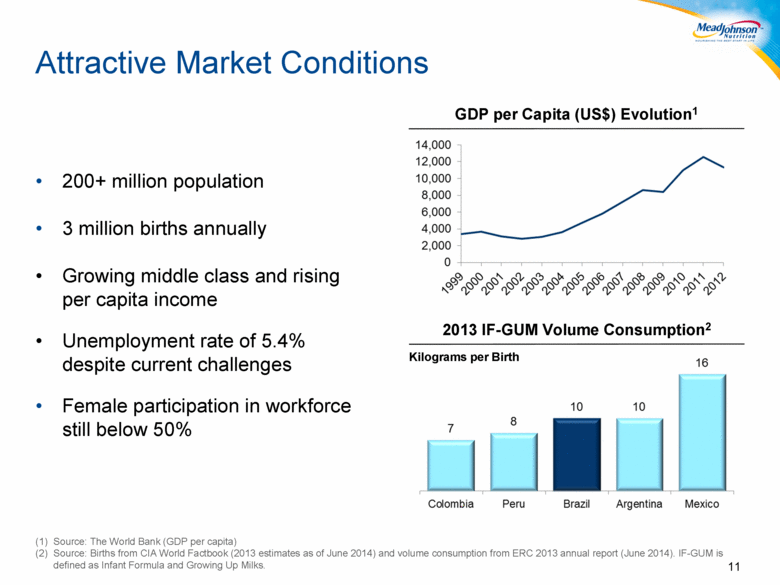
Attractive Market Conditions 11 200+ million population 3 million births annually Growing middle class and rising per capita income Unemployment rate of 5.4% despite current challenges Female participation in workforce still below 50% GDP per Capita (US$) Evolution1 2013 IF-GUM Volume Consumption2 Source: The World Bank (GDP per capita) Source: Births from CIA World Factbook (2013 estimates as of June 2014) and volume consumption from ERC 2013 annual report (June 2014). IF-GUM is defined as Infant Formula and Growing Up Milks. Kilograms per Birth |
|
|
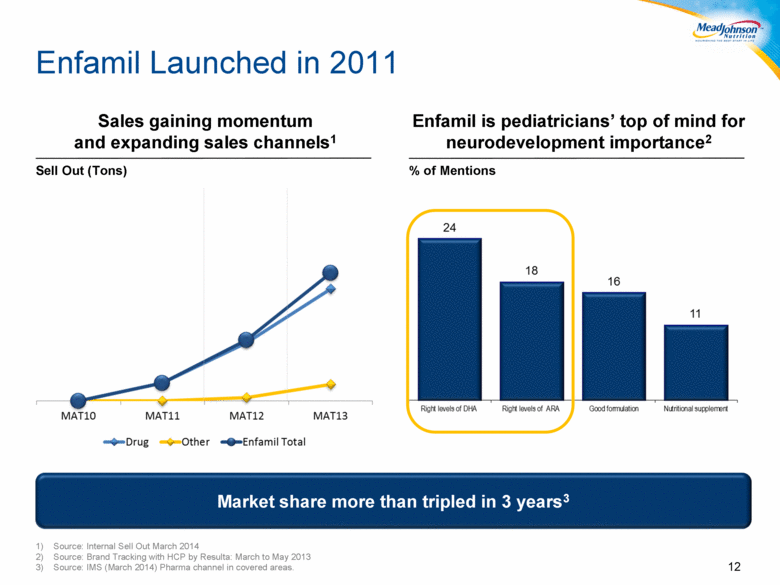
Sales gaining momentum and expanding sales channels1 Enfamil Launched in 2011 12 Enfamil is pediatricians’ top of mind for neurodevelopment importance2 Source: Internal Sell Out March 2014 Source: Brand Tracking with HCP by Resulta: March to May 2013 Source: IMS (March 2014) Pharma channel in covered areas. % of Mentions Sell Out (Tons) Market share more than tripled in 3 years3 |
|
|
City and Channel Development Case Study # 2: China 13 |
|
|
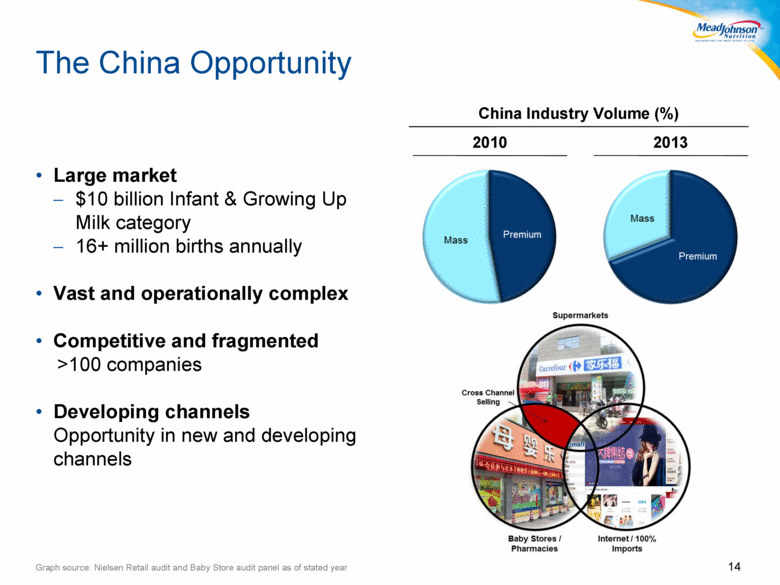
The China Opportunity Large market $10 billion Infant & Growing Up Milk category 16+ million births annually Vast and operationally complex Competitive and fragmented >100 companies Developing channels Opportunity in new and developing channels Graph source: Nielsen Retail audit and Baby Store audit panel as of stated year 14 China Industry Volume (%) 2010 2013 |
|
|
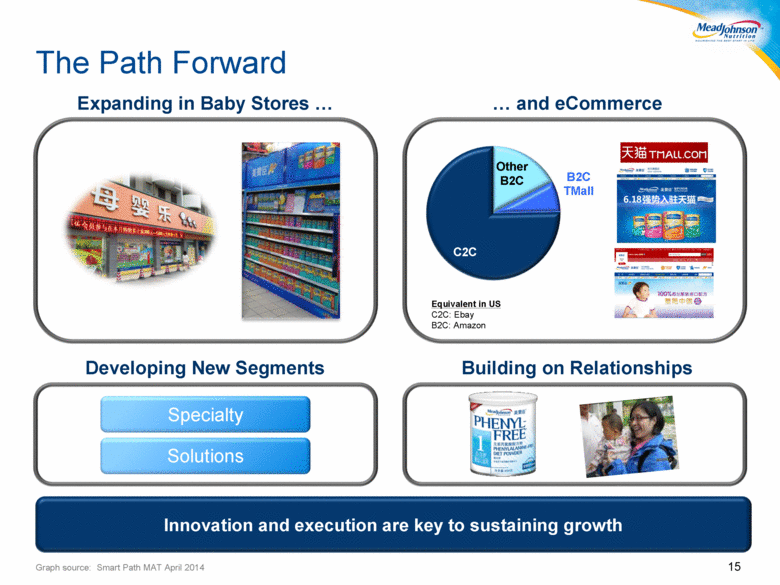
The Path Forward Developing New Segments Building on Relationships Expanding in Baby Stores and eCommerce Specialty Solutions 15 Innovation and execution are key to sustaining growth Equivalent in US C2C: Ebay B2C: Amazon C2C Other B2C B2C TMall Graph source: Smart Path MAT April 2014 |
|
|
Case Study # 3: United States 16 Investing in Innovation and Children’s Category |
|
|
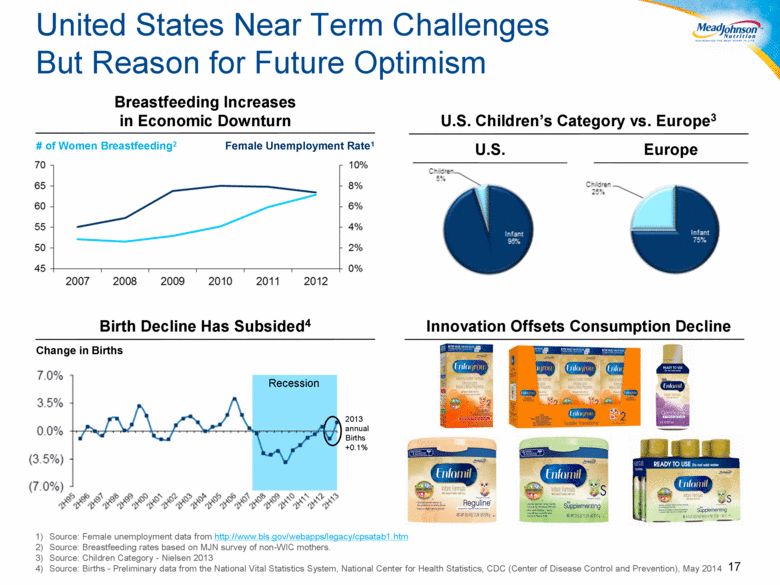
United States Near Term Challenges But Reason for Future Optimism 17 Source: Female unemployment data from http://www.bls.gov/webapps/legacy/cpsatab1.htm Source: Breastfeeding rates based on MJN survey of non-WIC mothers. Source: Children Category - Nielsen 2013 Source: Births - Preliminary data from the National Vital Statistics System, National Center for Health Statistics, CDC (Center of Disease Control and Prevention), May 2014 Change in Births # of Women Breastfeeding2 Recession U.S. Children’s Category vs. Europe3 U.S. Europe Breastfeeding Increases in Economic Downturn Birth Decline Has Subsided4 Innovation Offsets Consumption Decline 2013 annual Births +0.1% Female Unemployment Rate1 |
|
|
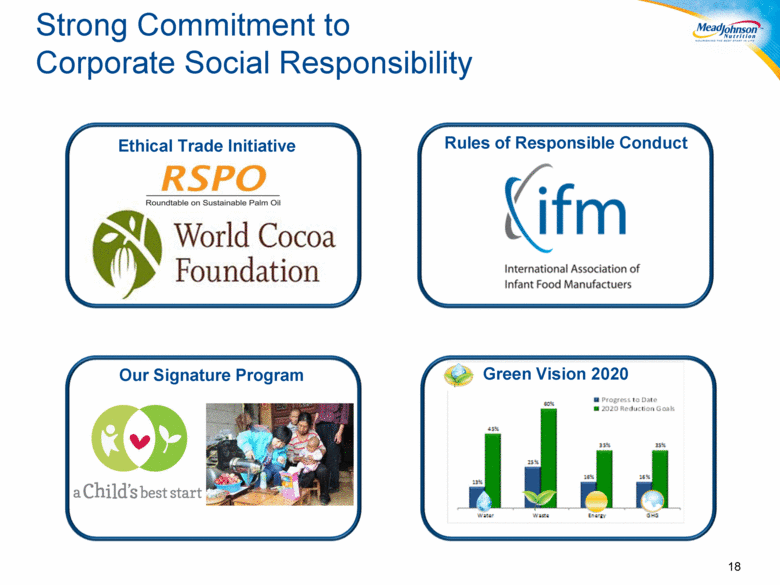
Strong Commitment to Corporate Social Responsibility 18 Ethical Trade Initiative Green Vision 2020 Our Signature Program Rules of Responsible Conduct |
|
|
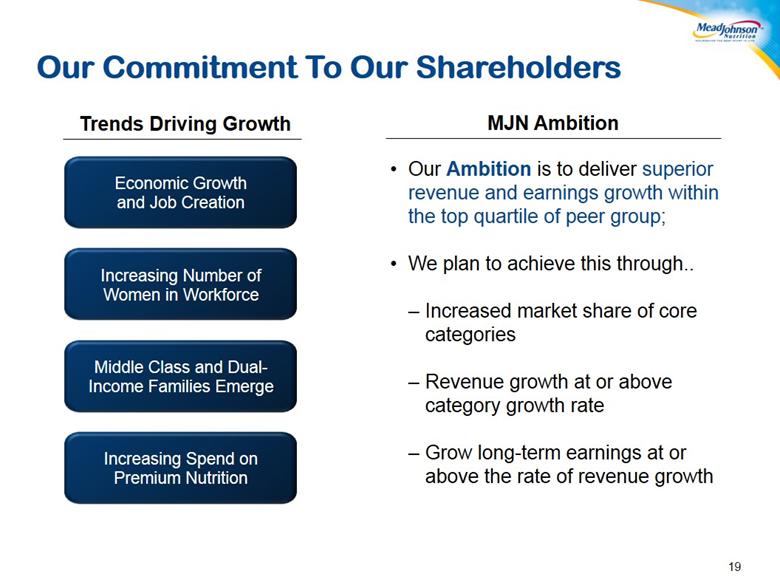
19 Our Commitment To Our Shareholders Trends Driving Growth MJN Ambition Economic Growth and Job Creation Increasing Number of Women in Workforce Middle Class and Dual-Income Families Emerge Increasing Spend on Premium Nutrition Our Ambition is to deliver superior revenue and earnings growth within the top quartile of peer group; We plan to achieve this through.. Increased market share of core categories Revenue growth at or above category growth rate Grow long-term earnings at or above the rate of revenue growth |
|
|
19 Financial Highlights |

|
|
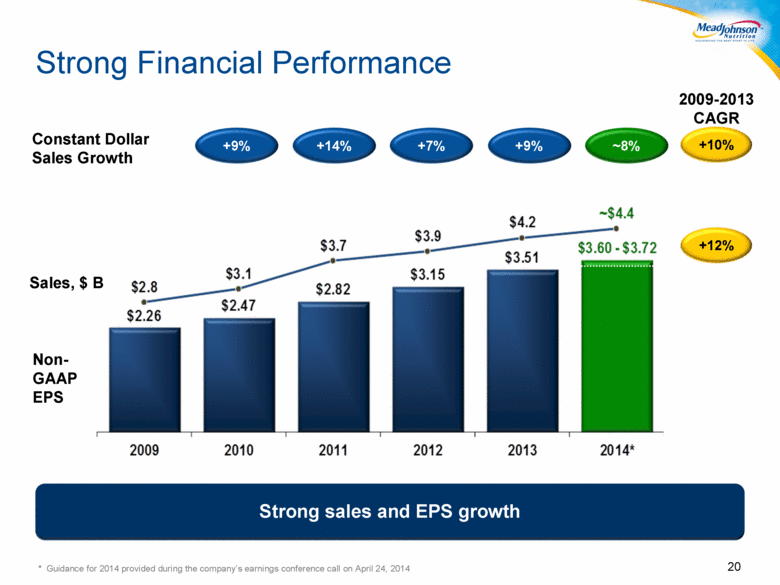
Strong Financial Performance 20 * Guidance for 2014 provided during the company’s earnings conference call on April 24, 2014 Strong sales and EPS growth +10% 2009-2013 CAGR +12% Sales, $ B Non-GAAP EPS Constant Dollar Sales Growth ~8% +9% +14% +9% +7% |
|
|
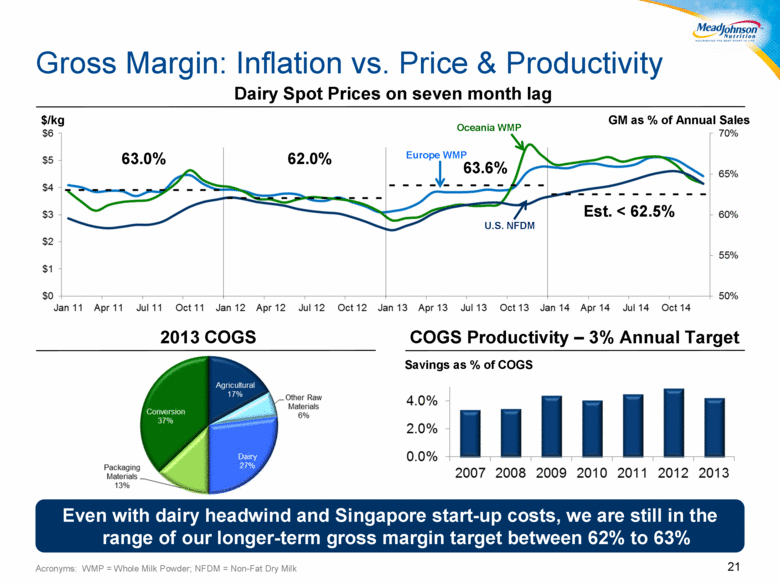
Gross Margin: Inflation vs. Price & Productivity Acronyms: WMP = Whole Milk Powder; NFDM = Non-Fat Dry Milk Savings as % of COGS 2013 COGS 21 Dairy Spot Prices on seven month lag $/kg Oceania WMP GM as % of Annual Sales Europe WMP U.S. NFDM 63.0% 62.0% Est. < 62.5% 63.6% Even with dairy headwind and Singapore start-up costs, we are still in the range of our longer-term gross margin target between 62% to 63% COGS Productivity – 3% Annual Target |
|
|
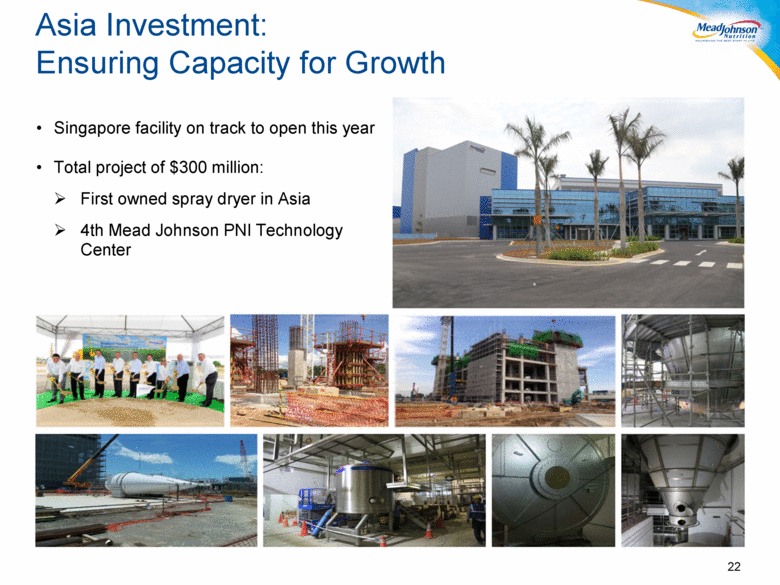
Asia Investment: Ensuring Capacity for Growth 22 Singapore facility on track to open this year Total project of $300 million: First owned spray dryer in Asia 4th Mead Johnson PNI Technology Center |
|
|
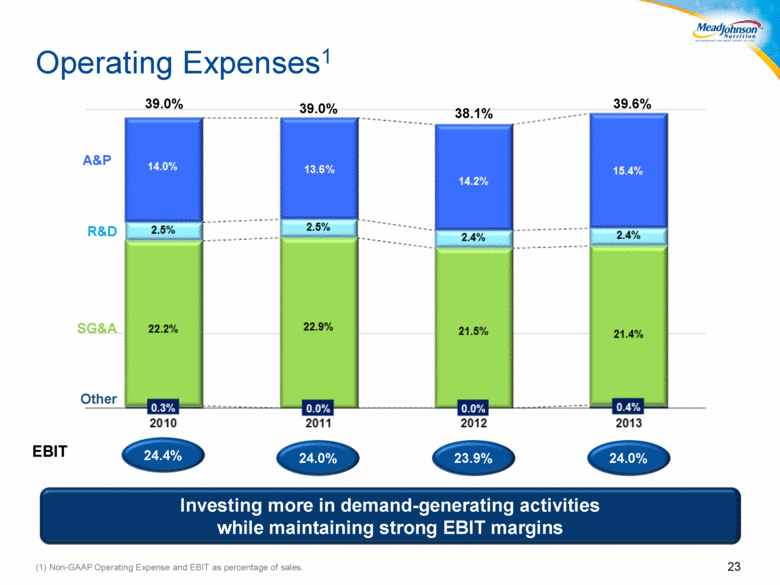
Operating Expenses1 (1) Non-GAAP Operating Expense and EBIT as percentage of sales. 23 39.0% 39.0% 38.1% 39.6% A&P R&D SG&A Other Investing more in demand-generating activities while maintaining strong EBIT margins EBIT 24.0% 23.9% 24.0% 24.4% |
|
|
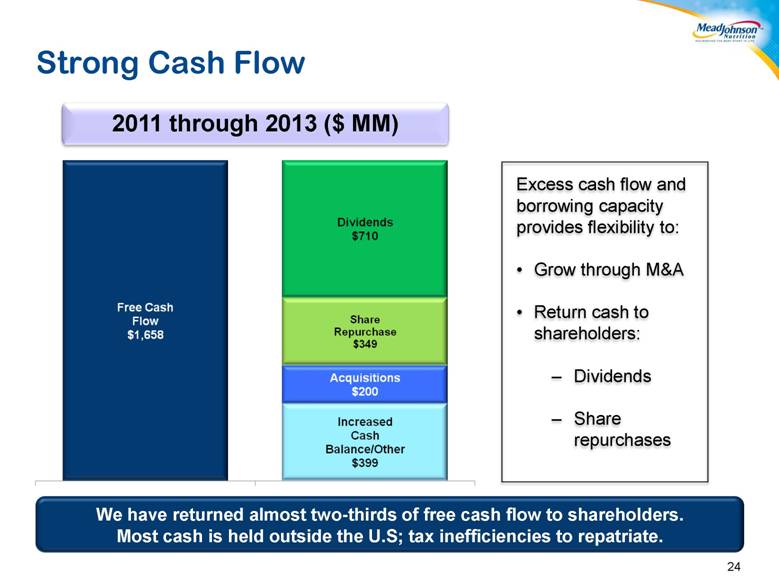
Strong Cash Flow 24 Excess cash flow and borrowing capacity provides flexibility to: Grow through M&A Return cash to shareholders: Dividends Share repurchases 2011 through 2013 ($ MM) We have returned almost two-thirds of free cash flow to shareholders. Most cash is held outside the U.S; tax inefficiencies to repatriate. |
|
|
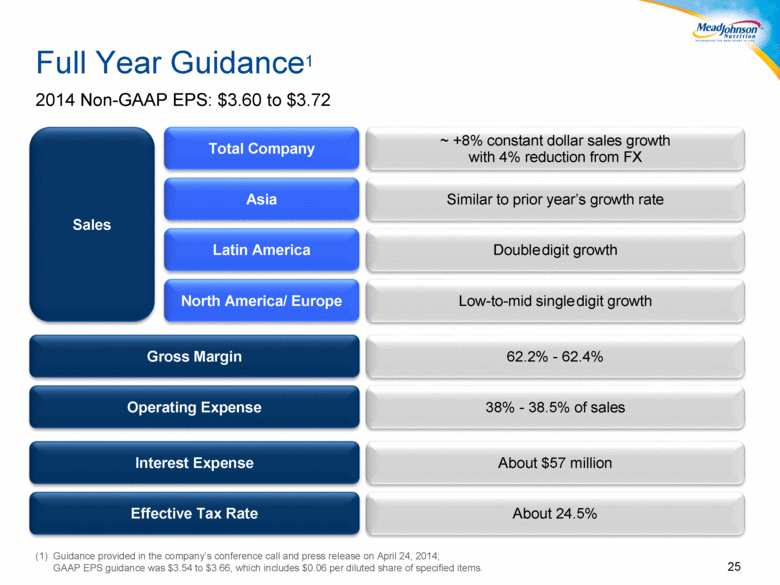
Full Year Guidance1 2014 Non-GAAP EPS: $3.60 to $3.72 25 Guidance provided in the company’s conference call and press release on April 24, 2014; GAAP EPS guidance was $3.54 to $3.66, which includes $0.06 per diluted share of specified items. ~ +8% constant dollar sales growth with 4% reduction from FX Similar to prior year’s growth rate Double digit growth Low-to-mid single digit growth 62.2% - 62.4% 38% - 38.5% of sales About $57 million About 24.5% Asia Latin America North America/ Europe Gross Margin Operating Expense Interest Expense Effective Tax Rate Sales |
|
|
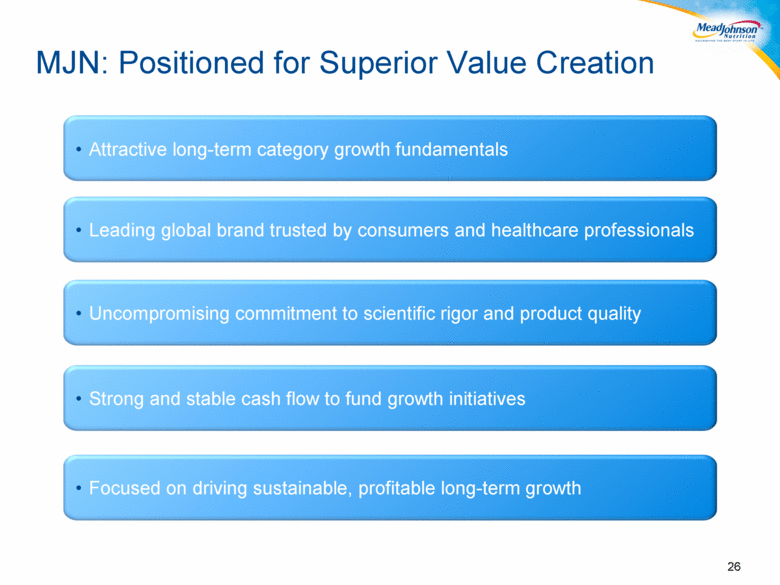
Attractive long-term category growth fundamentals Strong and stable cash flow to fund growth initiatives MJN: Positioned for Superior Value Creation 26 Leading global brand trusted by consumers and healthcare professionals Uncompromising commitment to scientific rigor and product quality Focused on driving sustainable, profitable long-term growth |
|
|
27 Appendix |
|
|
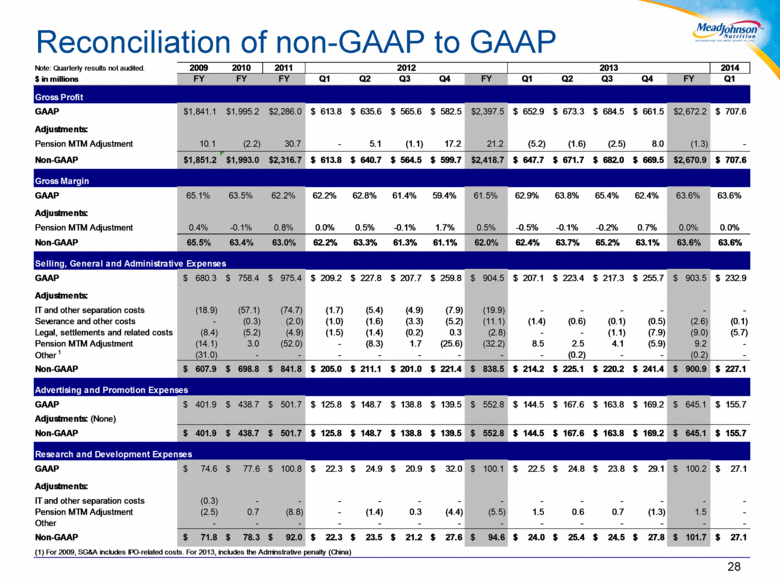
28 Reconciliation of non-GAAP to GAAP Note: Quarterly results not audited. 2014 $ in millions FY FY FY Q1 Q2 Q3 Q4 FY Q1 Q2 Q3 Q4 FY Q1 Gross Profit GAAP $1,841.1 $1,995.2 $2,286.0 $ 613.8 $ 635.6 $ 565.6 $ 582.5 $2,397.5 $ 652.9 $ 673.3 $ 684.5 $ 661.5 $2,672.2 $ 707.6 Adjustments: Pension MTM Adjustment 10.1 (2.2) 30.7 - 5.1 (1.1) 17.2 21.2 (5.2) (1.6) (2.5) 8.0 (1.3) - Non-GAAP $1,851.2 $1,993.0 $2,316.7 $ 613.8 $ 640.7 $ 564.5 $ 599.7 $2,418.7 $ 647.7 $ 671.7 $ 682.0 $ 669.5 $2,670.9 $ 707.6 Gross Margin GAAP 65.1% 63.5% 62.2% 62.2% 62.8% 61.4% 59.4% 61.5% 62.9% 63.8% 65.4% 62.4% 63.6% 63.6% Adjustments: Pension MTM Adjustment 0.4% -0.1% 0.8% 0.0% 0.5% -0.1% 1.7% 0.5% -0.5% -0.1% -0.2% 0.7% 0.0% 0.0% Non-GAAP 65.5% 63.4% 63.0% 62.2% 63.3% 61.3% 61.1% 62.0% 62.4% 63.7% 65.2% 63.1% 63.6% 63.6% Selling, General and Administrative Expenses GAAP $ 680.3 $ 758.4 $ 975.4 $ 209.2 $ 227.8 $ 207.7 $ 259.8 $ 904.5 $ 207.1 $ 223.4 $ 217.3 $ 255.7 $ 903.5 $ 232.9 Adjustments: IT and other separation costs (18.9) (57.1) (74.7) (1.7) (5.4) (4.9) (7.9) (19.9) - - - - - - Severance and other costs - (0.3) (2.0) (1.0) (1.6) (3.3) (5.2) (11.1) (1.4) (0.6) (0.1) (0.5) (2.6) (0.1) Legal, settlements and related costs (8.4) (5.2) (4.9) (1.5) (1.4) (0.2) 0.3 (2.8) - - (1.1) (7.9) (9.0) (5.7) Pension MTM Adjustment (14.1) 3.0 (52.0) - (8.3) 1.7 (25.6) (32.2) 8.5 2.5 4.1 (5.9) 9.2 - Other 1 (31.0) - - - - - - - - (0.2) - - (0.2) - Non-GAAP $ 607.9 $ 698.8 $ 841.8 $ 205.0 $ 211.1 $ 201.0 $ 221.4 $ 838.5 $ 214.2 $ 225.1 $ 220.2 $ 241.4 $ 900.9 $ 227.1 Advertising and Promotion Expenses GAAP $ 401.9 $ 438.7 $ 501.7 $ 125.8 $ 148.7 $ 138.8 $ 139.5 $ 552.8 $ 144.5 $ 167.6 $ 163.8 $ 169.2 $ 645.1 $ 155.7 Adjustments: (None) Non-GAAP $ 401.9 $ 438.7 $ 501.7 $ 125.8 $ 148.7 $ 138.8 $ 139.5 $ 552.8 $ 144.5 $ 167.6 $ 163.8 $ 169.2 $ 645.1 $ 155.7 Research and Development Expenses GAAP $ 74.6 $ 77.6 $ 100.8 $ 22.3 $ 24.9 $ 20.9 $ 32.0 $ 100.1 $ 22.5 $ 24.8 $ 23.8 $ 29.1 $ 100.2 $ 27.1 Adjustments: IT and other separation costs (0.3) - - - - - - - - - - - - - Pension MTM Adjustment (2.5) 0.7 (8.8) - (1.4) 0.3 (4.4) (5.5) 1.5 0.6 0.7 (1.3) 1.5 - Other - - - - - - - - - - - - - - Non-GAAP $ 71.8 $ 78.3 $ 92.0 $ 22.3 $ 23.5 $ 21.2 $ 27.6 $ 94.6 $ 24.0 $ 25.4 $ 24.5 $ 27.8 $ 101.7 $ 27.1 (1) For 2009, SG&A includes IPO-related costs. For 2013, includes the Adminstrative penalty (China) 2013 2012 2011 2010 2009 |
|
|
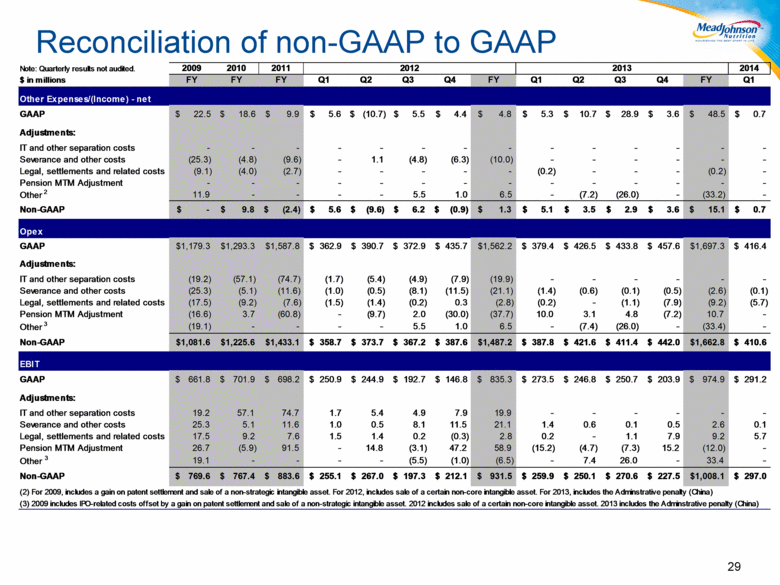
Reconciliation of non-GAAP to GAAP 29 Note: Quarterly results not audited. 2014 $ in millions FY FY FY Q1 Q2 Q3 Q4 FY Q1 Q2 Q3 Q4 FY Q1 Other Expenses/(Income) - net GAAP $ 22.5 $ 18.6 $ 9.9 $ 5.6 $ (10.7) $ 5.5 $ 4.4 $ 4.8 $ 5.3 $ 10.7 $ 28.9 $ 3.6 $ 48.5 $ 0.7 Adjustments: IT and other separation costs - - - - - - - - - - - - - - Severance and other costs (25.3) (4.8) (9.6) - 1.1 (4.8) (6.3) (10.0) - - - - - - Legal, settlements and related costs (9.1) (4.0) (2.7) - - - - - (0.2) - - - (0.2) - Pension MTM Adjustment - - - - - - - - - - - - - - Other 2 11.9 - - - - 5.5 1.0 6.5 - (7.2) (26.0) - (33.2) - Non-GAAP $ - $ 9.8 $ (2.4) $ 5.6 $ (9.6) $ 6.2 $ (0.9) $ 1.3 $ 5.1 $ 3.5 $ 2.9 $ 3.6 $ 15.1 $ 0.7 Opex GAAP $1,179.3 $1,293.3 $1,587.8 $ 362.9 $ 390.7 $ 372.9 $ 435.7 $1,562.2 $ 379.4 $ 426.5 $ 433.8 $ 457.6 $1,697.3 $ 416.4 Adjustments: IT and other separation costs (19.2) (57.1) (74.7) (1.7) (5.4) (4.9) (7.9) (19.9) - - - - - - Severance and other costs (25.3) (5.1) (11.6) (1.0) (0.5) (8.1) (11.5) (21.1) (1.4) (0.6) (0.1) (0.5) (2.6) (0.1) Legal, settlements and related costs (17.5) (9.2) (7.6) (1.5) (1.4) (0.2) 0.3 (2.8) (0.2) - (1.1) (7.9) (9.2) (5.7) Pension MTM Adjustment (16.6) 3.7 (60.8) - (9.7) 2.0 (30.0) (37.7) 10.0 3.1 4.8 (7.2) 10.7 - Other 3 (19.1) - - - - 5.5 1.0 6.5 - (7.4) (26.0) - (33.4) - Non-GAAP $1,081.6 $1,225.6 $1,433.1 $ 358.7 $ 373.7 $ 367.2 $ 387.6 $1,487.2 $ 387.8 $ 421.6 $ 411.4 $ 442.0 $1,662.8 $ 410.6 EBIT GAAP $ 661.8 $ 701.9 $ 698.2 $ 250.9 $ 244.9 $ 192.7 $ 146.8 $ 835.3 $ 273.5 $ 246.8 $ 250.7 $ 203.9 $ 974.9 $ 291.2 Adjustments: IT and other separation costs 19.2 57.1 74.7 1.7 5.4 4.9 7.9 19.9 - - - - - - Severance and other costs 25.3 5.1 11.6 1.0 0.5 8.1 11.5 21.1 1.4 0.6 0.1 0.5 2.6 0.1 Legal, settlements and related costs 17.5 9.2 7.6 1.5 1.4 0.2 (0.3) 2.8 0.2 - 1.1 7.9 9.2 5.7 Pension MTM Adjustment 26.7 (5.9) 91.5 - 14.8 (3.1) 47.2 58.9 (15.2) (4.7) (7.3) 15.2 (12.0) - Other 3 19.1 - - - - (5.5) (1.0) (6.5) - 7.4 26.0 - 33.4 - Non-GAAP $ 769.6 $ 767.4 $ 883.6 $ 255.1 $ 267.0 $ 197.3 $ 212.1 $ 931.5 $ 259.9 $ 250.1 $ 270.6 $ 227.5 $1,008.1 $ 297.0 (2) For 2009, includes a gain on patent settlement and sale of a non-strategic intangible asset. For 2012, includes sale of a certain non-core intangible asset. For 2013, includes the Adminstrative penalty (China) (3) 2009 includes IPO-related costs offset by a gain on patent settlement and sale of a non-strategic intangible asset. 2012 includes sale of a certain non-core intangible asset. 2013 includes the Adminstrative penalty (China) 2013 2012 2011 2010 2009 |
|
|
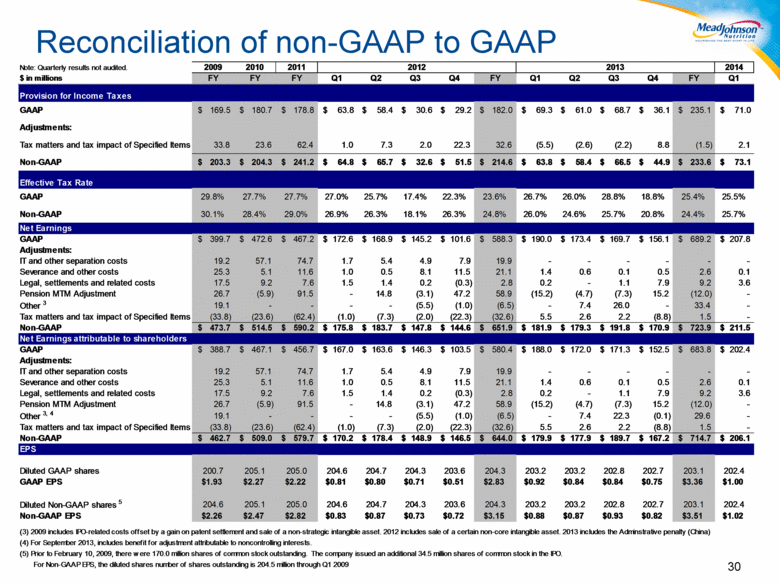
Reconciliation of non-GAAP to GAAP 30 Note: Quarterly results not audited. 2014 $ in millions FY FY FY Q1 Q2 Q3 Q4 FY Q1 Q2 Q3 Q4 FY Q1 GAAP $ 169.5 $ 180.7 $ 178.8 $ 63.8 $ 58.4 $ 30.6 $ 29.2 $ 182.0 $ 69.3 $ 61.0 $ 68.7 $ 36.1 $ 235.1 $ 71.0 Adjustments: Tax matters and tax impact of Specified Items 33.8 23.6 62.4 1.0 7.3 2.0 22.3 32.6 (5.5) (2.6) (2.2) 8.8 (1.5) 2.1 Non-GAAP $ 203.3 $ 204.3 $ 241.2 $ 64.8 $ 65.7 $ 32.6 $ 51.5 $ 214.6 $ 63.8 $ 58.4 $ 66.5 $ 44.9 $ 233.6 $ 73.1 GAAP 29.8% 27.7% 27.7% 27.0% 25.7% 17.4% 22.3% 23.6% 26.7% 26.0% 28.8% 18.8% 25.4% 25.5% Non-GAAP 30.1% 28.4% 29.0% 26.9% 26.3% 18.1% 26.3% 24.8% 26.0% 24.6% 25.7% 20.8% 24.4% 25.7% GAAP $ 399.7 $ 472.6 $ 467.2 $ 172.6 $ 168.9 $ 145.2 $ 101.6 $ 588.3 $ 190.0 $ 173.4 $ 169.7 $ 156.1 $ 689.2 $ 207.8 Adjustments: IT and other separation costs 19.2 57.1 74.7 1.7 5.4 4.9 7.9 19.9 - - - - - - Severance and other costs 25.3 5.1 11.6 1.0 0.5 8.1 11.5 21.1 1.4 0.6 0.1 0.5 2.6 0.1 Legal, settlements and related costs 17.5 9.2 7.6 1.5 1.4 0.2 (0.3) 2.8 0.2 - 1.1 7.9 9.2 3.6 Pension MTM Adjustment 26.7 (5.9) 91.5 - 14.8 (3.1) 47.2 58.9 (15.2) (4.7) (7.3) 15.2 (12.0) - Other 3 19.1 - - - - (5.5) (1.0) (6.5) - 7.4 26.0 - 33.4 - Tax matters and tax impact of Specified Items (33.8) (23.6) (62.4) (1.0) (7.3) (2.0) (22.3) (32.6) 5.5 2.6 2.2 (8.8) 1.5 - Non-GAAP $ 473.7 $ 514.5 $ 590.2 $ 175.8 $ 183.7 $ 147.8 $ 144.6 $ 651.9 $ 181.9 $ 179.3 $ 191.8 $ 170.9 $ 723.9 $ 211.5 GAAP $ 388.7 $ 467.1 $ 456.7 $ 167.0 $ 163.6 $ 146.3 $ 103.5 $ 580.4 $ 188.0 $ 172.0 $ 171.3 $ 152.5 $ 683.8 $ 202.4 Adjustments: IT and other separation costs 19.2 57.1 74.7 1.7 5.4 4.9 7.9 19.9 - - - - - - Severance and other costs 25.3 5.1 11.6 1.0 0.5 8.1 11.5 21.1 1.4 0.6 0.1 0.5 2.6 0.1 Legal, settlements and related costs 17.5 9.2 7.6 1.5 1.4 0.2 (0.3) 2.8 0.2 - 1.1 7.9 9.2 3.6 Pension MTM Adjustment 26.7 (5.9) 91.5 - 14.8 (3.1) 47.2 58.9 (15.2) (4.7) (7.3) 15.2 (12.0) - Other 3, 4 19.1 - - - - (5.5) (1.0) (6.5) - 7.4 22.3 (0.1) 29.6 - Tax matters and tax impact of Specified Items (33.8) (23.6) (62.4) (1.0) (7.3) (2.0) (22.3) (32.6) 5.5 2.6 2.2 (8.8) 1.5 - Non-GAAP $ 462.7 $ 509.0 $ 579.7 $ 170.2 $ 178.4 $ 148.9 $ 146.5 $ 644.0 $ 179.9 $ 177.9 $ 189.7 $ 167.2 $ 714.7 $ 206.1 EPS Diluted GAAP shares 200.7 205.1 205.0 204.6 204.7 204.3 203.6 204.3 203.2 203.2 202.8 202.7 203.1 202.4 GAAP EPS $1.93 $2.27 $2.22 $0.81 $0.80 $0.71 $0.51 $2.83 $0.92 $0.84 $0.84 $0.75 $3.36 $1.00 Diluted Non-GAAP shares 5 204.6 205.1 205.0 204.6 204.7 204.3 203.6 204.3 203.2 203.2 202.8 202.7 203.1 202.4 Non-GAAP EPS $2.26 $2.47 $2.82 $0.83 $0.87 $0.73 $0.72 $3.15 $0.88 $0.87 $0.93 $0.82 $3.51 $1.02 (3) 2009 includes IPO-related costs offset by a gain on patent settlement and sale of a non-strategic intangible asset. 2012 includes sale of a certain non-core intangible asset. 2013 includes the Adminstrative penalty (China) (4) For September 2013, includes benefit for adjustment attributable to noncontrolling interests. (5) Prior to February 10, 2009, there were 170.0 million shares of common stock outstanding. The company issued an additional 34.5 million shares of common stock in the IPO. For Non-GAAP EPS, the diluted shares number of shares outstanding is 204.5 million through Q1 2009 2013 2012 2011 2010 2009 Net Earnings attributable to shareholders Net Earnings Provision for Income Taxes Effective Tax Rate |
|
|
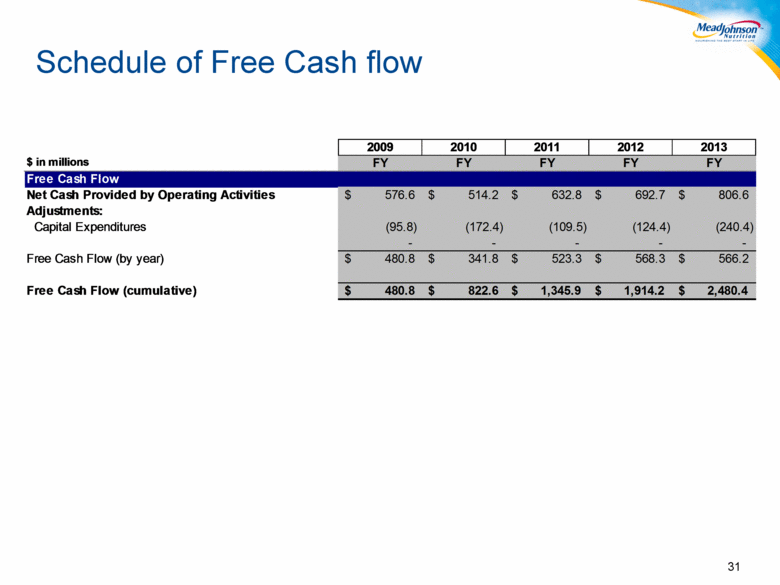
Schedule of Free Cash flow 31 2009 2010 2011 2012 2013 $ in millions FY FY FY FY FY Free Cash Flow Net Cash Provided by Operating Activities $ 576.6 $ 514.2 $ 632.8 $ 692.7 $ 806.6 Adjustments: Capital Expenditures (95.8) (172.4) (109.5) (124.4) (240.4) - - - - - Free Cash Flow (by year) $ 480.8 $ 341.8 $ 523.3 $ 568.3 $ 566.2 Free Cash Flow (cumulative) $ 480.8 $ 822.6 $ 1,345.9 $ 1,914.2 $ 2,480.4 |