Attached files
| file | filename |
|---|---|
| 8-K - 8-K - JPMORGAN CHASE & CO | june2014investorpresentation.htm |

June 11, 2014 Marianne Lake, Chief Financial Officer Morgan Stanley Financials Conference
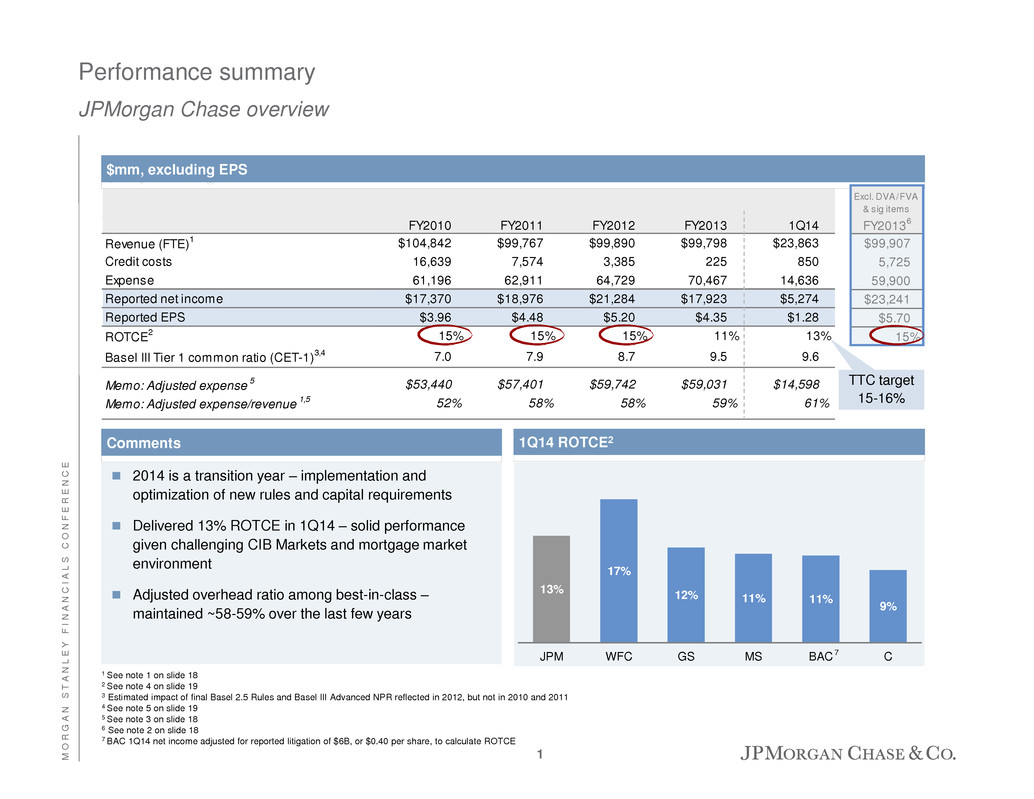
M O R G A N S T A N L E Y F I N A N C I A L S C O N F E R E N C E 13% 17% 12% 11% 9% 11% JPM WFC GS MS C BAC FY2010 FY2011 FY2012 FY2013 1Q14 Revenue (FTE) 1 $104,842 $99,767 $99,890 $99,798 $23,863 Credit costs 16,639 7,574 3,385 225 850 Expense 61,196 62,911 64,729 70,467 14,636 Reported net income $17,370 $18,976 $21,284 $17,923 $5,274 Reported EPS $3.96 $4.48 $5.20 $4.35 $1.28 ROTCE 2 15% 15% 15% 11% 13% Basel III Tier 1 common ratio (CET-1) 3,4 7.0 7.9 8.7 9.5 9.6 Memo: Adjusted expense 5 $53,440 $57,401 $59,742 $59,031 $14,598 Memo: Adjusted expense/revenue 1,5 52% 58% 58% 59% 61% Performance summary JPMorgan Chase overview 1 See note 1 on slide 18 2 See note 4 on slide 19 3 Estimated impact of final Basel 2.5 Rules and Basel III Advanced NPR reflected in 2012, but not in 2010 and 2011 4 See note 5 on slide 19 5 See note 3 on slide 18 6 See note 2 on slide 18 7 BAC 1Q14 net income adjusted for reported litigation of $6B, or $0.40 per share, to calculate ROTCE Comments 2014 is a transition year – implementation and optimization of new rules and capital requirements Delivered 13% ROTCE in 1Q14 – solid performance given challenging CIB Markets and mortgage market environment Adjusted overhead ratio among best-in-class – maintained ~58-59% over the last few years $mm, excluding EPS 13% 17% 12% 11% 11% 9 BAC C 1Q14 ROTCE2 TTC target 15-16% 7 Excl. DVA/FVA & sig items FY2013 6 $99,907 5,725 59,900 $23,241 $5.70 15% 1

M O R G A N S T A N L E Y F I N A N C I A L S C O N F E R E N C E CCB Deposit growth is among the highest in the industry7 #1 credit card issuer in the U.S. based on loans outstanding8 Record client investment assets CIB Top 3 in 15 product categories out of 169 #1 in global IB fees with 8.5% YTD market share10 – flat to FY2013 #1 in Markets revenue with 14.1% market share11 – FICC: 15.4% market share11 CB 15 consecutive quarters of loan growth #1 traditional Middle Market syndicated lender in the U.S.12 #1 U.S. multifamily lender13 Strong credit performance – <5 bps net charge-offs FY2012, FY2013 and 1Q14 AM 20 consecutive quarters of positive long-term flows 78% of 10-year mutual fund AUM in top 2 quartiles #1 in U.S. and Global long-term, active mutual fund net flows14 ~50% of U.S. households have a Chase relationship ~80% of Fortune 500 companies are our clients5 #1 customer satisfaction among largest banks for the 2nd year in a row6 Nearly 900 new quality clients added in CB in 2013 Key drivers/statistics/highlights ($B, except where noted) Four unparalleled client franchises, each performing strongly… JPMorgan Chase overview Note: For footnoted information, refer to page 17 Four unparalleled client franchises… …each performing strongly YoY growth CAGR 1Q14 1Q14 vs. 1Q13 2010-2013 CBB deposits (Avg) $458 8.9% 8.4% Client inv. assets (EOP) 196 16.1 12.4 Mortgage originations1 17 (67.7) NM Card sales volume 105 10.3 10.3 Auto originations 7 3.1 4.3 Merchant processing volume 195 11.1 16.9 Loans (EOP) $105 (10.9)% 8.6% Client deposits (Avg)2 413 15.5 15.6 AUC ($T, EOP) 21 9.5 8.3 Average VaR ($mm)3 42 (32.3) NM Loans (EOP) $139 6.6% 11.5% Deposits (Avg) 203 3.6 12.6 AUM (EOP) $1,648 11.1% 7.2% Long-term AUM Flows 20 NM $2654 Loans (EOP) 97 19.1 29.4% Deposits (Avg) 149 7.2 17.5 CCB CIB CB AM 2

M O R G A N S T A N L E Y F I N A N C I A L S C O N F E R E N C E …which together drove $18B of synergies in 2013 JPMorgan Chase overview $15B revenue + $3B cost = $18B gross cross-sell and synergies CB ~$5.1B3 AM is an important client of CIB’s global custody and fund services The Private Bank (PB) is a key distribution channel for CIB equity offerings Referrals between CIB and PB result in incremental IB transactions/PB clients ~$2.4B: TS revenue reported in CB (>80% of CB clients use TS products) ~$1.7B: gross IB revenue from CB clients (29% of NA IB fees4) JPM IM products sold through branches, including Chase Private Client (CPC); leveraging PB platform to offer managed product solutions to CPC clients ~$4.1B Card Services revenue from CB clients; ~55% of CB clients visit a branch quarterly ~$0.4B ~$1.1B ~$0.7B ~$0.5B Sale of IM products to CB clients Deepening client relationships – best-in-class cross-sell CCB: 7.9 products & services1 per Consumer Bank household in 2013 growing at ~3% CAGR from 2010 to 2013 – in line with best-in-class #1 customer satisfaction among largest banks for 2nd year in a row by both J.D. Power and ACSI2 #1 in customer satisfaction among the largest banks for mortgage originations by J.D. Power CB: Clients average ~9 products with JPM CIB: Reduced single product client relationship by >1/3 over the last three years, with nearly half of clients having 5+ products in 2013 AM: ~500 referrals from CIB to PB globally, 260+ new U.S. PB relationships originated from CB referrals Note: Totals may not sum due to rounding 1 Products and services counted in the Chase cross-sell definition include deposits (interest checking, money market, etc.), credit (mortgage loans, credit cards, etc.), investments and services (online banking, mobile banking, etc.) 2 J.D. Power (April 2013 and 2014) and American Customer Satisfaction Index (ACSI) (December 2012 and 2013) for second straight year 3 Cross-sell revenue counted in both LOBs generating the revenue in partnership and therefore synergy numbers must be divided by 2, as such revenues are totaled into the $15B for 2013 4 Calculated based on gross domestic IB fees for SLF, M&A, Equity Underwriting and Bond Underwriting CIB ~$5.5B3 CCB ~$1.4B3 +$3.7B of synergies within CCB Only ~$3B incremental required to support ~50 bps of additional capital +$1.1B of synergies within AM +$2.8B of synergies within CIB AM ~$2.4B3 Includes $0.2B of TS products sold through CBB clients ~$0.3B ~$15B3 Revenue Synergies Powerful brands 3

M O R G A N S T A N L E Y F I N A N C I A L S C O N F E R E N C E 1Q14 2Q14E Long-term targets CET-1 ratio 9.6% 9.6%+/- 10-10.5% Firm SLR 3 5.1% +20bps+/- 5.5%+/- Bank SLR 3,4 5.3% +20bps+/- 6%+ Ca pita l 2 Capital objectives and long-term targets Capital and liquidity Clear path to achieving long-term targets 1 Based on current rules and minimums 2 See note 5 on slide 19 3 Based on Final U.S. NPR issued in April 2014 4 Corresponds to the Firm’s lead bank, JPMorgan Chase Bank, National Association 5 Standardized Approach for measuring Counterparty Credit Risk Expect 2Q14 repurchases in excess of employee issuance Contemplated in relatively flat 2Q14 CET-1 ratio outlook Believe 10-10.5% CET-1 long-term target remains our binding constraint Stated targets consistent with the ability to withstand CCAR stresses – once targets met, the Firm: Will generate significant excess capital Should not need to run above stated targets Current objectives and long-term targets1 5.3% 1Q14 SLR Capital retention Leverage actions net of growth Optimization/ push down Long-term target Simulated Bank SLR3,4 build through 20151 Up to 100 bps+ ~(0) bps Up to 30 bps+ Other – not included: SA-CCR5 of ~40 bps+ 6.0%+ +40 bps (40) bps 4

M O R G A N S T A N L E Y F I N A N C I A L S C O N F E R E N C E Stressed capital simulation Capital and liquidity Comments Over the last 2 years the FRB has increased its focus on the qualitative aspects of CCAR Banks are expected to have robust, repeatable and sustainable processes The Firm does not expect the focus on qualitative aspects to lessen for 2015 CCAR Remain focused on continuing to improve the Firm’s methodologies and processes, including enhanced controls and governance We believe there should be more capital flexibility for the Firm in the next few years 3Q13 CET-1 fully phased-in ratio Net capital generation to target CET-1 launch point ratio Capital impact of stress (excl. repurchases) Procyclical RWA impact of stress (Advanced) CET-1 low point ratio Simulated Basel III Advanced low point ratio (fully phased-in) (350) bps+/- (100) bps+/- ~6.0% (ex. repurchases) 120 bps+/- 9.3% 10.5% 1 CET-1 minimum based on 2015 CCAR; SLR illustrative minimum based on public FRB comments 2 Based on Final U.S. NPR Framework issued in April 2014 4.5% CCAR minimum1 Low point Regulatory minimum1 Incremental capital CET-1 6.0%+/- 4.50% $25B+ Firm SLR2 4.0%+/- 3.00% $25B+ 5 Addt’l capital cushion to potential stress minimum
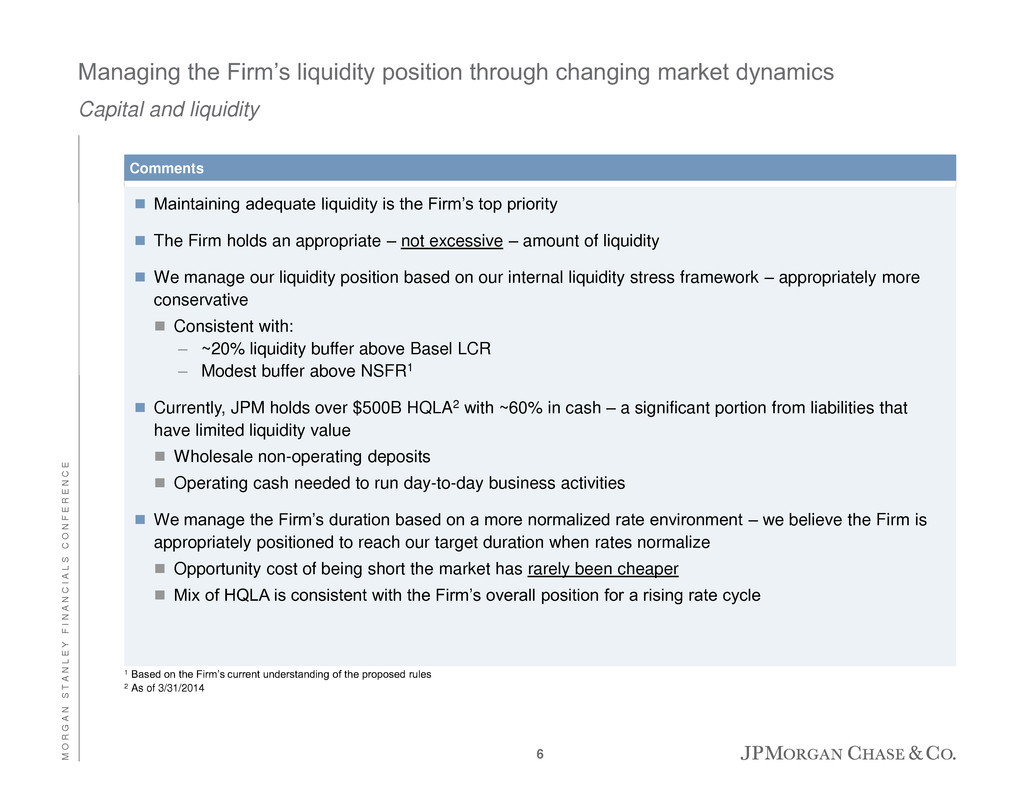
M O R G A N S T A N L E Y F I N A N C I A L S C O N F E R E N C E Managing the Firm’s liquidity position through changing market dynamics Capital and liquidity Comments Maintaining adequate liquidity is the Firm’s top priority The Firm holds an appropriate – not excessive – amount of liquidity We manage our liquidity position based on our internal liquidity stress framework – appropriately more conservative Consistent with: – ~20% liquidity buffer above Basel LCR – Modest buffer above NSFR1 Currently, JPM holds over $500B HQLA2 with ~60% in cash – a significant portion from liabilities that have limited liquidity value Wholesale non-operating deposits Operating cash needed to run day-to-day business activities We manage the Firm’s duration based on a more normalized rate environment – we believe the Firm is appropriately positioned to reach our target duration when rates normalize Opportunity cost of being short the market has rarely been cheaper Mix of HQLA is consistent with the Firm’s overall position for a rising rate cycle 1 Based on the Firm’s current understanding of the proposed rules 2 As of 3/31/2014 6

M O R G A N S T A N L E Y F I N A N C I A L S C O N F E R E N C E Centralized asset and liability management process – drives consistency in pricing, modeling and retention decisions Investor topics JPM’s asset and liability management (ALM) is broad-reaching and granular and managed at the product, LOB and firmwide level ALM process is centrally governed by Treasury and CIO – responsibilities include: Centrally governing the development and use of ALM models at the product level Evaluating the Firm’s overall duration position under various interest rate environments, stress scenarios and time horizons Complying with various liquidity limits (e.g., Basel LCR, NSFR, internal liquidity stress) and performing regular and ad hoc liquidity stress tests Optimizing the asset/liability mix to manage interest rate and liquidity risk through time Deposit pricing and modeling – enables the Firm to develop consistent deposit pricing strategies through a central deposit pricing group and deposit modeling team As rates normalize, ability to invest will be based on how well ALM process is run today Comments 7
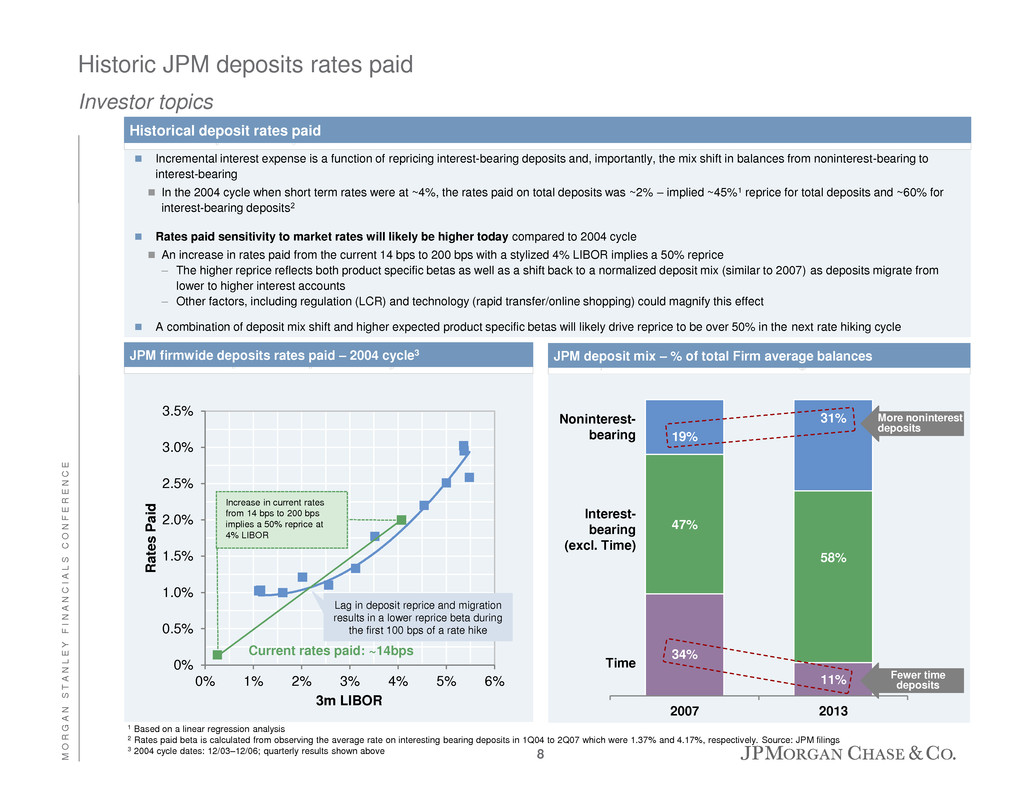
0% 0.5% 1.0% 1.5% 2.0% 2.5% 3.0% 3.5% 0% 1% 2% 3% 4% 5% 6% R ates P a id 3m LIBOR Increase in current rates from 14 bps to 200 bps implies a 50% reprice at 4% LIBOR M O R G A N S T A N L E Y F I N A N C I A L S C O N F E R E N C E Historic JPM deposits rates paid Investor topics JPM deposit mix – % of total Firm average balances JPM firmwide deposits rates paid – 2004 cycle3 34% 11% 47% 58% 19% 31% 2007 2013 Time Noninterest- bearing Interest- bearing (excl. Time) Fewer time deposits More noninterest deposits Incremental interest expense is a function of repricing interest-bearing deposits and, importantly, the mix shift in balances from noninterest-bearing to interest-bearing In the 2004 cycle when short term rates were at ~4%, the rates paid on total deposits was ~2% – implied ~45%1 reprice for total deposits and ~60% for interest-bearing deposits2 Rates paid sensitivity to market rates will likely be higher today compared to 2004 cycle An increase in rates paid from the current 14 bps to 200 bps with a stylized 4% LIBOR implies a 50% reprice – The higher reprice reflects both product specific betas as well as a shift back to a normalized deposit mix (similar to 2007) as deposits migrate from lower to higher interest accounts – Other factors, including regulation (LCR) and technology (rapid transfer/online shopping) could magnify this effect A combination of deposit mix shift and higher expected product specific betas will likely drive reprice to be over 50% in the next rate hiking cycle 1 Based on a linear regression analysis 2 Rates paid beta is calculated from observing the average rate on interesting bearing deposits in 1Q04 to 2Q07 which were 1.37% and 4.17%, respectively. Source: JPM filings 3 2004 cycle dates: 12/03–12/06; quarterly results shown above Historical deposit rates paid Current rates paid: ~14bps Lag in deposit reprice and migration results in a lower reprice beta during the first 100 bps of a rate hike 8

M O R G A N S T A N L E Y F I N A N C I A L S C O N F E R E N C E The average Firm NIM from 2005-2010 was 2.95% 2013 NIM was 2.23% due to prolonged low rates, legacy loan run-off and liquidity requirements Firm NIM over the next rate cycle could be ~2.65%-2.75% Expect that normalization of rates and balance sheet mix will increase NIM ~60 bps+/- – Largely driven by front-end rates as the Fed tightens Expect increased competition for deposits and loan run-off will further decrease expected NIM (15 bps+/-) Illustrative earnings power of the balance sheet – NII1 Investor topics Firm NIM simulation Expect core NIM and NII to be relatively stable over the next two years Most significant upside will occur when front-end rates increase 0.10% 0.60% 0.15% 2.95% 2.23% 0.60% 2.65-2.75% 2005-2010 NIM 2013 NIM Pro forma NIM Rates/mix Conservative re-pricing & run-off Rates/mix Run-off/liquidity Firm NII ($B) $44 $8-10 $52-54 Commentary EaR – potential NII increase 1 See note 6 on slide 19 Loan-to-deposit ratio: ~60% to ~70%+/- % noninterest-bearing deposit mix: ~30% to 20%+/- Time deposit mix: ~10% to ~35% +100 $2.6B $0.5B +100 ∆ in long-term rates (bps) ∆ i n s h o rt -t e rm r a te s ( b p s ) 1Q14 10-Q (Quarterly report) 12-mo pretax core NII sensitivity profile 9

M O R G A N S T A N L E Y F I N A N C I A L S C O N F E R E N C E Impact of Fed’s QE policy and reversal Investor topics Impact of QE policy The Fed has implemented a quantitative easing (QE) policy through the purchase of long dated assets, primarily Treasuries and MBS ~$3.3T increase in Fed balance sheet since 3Q08 created an estimated $2.6T of bank reserves – the increase in bank reserves has increased bank deposits A meaningful portion of industry deposit growth since 2008 was QE-related – including JPM As the Fed unwinds QE, the liquidity and duration impacts of QE-related deposits need to be contemplated by banks In January 2014, the Fed began tapering QE by reducing asset purchases In 2H15, Fed expected to begin large scale reserve draining of up to $1T or more with non-banks reducing deposits over one to two quarters Fed will likely drain reserves by transacting directly with money funds via the new reverse repo facility (RRP) Based on JPM ~10% share, deposit balances could decline by ~$100B Following RRP, Fed expected to commence rate hikes – 2H 2015 After rate hikes begin, the Fed may gradually reduce its securities holdings by slowing/stopping reinvestment – likely a small drag on deposit growth all else being equal As rates normalize, we assume that there is a potential for retail deposits to migrate to money market funds (MMFs) Deposits are largely recycled back to banks as wholesale deposits Migration from retail to wholesale accelerates as MMF yields exceed retail deposit rates by 100-150bps This migration will further reduce liquidity – Retail deposits with 5% NFO could be recycled into FI non-operating deposits with 100% NFO QE reversal – Fed’s exit strategy 10 I r , t t ri re t I , ct t in l l r r f t ith - r i it r t t rter ill li l r t cti ir ctl it f ia t f cilit ( ) r 1, deposit balances could decline by up to ~$100B Foll in , ct t rat H15 ft r rat in, t ll its s riti ldi sl in /st i st t li l ll t ll l i l As rat r ali , ass t t t ere is t ti l for retail sits t i rat t arket f ds ( ) sits lar l t le sit i rati f ret il t le t iel ret il it rat - bps his i ratio ould further reduce liquidity t il sits it net funding outflows (NFO) could be recycled into financial institution non-operating deposits with 100% NFO 1 Based on domestic deposits

M O R G A N S T A N L E Y F I N A N C I A L S C O N F E R E N C E 1 Source: US Treasuries per Federal Reserve; US HG/HY Bonds per Trace, ex-144A; CDX/iTraxx per DTCC; Brent Crude Oil/Gold per Bloomberg; CME FX Futures per G7 FX futures; Cash Equities (ADV/ADT) in U.S. based on number of shares traded; EMEA/Asia based on market value 2 Source: Hedge Fund Research; 2014F represents annualized YTD 5/31/14 return CIB Markets update – challenging combination of low volatility and low volumes Investor topics Historical percentiles of 60-day trailing realized volatility by product Asset Current Percentile 15-year volatility range and percentiles S&P 500 14.5% MSCI Emerging Markets Index 4.2% Gold 29.1% Brent Crude Oil 0.1% EUR/USD 0.1% USD/JPY 1.5% GBI-US Benchmark Principal Return Index 11.4% iBoxx USD Liquid Investment Grade Index 33.8% iBoxx USD Liquid High Yield Index 1.4% iBoxx Euro Corporates Overall Index 2.8% Source: Bloomberg and J.P. Morgan, as of May 28, 2014 Note: For each asset, the table above shows the current percentile of 60-day trailing realized volatility compared to its 15 year history, rounded to the nearest tenth of a percent. Chart above shows the current realized volatility levels (red diamond) against its 15 year historical range (thin blue line); thick blue bar shows the 25th/75th percentile range. Assets currently outside their 25th/75th percentile range are shaded in blue Current 25th/75th Percentile range Industry volumes down and volatility near 10-15 year lows for many asset classes (40)% (30)% (20)% (10)% 0% 10% 20% 30% US Treasuries US HY/HG Bonds CDS/iTraxx MBS Brent Crude Oil Gold CME FX Futures Cash Equities – U.S. Cash Equities – EMEA Cash Equities – Asia YTD change 2Q YoY change Market volumes by product1 Global Hedge Fund Index (HFRX)2 11 5.2% (8.9)% 3.5% 6.7% 2.0% 2010 2011 2012 2013 2014F

M O R G A N S T A N L E Y F I N A N C I A L S C O N F E R E N C E 48% 52% 61% 39% 66% 34% 80% 20% CIB long-term strategy and performance Investor topics Total $453T Total $248T Global GDP and financial asset distribution4 ($T) JPM CIB ROE5 & FICC market share 1 Dealogic wallet rankings 2 CHIPS & Fedwire report 3 2006 based on JPM internal estimates; 2009 and 3Q13YTD based on Coalition for Markets and Investor Services; Coalition Index banks include: BAC, BARC, BNPP, CITI, CS, DB, GS, JPM, MS, UBS; Coalition outside-in estimates of JPM and competitor revenues 4 Source: McKinsey, Global Insights 5 See note 7 on slide 19 Long-term macro trends favor global wholesale banks 2013 2023 Growth of ~2X JPM competitive rankings 3rd Tier 2nd Tier Top 3 Total $73T Total $139T 2006 2009 2013 Total leadership positions 7 11 15 Banking (FY2013) 1 Bond underwriting 1 5 1 Loan syndication 2 2 1 ECM 5 1 2 M&A 3 3 2 USD clearing2 1 1 1 Markets (3Q13YTD) 3 G10 rates 2 5 1 G10 credit 5 1 3 G10 foreign exchange 1 2 2 Securitization 10 3 1 Emerging markets 2 2 3 Commodities 5 4 1 Municipal finance 5 2 3 Cash equities 8 5 6 Derivatives & converts 5 2 2 Investor Services (3Q13YTD) 3 Prime brokerage 9 4 3 Futures & options 9 2 2 16% 15% 19% 17% 13% 13.5% 17.8% 15.6% 18.6% 15.4% 2010 2011 2012 2013 1Q14 ROE FICC market share Capital ($B) $46.5 $56.5 $47.0 $47.5 $61.0 Developed Emerging Global GDP Financial assets 12

M O R G A N S T A N L E Y F I N A N C I A L S C O N F E R E N C E Mortgage Banking Production update Investor topics $0.6 $1.1 $1.1 $0.6 $0.7 $0.7 $0.8 $0.5 $2.8 $1.3 $1.5 $1.2 $0.4 $0.3 2000 2003 2007 2012 2013 2014F 2015F TTC Purchase Refinance $3.9 $2.4 $1.1 $1.9 $1.5 $1.0 $1.1 $2.1 (2.5)% 0.0% 2.5% 5.0% Revenue margin Pretax margin Retail mix 44% 60% 56% 47% FY2010 FY2011 FY2012 FY2013 Mortgage market size1 ($T) Chase Production margins and origination mix3 2013 industry purchase originations by FICO and LTV for conventionals & difference vs. 2006 originations7 1Q14 39% (40%) 1 1 2 3.9% 4.0% Jumbo Chase Retail Retail Peers Competitive weighted average note rates Chase vs. Market4 Note: Totals may not sum due to rounding 1 2000-2013 Inside Mortgage Finance; 2014F-2015F reflects average of forecasts from Fannie Mae (5/12/14), Freddie Mac (5/15/14) and MBA (5/19/14) 2 Through-the-cycle 3 Excluding repurchases 4 Source: ICON Advisory LenderShare pricing survey week ended June 1, 2014 5 Jumbo 30-year fixed purchase 6 Mortgage Banking Jumbo share only; does not include the Private Bank 7 Source: JPM Securitized Product Research FICO <70 71-80 81-90 91+ Total LTV >780 6% 19% 4% 6% 35% 740-780 4% 16% 5% 10% 35% 700-740 2% 8% 3% 6% 19% <700 1% 4% 1% 3% 10% Total 14% 48% 14% 24% 100% 2013 FICO <70 71-80 81-90 91+ Total LTV >780 (1)% 5% 3% 5% 13% 740-780 (1)% (3)% 3% 7% 7% 700-740 (1)% (6)% 1% 3% (3)% <700 (1)% (9)% (1)% (5)% (17)% Total (5)% (13)% 6% 11% (1)% Vers us 20 06 Market share expected to be down 2Q14 vs. 2Q13 Jumbo – share up ~150 bps on competitive pricing6 Conventional – down due in part to HARP Ginnie Mae – down due to pricing 13 5
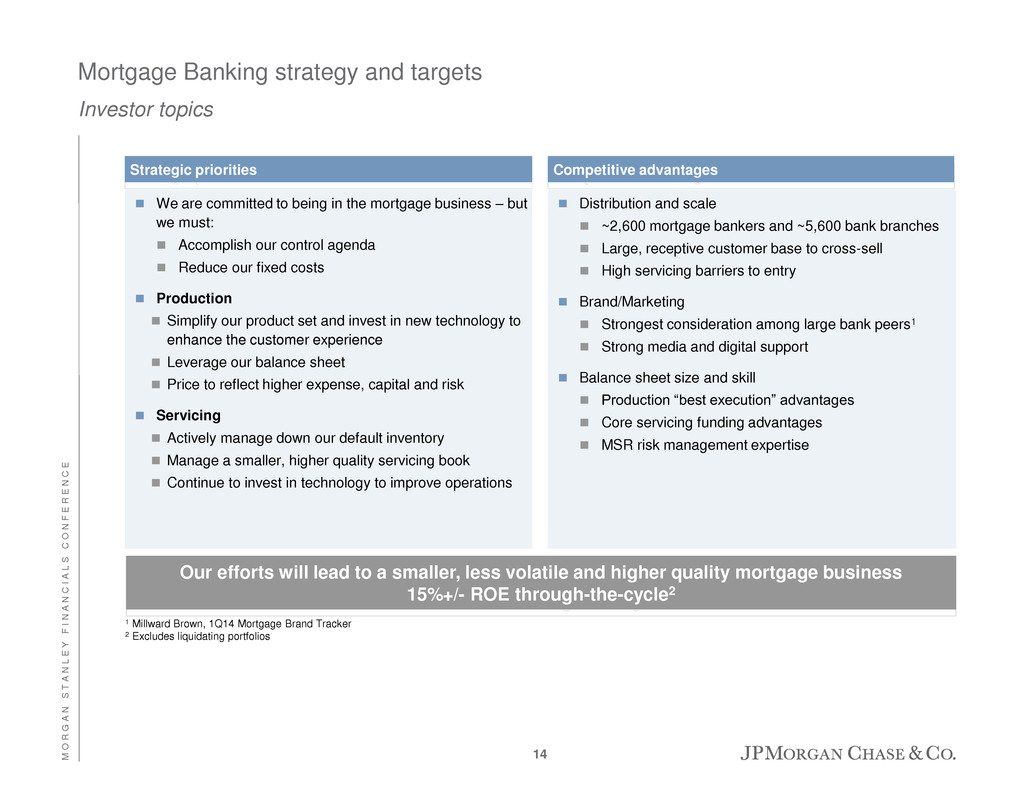
M O R G A N S T A N L E Y F I N A N C I A L S C O N F E R E N C E Mortgage Banking strategy and targets Investor topics Strategic priorities Competitive advantages We are committed to being in the mortgage business – but we must: Accomplish our control agenda Reduce our fixed costs Production Simplify our product set and invest in new technology to enhance the customer experience Leverage our balance sheet Price to reflect higher expense, capital and risk Servicing Actively manage down our default inventory Manage a smaller, higher quality servicing book Continue to invest in technology to improve operations 1 Millward Brown, 1Q14 Mortgage Brand Tracker 2 Excludes liquidating portfolios Distribution and scale ~2,600 mortgage bankers and ~5,600 bank branches Large, receptive customer base to cross-sell High servicing barriers to entry Brand/Marketing Strongest consideration among large bank peers1 Strong media and digital support Balance sheet size and skill Production “best execution” advantages Core servicing funding advantages MSR risk management expertise Our efforts will lead to a smaller, less volatile and higher quality mortgage business 15%+/- ROE through-the-cycle2 14
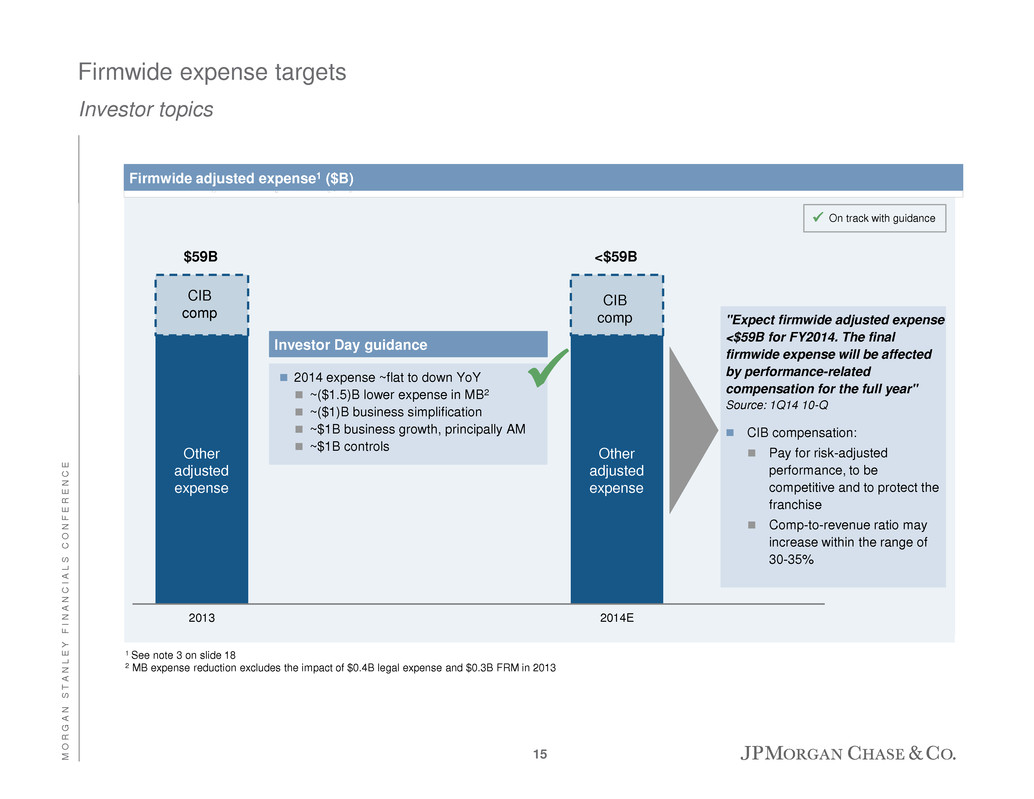
M O R G A N S T A N L E Y F I N A N C I A L S C O N F E R E N C E 2013 2014E 2013 2014E Firmwide expense targets Investor topics Firmwide adjusted expense1 ($B) 1 See note 3 on slide 18 2 MB expense reduction excludes the impact of $0.4B legal expense and $0.3B FRM in 2013 "Expect firmwide adjusted expense <$59B for FY2014. The final firmwide expense will be affected by performance-related compensation for the full year" Source: 1Q14 10-Q CIB compensation: Pay for risk-adjusted performance, to be competitive and to protect the franchise Comp-to-revenue ratio may increase within the range of 30-35% 2014 expense ~flat to down YoY ~($1.5)B lower expense in MB2 ~($1)B business simplification ~$1B business growth, principally AM ~$1B controls On track with guidance $59B <$59B CIB comp CIB comp Other adjusted expense Other adjusted expense Investor Day guidance 15

M O R G A N S T A N L E Y F I N A N C I A L S C O N F E R E N C E $18 $5 $23+ $7 $0.7 ($0.7) ($2.5) ~$27+/- 2013 Reported net income Significant & one-time items Core performance Normalized rates & incremental earnings from investments CCB efficiencies Credit costs New financial architecture Pro forma net income CCB excl. MB efficiencies: $0.5B MB in target state: $0.2B 1 2 3 Run-rate Corp. legal exp.4: ($1.0B) Control spend: ($0.6B) Markets reform: ($0.4B) Business simplification: ($0.3B) Leverage actions: ($0.2B) RWA ROTCE Overhead ratio5 $1.6T 11% 71% ~$1.6T 15-16% ~55%+/- $1.6T 15% 59%6 Earnings power – simulation Investor topics Note: Numbers may not sum due to rounding for illustrative purposes. Figures are tax effected at an incremental tax rate of 38%, where applicable 1 Includes 2013 disclosed significant items. See note 2 on slide 18 2 Represents estimated NII benefit from normalized rates (includes incremental charge-offs to support loan growth; overlap with investments and MB has been removed) 3 Increase in NCOs due to normalized through-the-cycle rates and assumes no release 4 Simulation includes assumed total pretax legal expense of $2B. Amount is for illustrative purposes only, and is not intended to be forward-looking guidance. Actual amounts may vary from assumed amount 5 Managed basis 6 Represents adjusted overhead ratio Normalized rates combined with flat RWA delivers ROTCE of 15-16% and implied overhead ratio of ~55%+/- Pretax NII ($8-10B): $9B Pretax investments: $4B Exclusion of duplication: ($2B) Total Pretax: $11B After-tax: $7B Net income build simulation ($B) – 4-5 year horizon 16
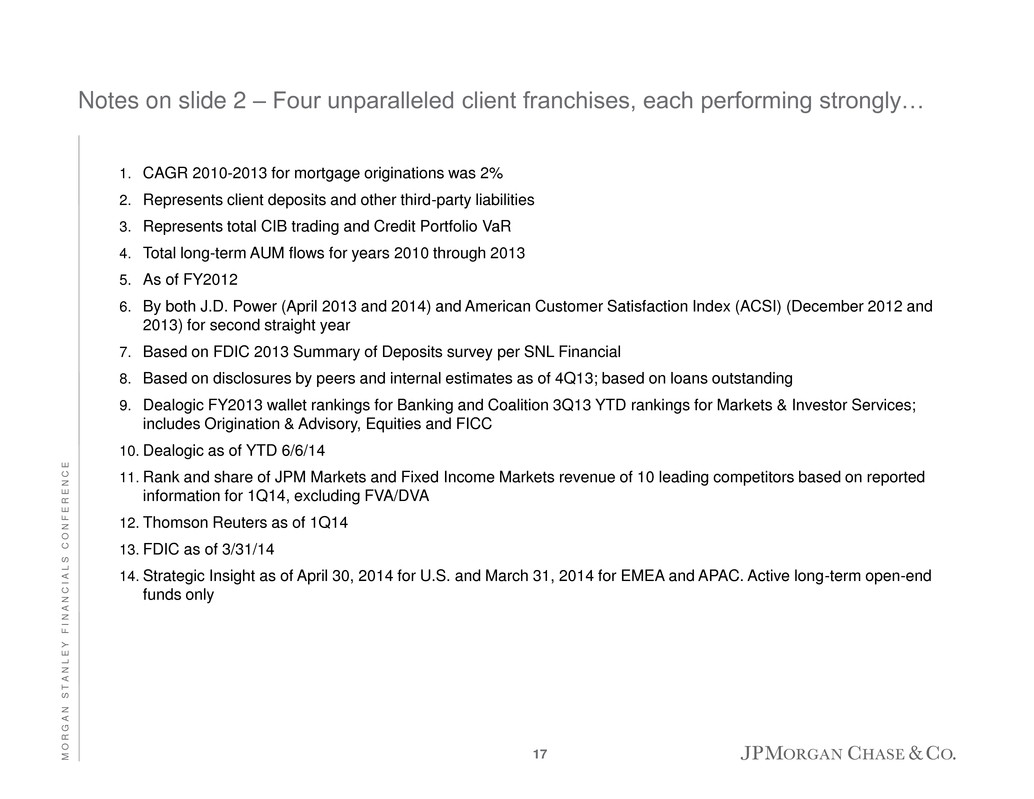
M O R G A N S T A N L E Y F I N A N C I A L S C O N F E R E N C E Notes on slide 2 – Four unparalleled client franchises, each performing strongly… 1. CAGR 2010-2013 for mortgage originations was 2% 2. Represents client deposits and other third-party liabilities 3. Represents total CIB trading and Credit Portfolio VaR 4. Total long-term AUM flows for years 2010 through 2013 5. As of FY2012 6. By both J.D. Power (April 2013 and 2014) and American Customer Satisfaction Index (ACSI) (December 2012 and 2013) for second straight year 7. Based on FDIC 2013 Summary of Deposits survey per SNL Financial 8. Based on disclosures by peers and internal estimates as of 4Q13; based on loans outstanding 9. Dealogic FY2013 wallet rankings for Banking and Coalition 3Q13 YTD rankings for Markets & Investor Services; includes Origination & Advisory, Equities and FICC 10. Dealogic as of YTD 6/6/14 11. Rank and share of JPM Markets and Fixed Income Markets revenue of 10 leading competitors based on reported information for 1Q14, excluding FVA/DVA 12. Thomson Reuters as of 1Q14 13. FDIC as of 3/31/14 14. Strategic Insight as of April 30, 2014 for U.S. and March 31, 2014 for EMEA and APAC. Active long-term open-end funds only 17
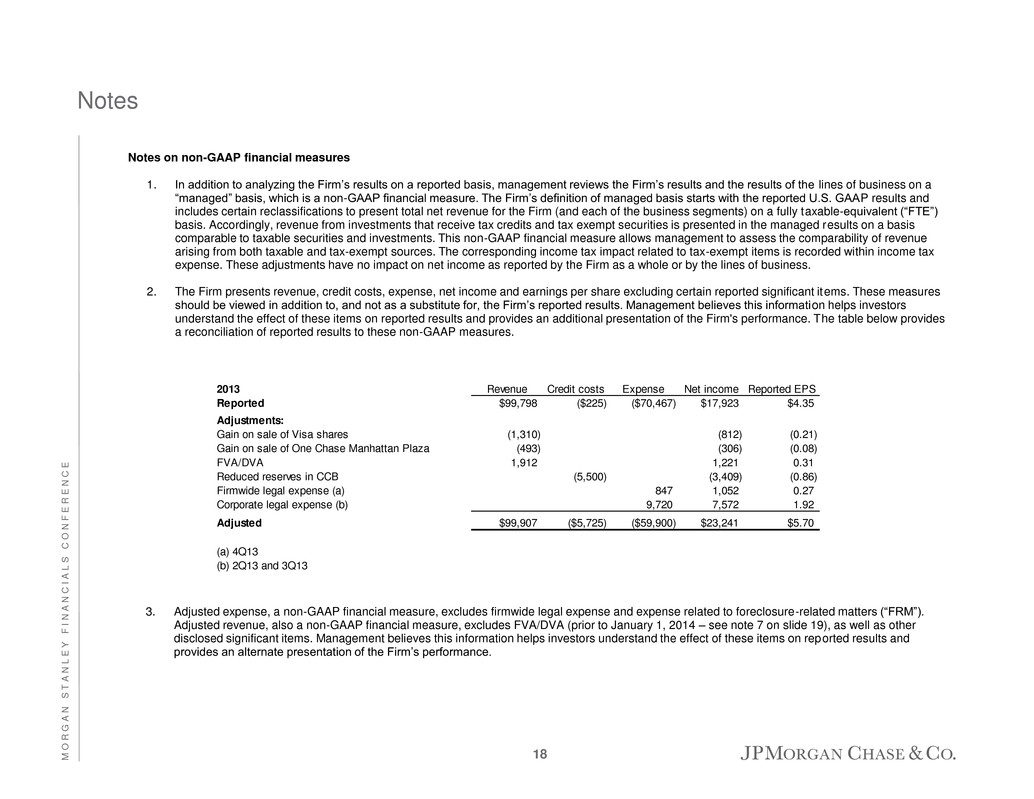
M O R G A N S T A N L E Y F I N A N C I A L S C O N F E R E N C E Notes on non-GAAP financial measures 1. In addition to analyzing the Firm’s results on a reported basis, management reviews the Firm’s results and the results of the lines of business on a “managed” basis, which is a non-GAAP financial measure. The Firm’s definition of managed basis starts with the reported U.S. GAAP results and includes certain reclassifications to present total net revenue for the Firm (and each of the business segments) on a fully taxable-equivalent (“FTE”) basis. Accordingly, revenue from investments that receive tax credits and tax exempt securities is presented in the managed results on a basis comparable to taxable securities and investments. This non-GAAP financial measure allows management to assess the comparability of revenue arising from both taxable and tax-exempt sources. The corresponding income tax impact related to tax-exempt items is recorded within income tax expense. These adjustments have no impact on net income as reported by the Firm as a whole or by the lines of business. 2. The Firm presents revenue, credit costs, expense, net income and earnings per share excluding certain reported significant items. These measures should be viewed in addition to, and not as a substitute for, the Firm’s reported results. Management believes this information helps investors understand the effect of these items on reported results and provides an additional presentation of the Firm's performance. The table below provides a reconciliation of reported results to these non-GAAP measures. Notes 3. Adjusted expense, a non-GAAP financial measure, excludes firmwide legal expense and expense related to foreclosure-related matters (“FRM”). Adjusted revenue, also a non-GAAP financial measure, excludes FVA/DVA (prior to January 1, 2014 – see note 7 on slide 19), as well as other disclosed significant items. Management believes this information helps investors understand the effect of these items on reported results and provides an alternate presentation of the Firm’s performance. 18 2013 Revenue Credit costs Expense Net income Reported EPS Reported $99,798 ($225) ($70,467) $17,923 $4.35 Adj st nt : Gai o s l of Visa shares (1,310) (812) (0.21) G i on s l of O Chase Manhattan Plaza (493) (306) (0.08) FVA/DVA 1,912 1,221 0.31 R duc r s rv s in CCB (5,500) (3,409) (0.86) Firmwide legal expense (a) 847 1,052 0.27 Corporate legal expense (b) 9,720 7,572 1.92 Adjusted $99,907 ($5,725) ($59,900) $23,241 $5.70 (a) 4Q13 (b) 2Q13 and 3Q13

M O R G A N S T A N L E Y F I N A N C I A L S C O N F E R E N C E Notes on non-GAAP financial measures 4. Tangible common equity (“TCE”) and return on tangible common equity (“ROTCE”), are each non-GAAP financial measures. TCE represents the Firm’s common stockholders’ equity (i.e., total stockholders’ equity less preferred stock) less goodwill and identifiable intangible assets (other than MSRs), net of related deferred tax liabilities. ROTCE measures the Firm’s earnings as a percentage of TCE. TCE and ROTCE are meaningful to the Firm, as well as analysts and investors in assessing the Firm’s use of equity and are used in facilitating comparisons of the Firm with competitors. 5. The common equity Tier 1 capital (“CET-1”) ratio under the Basel III Advanced Fully Phased-In rules and the SLR under Basel III rules are non- GAAP financial measures. These measures are used by management, bank regulators, investors and analysts to assess and monitor the Firm’s capital position. For additional information on these measures, see Regulatory capital on pages 63-68 of JPMorgan Chase & Co.’s Form 10-Q for the quarter ended March 31, 2014. 6. In addition to reviewing JPMorgan Chase's net interest income on a managed basis, management also reviews core net interest income to assess the performance of its core lending, investing (including asset-liability management) and deposit-raising activities (which excludes the impact of Corporate & Investment Bank's ("CIB") market-based activities). The core net interest income data presented are non-GAAP financial measures due to the exclusion of CIB’s market-based net interest income and the related assets. Management believes this exclusion provides investors and analysts a more meaningful measure by which to analyze the non-market-related business trends of the Firm and provides a comparable measure to other financial institutions that are primarily focused on core lending, investing and deposit-raising activities. 7. Prior to January 1, 2014, the CIB provided several non-GAAP financial measures excluding the impact of FVA (effective fourth quarter 2013) and DVA, including return on equity. Beginning in the first quarter 2014, the Firm does not exclude FVA and DVA from its assessment of business performance; however, the Firm continues to present these non-GAAP measures for the periods prior to January 1, 2014, as they reflected how management assessed the underlying business performance of the CIB in those prior periods. Notes 19

M O R G A N S T A N L E Y F I N A N C I A L S C O N F E R E N C E Forward-looking statements This presentation contains forward-looking statements within the meaning of the Private Securities Litigation Reform Act of 1995. These statements are based on the current beliefs and expectations of JPMorgan Chase & Co.’s management and are subject to significant risks and uncertainties. Actual results may differ from those set forth in the forward-looking statements. Factors that could cause JPMorgan Chase & Co.’s actual results to differ materially from those described in the forward-looking statements can be found in JPMorgan Chase & Co.’s Annual Report on Form 10-K for the year ended December 31, 2013, and Quarterly Report on Form 10-Q for the quarter ended March, 31, 2014, which have been filed with the Securities and Exchange Commission and is available on JPMorgan Chase & Co.’s website (http://investor.shareholder.com/jpmorganchase), and on the Securities and Exchange Commission’s website (www.sec.gov). JPMorgan Chase & Co. does not undertake to update the forward-looking statements to reflect the impact of circumstances or events that may arise after the date of the forward- looking statements. 20
