Attached files
| file | filename |
|---|---|
| EX-99.1 - EXHIBIT 99.1 - PPL Corp | exhibit991.htm |
| 8-K - FORM 8K - PPL Corp | form8k.htm |

© PPL Corporation 2014
Completing the Transformation
PPL Energy Supply to Combine with Riverstone’s Generation
Business to Form Talen Energy Corporation
Business to Form Talen Energy Corporation
June 10, 2014
Exhibit 99.2

© PPL Corporation 2014
Cautionary Statements and Factors That
May Affect Future Results
May Affect Future Results
Forward Looking Statements
Any statements made in this presentation about future operating results or other
future events are forward-looking statements under the Safe Harbor Provisions of the
Private Securities Litigation Reform Act of 1995. Actual results may differ materially
from such forward-looking statements. A discussion of factors that could cause actual
results or events to vary is contained in the Appendix to this presentation and in the
Company’s SEC filings.
1

© PPL Corporation 2014
Agenda
2
Transaction Overview Bill Spence
Chairman, President & CEO, PPL Corporation
Chairman, President & CEO, PPL Corporation
Talen Energy Overview Paul Farr
President, PPL Energy Supply, LLC
President, PPL Energy Supply, LLC
President & CEO, Talen Energy, at Close
Transaction Structure, Process Jeremy McGuire
and Timing Vice President - Strategic Development,
PPL Strategic Development, LLC
Chief Financial Officer, Talen Energy, at Close
PPL Corporation Update Bill Spence
Concluding Remarks Bill Spence

© PPL Corporation 2014
Transaction Overview
• PPL Energy Supply, LLC (“PPL Energy Supply”) will be spun off from PPL Corporation (“PPL”) and combined
with Riverstone’s power generation business (“RJS Power Holdings LLC”) to form Talen Energy Corporation
(“Talen Energy”)
with Riverstone’s power generation business (“RJS Power Holdings LLC”) to form Talen Energy Corporation
(“Talen Energy”)
• Creates a highly competitive 15 GW IPP with attractive assets in the right markets
• With a strong balance sheet and continuing Riverstone involvement, Talen Energy is well positioned to deliver
best-in-class growth and shareholder returns
best-in-class growth and shareholder returns
• PPL’s shareholders will own 65% of Talen Energy with Riverstone owning 35%
– PPL will have no ongoing ownership interest, control or affiliation (1)
• Paul Farr has been named President of PPL Energy Supply and will become President and CEO of Talen Energy
at closing
at closing
– Vince Sorgi, currently Vice President and Controller, PPL Corporation, has been named Senior Vice
President and CFO of PPL Corporation
President and CFO of PPL Corporation
– Jeremy McGuire, currently Vice President - Strategic Development, will become CFO of Talen Energy at
closing
closing
(1) Other than under certain limited contracts such as a Transition Services Agreement and ongoing arms-length commercial arrangements.
3

© PPL Corporation 2014
Transaction Benefits
4
Creates a Highly
Attractive IPP
Attractive IPP
Significant
Shareholder
Value Creation
Shareholder
Value Creation
Transaction
Timing and
Certainty
Timing and
Certainty
• 15 GW of capacity focused primarily in PJM and ERCOT, two highly attractive
markets
markets
• Highly diversified fleet; environmentally well positioned
• Robust cash flow generation capability
• Conservative capitalization positions company well for future growth
• Move to “pure-play” businesses
• Permits the utility operations and competitive power operations to make
operating and capital decisions as separate businesses
operating and capital decisions as separate businesses
• Significant synergy potential: estimated at $155 million on an annual run-rate
basis
basis
– Cost savings plus additional benefits from improved asset
commercialization across the fleet
commercialization across the fleet
• Tax-free transaction structure
• Necessary regulatory approvals well understood
• Expected closing in Q1 or Q2 2015

© PPL Corporation 2014
Talen Energy Overview
5

© PPL Corporation 2014
Talen Energy Market Presence
6
Presence in Most Attractive and Liquid U.S. Power Markets
ISO-NE
1%
1%
PJM
ERCOT
WECC
Talen Energy (1),(2)
ISO-NE
PJM
ERCOT
RJS Power Holdings LLC (1)
PJM
WECC
PPL Energy Supply (1)
(1)Based on percentage of generating capacity. Excludes 11 Montana hydro assets to be sold under a September 26, 2013 Purchase and Sale Agreement with NorthWestern Corporation.
(2)Does not account for any market mitigation that will be required to achieve regulatory approvals.
93%
63%
35%
MD
TX
MT
NY
PA
NH
MA
CT
DE
RI
VT
< 300
300 - 750
750 - 1,000
> 1,000
Operating Capacity (MW)
PPL Energy Supply
Ownership
RJS Power Holdings LLC
Gas
Oil
Coal
Nuclear
Hydro
Fuel Type

© PPL Corporation 2014
Fuel Mix:
Talen Energy Asset Profile
7
|
|
|||
|
Generating Capacity:
|
|||
|
Operating Facilities:
|
|||
|
States:
|
+
=
(2)
(2)
(1) Does not account for any market mitigation that will be required to achieve regulatory approvals.
(2) Excludes 11 Montana hydro assets to be sold under a September 26, 2013 Purchase and Sale Agreement with NorthWestern Corporation. Excludes PPL Energy Supply peakers, landfill
gas, wind and solar sites.
gas, wind and solar sites.
Compelling IPP with Significant Scale and Diversity
(2)
Well positioned to grow in key markets
Oil
Coal
Natural Gas
Renewables
Natural Gas
Nuclear
Coal
Oil
Renewables
Coal
Nuclear
Natural Gas
(2)

© PPL Corporation 2014
Talen Energy Peer Positioning
8
#3 IPP and #5 Competitive Generator in the U.S.
(1) Does not account for any market mitigation that will be required to achieve regulatory approvals.
(2) Excludes 11 Montana hydro assets to be sold under a September 26, 2013 Purchase and Sale Agreement with NorthWestern Corporation.
• Sufficient scale to be efficient
• Strong EBITDA production per MW of capacity
(1)
(2)

© PPL Corporation 2014
Talen Energy Hedging Profile
9
|
(As of May 31, 2014)
|
2014
|
2015
|
2016
|
|||
|
Baseload
|
PPL Energy
Supply |
RJS Power
Holdings LLC |
PPL Energy
Supply |
RJS Power
Holdings LLC |
PPL Energy
Supply |
RJS Power
Holdings LLC |
|
Expected Generation (1) (Millions MWhs)
|
50.2
|
9.1
|
45.1
|
8.3
|
44.0
|
7.9
|
|
East
|
43.2
|
9.1
|
40.8
|
8.3
|
40.0
|
7.9
|
|
West(2)
|
7.1
|
NA
|
4.3
|
NA
|
4.0
|
NA
|
|
Current Hedges (%) (3)
|
96-98%
|
48-50%
|
75-77%
|
0%
|
13-15%
|
0%
|
|
East (%)
|
96-98%
|
48-50%
|
75-77%
|
0%
|
11-13%
|
0%
|
|
West (%) (2)
|
95-97%
|
NA
|
73-75%
|
NA
|
33-35%
|
NA
|
|
Average Hedged Price (Energy Only) ($/MWh) (4)
|
|
|
|
|
|
|
|
East ($)
|
$39-41
|
$45-48
|
$39-41
|
NA
|
$42-44
|
NA
|
|
West ($) (2)
|
$38-40
|
NA
|
$42-43
|
NA
|
$44-46
|
NA
|
|
Current Coal Hedges (%)
|
97%
|
100%
|
86%
|
89%
|
65%
|
93%
|
|
East (%)
|
96%
|
100%
|
84%
|
89%
|
53%
|
93%
|
|
West (%) (2)
|
100%
|
NA
|
92%
|
NA
|
100%
|
NA
|
|
Average Consumed Coal Price (Delivered $/Ton)
|
|
|
|
|
|
|
|
East ($)
|
$76-78
|
Variable
|
$72-76
|
Variable
|
$72-78
|
Variable
|
|
West ($) (2)
|
$26-30
|
NA
|
$26-32
|
NA
|
$26-32
|
NA
|
|
Intermediate / Peaking
|
|
|
|
|
|
|
|
PJM Expected Generation (1) (Million MWhs)
|
9.5
|
2.3
|
8.5
|
2.3
|
9.4
|
1.8
|
|
PJM Current Hedges (%) (5)
|
79%
|
72-75%
|
10%
|
72-75%
|
0%
|
72-75%
|
|
ERCOT Expected Generation (Million MWhs)
|
NA
|
4.5
|
NA
|
5.6
|
NA
|
5.9
|
|
ERCOT Current Hedges (%)
|
NA
|
74-76%
|
NA
|
10-12%
|
NA
|
0%
|
|
|
|
|
|
|
|
|
|
Expected Capacity Revenue (6) ($mm)
|
$560
|
$205
|
$505
|
$169
|
$455
|
$162
|
(1) Represents expected sales of PPL Energy Supply and RJS Power Holdings LLC. Does not account for any market mitigation that will be required to achieve regulatory approvals.
(2) Includes PPL Montana's hydroelectric facilities through the 3rd quarter of 2014. On September 26, 2013, PPL Montana, LLC agreed to sell all 11 of its hydroelectric power plants. The sale is subject to regulatory approvals and currently is not expected to close before the
second half of 2014.
second half of 2014.
(3) 2015 RJS Power Holdings LLC basis hedges only (BGE/PJMW). Includes January to April at 100%.
(4) The 2015 & 2016 average energy prices for existing hedges were estimated by determining the impact on the existing collars resulting from power prices at the 5th and 95th percentile confidence levels; RJS Power Holdings LLC values represent BGE hedges adjusted to be
consistent with PJM West Hub using 5-year historical basis, and average hedge price is ~75% weighted to peak volume.
consistent with PJM West Hub using 5-year historical basis, and average hedge price is ~75% weighted to peak volume.
(5) Based on sold heat rate call options for RJS Power Holdings LLC.
(6) Expected capacity revenue includes all MWs cleared during PJMs RPM Auctions or during incremental auctions at the respective prices and any uncleared MWs at expected incremental auction prices; RJS Power Holdings LLC capacity revenues include Exelon top-up
payments.
payments.

© PPL Corporation 2014
Enhanced Value from Significant Synergy
Potential
Potential
10
|
($mm)
|
Services / HQ
|
Operating
|
Total (1)
|
|
Pre-Synergies 2015E O&M
|
|
|
|
|
PPL Energy Supply
|
$192
|
$712
|
$904
|
|
RJS Power Holdings LLC
|
13
|
217
|
230
|
|
Subtotal
|
$205
|
$929
|
$1,134
|
|
|
|
|
|
|
Full Year Run-Rate Synergies
|
|
|
|
|
O&M
|
$85
|
$60
|
$145
|
|
Margin from improved
Commercialization
|
0
|
10
|
10
|
|
Total Run-Rate Transaction Benefits
|
$85
|
$70
|
$155
|
|
|
|
|
|
(1) Does not account for any market mitigation that will be required to achieve regulatory approvals.
(2) Excludes certain allocated costs that are not part of O&M and non-cash compensation.
(3) Excludes non-cash compensation.
(3)
(3)
(2)

© PPL Corporation 2014
Talen Energy Financial Highlights
• Anticipate a BB area credit rating
• Will commence a process to obtain necessary liquidity facilities to support Talen’s operations
– Targeting $1.85 billion
– Expect to close on commitments by end of July 2014
– Facility to become active upon closing
11
|
($mm)
|
PPL Energy Supply
|
RJS Power Holdings LLC
|
Total
|
|
2015E Adjusted EBITDA
|
$627
|
$285
|
$912
|
|
Run-Rate Annual Synergies
|
|
|
155
|
|
“Model Year” Adjusted EBITDA
|
|
|
1,067
|
|
2015E CapEx
|
369
|
54
|
423
|
|
Debt
|
2,713
|
1,250
|
3,963
|
|
Cash
|
520
|
NA
|
520
|
(1) Before synergies, not pro forma. Excludes 11 Montana hydro assets to be sold under a September 26, 2013 Purchase and Sale Agreement with NorthWestern Corporation. Does
not account for any market mitigation that will be required to achieve regulatory approvals. See description of Adjusted EBITDA and reconciliation to Net Income in Appendix.
not account for any market mitigation that will be required to achieve regulatory approvals. See description of Adjusted EBITDA and reconciliation to Net Income in Appendix.
(2) Excludes nuclear fuel CapEx.
(3) Balance as of May 31, 2014. Includes $2,525mm of long-term debt, including current portion, and $188mm short term borrowings.
(4) Gives effect to planned RJS Power Holdings LLC refinancing.
(5) Balance as of May 31, 2014, consists of $108mm of unrestricted cash and $412mm of restricted cash. Restricted cash includes cash posted in support of hedge positions.
(6) RJS Power Holdings LLC not expected to maintain significant cash balances.
(4)
(5)
(6)
(2)
(3)
(1)

© PPL Corporation 2014
Talen Energy Strategy: Delivering Future Value
12
|
Safety and Plant
Performance |
• Value is built on a foundation of excellence in operations
• Safety is a core value
|
|
Disciplined Capital
Investment |
• Investment to maintain safe operations
• Investment to sustain current fleet made on an economic basis
• Investment for growth subject to rigorous returns-based analysis
|
|
Balance Sheet
Management |
• The balance sheet is a strategic asset
• Enhanced flexibility and capacity
• Absorb volatility and pursue growth opportunities
|
|
Active Hedging &
Portfolio Management |
• Primary focus on delivering visibility 1-year forward
• Manage and monetize intra-year volatility
• Retail activities will be oriented to hedge the generation fleet
|
|
Cash Returns
|
• Business will be run to maximize cash flow
• Cash generation fuels growth and investment opportunities
|
|
Growth Posture
|
• Growth in value, not size alone
• Right assets in the right markets
• Evolve with opportunity
|

© PPL Corporation 2014
Transaction Structure, Process
and Timing
and Timing
13

© PPL Corporation 2014
Key Transaction Terms
14
|
Topic
|
Commentary
|
|
Structure and
Consideration |
• PPL Energy Supply will be distributed to PPL shareholders to form Talen Energy through a
tax-free spin off; Riverstone will then contemporaneously contribute RJS Power Holdings LLC to Talen Energy in exchange for Talen common stock |
|
Pro Forma Talen
Ownership |
• 65% PPL shareholders / 35% Riverstone Holdings
|
|
Governance
|
• Talen board will have eight directors upon closing
– Four PPL independent directors to step down from the PPL board and onto the Talen
board • One of which will become non-executive chairman
– One independent director appointed by Riverstone
– Two non-independent board members from Riverstone
– Paul Farr (Talen CEO) will be a director
|
|
Approvals
|
• Regulatory approvals include Federal Energy Regulatory Commission (“FERC”), Department
of Justice (“DOJ”), Nuclear Regulatory Commission (“NRC”), certain PA PUC regulatory and other customary approvals • Estimate required mitigation of approximately 1,000 MW of baseload-equivalent capacity
|
|
Timing
|
• Expected close: Q1 or Q2 2015
• Contract outside date: 12 months (June 30, 2015) + 6 months if only awaiting regulatory
approval |

© PPL Corporation 2014
Simplified Corporate Structure
15
• PPL shareholders continue to own 100%
of PPL Corporation
of PPL Corporation
• 100% of PPL Energy Supply will be spun
off to PPL shareholders to form Talen
Energy
off to PPL shareholders to form Talen
Energy
• Riverstone will contemporaneously
contribute RJS Power Holdings LLC
(owners of Raven, Sapphire and Jade) in
exchange for 35% of Talen common
stock
contribute RJS Power Holdings LLC
(owners of Raven, Sapphire and Jade) in
exchange for 35% of Talen common
stock
• RJS Power Holdings LLC will be combined
with PPL Energy Supply
with PPL Energy Supply
Pro Forma Corporate Structure
PPL Shareholders
Riverstone Holdings
Talen Energy
PPL Energy
Supply
Supply
Raven
PPL
Energy Supply
Subs
Sapphire
Jade
35%
65%
PPL Corporation
100%
New Entity
Transaction Summary
Credit
Facilities and
Term Debt (1)
Facilities and
Term Debt (1)
(1)Existing debt at PPL Ironwood and PPL Renewables will remain at these entities.

© PPL Corporation 2014
Talen Energy Capitalization and Liquidity
16
Overview
Expected Talen Capitalization and Liquidity
(1) As of May 31, 2014.
(2) Includes PPL Ironwood debt of $52mm and PPL Renewables debt of $5mm.
(3) Reflects RJS Power Holdings LLC refinancing; May 31, 2014 debt balances are $318mm at Raven, $251mm at Sapphire and $588mm at Jade.
• Targeting $1,850 million of liquidity
facilities active upon close, committed by
end of July
facilities active upon close, committed by
end of July
• Existing PPL Energy Supply term debt to
remain in place
remain in place
• Riverstone’s Raven, Jade, and Sapphire are
combining under a single parent company,
RJS Power Holdings LLC, and will refinance
all of their existing indebtedness with a
$1,250 million Senior Unsecured Note
combining under a single parent company,
RJS Power Holdings LLC, and will refinance
all of their existing indebtedness with a
$1,250 million Senior Unsecured Note
• New RJS Power Holdings LLC debt will
travel to Talen upon transaction close with
covenants expected to be consistent with
existing PPL Energy Supply term debt
travel to Talen upon transaction close with
covenants expected to be consistent with
existing PPL Energy Supply term debt
($mm)
|
New Talen Revolving Credit Facility
|
$1,850
|
||
|
Short Term Debt
|
$188
|
||
|
Term Debt
|
|
|
|
|
PPL Energy Supply Debt
|
$2,525
|
||
|
RJS Power Holdings LLC Senior Notes
|
1,250
|
||
|
Total Term Debt
|
$3,775
|
||
|
|
|
|
|
(1), (2)
(1)
(3)

© PPL Corporation 2014
Transaction Timeline
17
|
Principal Required Approvals
|
|
|
Required Approval
|
Expected Timing
|
|
Federal Energy Regulatory Commission (FERC)
|
3-6 months
|
|
Hart-Scott-Rodino - Federal Trade Commission (FTC)
and Department of Justice (DOJ) |
4-8 months
|
|
Nuclear Regulatory Commission (NRC)
|
7-9 months
|
|
Pennsylvania Public Utility Commission (PA PUC) (1)
|
6-9 months
|
Expected Transaction Closing in Q1 or Q2 2015
(1) Approval with regards to change in control over PPL Interstate Energy Company, and certain property transfers or other agreements to the extent necessary to effectuate the separation of PPL
Energy Supply.
Energy Supply.

© PPL Corporation 2014
PPL Corporation Update
18

© PPL Corporation 2014
|
|
2010 (1)
|
2012 (2)
|
2013 (3)
|
Pro-Forma PPL Corporation
|
|
Market Cap ($bn)
|
$12.8
|
$16.4
|
$18.8
|
|
|
Enterprise Value ($bn)
|
$17.2
|
$35.1
|
$37.8
|
|
|
FY+1 P/E
|
10.6x
|
13.0x
|
13.7x
|
|
|
Business Profile (4)
|
|
|
|
|
|
Regulatory Asset Base (5)
($bn) |
$12.2
|
$18.8
|
$20.9
|
$20.9 +
(6.7% CAGR from 2014 - 2018)
|
|
Reg. Jurisdictions
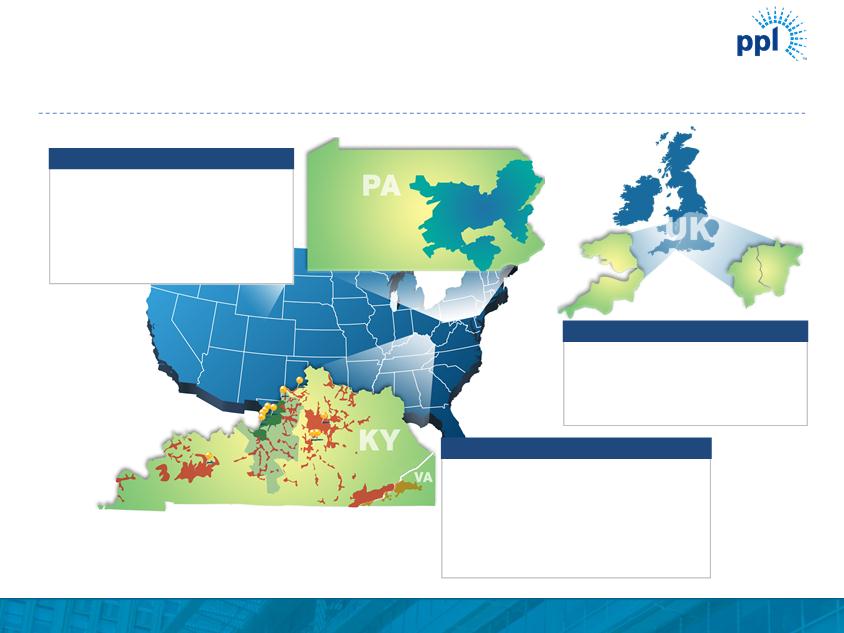
|
KY, PA, UK
|
KY, PA, UK
|
KY, PA, UK
|
KY, PA, UK
|
|
UTY P/E Multiple (6)
|
~12.4x
|
~14.1x
|
~15.1x
|
~16.3x (7)
|
Commitment to Creating Shareholder Value
19
Source: FactSet, Company Filings.
(1) As of December 31, 2010.
(2) As of December 31, 2012.
(3) As of December 31, 2013.
(4) Proportion of earnings from ongoing operations.
2008
2009
2010
2011
2012
2014
Future
% Utility
% Competitive Energy
100%
Evolution of PPL
(5) Represents capitalization for LKE, as LG&E and KU rate constructs are based on capitalization. Represents
Regulatory Asset Value (RAV) for WPD.
Regulatory Asset Value (RAV) for WPD.
(6) Based on PHLX UTY Index TTM multiples.
(7) As of June 05, 2014.
2013
73%
27%
28%
72%
16%
84%

© PPL Corporation 2014
PPL Corporation Investment Highlights
• 100% rate-regulated business model provides earnings and dividend
growth potential
growth potential
– Substantial projected growth in rate base: ~7% CAGR from 2014-2018
– Target EPS compound annual growth rate of at least 4%, excluding PPL Energy Supply(1)
– Maintain current dividend level until PPL Energy Supply transaction is completed;
intended growth thereafter
intended growth thereafter
• Operates in premium regulatory jurisdictions that provide substantial
opportunity for real-time recovery of capital investments
opportunity for real-time recovery of capital investments
– Approximately two-thirds of regulated capital expenditures earn returns subject to
minimal or no regulatory lag
minimal or no regulatory lag
• Strong management team with track record of execution
– U.K. team best-in-class among U.K. peers
– PPL Electric Utilities, Kentucky Utilities and LG&E have earned a combined 35 J.D. Power
awards for superior performance in reliability and customer service
awards for superior performance in reliability and customer service
20
(1) Based on 2014 hypothetical midpoint of $2.05 as shown on Slide 22.

© PPL Corporation 2014
Managing Corporate Costs
21
Total Supply Cost Allocations ~ $215 million (1)
$110mm
$75mm
$30mm
Remaining cost allocation
limited to systems and
hardware supporting utility
businesses
limited to systems and
hardware supporting utility
businesses
A portion of these
costs will be reduced
through Talen synergy
plan
costs will be reduced
through Talen synergy
plan
(1) Excludes approximately $50mm of interest expense that was allocated to the Supply segment and will remain at PPL after closing.

© PPL Corporation 2014
2014 and 2015 Earnings Forecast
22
|
Segment
|
2014E Ongoing
Midpoint(2)
|
2014E Ongoing
Midpoint
(ex-Supply) (2)
|
2015E
Midpoint
|
|
U.K. Regulated
|
$1.34
|
$1.34
|
$1.36
|
|
Kentucky Regulated
|
0.45
|
0.45
|
0.48
|
|
PA Regulated
|
0.39
|
0.39
|
0.39
|
|
Supply
|
0.11
|
--
|
--
|
|
Corporate and Other
|
(0.06)
|
(0.13)
|
(0.08)
|
|
Total
|
$2.23
|
$2.05
|
$2.15
|
$2.30
$2.25
$2.05
$2.15
$2.10
$2.00
Hypothetical
(1)
(1)
(1) 2015E earnings provided here assume no contribution from PPL Energy Supply. However, PPL Energy Supply is expected to continue to be part of PPL Corporation’s consolidated
earnings for a portion of 2015 based on an expected closing date of Q1 or Q2 2015.
earnings for a portion of 2015 based on an expected closing date of Q1 or Q2 2015.
(2) See reconciliation of ongoing earnings to reported earnings in the Appendix.

© PPL Corporation 2014
Closing Remarks and Q&A
23

© PPL Corporation 2014
Transaction Benefits
24
Creates a Highly
Attractive IPP
Attractive IPP
Significant
Shareholder
Value Creation
Shareholder
Value Creation
Transaction
Timing and
Certainty
Timing and
Certainty
• 15 GW of capacity focused primarily in PJM and ERCOT, two highly attractive
markets
markets
• Highly diversified fleet; environmentally well positioned
• Robust cash flow generation capability
• Conservative capitalization positions company well for future growth
• Move to “pure-play” businesses
• Permits the utility operations and competitive power operations to make
operating and capital decisions as separate businesses
operating and capital decisions as separate businesses
• Significant synergy potential: estimated at $155 million on an annual run-rate
basis
basis
– Cost savings plus additional benefits from improved asset
commercialization across the fleet
commercialization across the fleet
• Tax-free transaction structure
• Necessary regulatory approvals well understood
• Expected closing in Q1 or Q2 2015

© PPL Corporation 2014
Appendix
25

© PPL Corporation 2014
Talen Energy Asset Overview
26
(1) Excludes 11 Montana hydro assets to be sold under a September 26, 2013 Purchase and Sale Agreement with NorthWestern Corporation.
(2) Does not account for any market mitigation that will be required to achieve regulatory approvals.
(3) Includes Holtwood and Wallenpaupack.
(4) Includes Colstrip and J.E. Corette plants.
PPL Energy Supply Assets (1),(2)
Asset Location Fuel Type Ownership Owned Capacity ( MW) COD Region Montour PA Coal 100% 1,505 1972 - 1973 PJM Brunner Is land PA Coal 100% 1,437 1961 - 1969 PJM Keys tone PA Coal 12% 210 1967 - 1968 PJM Conem augh PA Coal 16% 276 1970 - 1971 PJM Martins Creek 3 & 4 PA Natural Gas / Oil 100% 1,400 ( Gas) / 1,700 ( Oil) 1975 - 1977 PJM Ironwood PA Natural Gas 100% 660 2001 PJM Lower Mt. Bethel Energy PA Natural Gas 100% 551 2004 PJM Peakers PA Natural Gas / Oil 100% 354 1967 - 1973 PJM Susquehanna PA Nuclear 90% 2,268 1983 - 1985 PJM Eastern Hydro (3) Montana Coal (4) Renewables PA MT NH, NJ, PA, VT Hydro Coal Renewables 100% 25% ( Cols trip) / 100% ( J. E. Corette) 100% 292 677 65 1910 - 1926 1968 - 1986 Various PJM WECC Various Total 9,995

© PPL Corporation 2014
Talen Energy Asset Overview (cont’d)
27
RJS Power Holdings LLC Assets(1)
Sapphire
Portfolio
Jade
Portfolio
Raven
Portfolio
(1) Does not account for any market mitigation that will be required to achieve regulatory approvals.
Asset Location Fuel Type Ownership Owned Capacity (MW) COD Region Brandon Shores MD Coal 100% 1,273 1984 - 1991 PJM Raven H. A. Wagner MD Coal / Natural Gas / Oil 100% 976 1956 - 1972 PJM Portfolio C. P. Crane MD Coal 100% 399 1961 - 1967 PJM Bayonne NJ Natural Gas / Oil 100% 171 1988 PJM Camden NJ Natural Gas / Oil 100% 151 1993 PJM Dartmouth MA Natural Gas / Oil 100% 89 1996 ISO- NE Sapphire Elmwood Park NJ Natural Gas / Oil 100% 71 1989 PJM Portfolio Newark Bay NJ Natural Gas / Oil 100% 129 1993 PJM Pedricktown NJ Natural Gas / Oil 100% 131 1992 PJM York PA Natural Gas 100% 52 1989 PJM Barney Davis 1 TX Natural Gas 100% 335 1974 ERCOT Barney Davis 2 TX Natural Gas 100% 674 2010 ERCOT Jade Nueces Bay 7 TX Natural Gas 100% 678 2010 ERCOT Portfolio Laredo 4 TX Natural Gas 100% 98 2008 ERCOT Laredo 5 TX Natural Gas 100% 98 2008 ERCOT Total 5,325

© PPL Corporation 2014
28
1. Recently finalized 316(b) regulations will require
intake structure modifications for sites with once-
through cooling towers. Pending ELG revisions
could require additional controls on other waste
water streams.
intake structure modifications for sites with once-
through cooling towers. Pending ELG revisions
could require additional controls on other waste
water streams.
2. The Regional Haze FIP for Montana would
require low NOx Burners and SOFA as well as
SNCRs for Colstrip 1 & 2 by 2017; PPL is
litigating EPA's final FIP.
require low NOx Burners and SOFA as well as
SNCRs for Colstrip 1 & 2 by 2017; PPL is
litigating EPA's final FIP.
3. Pending CCR regulations could require
additional controls and/or costs throughout the
fleet depending on final requirements.
additional controls and/or costs throughout the
fleet depending on final requirements.
4. In March 2013, PPL announced its intention to
mothball Corette SES starting in April 2015.
mothball Corette SES starting in April 2015.
5. Wagner and Crane are switching to Ultra-low
Sulfur Coal from Indonesia (Adaro) in 2015
which will only require DSI capital expenditure for
Crane to meet the MATS HCL standard.
Sulfur Coal from Indonesia (Adaro) in 2015
which will only require DSI capital expenditure for
Crane to meet the MATS HCL standard.
6. Wagner injects activated carbon to control
Mercury emissions to achieve Maryland Air Act
requirements and comply with the proposed
MATS rules requirements.
Mercury emissions to achieve Maryland Air Act
requirements and comply with the proposed
MATS rules requirements.
7. Crane and Wagner utilize once-through cooling
water systems. Wagner is expected to install
necessary equipment to comply with 316(b) rule.
water systems. Wagner is expected to install
necessary equipment to comply with 316(b) rule.
8. Crane has over-fired air with ash-reburn for NOx
RACT Control.
RACT Control.
NR = Not Required by Current or Proposed Regulations
Talen Energy Environmental Controls

© PPL Corporation 2014
Talen Projected Capital Expenditure Detail
29
|
($mm)
|
Brunner
Island |
Montour
|
Colstrip
|
Keystone
|
Conemaugh
|
Corette
|
Brandon
Shores |
H.A.
Wagner |
C.P. Crane
|
Total
|
|
Regional Haze (1)
|
--
|
--
|
$11.4
|
--
|
--
|
--
|
--
|
--
|
--
|
$11.4
|
|
MD HAA (2)
|
--
|
--
|
--
|
--
|
--
|
--
|
--
|
--
|
--
|
--
|
|
MATS (3)
|
$22.8
|
--
|
$6.6
|
--
|
$3.2
|
--
|
--
|
$1.5
|
$8.3
|
$42.4
|
|
CSAPR (4)
|
--
|
--
|
--
|
--
|
--
|
--
|
--
|
--
|
--
|
--
|
|
316(b) (5)
|
$30.0
|
--
|
--
|
--
|
--
|
--
|
--
|
$8.0
|
--
|
$38.0
|
|
Ash Basin
Modification (6) |
--
|
$26.0
|
--
|
--
|
--
|
--
|
--
|
--
|
--
|
$26.0
|
|
Total
|
|
|
|
|
|
|
|
|
|
$117.8
|
(1) To be completed by 2017.
(2) Maryland Healthy Air Act.
(3) Mercury and Air Toxics Standard to be completed by 2015.
(4) Cross-State Air Pollution Rule.
Total Capital Expenditure Plan
(5) Estimated cost and timing will be refined based upon analysis driven by final standard.
(6) Driven by permit timing; to be completed by 2017.
Projected Major Environmental Spend

© PPL Corporation 2014
PPL Corporate Structure Post Spin
30
PPL Global
LKE
PPL Electric Utilities
Kentucky Utilities
Louisville Gas & Electric
PPL Corporation
PPL Capital Funding
Credit Rating
Secured
Unsecured
Long-Term Issuer
Outlook
S&P
NR
BBB-
NR
Stable
Moody’s
NR
Baa3
Baa3
Stable
Credit Rating
Secured
Unsecured
Long-Term Issuer
Outlook
S&P
NR
NR
BBB
Stable
Moody’s
NR
NR
Baa3
Stable
Credit Rating
Secured
Unsecured
Long-Term Issuer
Outlook
S&P
NR
BBB
BBB
Stable
Moody’s
NR
Baa1
Baa1
Stable
Credit Rating
Secured
Unsecured
Long-Term Issuer
Outlook
S&P
NR
BBB-
BBB
Stable
Moody’s
NR
Baa2
Baa2
Stable
Credit Rating
Secured
Unsecured
Long-Term Issuer
Outlook
S&P
A-
NR
BBB
Stable
Moody’s
A2
Baa1
Baa1
Stable
Credit Rating
Secured
Unsecured
Long-Term Issuer
Outlook
S&P
A-
NR
BBB
Stable
Moody’s
A1
A3
A3
Stable
Credit Rating
Secured
Unsecured
Long-Term Issuer
Outlook
S&P
A-
NR
BBB
Stable
Moody’s
A1
A3
A3
Stable
© PPL Corporation 2014
PPL Overview
31
• Customers: 1.4 million Electric
• Allowed Distribution ROE: 10.40%
• Rate Base: $4.2 billion (1)
• 5-Year Transmission Rate Base CAGR: 13.4%
• 5-Year Distribution Rate Base CAGR: 6.2%
• Regulatory Entity: Pennsylvania PUC
PPL Electric Utilities
• Customers: 0.9 million Electric; 0.3 million Natural Gas
• KU Allowed ROE: 10.25% (KY), 10.00% (VA)
• LG&E Allowed ROE: 10.25%
• Rate Base: $7.6 billion (1),(2)
• 5-Year Rate Base CAGR: 6.5%
• Regulated Capacity: 8.1 GW
• Regulatory Entities: Kentucky PSC, Virginia SCC
Kentucky Utilities
• Customers: 7.8 million Electric
• Rate Base: $9.1 billion (1),(2)
• 5-Year Rate Base CAGR: 5.6%
• Regulatory Entity: Ofgem
U.K. Delivery
(1) Year-end Rate Base as of December 31, 2013.
(2) Represents capitalization for LKE, as LG&E and KU rate constructs are based on capitalization. Represents Regulatory Asset Value (RAV) for WPD.

© PPL Corporation 2014
U.K. Regulated Segment Overview
Investment Highlights
• Highly attractive rate‐regulated business
– Regulator‐approved multi‐year forward‐looking revenues based
on future business plan, including capital expenditures and O&M
plus adjustments for inflation
on future business plan, including capital expenditures and O&M
plus adjustments for inflation
– Real‐time return of and return on capital investment - no lag
– No volumetric risk
– Additional incentives for operational efficiency and high‐quality
service
service
• Best‐in‐class management team with track record of
delivering results
delivering results
32
Capital Expenditure Plan (1)
United Kingdom Delivery Territories
Projected Rate Base Growth (1),(2)
(1) Figures based on assumed exchange rate of $1.58 / GBP.
(2) Based on RIIO-ED1 business plan as filed on July 1, 2013.

© PPL Corporation 2014
Kentucky Regulated Segment Overview
Investment Highlights
• Efficient, well‐run utilities focused on safety, reliability and customer
service
service
• Constructive regulatory environment that provides a timely return on a
substantial amount of planned CapEx over the next 5 years
substantial amount of planned CapEx over the next 5 years
– Environmental Cost Recovery (ECR): ~$2.3 billion estimated spend
on projects approved by the KPSC with a 10.25% ROE - virtually
no regulatory lag
on projects approved by the KPSC with a 10.25% ROE - virtually
no regulatory lag
– Other supportive recovery mechanisms include Construction
Work In Progress, Fuel Adjustment Clause, Gas Supply Clause
Adjustment and Demand Side Management recovery
Work In Progress, Fuel Adjustment Clause, Gas Supply Clause
Adjustment and Demand Side Management recovery
33
Capital Expenditure Plan
($bn)
Kentucky Delivery Territories
Projected Rate Base Growth
(1) Expect between 80% and 90% to receive timely returns via ECR mechanism based on historical experience and future projections.
(1)

© PPL Corporation 2014
Pennsylvania Regulated Segment Overview
Investment Highlights
• Significant growth in transmission portion of business which earns a favorable
rate of return on a near real‐time basis
rate of return on a near real‐time basis
– CAGR of 13.4% in transmission rate base through 2018 driven by initiatives
to improve aging infrastructure
to improve aging infrastructure
– ROE of 11.68% earned through FERC Formula Rate Mechanism
– ROE of 12.93% and return on CWIP for $630 million Susquehanna‐Roseland
project
project
– Return on CWIP for $310 million of Northeast Pocono Reliability project
• Reliability initiatives drive distribution rate base growth at a projected CAGR of
over 6% through 2018
over 6% through 2018
• Act 11 - Alternative ratemaking legislation provides for more timely recovery of
about $800 million in distribution plant costs that improve and maintain safety
and reliability based upon a five‐year plan filed with the PA PUC
about $800 million in distribution plant costs that improve and maintain safety
and reliability based upon a five‐year plan filed with the PA PUC
34
Capital Expenditure Plan
Pennsylvania Delivery Territories
Projected Rate Base Growth
($bn)

© PPL Corporation 2014
Reg G Reconciliation - Talen Energy
35
(1) Calculated using estimated effective tax rate of 40%.
(2) Excludes $155mm of synergies resulting from the transaction, which are included in “Model Year” Adjusted EBITDA of $1,067mm for illustrative purposes.
|
2015E Adjusted EBITDA
|
||
|
($mm)
|
PPL Energy Supply
|
RJS Power Holdings LLC
|
|
Net Income/(Loss)
|
$ 46
|
$ 75
|
|
Income Taxes (1)
|
31
|
50
|
|
Interest Expense
|
177
|
67
|
|
Depreciation & Amortization
|
493
|
93
|
|
EBITDA
|
747
|
285
|
|
Add: Non-Cash Compensation
|
27
|
--
|
|
Less: Nuclear Fuel Amortization
|
147
|
--
|
|
Adjusted EBITDA(2)
|
$ 627
|
$ 285
|
Adjusted EBITDA, which is a non-GAAP financial measure, represents net income (loss) before interest expense, income taxes, depreciation and amortization, adjusted for certain items as detailed in
the reconciliation. Adjusted EBITDA is not intended to represent cash flows from operations or net income (loss) as defined by U.S. GAAP as an indicator of operating performance and is not
necessarily comparable to similarly-titled measures reported by other companies. We believe Adjusted EBITDA is useful to investors and other users of our financial statements in evaluating our
operating performance because it provides them with an additional tool to compare business performance across companies and across periods. We believe that EBITDA is widely used by investors
to measure a company’s operating performance without regard to such items as interest expense, income taxes, depreciation and amortization, which can vary substantially from company to
company depending upon accounting methods and book value of assets, capital structure and the method by which assets were acquired. Additionally, we believe that investors commonly adjust
EBITDA information to eliminate the effect of restructuring and other expenses, which vary widely from company to company and impair comparability. We adjust for these and other items as our
management believes that these items would distort their ability to efficiently view and assess our core operating trends.
In summary, our management uses Adjusted EBITDA as a measure of operating performance to assist in comparing performance from period to period on a consistent basis and to readily view
operating trends, as a measure for planning and forecasting overall expectations and for evaluating actual results against such expectations, and in communications with our Board of Directors,
shareholders, creditors, analysts and investors concerning our financial performance.
operating trends, as a measure for planning and forecasting overall expectations and for evaluating actual results against such expectations, and in communications with our Board of Directors,
shareholders, creditors, analysts and investors concerning our financial performance.

© PPL Corporation 2014
Reg G Reconciliation - PPL Corp
36
$
1.34
$
0.45
$
0.39
$
(0.13)
$
2.05
$
2.10
$
2.00
(0.01)
(0.01)
(0.01)
(0.01)
Change in WPD line loss accrual
Other:
Total Special Items
Reported Earnings
Earnings from Ongoing Operations
Special Items:
Foreign currency-related economic hedges
U.K.
Kentucky
Pennsylvania
Corporate
High
Low
$
1.36
$
0.48
$
0.39
$
(0.08)
$
2.15
$
2.25
$
2.05
High
Low
U.K.
Kentucky
Pennsylvania
Corporate
Total Special Items
Reported Earnings
Earnings from Ongoing Operations
Special Items:
$
1.34
$
0.45
$
0.39
$
0.11
$
(0.06)
$
2.23
$
2.30
$
2.15
(0.20)
(0.20)
(0.20)
(0.20)
(0.01)
(0.01)
(0.01)
(0.01)
(0.02)
(0.02)
(0.02)
(0.02)
Change in WPD line loss accrual
High
Low
(After-Tax)
(Unaudited)
U.K.
Kentucky
Pennsylvania
Corporate
Other:
Total Special Items
Reported Earnings
Earnings from Ongoing Operations
Special Items:
Adjusted energy-related economic activity, net
Foreign currency-related economic hedges
Kerr Dam Project impairment
(1) 2014 forecasts reflect special items recorded in Q1 2014.

© PPL Corporation 2014
Other Non-GAAP Financial Measures
37
"Earnings from ongoing operations," also referred to as "ongoing earnings," should not be considered as an alternative to reported earnings, or
net income attributable to PPL shareowners, which is an indicator of operating performance determined in accordance with U.S. generally
accepted accounting principles (GAAP). PPL believes that "earnings from ongoing operations," although a non-GAAP financial measure, is also
useful and meaningful to investors because it provides management's view of PPL's fundamental earnings performance as another criterion in
making investment decisions. PPL's management also uses "earnings from ongoing operations" in measuring certain corporate performance
goals. Other companies may use different measures to present financial performance.
"Earnings from ongoing operations" is adjusted for the impact of special items. Special items include:
• Adjusted energy-related economic activity (as discussed below).
• Unrealized gains or losses on foreign currency-related economic hedges.
• Gains and losses on sales of assets not in the ordinary course of business.
• Impairment charges (including impairments of securities in the company's nuclear decommissioning trust funds).
• Workforce reduction and other restructuring effects.
• Acquisition-related adjustments.
• Other charges or credits that are, in management's view, not reflective of the company's ongoing operations.
Adjusted energy-related economic activity includes the changes in fair value of positions used to economically hedge a portion of the economic
value of the competitive generation assets, full-requirement sales contracts and retail activities. This economic value is subject to changes in fair
value due to market price volatility of the input and output commodities (e.g., fuel and power) prior to the delivery period that was hedged.
Adjusted energy-related economic activity also includes the ineffective portion of qualifying cash flow hedges and premium amortization
associated with options. This economic activity is deferred and included in earnings from ongoing operations over the delivery period of the item
that was hedged or upon realization. Management believes that adjusting for such amounts provides a better matching of earnings from ongoing
operations to the actual amounts settled for PPL's underlying hedged assets. Please refer to the Notes to the Consolidated Financial Statements
and MD&A in PPL Corporation's periodic filings with the Securities and Exchange Commission for additional information on adjusted energy-
related economic activity.

© PPL Corporation 2014
38
Statements contained in this presentation, including statements with respect to future earnings, cash flows, financing, regulation, operating
performance and corporate strategy, are “forward-looking statements” within the meaning of the federal securities laws. Although PPL
Corporation believes that the expectations and assumptions reflected in these forward-looking statements are reasonable, these statements are
subject to a number of risks and uncertainties, and actual results may differ materially from the results discussed in the statements. The
following are among the important factors that could cause actual results to differ materially from the forward-looking statements: Failure to
obtain necessary regulatory approvals or to satisfy any of the other conditions to the proposed transaction; actions, including divestitures, that
may be required to obtain necessary regulatory approvals; adverse effects on the market price of PPL’s common stock and our operating results
because of a failure to complete, or a delay in the completion of, the proposed transaction; failure to realize the expected benefits of the
proposed transaction; negative effects of the announcement or consummation of the proposed transaction; market demand and prices for
energy, capacity and fuel; weather conditions affecting customer energy usage and operating costs; competition in power markets; the effect of
any business or industry restructuring; the profitability and liquidity of PPL Corporation and its subsidiaries; new accounting requirements or new
interpretations or applications of existing requirements; operating performance of generating plants and other facilities; the length of scheduled
and unscheduled outages at our generating plants; environmental conditions and requirements and the related costs of compliance, including
environmental capital expenditures and emission allowance and other expenses; system conditions and operating costs; development of new
projects, markets and technologies; performance of new ventures; asset or business acquisitions and dispositions; any impact of hurricanes or
other severe weather on our business, including any impact on fuel prices; receipt of necessary government or other regulatory permits,
approvals, rate relief and cost recovery; capital market conditions and decisions regarding capital structure; the impact of state, federal or
foreign investigations applicable to PPL Corporation and its subsidiaries; the outcome of litigation against PPL Corporation and its subsidiaries;
stock price performance; the market prices of equity securities and the impact on pension income and resultant cash funding requirements for
defined benefit pension plans; the securities and credit ratings of PPL Corporation and its subsidiaries; political, regulatory or economic
conditions in states, regions or countries where PPL Corporation or its subsidiaries conduct business, including any potential effects of threatened
or actual terrorism or war or other hostilities; foreign exchange rates; new state, federal or foreign legislation, including new tax legislation; and
the commitments and liabilities of PPL Corporation and its subsidiaries. Any such forward-looking statements should be considered in light of
such important factors and in conjunction with PPL Corporation’s Form 10-K and other reports on file with the Securities and Exchange
Commission.
Cautionary Statements and Factors
That May Affect Future Results
That May Affect Future Results