Attached files
| file | filename |
|---|---|
| 8-K - 8-K - OneBeacon Insurance Group, Ltd. | a8-k20140610.htm |

Investor Meeting June 10, 2014 Exhibit 99.1

© 2014 OneBeacon Insurance Group 2 Safe Harbor Statement Forward-Looking Statements This presentation may contain "forward-looking statements" within the meaning of Section 27A of the Securities Act of 1933 and Section 21E of the Securities Exchange Act of 1934. All statements, other than statements of historical facts, included or referenced in this presentation that address activities, events or developments which we expect will or may occur in the future are forward-looking statements. The words "will," "believe," "intend," "expect," "anticipate," "project," "estimate," "predict," “anticipate” and similar expressions are also intended to identify forward-looking statements. These forward-looking statements include, among others, statements with respect to OneBeacon’s: (i) change in book value per share or return on equity; (ii) business strategy; (iii) financial and operating targets or plans; (iv) incurred loss and loss adjustment expenses and the adequacy of our loss and loss adjustment expense reserves and related reinsurance; (v) projections of revenues, income (or loss), earnings (or loss) per share, dividends, market share or other financial forecasts; (vi) expansion and growth of our business and operations; (vii) future capital expenditures; and (viii) pending transactions. These statements are based on certain assumptions and analyses made by us in light of OneBeacon’s experience and judgments about historical trends, current conditions and expected future developments, as well as other factors believed to be appropriate in the circumstances. However, whether actual results and developments will conform to our expectations is subject to a number of risks, uncertainties or other factors which are described in more detail, that could cause actual results to differ materially from expectations, including: (i) claims arising from catastrophic events, such as hurricanes, windstorms, earthquakes, floods, or terrorist attacks; (ii) recorded loss and loss adjustment expense reserves subsequently proving to have been inadequate; (iii) exposure to asbestos or environmental claims; (iv) changes in interest rates, debt or equity markets or other market volatility that negatively impact our investment portfolio; (v) competitive forces and the cyclicality of the property and casualty insurance industry; (vi) actions taken by rating agencies from time to time with respect to us, such as financial strength or credit rating downgrades or placing our ratings on negative watch; (vii) the continued availability of capital and financing; (viii) the outcome of litigation and other legal or regulatory proceedings; (ix) our ability to retain key personnel; (x) our ability to continue meeting our debt and related service obligations or to pay dividends; (xi) the continued availability and cost of reinsurance coverage and our ability to collect reinsurance recoverables; (xii) the ability of our technology resources to prevent data breach and the ability of our internal controls to ensure compliance with legal and regulatory policies; (xiii) our ability to successfully develop new specialty businesses; (xiv) changes in laws or regulations, or their interpretations, which are applicable to us, our competitors, our agents or our customers; (xv) participation in guaranty funds and mandatory market mechanisms; (xvi) the impact of new theories of liability; (xvii) changes to current shareholder dividend practice and regulatory restrictions on dividends; (xviii) our status as a subsidiary of White Mountains, including potential conflicts of interest; (xix) whether the sale of our runoff business closes; and (xx) other factors, most of which are beyond our control, including the risks that are described from time to time in OneBeacon's filing with the Securities and Exchange Commission, including but not limited to OneBeacon's Annual Report on Form 10-K for the fiscal year ended December 31, 2013 filed February 28, 2014. Consequently, all of the forward-looking statements made in this presentation are qualified by these cautionary statements, and there can be no assurance that the anticipated results or developments will be realized or, even if substantially realized, that they will have the expected consequences. OneBeacon assumes no obligation to update publicly any such forward-looking statements, whether as a result of new information, future events or otherwise. Non-GAAP Financial Measures Within this presentation, we use certain non-GAAP financial measures which are identified with a “NGM” designation. Please see the appendix at the end of the presentation for an explanation of such non-GAAP financial measures and a reconciliation of the measure to the most closely comparable GAAP financial measure.

© 2014 OneBeacon Insurance Group 3 Introduction Highlights Overview of Business Investments, Loss Reserves, Capital Management Our View Going Forward Q&A Today’s Agenda

Operating Principles: What We Care About Most Underwriting comes first Maintain a disciplined balance sheet Invest for total return Think like owners © 2014 OneBeacon Insurance Group 4
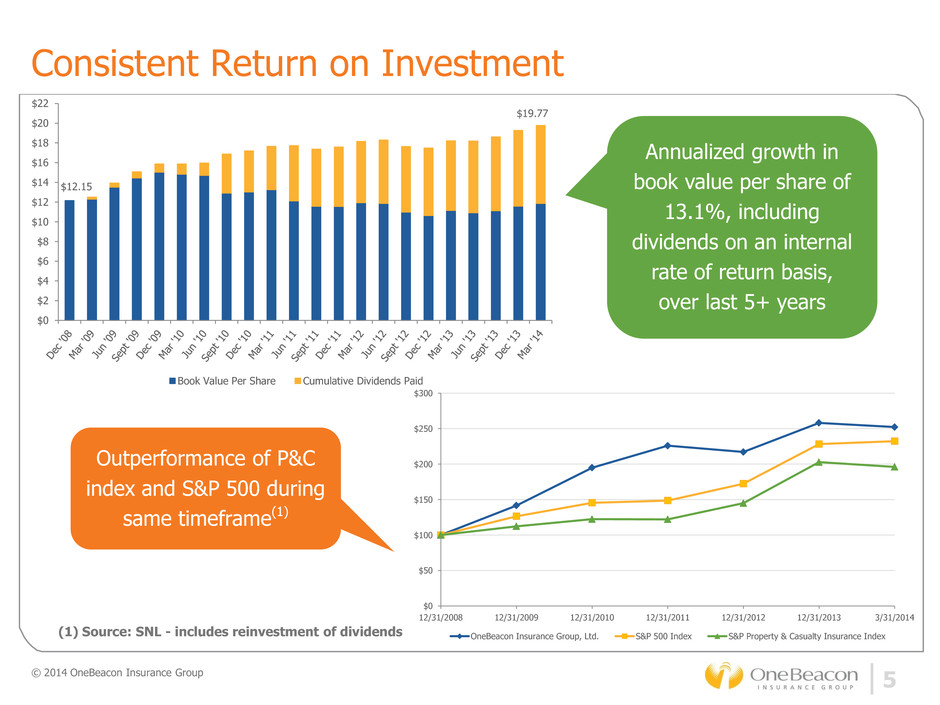
Annualized growth in book value per share of 13.1%, including dividends on an internal rate of return basis, over last 5+ years Consistent Return on Investment © 2014 OneBeacon Insurance Group 5 (1) Source: SNL - includes reinvestment of dividends Outperformance of P&C index and S&P 500 during same timeframe(1) $0 $2 $4 $6 $8 $10 $12 $14 $16 $18 $20 $22 Book Value Per Share Cumulative Dividends Paid $12.15 $19.77 $0 $50 $100 $150 $200 $250 $300 12/31/2008 12/31/2009 12/31/2010 12/31/2011 12/31/2012 12/31/2013 3/31/2014 OneBeacon Insurance Group, Ltd. S&P 500 Index S&P Property & Casualty Insurance Index

© 2014 OneBeacon Insurance Group 6 Specialty Transformation Well-diversified specialty insurer Standalone underwriting units with expertise focused on niche businesses Diversified by line of business, market segment, targeted distribution and geography Track record of underwriting profitability Since 2008: 90% average combined ratio for Specialty Products and Specialty Industries segments Experienced management teams focused on profitability Business leaders: 25+ years industry experience, on average Clear success criteria: profits, not scale Compensation aligned with underwriting profits and growth in book value per share • 2001: WTM acquisition • 2006: IPO • 2009-10: Commercial and Personal Lines sold • 2014: Runoff sale expected to close • 2002-06: Professional, Specialty Property, Financial Services, Technology, Accident formed • 2007-10: Government Risks, Hagerty partnership formed; Entertainment acquired • 2010-13: Environmental, Programs, Crop and Surety formed; Hagerty partnership terminated, exited Energy
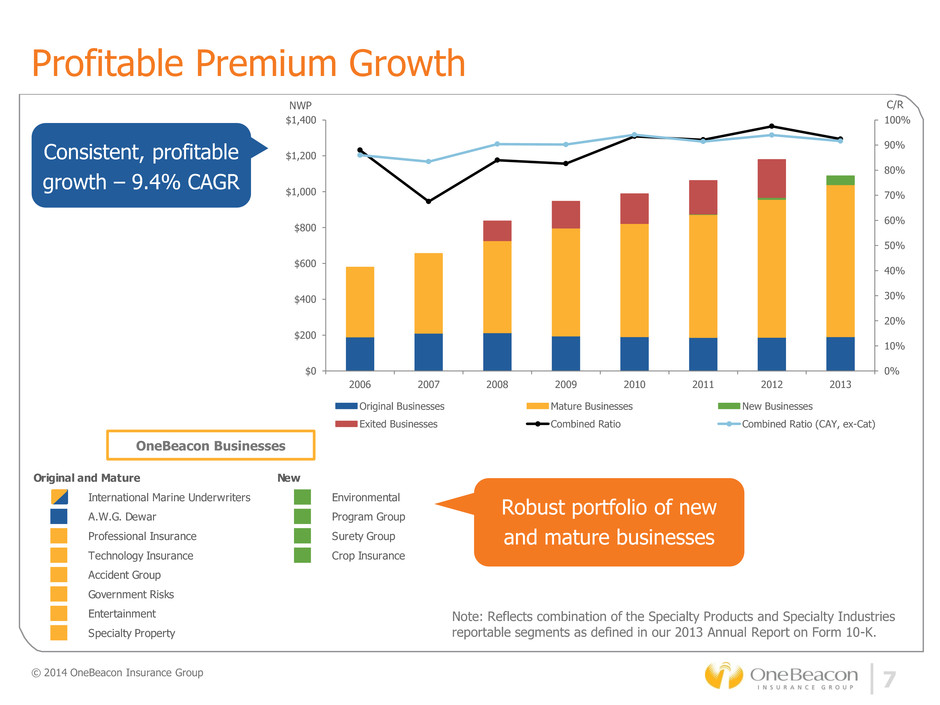
Profitable Premium Growth © 2014 OneBeacon Insurance Group 7 Consistent, profitable growth – 9.4% CAGR Robust portfolio of new and mature businesses OneBeacon Businesses NWP C/R Note: Reflects combination of the Specialty Products and Specialty Industries reportable segments as defined in our 2013 Annual Report on Form 10-K. 0% 10% 20% 30% 40% 50% 60% 70% 80% 90% 100% $0 $200 $400 $600 $800 $1,000 $1,200 $1,400 2006 2007 2008 2009 2010 2011 2012 2013 Original Businesses Mature Businesses New Businesses Exited Businesses Combined Ratio Combined Ratio (CAY, ex-Cat) Original and Mature New International Marine Underwriters Environmental A.W.G. Dewar Program Group Professional Insurance Surety Group Technology Insurance Crop Insurance Accident Group Government Risk Entertainment Specialty Prop rty

Diversified Book of Business © 2014 OneBeacon Insurance Group 8 Geography 11.7% 14.9% 6.9% 13.4% 17.5% 9.4% 20.0% 4.6% All Other 1.6% Line of Business Note: Reflects combination of the Specialty Products and Specialty Industries reportable segments as defined in our 2013 Annual Report on Form 10-K. Ocean and Inland Marine CMP and Auto (Prop) Fire and Allied Medical Professional GL - Occurrence GL - Claims Made Workers Compensation Auto Liability Multiperil Crop Other Casualty Accident and Health Credit and Other
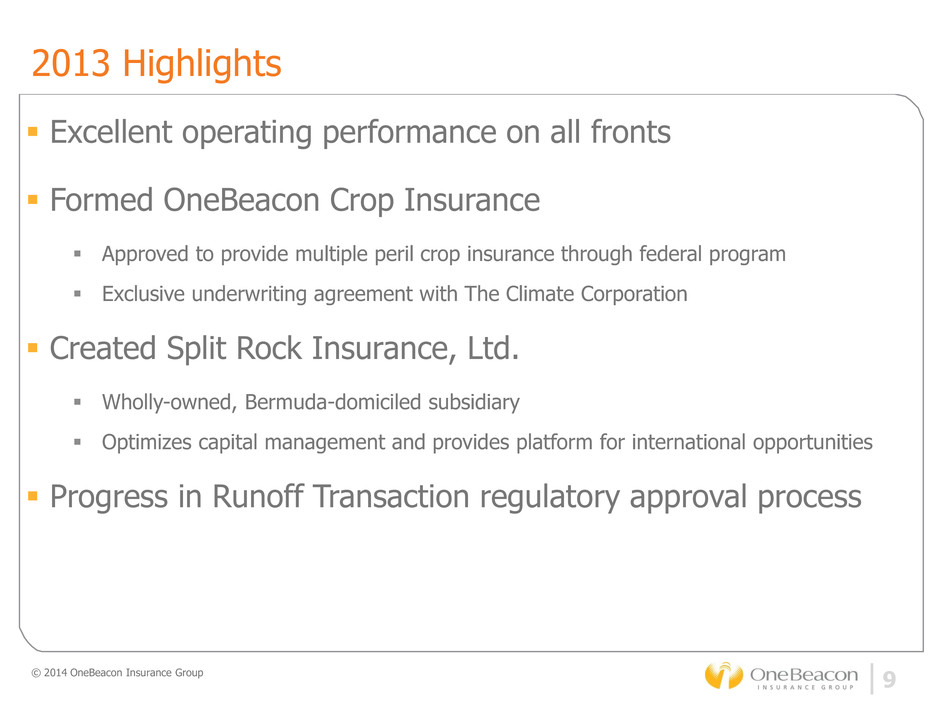
2013 Highlights © 2014 OneBeacon Insurance Group 9 Excellent operating performance on all fronts Formed OneBeacon Crop Insurance Approved to provide multiple peril crop insurance through federal program Exclusive underwriting agreement with The Climate Corporation Created Split Rock Insurance, Ltd. Wholly-owned, Bermuda-domiciled subsidiary Optimizes capital management and provides platform for international opportunities Progress in Runoff Transaction regulatory approval process
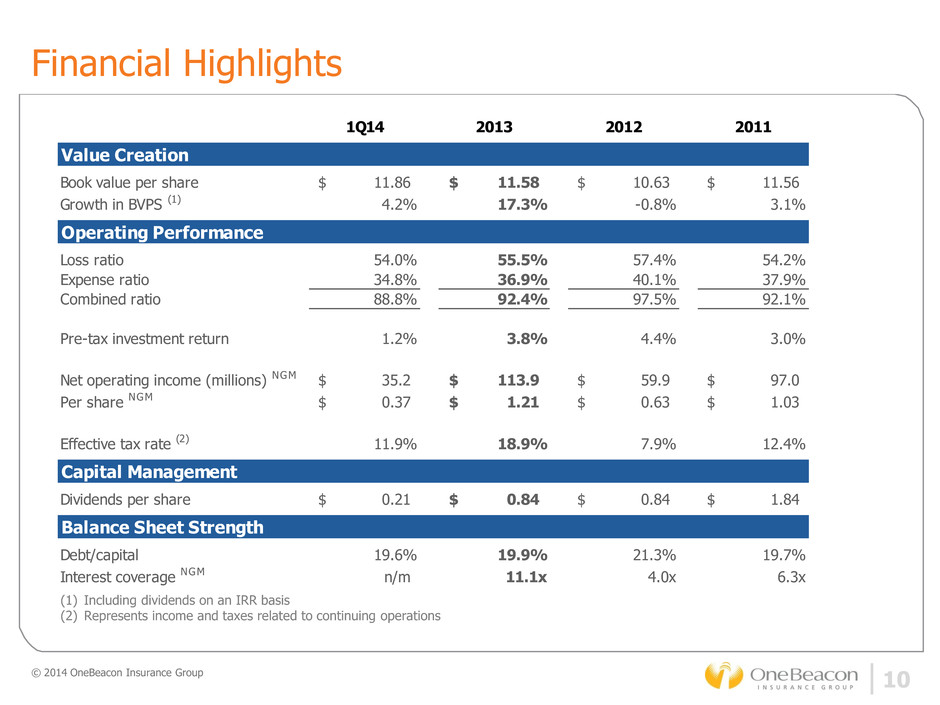
Financial Highlights © 2014 OneBeacon Insurance Group 10 (1) Including dividends on an IRR basis (2) Represents income and taxes related to continuing operations 1Q14 2013 2012 2011 Book value per share 11.86$ 11.58$ 10.63$ 11.56$ Growth in BVPS (1) 4.2% 17.3% -0.8% 3.1% Loss ratio 54.0% 55.5% 57.4% 54.2% Expense ratio 34.8% 36.9% 40.1% 37.9% Combined ratio 88.8% 92.4% 97.5% 92.1% Pre-tax investment return 1.2% 3.8% 4.4% 3.0% Net operating income (millions) NGM 35.2$ 113.9$ 59.9$ 97.0$ Per share NGM 0.37$ 1.21$ 0.63$ 1.03$ Effective tax rate (2) 11.9% 18.9% 7.9% 12.4% Dividends per share 0.21$ 0.84$ 0.84$ 1.84$ Debt/capital 19.6% 19.9% 21.3% 19.7% Interest coverage NGM n/m 11.1x 4.0x 6.3x Balance Sheet Strength Value Creation Operating Performance Capital Management

Note: Reflects combination of the Specialty Products and Specialty Industries reportable segments as defined in our 2013 Annual Report on Form 10-K. Combined Ratio © 2014 OneBeacon Insurance Group 11 43.9% 55.1% 54.2% 57.4% 55.5% 54.0% 38.7% 38.4% 37.9% 40.1% 36.9% 34.8% 82.6% 93.5% 92.1% 97.5% 92.4% 88.8% 0% 10% 20% 30% 40% 50% 60% 70% 80% 90% 100% 2009 2010 2011 2012 2013 1Q14 Total Calendar Year Loss Ratio Expense Ratio
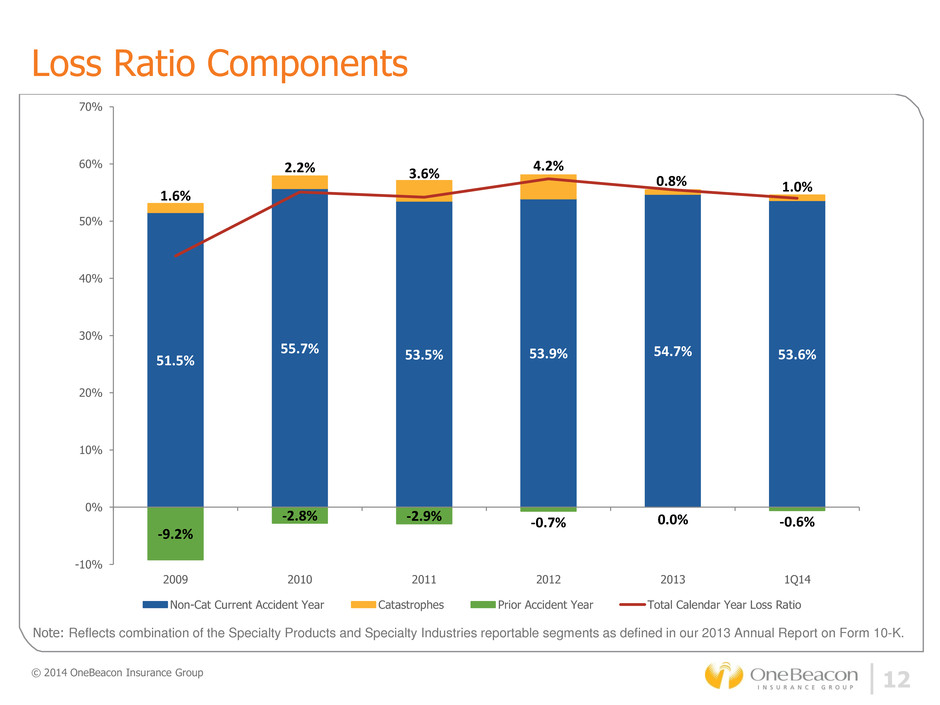
Loss Ratio Components © 2014 OneBeacon Insurance Group 12 51.5% 55.7% 53.5% 53.9% 54.7% 53.6% 1.6% 2.2% 3.6% 4.2% 0.8% 1.0% -9.2% -2.8% -2.9% -0.7% 0.0% -0.6% -10% 0% 10% 20% 30% 40% 50% 60% 70% 2009 2010 2011 2012 2013 1Q14 Non-Cat Current Accident Year Catastrophes Prior Accident Year Total Calendar Year Loss Ratio Note: Reflects combination of the Specialty Products and Specialty Industries reportable segments as defined in our 2013 Annual Report on Form 10-K.
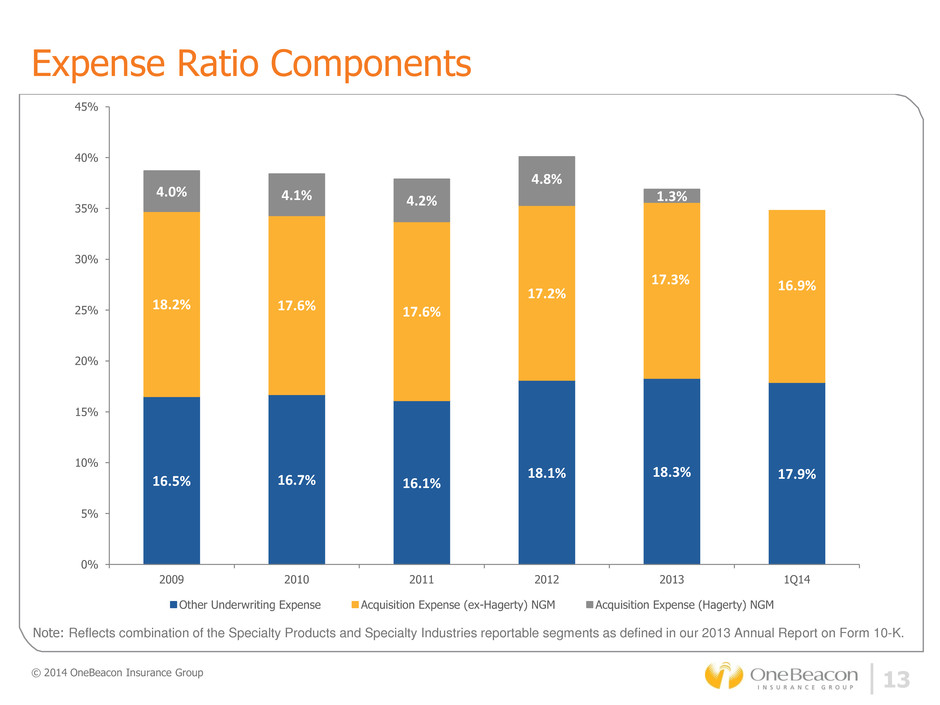
Expense Ratio Components © 2014 OneBeacon Insurance Group 13 Note: Reflects combination of the Specialty Products and Specialty Industries reportable segments as defined in our 2013 Annual Report on Form 10-K. 16.5% 16.7% 16.1% 18.1% 18.3% 17.9% 18.2% 17.6% 17.6% 17.2% 17.3% 16.9% 4.0% 4.1% 4.2% 4.8% 1.3% 0% 5% 10% 15% 20% 25% 30% 35% 40% 45% 2009 2010 2011 2012 2013 1Q14 Other Underwriting Expense Acquisition Expense (ex-Hagerty) NGM Acquisition Expense (Hagerty) NGM

© 2014 OneBeacon Insurance Group 14 Our Businesses Paul Romano, Dennis Crosby and Paul Brehm Executive Vice Presidents
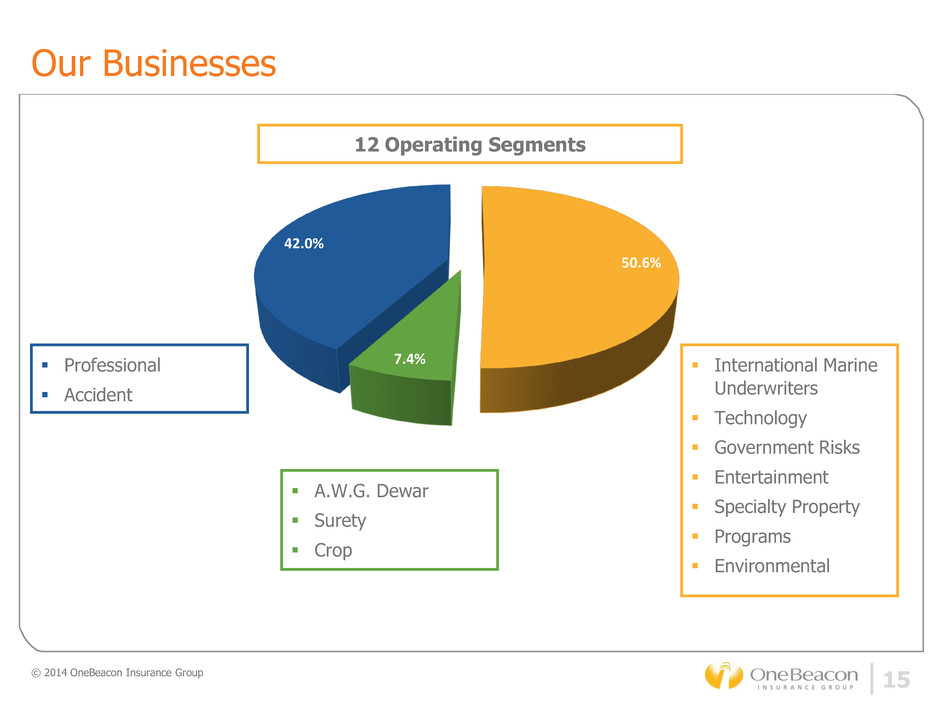
Our Businesses © 2014 OneBeacon Insurance Group 15 International Marine Underwriters Technology Government Risks Entertainment Specialty Property Programs Environmental Professional Accident A.W.G. Dewar Surety Crop 50.6% 7.4% 42.0% 12 Operating Segments

Our Businesses – Paul Romano Professional Core offerings: D&O, E&O, Medical Professional Liability, Medical Stop Loss Positive rates continue, though pace has slowed in most lines Highly competitive markets; notable over-capacity ACA and other regulatory activity impacting our approach At – or slightly ahead of – profitability targets Accident Occupational Accident for trucking industry – “top 3” writer Interest in diversifying within broader Accident market Performance has exceeded targets Expect continued success © 2014 OneBeacon Insurance Group 16 Professional Health Care Management Liability Professional Liability Financial Services Accident

Current View Strong risk selection Business segmentation/analytics Positive rate change Deeper expertise Business expansion Bottom-line focused Outlook Rate pressure Nimble execution Opportunistic expansion Specialty differentiation outperforms Our Businesses – Dennis Crosby © 2014 OneBeacon Insurance Group 17 International Marine Underwriters Technology Government Risks Entertainment Specialty Property Programs Environmental

A.W.G. Dewar – Tuition Reimbursement One of our most mature businesses Primary segmentation: prep schools vs. colleges Focus on maintaining market dominance Strong profitability, but minimal top-line growth Surety New business in 2012 Focus on middle-market commercial Production and profits already exceed both expectations and targets Expect continued strong growth and profits Crop… Our Businesses – Paul Brehm © 2014 OneBeacon Insurance Group 18 A.W.G. Dewar Surety Crop

OneBeacon Crop Insurance © 2014 OneBeacon Insurance Group 19 Partnership with The Climate Corporation Extraordinary data, modeling and technology Established distribution channel Recently appointed President – Crop Insurance First reinsurance year: 21 states, 500 agents Target traditional row crops (80% corn & soybeans) Below industry average hail exposure Outstanding prospects for growth at – or above – target returns Consistent OneBeacon formula Niche focus Experienced leadership Specialized expertise Dedicated distribution Bottom-line accountability Current OneBeacon States
© 2014 OneBeacon Insurance Group 20 Investments, Loss Reserves, Capital Management Paul McDonough Senior Vice President & Chief Financial Officer

74.5% 19.7% 5.8% 0% 20% 40% 60% 80% 100% 3/31/2014 Fixed Maturity Equity Short Term © 2014 OneBeacon Insurance Group 21 $2.6 billion(1) Fixed Maturity Allocation Asset Backed: 44.8% Corporate Debt: 38.5% U.S./Foreign Gov’t: 12.4% Preferred Shares: 4.3% High Quality Investment Portfolio Composition Ratings Duration of Fixed Maturity Securities = 2.5 years (2) (1) Includes $222 million of securities classified as held for sale in connection with the sale of the runoff business. (2) Excludes short-term investments. Duration of the fixed maturity portfolio including short-term investments is 2.3 years. Weighted Average Credit Quality = A/A to AA/Aa U.S. Gov't 10.9% AAA/Aaa 13.0% AA/Aa 28.2% A/A 23.2% BBB/Baa 19.6% Other / Not Rated 5.1%
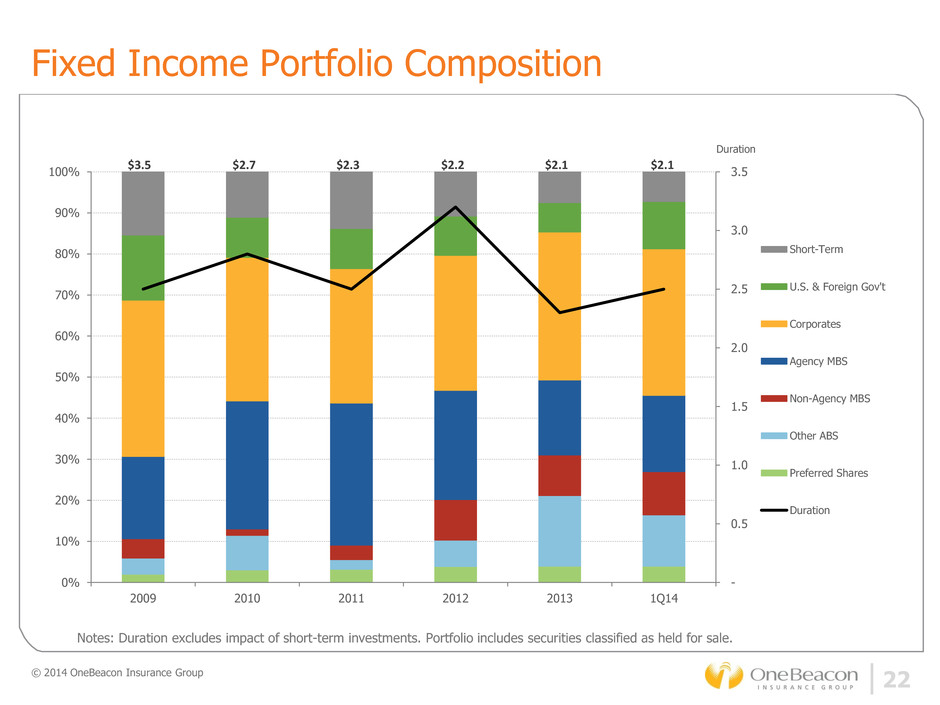
Fixed Income Portfolio Composition © 2014 OneBeacon Insurance Group 22 $3.5 $2.7 $2.3 $2.2 $2.1 $2.1 Notes: Duration excludes impact of short-term investments. Portfolio includes securities classified as held for sale. Duration - 0.5 1.0 1.5 2.0 2.5 3.0 3.5 0% 10% 20% 30% 40% 50% 60% 70% 80% 90% 100% 2009 2010 2011 2012 2013 1Q14 Short-Term U.S. & Foreign Gov't Corporates Agency MBS Non-Agency MBS Other ABS Preferred Shares Duration

0% 10% 20% 30% 40% 50% 60% 70% 80% 90% 100% 2009 2010 2011 2012 2013 1Q14 Alternative Investments Convertible Bonds Common Equities & REITs Exposure % of Shareholders' Equity Equity Portfolio Composition © 2014 OneBeacon Insurance Group 23 $0.5 $0.6 $0.5 $0.5 $0.5 $0.5
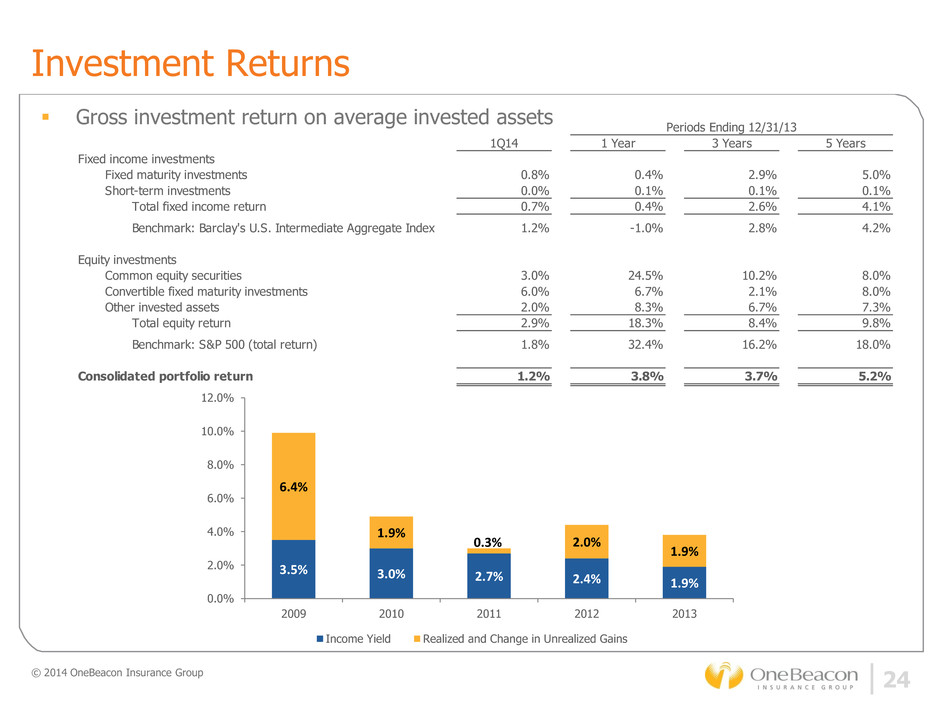
Investment Returns Gross investment return on average invested assets © 2014 OneBeacon Insurance Group 24 3.5% 3.0% 2.7% 2.4% 1.9% 6.4% 1.9% 0.3% 2.0% 1.9% 0.0% 2.0% 4.0% 6.0% 8.0% 10.0% 12.0% 2009 2010 2011 2012 2013 Income Yield Realized and Change in Unrealized Gains 1Q14 1 Year 3 Years 5 Years Fixed income investments Fixed maturity investments 0.8% 0.4% 2.9% 5.0% Short-term investments 0.0% 0.1% 0.1% 0.1% Total fixed income return 0.7% 0.4% 2.6% 4.1% Benchmark: Barclay's U.S. Intermediate Aggregate Index 1.2% -1.0% 2.8% 4.2% Equity investments Common equity securities 3.0% 24.5% 10.2% 8.0% Convertible fixed maturity investments 6.0% 6.7% 2.1% 8.0% Other invested assets 2.0% 8.3% 6.7% 7.3% Total equity return 2.9% 18.3% 8.4% 9.8% Benchmark: S&P 500 (total return) 1.8% 32.4% 16.2% 18.0% Consolidated portfolio return 1.2% 3.8% 3.7% 5.2% Periods Ending 12/31/13
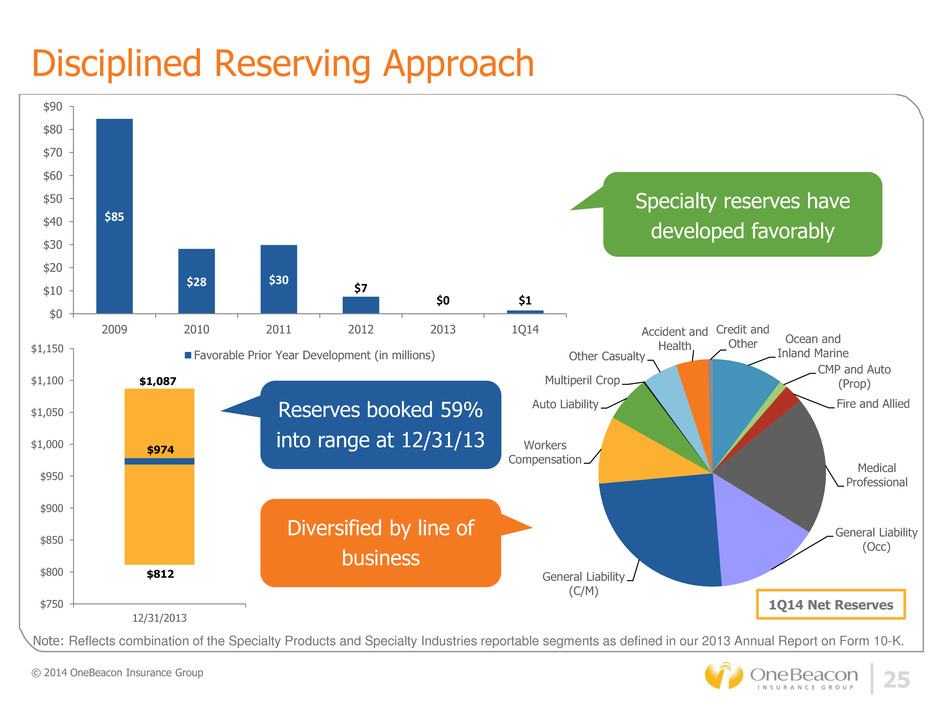
© 2014 OneBeacon Insurance Group 25 Disciplined Reserving Approach Specialty reserves have developed favorably Reserves booked 59% into range at 12/31/13 Diversified by line of business 1Q14 Net Reserves $750 $800 $850 $900 $950 $1,000 $1,050 $1,100 $1,150 12/31/2013 $8 2 $1,087 $974 Note: Reflects combination of the Specialty Products and Specialty Industries reportable segments as defined in our 2013 Annual Report on Form 10-K. Ocean and Inland Marine CMP and Auto (Prop) Fire and Allied Medical Professional General Liability (Occ) General Liability (C/M) Workers Compensation Auto Liability Multiperil Crop Other Casualty Accident and Health Credit and Other $85 $28 $30 $7 $0 $1 $0 $10 $20 $30 $40 $50 $60 $70 $80 $90 2009 2010 2011 2012 2013 1Q14 Favorable Prior Year Development (in millions)

© 2014 OneBeacon Insurance Group 26 Active Capital Management Ordinary quarterly dividend $0.21 per share since IPO 5.45% trailing annual yield (as of 6/09/14) Special dividends $95 million ($1.00 per share) in 2011 $236 million ($2.50 per share) in 2010 $195 million ($2.03 per share) in 2008 Share repurchases $10 million in 2010 $69 million in 2008 $33 million in 2007 $88 million remaining repurchase authorization More than $1.2 billion returned to shareholders since IPO Annual ordinary dividend yield over 5% Cumulative Capital Returns $0 $200 $400 $600 $800 $1,000 $1,200 $1,400 Ordinary Dividends Special Dividends Share Repurchases

The OneBeacon Approach Focus on specialty business Responsible and accountable leaders Specialized talent Aligned support Market flexibility Distribution prerogative Focus on achieving success Great people Incentives aligned to profit Business execution Resist bureaucracy/be nimble Collaborative communication Robust analytics Careful management of risk © 2014 OneBeacon Insurance Group 27
© 2014 OneBeacon Insurance Group 28 Looking Forward Grow book value per share Strong capital position Well reserved Highly talented management team with specialty backgrounds and focus Deep underwriting culture Active capital management philosophy Continually seeking new segments and teams Runoff sale proceeding; expected to close in second half of 2014

Investor Meeting June 10, 2014

© 2014 OneBeacon Insurance Group 30 Appendix Non-GAAP Financial Measures: Operating income is a non-GAAP financial measure that excludes net realized and unrealized investment gains, (income) loss from discontinued operations, (gain) loss from sale of discontinued operations, and the related tax effects, from net income (loss) attributable to OneBeacon's common shareholders. OneBeacon believes that this non-GAAP financial measure provides a useful alternative picture of the underlying operating activities of the company to the GAAP measure of net income (loss) attributable to OneBeacon's common shareholders, as it removes variability in the timing of realized and unrealized investment gains which may be heavily influenced by investment market conditions and also removes the impact related to discontinued operations. Although key to the company's overall financial performance, OneBeacon believes that net realized and change in unrealized investment gains are largely independent of the underwriting decision-making process. Management also believes that the impact of operations that have been discontinued are not relevant to evaluating financial performance on a comparative basis. The reconciliation of net income (loss) attributable to OneBeacon's common shareholders to operating income is included below. Operating income per share is calculated by dividing operating income (a non-GAAP financial measure described above) by the weighted average number of common shares outstanding. Pre-tax operating income before interest expense on debt is a non-GAAP financial measure that represents pre-tax income from continuing operations less net realized and change in unrealized investment gains as well as interest expense on debt from pre-tax income from continuing operations. Management believes that pre- tax operating income before interest expense on debt provides a useful alternative picture of the underlying operating activities of the Company to the GAAP measure of pre-tax income from continuing operations, as it removes variability in the timing of investment gains which may be heavily influenced by investment market conditions. Interest coverage is calculated by dividing pre-tax operating income before interest expense on debt by interest expense on debt. Management believes that interest coverage is a useful supplement to understanding the Company's capital position. The calculation of interest coverage is included below. Dec 31, 2013 Dec 31, 2012 Dec 31, 2011 Pr -t x income 181.3 105.9 119.7 Less: Net realized and change in unrealized investment gains (49.4) (55.7) (10.6) [a] Interest expense on debt 13.0 16.9 20.5 [b] Pre-tax operating income before interest expense on debt 144.9 67.1 129.6 Interest coverage [b/a] 11.1x 4.0x 6.3x Year Ended Quarter Ended Mar 31, 2014 Dec 31, 2013 Dec 31, 2012 Dec 31, 2011 N t inc (l s) attributable to OneBeacon common shareholders 47.0 146.0 (19.2) 55.1 L s : N t r lized and change in unrealized investment (gains) losses (18.9) (49.4) (55.7) (10.6) Tax ffect on t realized and changed in unrealized investment gains (losses) 6.6 17.3 19.5 3.7 (Income) loss from discontinued operations, net of tax 0.5 46.6 24.3 29.6 (Gain) loss from sale of discontinued operations - (46.6) 91.0 19.2 Operating income 35.2 113.9 59.9 97.0 Weighted average number of common shares outstanding 94.6 94.5 94.5 94.4 Operating income per share 0.37 1.21 0.63 1.03 Year Ended

© 2014 OneBeacon Insurance Group 31 Appendix (continued) Non-GAAP Financial Measures: Acquisition expense ratio excluding Hagerty is a non-GAAP financial measure that excludes policy acquisition expenses and earned premiums attributable to the Collector Car and Boats business from the calculation of the acquisition expense ratio. OneBeacon believes that this non-GAAP financial measure provides a useful alternative view of the ongoing operating activities of the company, as it removes the impact of the Collector Car and Boats business, which was exited in 2013 and which carried a high acquisition expense ratio. The reconciliation of acquisition expense ratio to acquisition expense ratio excluding Hagerty is included below. Definitions: Combined Ratio (C/R): Calculated by adding the ratio of incurred loss and LAE to earned premiums (the loss and LAE ratio) and the ratio of policy acquisition and other underwriting expenses to earned premiums (the expense ratio). Net Written Premium (NWP): Calculated by subtracting ceded written premium from gross written premium. Quarter Ended Mar 31, 2014 Dec 31, 2013 Dec 31, 2012 Dec 31, 2011 Dec 31, 2010 Dec 31, 2009 [a] Earned premiums 276.5 1,120.4 1,132.0 1,012.2 979.2 917.9 Less: Earned premiums related to Collector Car and Boats business - (89.1) (172.4) (159.3) (148.8) (137.0) [b] Earned premiums excluding Hagerty 276.5 1,031.3 959.6 852.9 830.4 780.9 [c] P li y cquisition expenses 46.7 208.9 249.4 221.2 212.7 204.1 L ss: Policy acquisition expenses related to Collector Car and Boats business - (31.0) (83.9) (71.4) (66.3) (61.9) [d] Policy acquisition expenses excluding Hagerty 46.7 177.9 165.5 149.8 146.4 142.2 [e] Acquisition expense ratio [c/a] 16.9% 18.6% 22.0% 21.8% 21.7% 22.2% [f] Acquisition expense ratio ex Hagerty [d/b] 16.9 17.3 17.2 17.6 17.6 18.2 Acquisition expense ratio Hagerty [e - f] - 1.3% 4.8% 4.2% 4.1% 4.0% Year Ended
