Attached files
| file | filename |
|---|---|
| 8-K - 8-K - CBRE GROUP, INC. | a14-14674_18k.htm |
Exhibit 99.1
|
|
June 2014 CBRE GROUP, INC. Global Market Leader in Integrated Commercial Real Estate Services |

|
|
This presentation contains statements that are forward looking within the meaning of the Private Securities Litigation Reform Act of 1995, including statements regarding our future growth momentum, operations, financial performance, business outlook and ability to successfully integrate businesses we have acquired with our existing operations. These statements should be considered as estimates only and actual results may ultimately differ from these estimates. Except to the extent required by applicable securities laws, we undertake no obligation to update or publicly revise any of the forward-looking statements that you may hear today. Please refer to our most recent quarter earnings report, filed on Form 8-K, our current annual report on Form 10-K and our current quarterly report on Form 10-Q, in particular any discussion of risk factors or forward-looking statements, which are filed with the SEC and available at the SEC’s website (www.sec.gov), for a full discussion of the risks and other factors that may impact any estimates that you may hear today. We may make certain statements during the course of this presentation, which include references to “non-GAAP financial measures,” as defined by SEC regulations. As required by these regulations, we have provided reconciliations of these measures to what we believe are the most directly comparable GAAP measures, which are attached hereto within the appendix. FORWARD-LOOKING STATEMENTS |
|
|
THE GLOBAL MARKET LEADER CBRE is the premier global provider of integrated services to commercial real estate investors and occupiers. As of December 31, 2013; includes affiliates. As of March 31, 2014. GLOBAL LEADERSHIP WITH BROAD CAPABILITIES #1 Leasing #1 Property Sales #1 Outsourcing #1 Appraisal & Valuation #1 Commercial Real Estate Investment Manager SCALE AND DIVERSITY 440+ offices in over 60 countries1 Serves approximately 85% of the Fortune 100 $223.2 billion of transaction activity in 2013 3.5 billion property and corporate facilities square feet under management1 $90.2 billion of real estate investment assets under management2 |
|
|
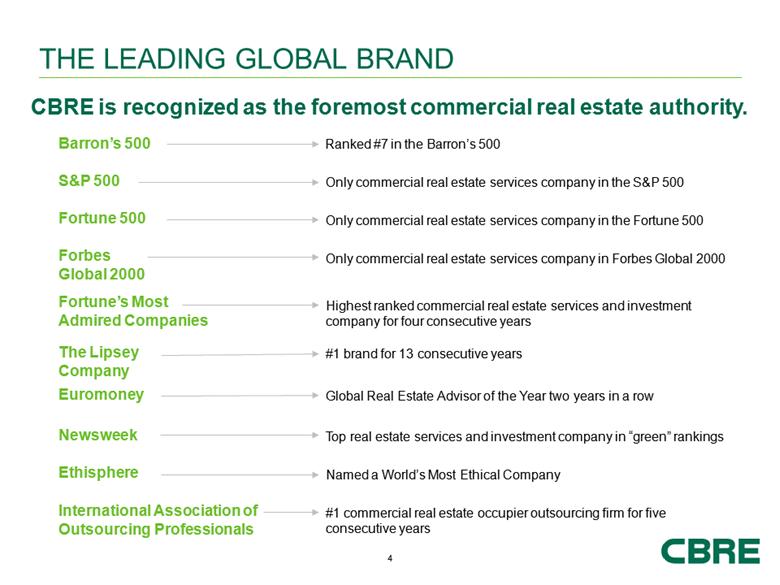
THE LEADING GLOBAL BRAND CBRE is recognized as the foremost commercial real estate authority. Only commercial real estate services company in the Fortune 500 #1 brand for 13 consecutive years Top real estate services and investment company in “green” rankings Global Real Estate Advisor of the Year two years in a row Highest ranked commercial real estate services and investment company for four consecutive years #1 commercial real estate occupier outsourcing firm for five consecutive years Named a World’s Most Ethical Company Only commercial real estate services company in the S&P 500 S&P 500 Fortune 500 Fortune’s Most Admired Companies The Lipsey Company International Association of Outsourcing Professionals Euromoney Newsweek Ethisphere Ranked #7 in the Barron’s 500 Barron’s 500 Forbes Global 2000 Only commercial real estate services company in Forbes Global 2000 |
|
|
CBRE SERVES INVESTORS AND OCCUPIERS CBRE’s integrated, best-in-class offering creates value for clients at every stage of the life cycle. |
|
|
Exploit unique leadership position with globally integrated solutions and specialized expertise to widen our competitive advantage and differentiation from other firms Drive continued market share gains in core brokerage business Continue expansion of Global Corporate Services (Occupier Outsourcing) business Expand self-perform model in Europe (Norland acquisition) Capitalize on increased global mandates Further penetrate vertical markets such as healthcare Seize growth opportunities afforded by CBRE Global Investors Investment performance across risk/return spectrum and geographies Leverage synergies with real estate services business Continue to develop operating platform (IT, Research, Marketing) to improve support for our professionals, enhance capabilities for clients and sustain long-term growth Continue accretive acquisitions of strong companies in our space KEY STRATEGIC PRIORITIES |
|
|
In 2013, CBRE completed eleven acquisitions Acquired UK-based Norland Managed Services for a cash purchase price of approximately $434 million1,2 with approximately $629 million revenue3 Ten in-fill acquisitions across the globe with an aggregate purchase price of $110 million1 and annual revenues of approximately $105 million Evaluation of acquisition candidates based on: Strategic rationale/value proposition for clients Financial metrics Cultural fit Ability to integrate Transactions generally fall into two categories: Strategic in-fill acquisitions sourced principally by lines of business Larger, transformational transactions driven by macro strategy (e.g., Norland) CBRE intends to remain active in pursuing acquisitions for the foreseeable future Continued opportunities to acquire strong businesses that meet our financial criteria MERGERS & ACQUISITIONS STRATEGY Excludes deal costs, deferred consideration and / or earnouts. Acquisition also includes 362,916 shares of common stock issued to Norland senior management, the value of which is not included in this figure. For fiscal year ended April 5, 2013. |
|
|
DIVERSIFICATION From 2006 to 2013, contractual revenue increased 3.8x. REVENUE MIX BY BUSINESS Total Revenue: $4,0321 Total Revenue: $7,8855 See slide 26 for footnotes. Contractual Revenues include GCS and Asset Services (excludes associated sales and lease revenues, most of which is contractual), Global Investment Management, Appraisal & Valuation. 3.8x |
|
|
Revenue1 ($ in millions) Contractual Revenue Sources Capital Markets Global Corporate Services and Asset Services2 Investment Management Appraisal & Valuation Leasing Sales Commercial Mortgage Services Development Services Other Total Q1 2014 869 113 96 411 267 74 10 20 1,861 % of Q1 2014 Total 47% 6% 5% 22% 14% 4% 1% 1% 100% Growth Rate (Change Q1 2014-over-Q1 20133) USD 49% -12% 7% 10% 27% 13% -20% 48% 26% Local Currency 50% -13% 9% 11% 29% 13% -20% 50% 27% Q1 2014 BUSINESS LINE REVENUE Numbers may not total due to rounding. Global Corporate Services (GCS) and Asset Services revenue excludes associated sales and leasing revenue, most of which is contractual. Q1 2013 includes revenues from discontinued operations of $4.0 million. 80% of total revenue Contractual revenue plus leasing, which is largely recurring, is 80% of total revenue. |
|
|
LONG-TERM GROWTH 3 4,5 4,5 4,5 See slide 26 for footnotes. ($ in millions) 4,5,6 4,5 4,5 2 From 2003 to 2013 total revenue has increased 4.0x and Normalized EBITDA1 has increased 5.6x. 4,5 Revenue CAGR 15% Normalized EBITDA CAGR 19% |

|
|
Q1 2014 Region Highlights BUSINESS OVERVIEW % of Americas1 49% 27% 23% Contractual Leasing Capital Markets Excludes 1% of Other revenue. Americas EMEA Asia Pacific Revenue ▲10% Property Sales ▲17% Occupier Outsourcing (Global Corporate Services) ▲13% Leasing ▲10% Revenue▲127% (▲122% in local currency) Double digit organic growth in every major business line Without Norland, revenue ▲32% (27% in local currency) Property Sales ▲61% Revenue ▲8% (▲18% in local currency) Property Sales ▲26% (▲38% in local currency) Strong growth in Leasing and Outsourcing in local currency |

|
|
Global Corporate Services (GCS) revenue excludes associated sales and leasing revenue, most of which is contractual. As of December 31, 2013; includes affiliates. Per International Association of Outsourcing Professionals (IAOP). New 25 Expansions 24 Renewals 14 HISTORICAL FEE REVENUE1 FULL SERVICE OFFERING Q1 2014 TOTAL CONTRACTS ($ in millions) Facilities Management – 1.0 billion sq. ft. globally2 Project Management Transaction and Portfolio Services Strategic Consulting #1 Real Estate Outsourcing brand3 for five consecutive years GLOBAL CORPORATE SERVICES Integrated Global Solutions for Occupiers Q1 |
|
|
HISTORICAL FEE REVENUE1 OVERVIEW KEY STRATEGIC ACCOUNTS ($ in millions) Asset services revenue excludes associated sales and leasing revenue, most of which is contractual. As of December 31, 2013; includes affiliates. Asset Services operates buildings for investors Highly synergistic with property leasing Manage approximately 2.5 billion sq. ft. globally2 300+ trophy assets in major CBDs (approximately 450 million sq. ft.) ASSET SERVICES Maximizing Building Operating Performance for Investors Q1 |
|
|
CAPITAL RAISED1 Performance-driven global real estate investment manager More than 600 institutional clients Equity to deploy: $5.3 billion1,2 Co-Investment: $159.8 million3 4 ASSETS UNDER MANAGEMENT (AUM) OVERVIEW ($ in billions) As of 3/31/2014 Q1 See slide 26 for footnotes. April 2014 ($ in billions) INVESTMENT MANAGEMENT Performance Across Risk/Return Options Globally |
|
|
PREMIER CLIENTS ($ in millions) 132,000+ assignments in 2013 Up 14% from 2012 Euromoney Global Valuation Advisor of the Year Clients include lenders, life insurance companies, special servicers and REITs OVERVIEW APPRAISAL & VALUATION Serving Clients Globally Q1 HISTORICAL FEE REVENUE |
|
|
As of January 1, 2014; excludes affiliates. OVERVIEW RECENT TRANSACTIONS Boston Properties Hines Lenovo American Express San Francisco, CA Raleigh, NC Sussex, UK 714,000 SF 445,000 SF 100,000 SF Serve occupiers and investors in formulating and executing leasing strategies Tailored service delivery by property type and industry/market specialization Strategic insight and high-level execution driving significant market share gains Approximately 4,3501 leasing professionals worldwide #1 global market position – $83.2 billion lease transactions in 2013 Office: $56.2 billion Industrial: $10.5 billion Retail: $15.1 billion Other: $ 1.4 billion LEASING Strategic Advisory and Execution Q1 ($ in millions) HISTORICAL FEE REVENUE |
|
|
Denmark/Finland/Sweden San Francisco, CA Krakow, Poland AB Volvo Hines Invesco $321 Million $298 Million $248 Million Property Sale Property Sale Property Acquisition As of January 1, 2014; excludes affiliates. RECENT TRANSACTIONS Represent investors (sellers and buyers) in commercial real estate #1 global market share, per Real Capital Analytics 650 basis point advantage over #2 firm in 2013 180 basis point increase from 2012 Approximately 1,6501 investment sales specialists worldwide #1 global market position – $140.1 billion sales transactions in 2013 Office: $59.9 billion Industrial: $19.0 billion Retail: $21.6 billion Multi-family: $26.3 billion Other: $13.3 billion OVERVIEW HISTORICAL FEE REVENUE PROPERTY SALES Insight and Execution Across Markets & Property Types Q1 ($ in millions) |
|
|
New York, NY Georgia/Nevada/ Texas Frankfurt, Germany CWCapital Asset Management KTR Capital IVG Institutional Funds $2.5 Billion $142 Million $350 Million Loan Sale Advisory Loan Sale Equity Financing As of January 1, 2014; excludes affiliates. Activity includes loan originations and loan sales. RECENT TRANSACTIONS Leading strategic advisor for debt and structured finance solutions Highly synergistic with property sales Key services: Loan origination / debt placement Portfolio loan sales Loan servicing via JV with GE Capital Approximately 1251 mortgage brokerage specialists $26.9 billion of global mortgage activity in 20132 #1 in commercial loan origination with government agencies OVERVIEW HISTORICAL FEE REVENUE COMMERCIAL MORTGAGE SERVICES Premier Debt and Structured Finance Solutions Q1 ($ in millions) |

|
|
Houston, TX Office Phoenix, AZ Industrial Denver, CO Mixed-Use Washington, DC Retail 2.0M SF 800,000 SF 537,000 SF 387,000 SF 2 Coldwater Logistics Center Shops at Dakota Crossing PROJECTS IN PROCESS/PIPELINE1 OVERVIEW RECENT PROJECTS Merchant builder business model Premier brand in U.S. development 65+ year record of excellence Partner with leading institutional capital sources $87.6 million of co-investment at the end of Q1 2014 $7.7 million of recourse debt to CBRE and repayment guarantees at the end of Q1 2014 Hess Tower Denver Union Station DEVELOPMENT SERVICES Pre-eminent Merchant Builder Brand in U.S. ($ in billions) As of December 31 for each year presented. In Process figures include Long-Term Operating Assets (LTOA) of $0.7 billion for Q1 14, $0.9 billion for Q4 13, $1.2 billion for Q4 12 and $1.5 billion for Q4 11. LTOA are projects that have achieved a stabilized level of occupancy or have been held 18-24 months following shell completion or acquisition. |
|
|
Property Sales should continue strong, double-digit growth Pace expected to moderate from Q1’s robust level More difficult comparisons as the year progresses Leasing is expected to continue to grow well despite slow, uneven recovery GCS (Occupier Outsourcing) is expected to sustain double-digit growth Norland provides enhanced growth prospects and long-term contractual revenue Investment Management and Development, combined, still expected to perform roughly in line with 2013, excluding carried interest Declining GSE volume likely to remain a challenge in Commercial Mortgage Services, while activity increases with other capital sources See more upside than downside to full-year guidance of $1.55 to $1.60 Adjusted EPS Q1 is a relatively small portion of the year’s earnings and not an adequate barometer of full-year performance Year-over-year earnings comparisons will be more challenging in the quarters ahead 2014 Expectations BUSINESS OUTLOOK |
|
|
Premier global provider of integrated services to real estate investors and occupiers Global leadership and scale The leading global brand with a balanced and diversified business mix Known for delivering high-quality solutions that create value for clients CBRE has significantly evolved its business profile Revenue from contractual sources has increased 3.8x from 2006 to 20131 Contractual revenues and Leasing, which is largely recurring, represented 80% of total revenue in Q1 2014 Acquisitions have strengthened CBRE’s service offering and contractual revenue Track record of long-term growth Revenue has increased 4.0x from 2003 to 2013 Normalized EBITDA has increased 5.6x from 2003 to 2013 CBRE intends to remain active in pursuing acquisitions for the foreseeable future Continued opportunities to acquire strong businesses that meet our financial criteria Highly focused on extending competitive advantage with globally integrated solutions and a unique product line and geographic footprint that others find difficult to match KEY TAKEAWAYS See slide 26 for footnotes. |
|
|
APPENDIX |
|
|
As of March 31, 2014 MANDATORY AMORTIZATION AND MATURITY SCHEDULE ($ in millions) $1,200.0 million revolver facility matures in March 2018. As of March 31, 2014, the outstanding revolver balance was $359.5 million. 1 Global Cash Available Revolver 1,232 30 40 68 255 440 2 352 198 800 0 250 500 750 1,000 1,250 1,500 Q1 2014 2014 2015 2016 2017 2018 2019 2020 2021 2022 2023 Current Liquidity Term Loan A Term Loan B Revolver Sr. Unsecured Notes - 6.625% Sr. Unsecured Notes - 5.00% |
|
|
CAPITALIZATION Excludes $27.2 million of cash in consolidated funds and other entities not available for Company use at March 31, 2014. Represents notes payable on real estate in Development Services that are recourse to the Company. Excludes non-recourse notes payable on real estate of $127.9 million at March 31, 2014. Excludes $306.6 million of aggregate warehouse facilities outstanding at March 31, 2014. Calculation includes EBITDA from discontinued operations. See slide 26 for details. Cash1 $ 401.0 Revolving credit facility 359.5 Senior secured term loan A (new) 462.5 Senior secured term loan B (new) 212.9 Senior unsecured notes 5.0% 800.0 Senior unsecured notes 6.625% 350.0 Notes payable on real estate2 4.0 Other debt3 5.5 Total debt $ 2,194.4 Stockholders’ equity 1,989.6 Total capitalization 4,184.0 Total net debt $ 1,793.4 Net debt to TTM Normalized EBITDA4 1.69x As of March 31, 2014 ($ in millions) |
|
|
Twelve Months Ended December 31, ($ in millions) Q1 2014 TTM 2013 2012 2011 2010 2009 Normalized EBITDA1 $ 1,059.8 $ 1,022.3 $ 918.4 $ 802.6 $ 681.3 $ 453.9 Adjustments: Carried interest incentive compensation2 10.8 9.2 - - - - Integration and other costs related to acquisitions 11.1 12.6 39.2 68.8 7.2 5.7 Cost containment expenses 17.6 17.6 17.6 31.1 15.3 43.6 Write-down of impaired assets - - - 9.4 11.3 32.5 EBITDA1 1,020.3 982.9 861.6 693.3 647.5 372.1 Add: Interest Income3 5.9 6.3 7.6 9.4 8.4 6.1 Less: Depreciation and amortization3 209.9 191.3 170.9 116.9 109.0 99.5 Non-amortizable intangible asset impairment 98.1 98.1 19.8 - - - Interest expense3 122.2 138.4 176.6 153.5 192.7 189.1 Write-off of financing costs 42.7 56.3 - - 18.1 29.3 Provision for income taxes3 206.6 188.6 186.3 193.1 135.8 27.0 Net Income attributable to CBRE Group, Inc. 3 $ 346.7 $ 316.5 $ 315.6 $ 239.2 $ 200.3 $ 33.3 Revenue1 $ 7,579.9 $ 7,194.2 $ 6,519.8 $ 5,912.1 $ 5,119.2 $ 4,165.8 Normalized EBITDA Margin 14.0% 14.2% 14.1% 13.6% 13.3% 10.9% RECONCILIATION OF NORMALIZED EBITDA TO EBITDA TO NET INCOME Includes discontinued operations. See slide 26 for details. Carried interest incentive compensation is related to funds that began recording carried interest expense in Q2 2013 and beyond. Includes immaterial amount of discontinued operations. |
|
|
FOOTNOTES Slide 10 Normalized EBITDA excludes merger-related and other non-recurring charges, gains/losses trading securities acquired in the Trammell Crow Company acquisition, cost containment expenses, one-time IPO-related compensation expense, integration and other costs related to acquisitions, certain carried interest expense to better match with carried interest revenue realization and the write-down of impaired assets. Includes Insignia activity for the period July 23, 2003 through December 31, 2003. Includes Trammell Crow Company activity for the period December 20, 2006 through December 31, 2006. See discontinued operations below. See discontinued operations below. Includes CRES, ING REIM Asia and ING REIM Europe beginning July 1, October 3 and October 31, 2011, respectively. Slide 8 Includes Trammell Crow Company for the period December 20, 2006 through December 31, 2006. Other includes Development Services (1% in both 2006 and proforma 2013) and Other (1% in both 2006 and proforma 2013). Capital Markets includes Sales (31% in 2006 and 16% in proforma 2013) and Commercial Mortgage Services (3% in 2006 and 4% in proforma 2013). Contractual Revenues include GCS and Asset Services (14% in 2006 and 40% in proforma 2013; excludes associated sales and lease revenues, most of which are contractual), Global Investment Management (6% in 2006 and 7% in proforma 2013), and Appraisal & Valuation (7% in 2006 and 5% in proforma 2013). Includes $9.4 million of discontinued operations for the twelve months ended December 31, 2013 and $690 million of proforma revenue from Norland which was acquired December 23, 2013. Slide 14 Excludes global securities business. As of April 30, 2014. As of March 31, 2014. Includes CRES, ING REIM Asia and ING REIM Europe beginning July 1, October 3 and October 31, 2011, respectively. Discontinued Operations (Slides 10, 24 and 25) Under GAAP, the Company has historically classified most of its gains on dispositions of real estate as income from discontinued operations rather than as revenue and earnings from continuing operations. The Company’s Development Services segment, and occasionally its Global Investment Management segment, are engaged in developing and selling real estate projects in the normal course of business. Management believes that the characterization of these gains as income from discontinued operations may create the inaccurate impression that the Company is exiting this business. Effective January 1, 2014, CBRE adopted new GAAP accounting standards that no longer require us to report dispositions of real estate as income from discontinued operations. Revenue from discontinued operations which totaled: $1.3 million for the year ended December 31, 2008, $3.9 million for the year ended December 31, 2010, $6.7 million for the year ended December 31, 2011, $5.7 million for the year ended December 31, 2012, $9.4 million for the year ended December 31, 2013 and $5.4 million for the twelve months ended March 31, 2014. EBITDA related to discontinued operations which totaled: $16.9 million for the year ended December 31, 2008, $16.4 million for the year ended December 31, 2010, $14.1 million for the year ended December 31, 2011, $5.6 million for the year ended December 31, 2012, $7.9 million for the year ended December 31, 2013 and $3.5 million for the twelve months ended March 31, 2014. Slide 21 Includes $9.4 million of discontinued operations for the twelve months ended December 31, 2013 and $690 million of proforma revenue from Norland which was acquired December 23, 2013. |
