Attached files
| file | filename |
|---|---|
| EX-99.3 - EX-99.3 - ALLERGAN INC | d740697dex993.htm |
| EX-99.4 - EX-99.4 - ALLERGAN INC | d740697dex994.htm |
| EX-99.1 - EX-99.1 - ALLERGAN INC | d740697dex991.htm |
| 8-K - FORM 8-K - ALLERGAN INC | d740697d8k.htm |
Exhibit 99.2
|
|

June 10, 2014
Allergan
A Specialist in the Biopharmaceutical & Medical Device Industries
|
|
Forward-Looking Statements
This presentation contains “forward-looking statements,” including statements regarding product acquisition and development, regulatory approvals, market potential, expected growth, efficiencies, and Allergan’s expected, estimated or anticipated future results, including Allergan’s earnings per share and revenue forecasts, among other statements. All forward-looking statements herein are based on Allergan’s current expectations of future events and represent Allergan’s judgment only as of the date of this presentation. If underlying assumptions prove inaccurate or unknown risks or uncertainties materialize, actual results could vary materially from Allergan’s expectations and projections. Therefore, you are cautioned not to rely on any of these forward-looking statements and Allergan expressly disclaims any intent or obligation to update these forward-looking statements except as required to do so by law.
Actual results may differ materially from Allergan’s current expectations based on a number of factors affecting Allergan’s businesses, including changing competitive, market and regulatory conditions; the timing and uncertainty of the results of both the research and development and regulatory processes; domestic and foreign health care and cost containment reforms, including government pricing, tax and reimbursement policies; revisions to regulatory policies related to the approval of competitive generic products; technological advances and patents obtained by competitors; the ability to obtain and maintain adequate protection of intellectual property rights; the performance of new products, including obtaining government approval and consumer and physician acceptance, the continuing acceptance of currently marketed products, and consistency of treatment results among patients; the effectiveness of promotional and advertising campaigns; the potential for negative publicity concerning any of Allergan’s products; the timely and successful implementation of strategic initiatives, including expansion of new or existing products into new markets; the results of any pending or future litigation, investigations or claims; the uncertainty associated with the identification of, and successful consummation, execution and integration of, external corporate development initiatives and strategic partnering transactions; potential difficulties in manufacturing; and Allergan’s ability to obtain and successfully maintain a sufficient supply of products to meet market demand in a timely manner. In addition, matters generally affecting the U.S. and international economies, including consumer confidence and debt levels, changes in interest and currency exchange rates, political uncertainty, international relations, the status of financial markets and institutions, impact of natural disasters or geo-political events and the state of the economy worldwide, may materially affect Allergan’s results.
These and other risks and uncertainties affecting Allergan’s businesses and operations may be found in Allergan’s most recently filed Annual Report on Form 10-K and any subsequent Quarterly Reports on Form 10-Q, including under the heading “Risk Factors”. These filings, as well as Allergan’s other public filings with the U.S. Securities and Exchange Commission (SEC), can be obtained without charge at the SEC’s web site at www.sec.gov. These SEC filings are also available at Allergan’s web site at www.allergan.com along with copies of Allergan’s press releases and additional information about Allergan. For further information, you can contact the Allergan Investor Relations Department by calling 714-246-4636.
© 2014 Allergan, Inc. All rights reserved. ® & ™ Marks owned by Allergan, Inc.
JUVÉDERM® is a registered trademark of Allergan Industrie SAS
All other products are registered trademarks of their respective companies
2
|
|
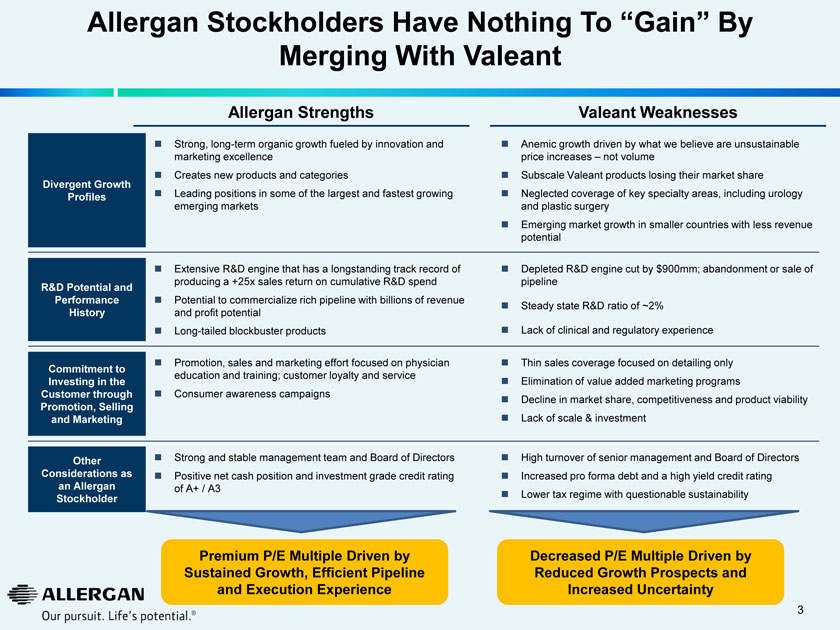
Allergan Stockholders Have Nothing To “Gain” By Merging With Valeant
Divergent Growth Profiles R&D Potential and Performance History
Commitment to Investing in the Customer through Promotion, Selling and Marketing Other Considerations as an Allergan Stockholder
Allergan Strengths Strong, long-term organic growth fueled by innovation and marketing excellence
Creates new products and categories Leading positions in some of the largest and fastest growing emerging markets
Extensive R&D engine that has a longstanding track record of producing a +25x sales return on cumulative R&D spend
Potential to commercialize rich pipeline with billions of revenue and profit potential Long-tailed blockbuster products
Promotion, sales and marketing effort focused on physician education and training; customer loyalty and service Consumer awareness campaigns Strong and stable management team and Board of Directors
Positive net cash position and investment grade credit rating of A+ / A3
Valeant Weaknesses Anemic growth driven by what we believe are unsustainable price increases – not volume
Subscale Valeant products losing their market share
Neglected coverage of key specialty areas, including urology and plastic surgery
Emerging market growth in smaller countries with less revenue potential
Depleted R&D engine cut by $900mm; abandonment or sale of pipeline
Steady state R&D ratio of ~2%
Lack of clinical and regulatory experience
Thin sales coverage focused on detailing only
Elimination of value added marketing programs
Decline in market share, competitiveness and product viability Lack of scale & investment
High turnover of senior management and Board of Directors
Increased pro forma debt and a high yield credit rating
Lower tax regime with questionable sustainability
Premium P/E Multiple Driven by Sustained Growth, Efficient Pipeline and Execution Experience
Decreased P/E Multiple Driven by Reduced Growth Prospects and Increased Uncertainty
3
|
|
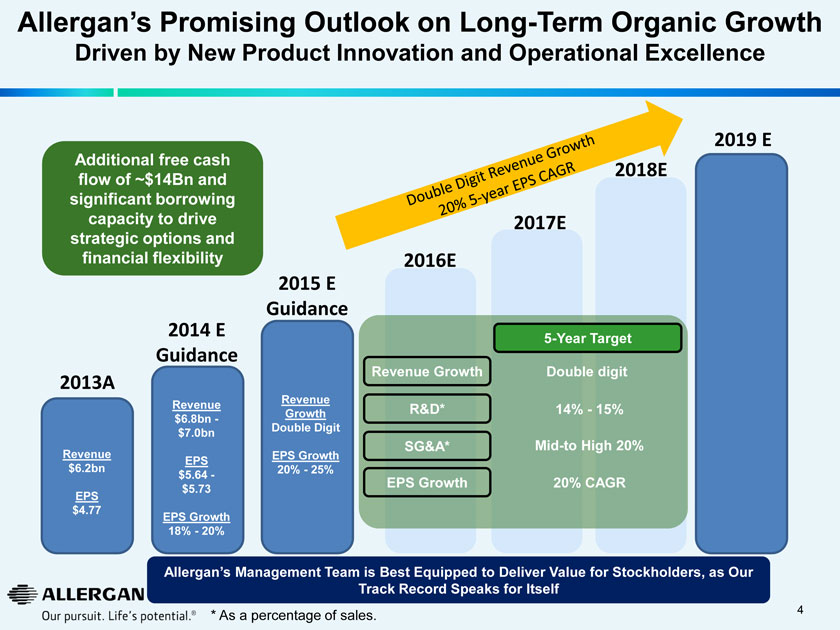
Allergan’s Promising Outlook on Long-Term Organic Growth
Driven by New Product Innovation and Operational Excellence
Additional free cash flow of ~$14Bn and significant borrowing capacity to drive strategic options and financial flexibility
2013A
Revenue
$6.2bn EPS $4.77
2014 E Guidance
Revenue $6.8bn - $7.0bn
EPS $5.64 - $5.73
EPS Growth
18% - 20%
2015 E Guidance
Revenue Growth Double Digit
EPS Growth 20% - 25%
2016E
Revenue Growth R&D* SG&A* EPS Growth
2017E
5-Year Target Double digit
Mid-to High 20% 20% CAGR
2018E 2019 E
Allergan’s Management Team is Best Equipped to Deliver Value for Stockholders, as Our Track Record Speaks for Itself
* As a percentage of sales. 4
|
|
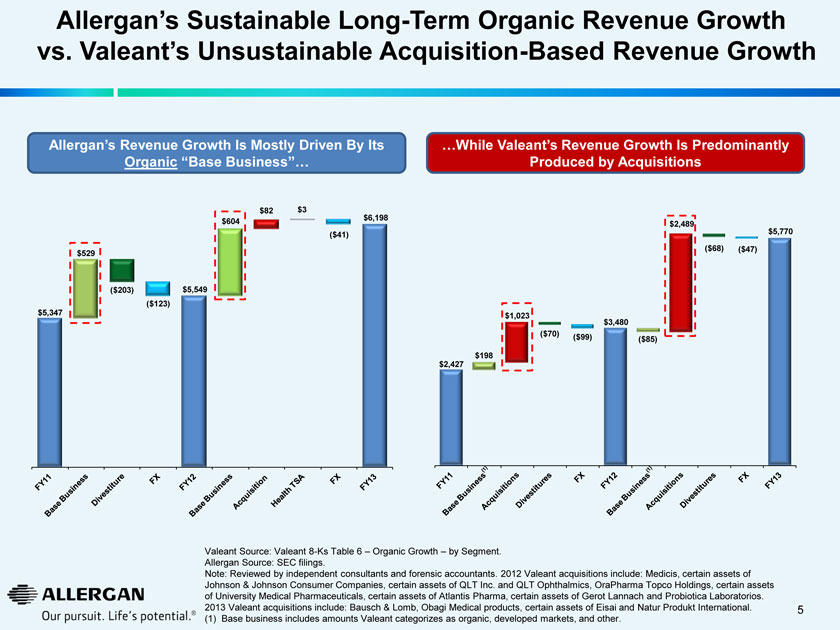
Allergan’s Sustainable Long-Term Organic Revenue Growth vs. Valeant’s Unsustainable Acquisition-Based Revenue Growth
Allergan’s Revenue Growth Is Mostly Driven By Its Organic “Base Business”…
…While Valeant’s Revenue Growth Is Predominantly Produced by Acquisitions
$5,347
$529
($203)
($123)
$5,549
$604
$82
$3
($41)
$6,198
$2,427
$198
$1,023
($70)
($99)
$3,480
($85)
$2,489
($68)
($47)
$5,770
Valeant Source: Valeant 8-Ks Table 6 – Organic Growth – by Segment. Allergan Source: SEC filings. Note: Reviewed by independent consultants and forensic accountants. 2012 Valeant acquisitions include: Medicis, certain assets of Johnson & Johnson Consumer Companies, certain assets of QLT Inc. and QLT Ophthalmics, OraPharma Topco Holdings, certain assets of University Medical Pharmaceuticals, certain assets of Atlantis Pharma, certain assets of Gerot Lannach and Probiotica Laboratorios. 2013 Valeant acquisitions include: Bausch & Lomb, Obagi Medical products, certain assets of Eisai and Natur Produkt International. (1) Base business includes amounts Valeant categorizes as organic, developed markets, and other. 5
|
|
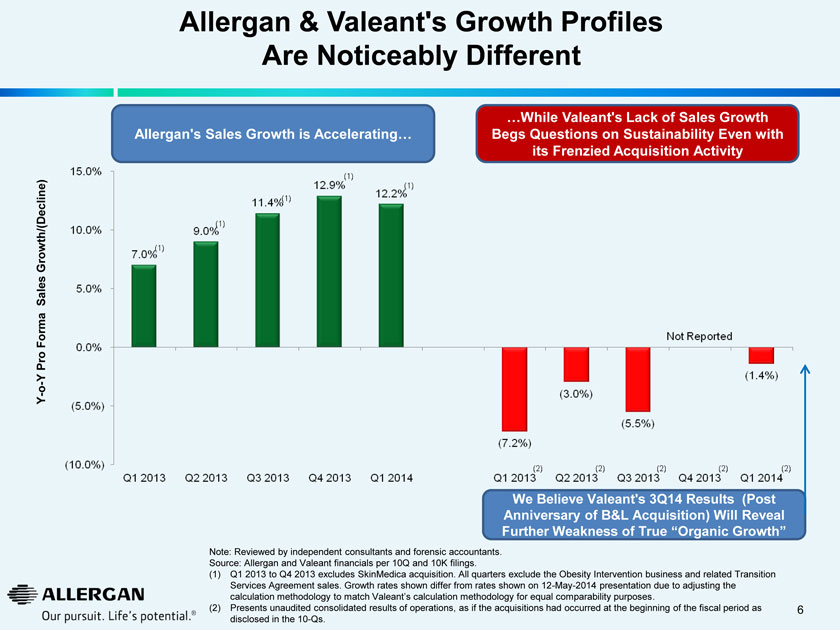
Allergan & Valeant’s Growth Profiles
Are Noticeably Different
Y-o-Y Pro Forma Sales Growth/(Decline)
Allergan’s Sales Growth is Accelerating…
…While Valeant’s Lack of Sales Growth Begs Questions on Sustainability Even with its Frenzied Acquisition Activity
We Believe Valeant’s 3Q14 Results (Post Anniversary of B&L Acquisition) Will Reveal Further Weakness of True “Organic Growth”
Note: Reviewed by independent consultants and forensic accountants. Source: Allergan and Valeant financials per 10Q and 10K filings.
(1)Q1 2013 to Q4 2013 excludes SkinMedica acquisition. All quarters exclude the Obesity Intervention business and related Transition Services Agreement sales. Growth rates shown differ from rates shown on 12-May-2014 presentation due to adjusting the calculation methodology to match Valeant’s calculation methodology for equal comparability purposes.
(2)Presents unaudited consolidated results of operations, as if the acquisitions had occurred at the beginning of the fiscal period as disclosed in the 10-Qs.
6
|
|
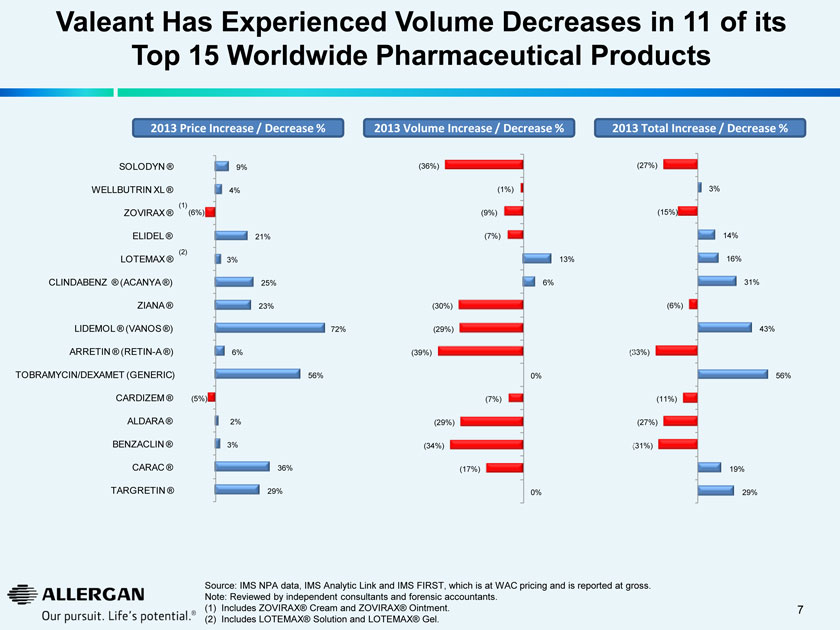
Valeant Has Experienced Volume Decreases in 11 of its
Top 15 Worldwide Pharmaceutical Products
2013 Price Increase / Decrease %
2013 Volume Increase / Decrease %
2013 Total Increase / Decrease %
SOLODYN ® 9% (36%) (27%)
WELLBUTRIN XL ® (4%) (1%) 3%
ZOVIRAX ® (1)(6%) (9%) (15%)
ELIDEL ® 21% (7%) 14%
LOTEMAX ® (2)3% 13% 16%
CLINDABENZ ® (ACANYA ®) 25% 6% 31%
ZIANA ® 23% (30%) (6%)
LIDEMOL ® (VANOS ®) 72% (29%) 43%
ARRETIN ® (RETIN-A ®) 6% (39%) (33%)
TOBRAMYCIN/DEXAMET (GENERIC) 56% 0% 56%
CARDIZEM ® (5%) (7%) (11%)
ALDARA ® 2% (29%) (27%)
BENZACLIN ® 3% (34%) (31%)
CARAC ® 36% (17%) (19%)
TARGRETIN ® 29% 0% 29%
Source: IMS NPA data, IMS Analytic Link and IMS FIRST, which is at WAC pricing and is reported at gross.
Note: Reviewed by independent consultants and forensic accountants.
(1) Includes ZOVIRAX® Cream and ZOVIRAX® Ointment.
(2) Includes LOTEMAX® Solution and LOTEMAX® Gel.
7
|
|
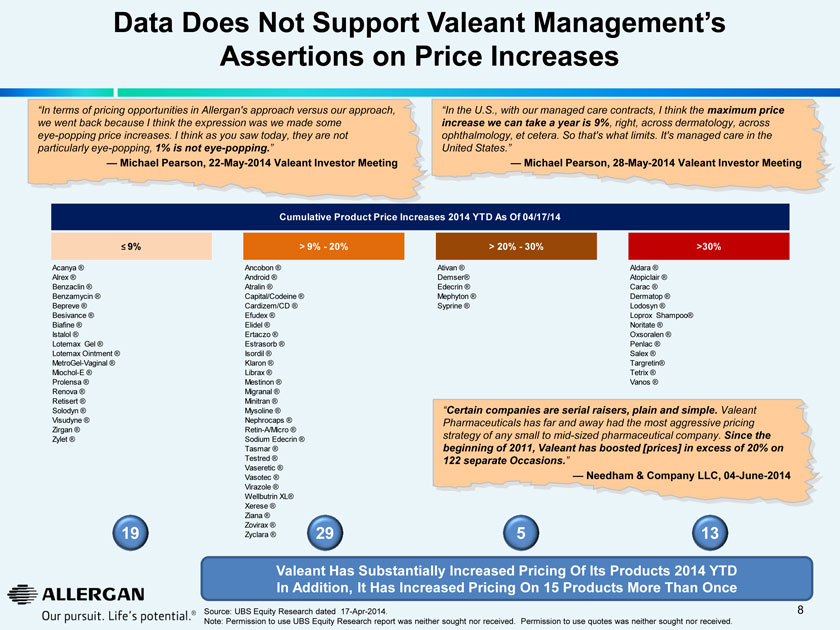
Data Does Not Support Valeant Management’s Assertions on Price Increases
“In terms of pricing opportunities in Allergan’s approach versus our approach, we went back because I think the expression was we made some
eye-popping price increases. I think as you saw today, they are not particularly eye-popping, 1% is not eye-popping.”
— Michael Pearson, 22-May-2014 Valeant Investor Meeting
“In the U.S., with our managed care contracts, I think the maximum price increase we can take a year is 9%, right, across dermatology, across ophthalmology, et cetera. So that’s what limits. It’s managed care in the United States.” — Michael Pearson, 28-May-2014 Valeant Investor Meeting
Cumulative Product Price Increases 2014 YTD As Of 04/17/14
= 9% > 9% - 20% > 20% - 30% >30%
Acanya ® Ancobon ® Ativan ® Aldara ® Alrex ® Android ® Demser® Atopiclair ® Benzaclin ® Atralin ® Edecrin ® Carac ® Benzamycin ® Capital/Codeine ® Mephyton ® Dermatop ® Bepreve ® Cardizem/CD ® Syprine ® Lodosyn ® Besivance ® Efudex ® Loprox Shampoo® Biafine ® Elidel ® Noritate ® Istalol ® Ertaczo ® Oxsoralen ® Lotemax Gel ® Estrasorb ® Penlac ® Lotemax Ointment ® Isordil ® Salex ® MetroGel-Vaginal ® Klaron ® Targretin® Miochol-E ® Librax ® Tetrix ® Prolensa ® Mestinon ® Vanos ® Renova ® Migranal ® Retisert ® Minitran ® Solodyn ® Mysoline ® Visudyne ® Nephrocaps ® Zirgan ® Retin-A/Micro ® Zylet ® Sodium Edecrin ® Tasmar ® Testred ® Vaseretic ® Vasotec ® Virazole ® Wellbutrin XL® Xerese ® Ziana ® Zovirax ® Zyclara ®
“Certain companies are serial raisers, plain and simple. Valeant Pharmaceuticals has far and away had the most aggressive pricing strategy of any small to mid-sized pharmaceutical company. Since the beginning of 2011, Valeant has boosted [prices] in excess of 20% on 122 separate Occasions.” — Needham & Company LLC, 04-June-2014
19 29 5 13
Valeant Has Substantially Increased Pricing Of Its Products 2014 YTD In Addition, It Has Increased Pricing On 15 Products More Than Once
Source: UBS Equity Research dated 17-Apr-2014. Note: Permission to use UBS Equity Research report was neither sought nor received. Permission to use quotes was neither sought nor received.
8
|
|
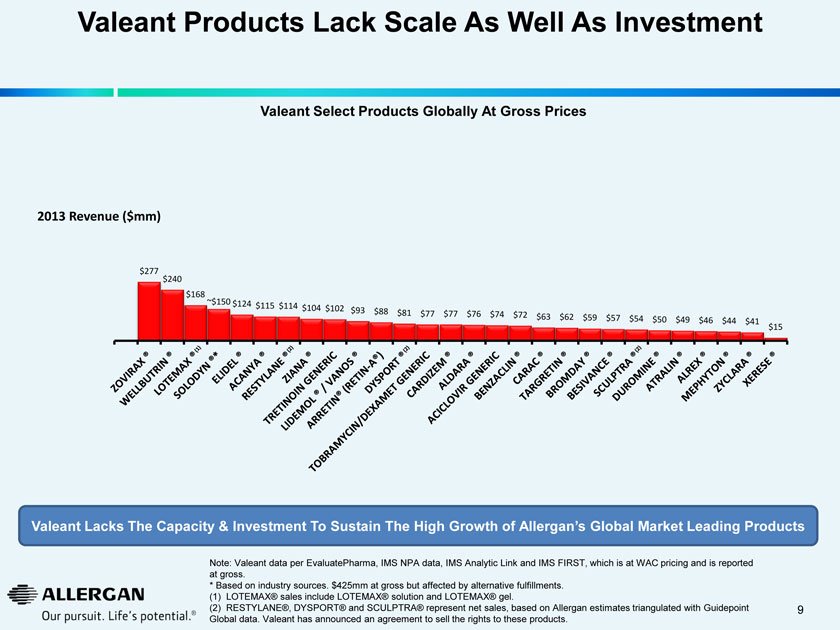
Valeant Products Lack Scale As Well As Investment
Valeant Select Products Globally At Gross Prices
2013 Revenue ($mm)
Valeant Lacks The Capacity & Investment To Sustain The High Growth of Allergan’s Global Market Leading Products
Note: Valeant data per EvaluatePharma, IMS NPA data, IMS Analytic Link and IMS FIRST, which is at WAC pricing and is reported at gross.
* Based on industry sources. $425mm at gross but affected by alternative fulfillments.
(1) LOTEMAX® sales include LOTEMAX® solution and LOTEMAX® gel.
(2) RESTYLANE®, DYSPORT® and SCULPTRA® represent net sales, based on Allergan estimates triangulated with Guidepoint Global data. Valeant has announced an agreement to sell the rights to these products.
9
|
|
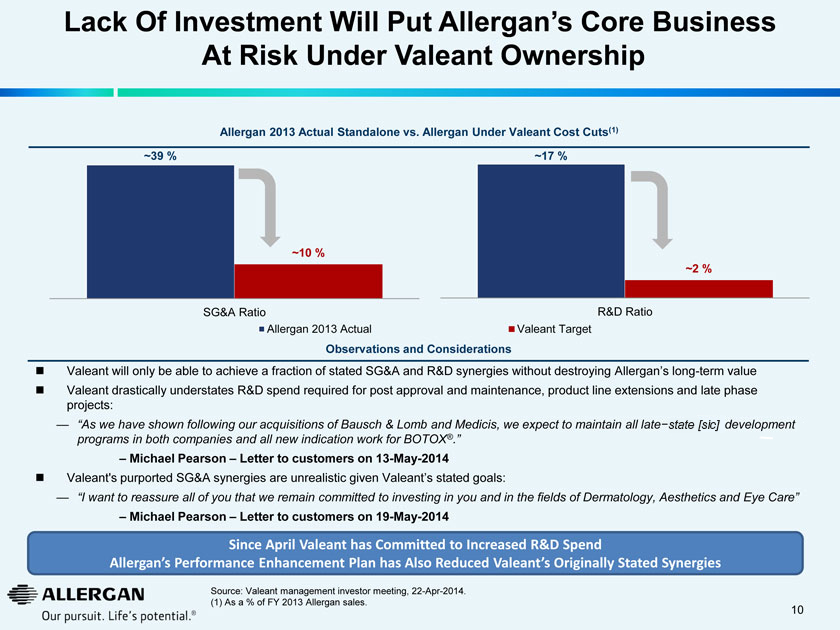
Lack Of Investment Will Put Allergan’s Core Business At Risk Under Valeant Ownership
Allergan 2013 Actual Standalone vs. Allergan Under Valeant Cost Cuts(1)
~39 % ~10 % SG&A Ratio Allergan 2013 Actual
~17 % ~2 % R&D Ratio Valeant Target
Observations and Considerations
Valeant will only be able to achieve a fraction of stated SG&A and R&D synergies without destroying Allergan’s long-term value
Valeant drastically understates R&D spend required for post approval and maintenance, product line extensions and late state projects:
–“As we have shown following our acquisitions of Bausch & Lomb and Medicis, we expect to maintain all late-state [sic] development programs in both companies and all new indication work for BOTOX®.”
Michael Pearson – Letter to customers on 13-May-2014
Valeant’s purported SG&A synergies are unrealistic given Valeant’s stated goals:
–“I want to reassure all of you that we remain committed to investing in you and in the fields of Dermatology, Aesthetics and Eye Care”
–Michael Pearson – Letter to customers on 19-May-2014
Since April Valeant has Committed to Increased R&D Spend
Allergan’s Performance Enhancement Plan has Also Reduced Valeant’s Originally Stated Synergies
Source: Valeant management investor meeting, 22-Apr-2014.
(1) As a % of FY 2013 Allergan sales.
10
|
|
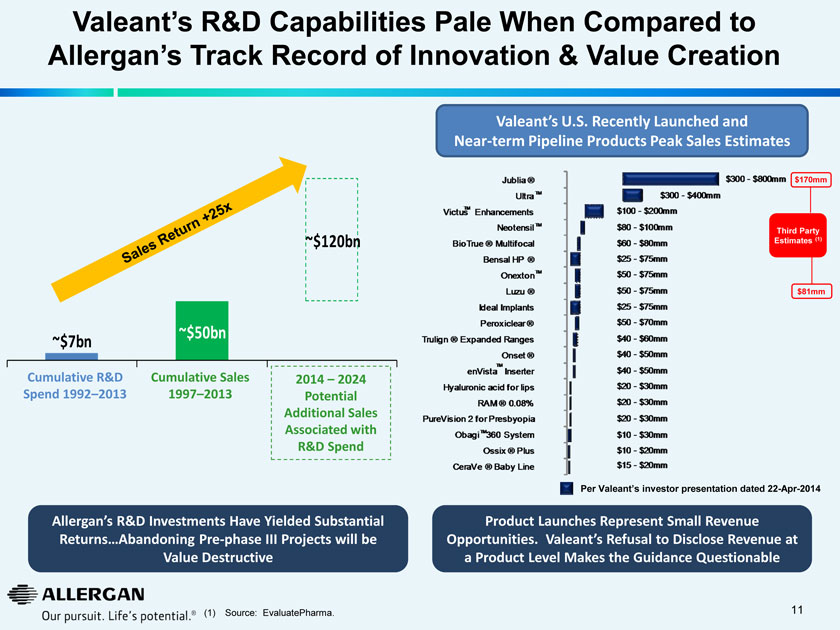
Valeant’s R&D Capabilities Pale When Compared to Allergan’s Track Record of Innovation & Value Creation
~$7bn
~$50bn
~$120bn
Cumulative R&D Spend 1992–2013
Cumulative Sales 1997–2013
2014 – 2024 Potential Additional Sales Associated with R&D Spend
Valeant’s U.S. Recently Launched and
Near-term Pipeline Products Peak Sales Estimates
Per Valeant’s investor presentation dated 22-Apr-2014
Allergan’s R&D Investments Have Yielded Substantial Returns…Abandoning Pre-phase III Projects will be Value Destructive
Product Launches Represent Small Revenue Opportunities. Valeant’s Refusal to Disclose Revenue at a Product Level Makes the Guidance Questionable
(1) Source: EvaluatePharma.
11
|
|
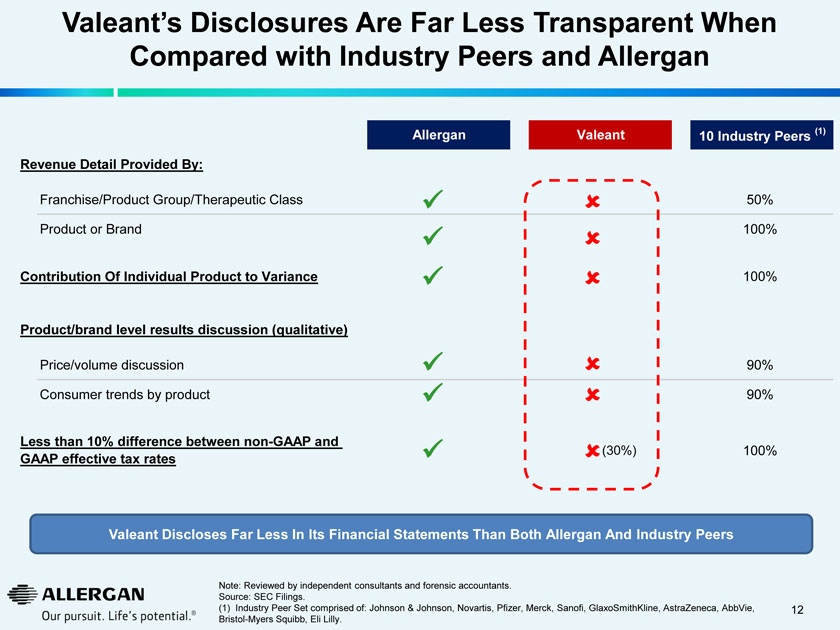
Valeant’s Disclosures Are Far Less Transparent When Compared with Industry Peers and Allergan
Allergan Valeant 10 Industry Peers (1)
Revenue Detail Provided By:
Franchise/Product Group/Therapeutic Class 50%
Product or Brand 100%
Contribution Of Individual Product to Variance 100%
Product/brand level results discussion (qualitative)
Price/volume discussion 90%
Consumer trends by product 90%
Less than 10% difference between non-GAAP and GAAP effective tax rates (30%) 100%
Valeant Discloses Far Less In Its Financial Statements Than Both Allergan And Industry Peers
Note: Reviewed by independent consultants and forensic accountants. Source: SEC Filings. (1) Industry Peer Set comprised of: Johnson & Johnson, Novartis, Pfizer, Merck, Sanofi, GlaxoSmithKline, AstraZeneca, AbbVie, Bristol-Myers Squibb, Eli Lilly.
12
|
|
Valeant’s Business Model Creates Significant Risks and Uncertainties for Allergan’s Stockholders
Valeant’s growth is not sustainable: Business model relies on serial acquisitions and cost reductions, and not on top-line revenue growth and operational excellence
Valeant’s model leads to rapid organic sales decline
Medicis has already declined substantially
Bausch & Lomb’s outlook is poor
Allergan would undoubtedly decline in Valeant’s hands
Investors should challenge Valeant to disclose key product sales and real performance
Valeant needs to complete Allergan transaction or another significant transaction to support its current stock price
Why is Valeant in such a hurry to complete a transaction?
13
|
|
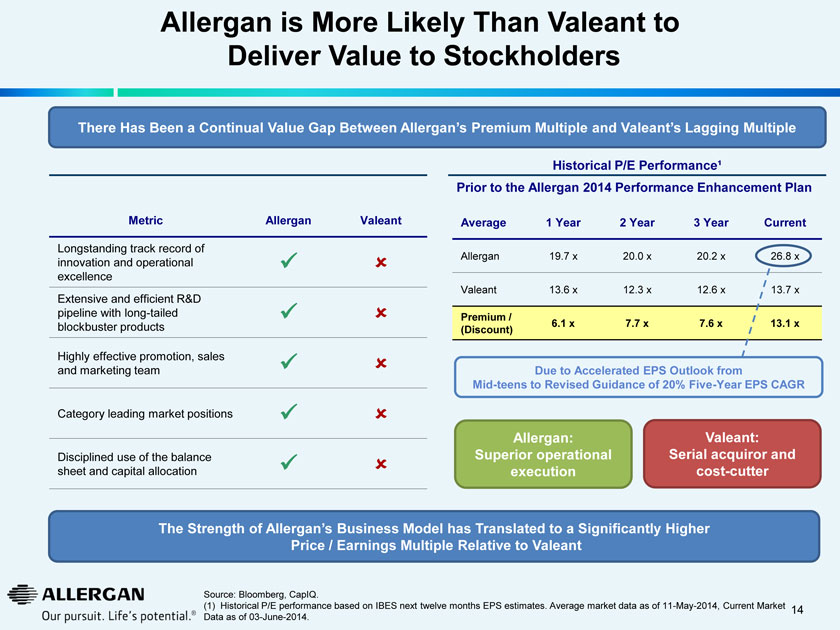
Allergan is More Likely Than Valeant to Deliver Value to Stockholders
There Has Been a Continual Value Gap Between Allergan’s Premium Multiple and Valeant’s Lagging Multiple
Historical P/E Performance¹
Prior to the Allergan 2014 Performance Enhancement Plan
Metric Allergan Valeant
Longstanding track record of innovation and operational excellence
Extensive and efficient R&D pipeline with long-tailed blockbuster products
Highly effective promotion, sales and marketing team
Category leading market positions
Disciplined use of the balance sheet and capital allocation
Average 1 Year 2 Year 3 Year Current
Allergan 19.7 x 20.0 x 20.2 x 26.8 x
Valeant 13.6 x 12.3 x 12.6 x 13.7 x
Premium / (Discount) 6.1 x 7.7 x 7.6 x 13.1 x
Due to Accelerated EPS Outlook from Mid-teens to Revised Guidance of 20% Five-Year EPS CAGR
Allergan: Superior operational execution
Valeant: Serial acquiror and cost-cutter
The Strength of Allergan’s Business Model has Translated to a Significantly Higher Price / Earnings Multiple Relative to Valeant
Source: Bloomberg, CapIQ.
(1) Historical P/E performance based on IBES next twelve months EPS estimates. Average market data as of 11-May-2014, Current Market Data as of 03-June-2014.
14
|
|
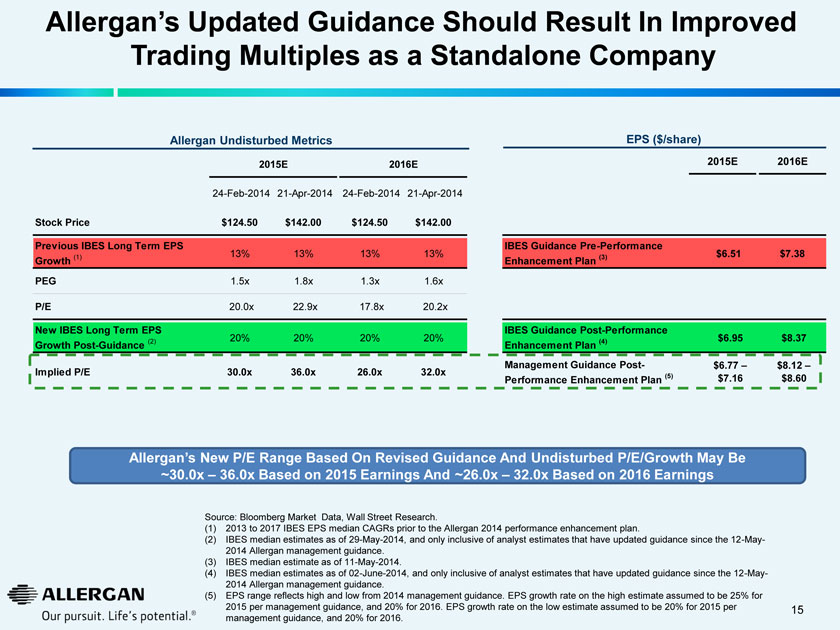
Allergan’s Updated Guidance Should Result In Improved Trading Multiples as a Standalone Company
Allergan Undisturbed Metrics EPS ($/share)
2015E 2016E 2015E 2016E
24-Feb-2014 21-Apr-2014 24-Feb-2014 21-Apr-2014
Stock Price $124.50 $142.00 $124.50 $142.00
Previous IBES Long Term EPS Growth (1) 13% 13% 13% 13%
PEG 1.5x 1.8x 1.3x 1.6x
P/E 20.0x 22.9x 17.8x 20.2x
New IBES Long Term EPS Growth Post-Guidance (2) 20% 20% 20% 20%
Implied P/E 30.0x 36.0x 26.0x 32.0x
IBES Guidance Pre-Performance Enhancement Plan (3) $6.51 $7.38
IBES Guidance Post-Performance Enhancement Plan (4) $6.95 $8.37
Management Guidance Post- Performance Enhancement Plan (5) $6.77 – $7.16 $8.12 – $8.60
Allergan’s New P/E Range Based On Revised Guidance And Undisturbed P/E/Growth May Be
~30.0x – 36.0x Based on 2015 Earnings And ~26.0x – 32.0x Based on 2016 Earnings
Source: Bloomberg Market Data, Wall Street Research.
(1) 2013 to 2017 IBES EPS median CAGRs prior to the Allergan 2014 performance enhancement plan.
(2) IBES median estimates as of 29-May-2014, and only inclusive of analyst estimates that have updated guidance since the 12-May- 2014 Allergan management guidance.
(3) IBES median estimate as of 11-May-2014.
(4) IBES median estimates as of 02-June-2014, and only inclusive of analyst estimates that have updated guidance since the 12-May- 2014 Allergan management guidance.
(5) EPS range reflects high and low from 2014 management guidance. EPS growth rate on the high estimate assumed to be 25% for 2015 per management guidance, and 20% for 2016. EPS growth rate on the low estimate assumed to be 20% for 2015 per management guidance, and 20% for 2016.
15
|
|
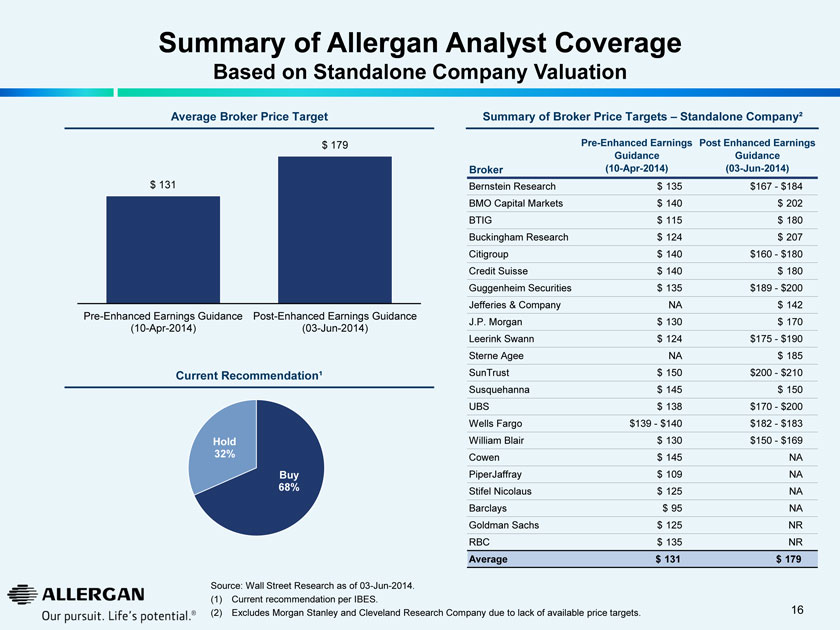
Summary of Allergan Analyst Coverage Based on Standalone Company Valuation
Average Broker Price Target
$ 131 $ 179
Pre-Enhanced Earnings Guidance (10-Apr-2014)
Post-Enhanced Earnings Guidance (03-Jun-2014)
Current Recommendation¹
Hold 32% Buy 68%
Summary of Broker Price Targets – Standalone Company²
Average Broker Price Target
Broker
Pre-Enhanced Earnings Guidance (10-Apr-2014)
Post Enhanced Earnings Guidance (03-Jun-2014)
Bernstein Research $ 135 $167 - $184 BMO Capital Markets $ 140 $ 202 BTIG $ 115 $ 180 Buckingham Research $ 124 $ 207 Citigroup $ 140 $160 - $180 Credit Suisse $ 140 $ 180 Guggenheim Securities $ 135 $189 - $200 Jefferies & Company NA $ 142 J.P. Morgan $ 130 $ 170 Leerink Swann $ 124 $175 - $190 Sterne Agee NA $ 185 SunTrust $ 150 $200 - $210 Susquehanna $ 145 $ 150 UBS $ 138 $170 - $200 Wells Fargo $139 - $140 $182 - $183 William Blair $ 130 $150 - $169 Cowen $ 145 NA PiperJaffray $ 109 NA Stifel Nicolaus $ 125 NA Barclays $ 95 NA Goldman Sachs $ 125 NR RBC $ 135 NR Average $ 131 $ 179
Source: Wall Street Research as of 03-Jun-2014.
(1) Current recommendation per IBES.
(2) Excludes Morgan Stanley and Cleveland Research Company due to lack of available price targets.
16
|
|
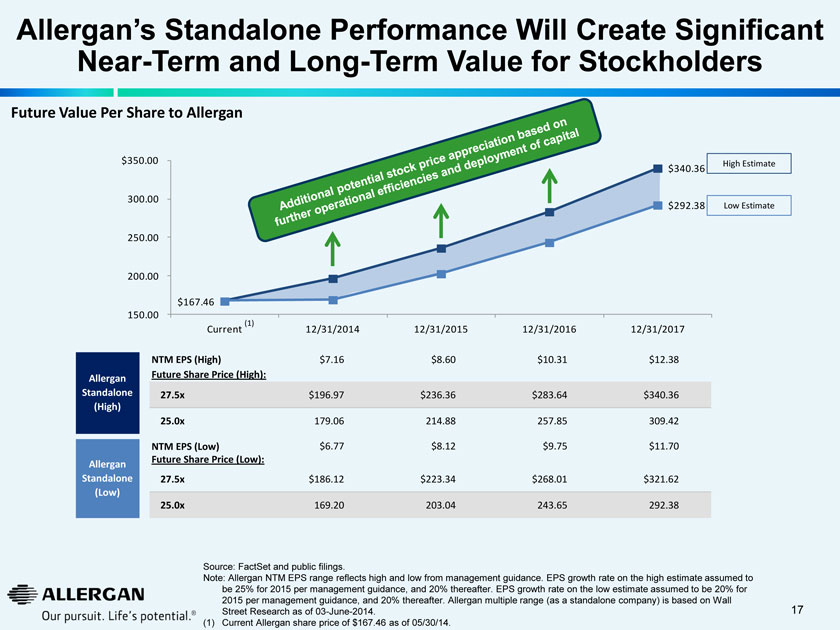
Allergan’s Standalone Performance Will Create Significant Near-Term and Long-Term Value for Stockholders
Future Value Per Share to Allergan
$350.00
300.00
250.00
200.00
150.00
$167.46
Current 12/31/2014 12/31/2015 12/31/2016 12/31/2017
$340.36 High Estimate
$292.38 Low Estimate
Allergan Standalone (High)
NTM EPS (High) $7.16 $8.60 $10.31 $12.38
Future Share Price (High):
27.5x $196.97 $236.36 $283.64 $340.36
25.0x 179.06 214.88 257.85 309.42
Allergan Standalone (Low)
NTM EPS (Low) $6.77 $8.12 $9.75 $11.70
Future Share Price (Low):
27.5x $186.12 $223.34 $268.01 $321.62
25.0x 169.20 203.04 243.65 292.38
Source: FactSet and public filings. Note: Allergan NTM EPS range reflects high and low from management guidance. EPS growth rate on the high estimate assumed to be 25% for 2015 per management guidance, and 20% thereafter. EPS growth rate on the low estimate assumed to be 20% for 2015 per management guidance, and 20% thereafter. Allergan multiple range (as a standalone company) is based on Wall Street Research as of 03-June-2014. (1) Current Allergan share price of $167.46 as of 05/30/14.
17
|
|
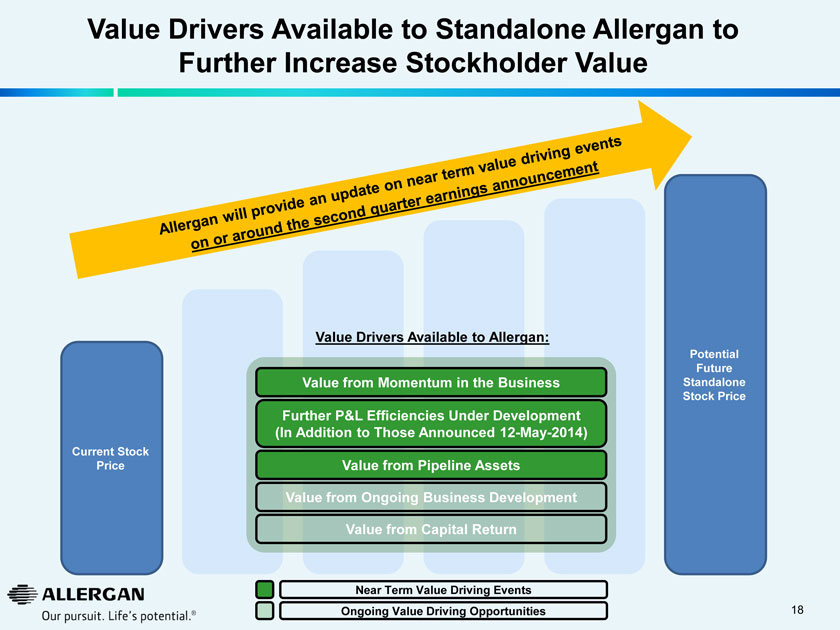
Value Drivers Available to Standalone Allergan to Further Increase Stockholder Value
Current Stock Price
Value Drivers Available to Allergan:
Value from Momentum in the Business
Further P&L Efficiencies Under Development (In Addition to Those Announced 12-May-2014)
Value from Pipeline Assets
Value from Ongoing Business Development
Value from Capital Return
Near Term Value Driving Events
Ongoing Value Driving Opportunities
Potential Future Standalone Stock Price
18
|
|
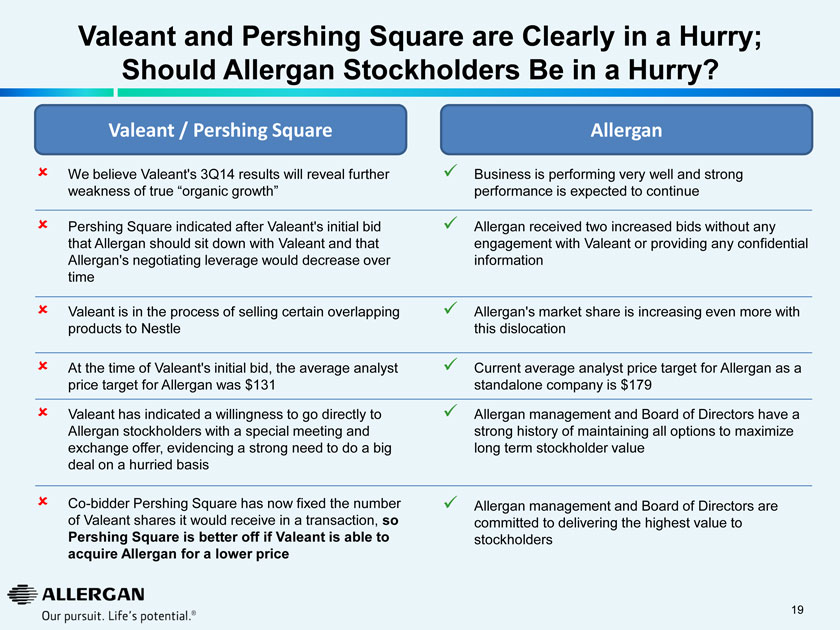
Valeant and Pershing Square are Clearly in a Hurry; Should Allergan Stockholders Be in a Hurry?
Valeant / Pershing Square
We believe Valeant’s 3Q14 results will reveal further weakness of true “organic growth”
Pershing Square indicated after Valeant’s initial bid that Allergan should sit down with Valeant and that Allergan’s negotiating leverage would decrease over time
Valeant is in the process of selling certain overlapping products to Nestle
At the time of Valeant’s initial bid, the average analyst price target for Allergan was $131
Valeant has indicated a willingness to go directly to Allergan stockholders with a special meeting and exchange offer, evidencing a strong need to do a big deal on a hurried basis
Co-bidder Pershing Square has now fixed the number of Valeant shares it would receive in a transaction, so Pershing Square is better off if Valeant is able to acquire Allergan for a lower price
Allergan
Business is performing very well and strong performance is expected to continue
Allergan received two increased bids without any engagement with Valeant or providing any confidential information
Allergan’s market share is increasing even more with this dislocation
Current average analyst price target for Allergan as a standalone company is $179
Allergan management and Board of Directors have a strong history of maintaining all options to maximize long term stockholder value
Allergan management and Board of Directors are committed to delivering the highest value to stockholders
19
|
|
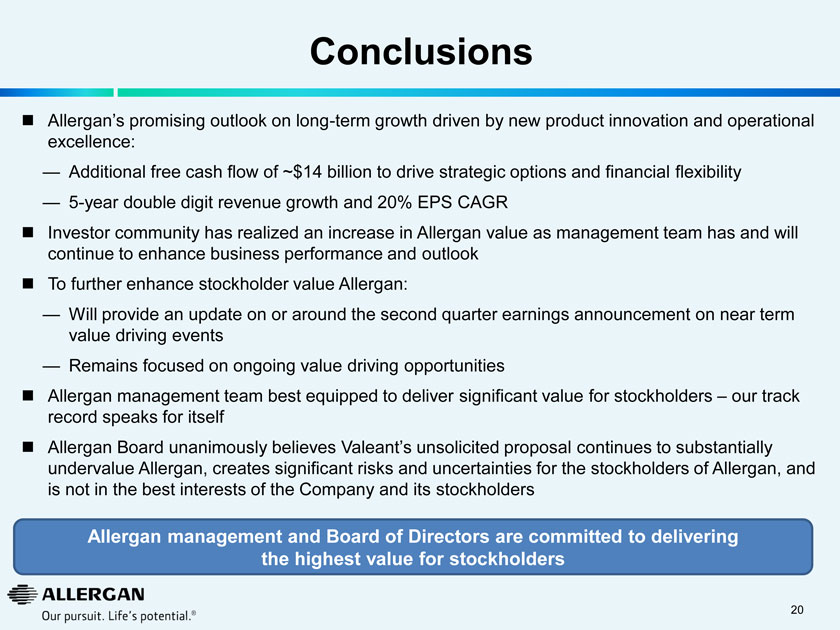
Conclusions
Allergan’s promising outlook on long-term growth driven by new product innovation and operational excellence:
Additional free cash flow of ~$14 billion to drive strategic options and financial flexibility
5-year double digit revenue growth and 20% EPS CAGR
Investor community has realized an increase in Allergan value as management team has and will continue to enhance business performance and outlook
To further enhance stockholder value Allergan:
Will provide an update on or around the second quarter earnings announcement on near term value driving events
Remains focused on ongoing value driving opportunities
Allergan management team best equipped to deliver significant value for stockholders – our track record speaks for itself
Allergan Board unanimously believes Valeant’s unsolicited proposal continues to substantially undervalue Allergan, creates significant risks and uncertainties for the stockholders of Allergan, and is not in the best interests of the Company and its stockholders
Allergan management and Board of Directors are committed to delivering the highest value for stockholders
20
|
|
Reconciliation of Selected Non-GAAP Financial Measures
“GAAP”? refers to financial information presented in accordance with generally accepted accounting principles in the United States.
In this presentation, Allergan included historical non-GAAP financial measures, as defined in Regulation G promulgated by the Securities and Exchange Commission, with respect to estimates for the year ended December 31, 2013, and the corresponding periods for 1999 through 2012. The information for 2012 and 2011 has been retrospectively adjusted to reflect the obesity intervention unit, which was sold on December 2, 2013, as discontinued operations. Allergan believes that its presentation of historical non-GAAP financial measures provides useful supplementary information to investors. The presentation of historical non-GAAP financial measures is not meant to be considered in isolation from or as a substitute for results prepared in accordance with GAAP.
In this presentation, Allergan reported certain financial measures including “Adjusted Sales”, “Adjusted SG&A”?, ”Adjusted R&D”?, “Adjusted EPS”?, “Pro forma Growth” and “Sales Growth at constant exchange rates” as adjusted for Non-GAAP items. Allergan uses these financial measures to enhance the investor’s overall understanding of the financial performance and prospects for the future of Allergan’s core business activities. Specifically, Allergan believes that a report of these financial measures provides consistency in Allergan’s financial reporting and facilitates the comparison of results of core business operations between its current, past and future periods. Adjusted Sales, Adjusted SG&A, Adjusted R&D, Adjusted EPS, Pro forma Growth and Sales Growth are the primary indicators management uses for planning and forecasting in future periods. Allergan also uses Adjusted Sales, Adjusted R&D and Adjusted EPS for evaluating management performance for compensation purposes.
A reconciliation of non-GAAP items may be found under the heading “Non-GAAP Financial Reconciliation” in the investor relations section of the www.Allergan.com website.
21
|
|
Important Information
Information contained in this presentation regarding Valeant Pharmaceuticals International, Inc. (“Valeant”) is taken directly from the information publicly disclosed by Valeant and we do not make any representations or warranties, either express or implied, with respect to such information’s accuracy or completeness. In addition, certain other information contained in this presentation is based on publicly available sources as of the date of this presentation, and while we have no reason to believe that such information is not accurate, we can provide no such assurances with respect thereto. IMS data used in this presentation has been purchased from IMS Health, a provider of healthcare information. This presentation was prepared with the assistance of Allergan’s independent financial consultants and forensic accountants, Alvarez & Marsal and FTI Consulting. The information in this presentation represents the opinions of Allergan and investors and stockholders should make their own independent investigations of the matters referenced in this presentation and draw their own conclusions.
22
|
|
Important Information
Allergan, its directors and certain of its officers and employees are participants in solicitations of Allergan stockholders. Information regarding the names of Allergan’s directors and executive officers and their respective interests in Allergan by security holdings or otherwise is set forth in Allergan’s proxy statement for its 2014 annual meeting of stockholders, filed with the SEC on March 26, 2014, as supplemented by the proxy information filed with the SEC on April 22, 2014. Additional information can be found in Allergan’s Annual Report on Form 10-K for the year ended December 31, 2013, filed with the SEC on February 25, 2014 and its Quarterly Report on Form 10-Q for the quarter ended March 31, 2014, filed with the SEC on May 7, 2014. To the extent holdings of Allergan’s securities have changed since the amounts printed in the proxy statement for the 2014 annual meeting of stockholders, such changes have been reflected on Initial Statements of Beneficial Ownership on Form 3 or Statements of Change in Ownership on Form 4 filed with the SEC. These documents are available free of charge at the SEC’s website at www.sec.gov.
STOCKHOLDERS ARE ENCOURAGED TO READ ANY ALLERGAN SOLICITATION STATEMENT (INCLUDING ANY SUPPLEMENTS THERETO) AND ANY OTHER RELEVANT DOCUMENTS THAT ALLERGAN MAY FILE WITH THE SEC CAREFULLY AND IN THEIR ENTIRETY BECAUSE THEY WILL CONTAIN IMPORTANT INFORMATION. Stockholders will be able to obtain, free of charge, copies of any solicitation statement and any other documents filed by Allergan with the SEC at the SEC’s website at www.sec.gov. In addition, copies will also be available at no charge at the Investors section of Allergan’s website at www.allergan.com.
23
|
|
June 10, 2014
Allergan
A Specialist in the Biopharmaceutical & Medical Device Industries