Attached files
| file | filename |
|---|---|
| 8-K - 8-K - NORTHERN TRUST CORP | d740520d8k.htm |
|
|
P R I N C I P L E S T H A T E N D U R E EXHIBIT 99.1
Service Expertise Integrity
Northern Trust Corporation
Frederick H. Waddell
Chairman & Chief Executive Officer
Morgan Stanley Financials Conference
New York June 10, 2014
© 2014 Northern Trust Corporation
northerntrust.com
|
|
Forward Looking Statement
This presentation may include forward-looking statements concerning Northern Trust’s financial results and outlook, capital adequacy, dividend policy, anticipated expense levels and technology spending, risk management policies, contingent liabilities, strategic initiatives, industry trends, and expectations regarding the impact of recent legislation. Forward-looking statements are typically identified by words or phrases such as “believe”, “expect”, “anticipate”, “intend”, “estimate”, “project”, “likely”, “may increase”, “plan”, “goal”, “target”, “strategy”, and similar expressions or future or conditional verbs such as “may”, “will”, “should”, “would”, and “could”. Forward-looking statements are Northern Trust’s current estimates or expectations of future events or future results, and involve risks and uncertainties that are difficult to predict. These statements are based on assumptions about many important factors, including the factors discussed in Northern Trust’s most recent annual report on Form 10-K and other filings with the U.S. Securities and Exchange Commission, all of which are available on Northern Trust’s website.
We caution you not to place undue reliance on any forward-looking statement as actual results may differ materially from those expressed or implied by forward-looking statements. Northern Trust assumes no obligation to update its forward-looking statements.
2 Morgan Stanley Financials Conference – June 10, 2014
|
|
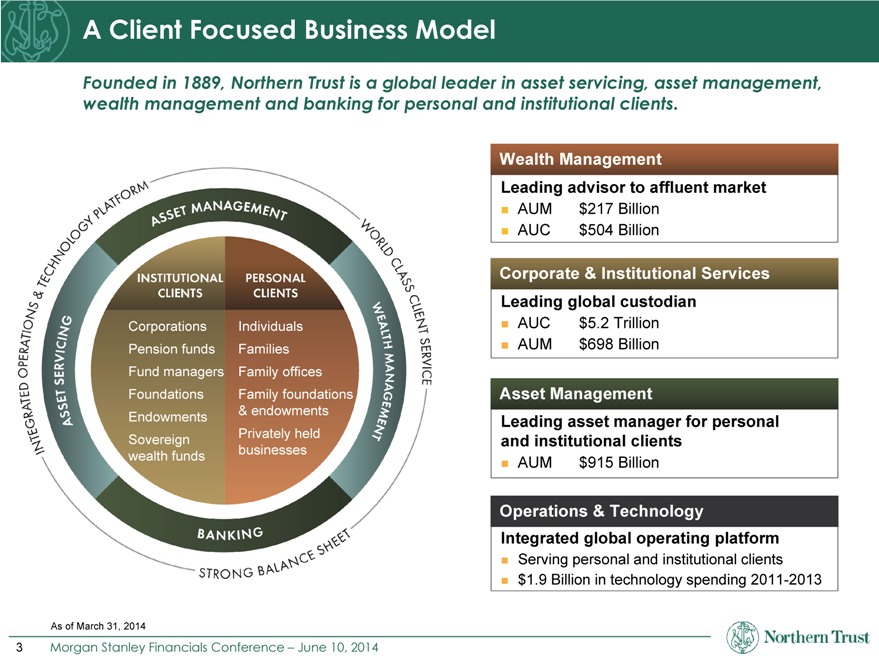
A Client Focused Business Model
Founded in 1889, Northern Trust is a global leader in asset servicing, asset management, wealth management and banking for personal and institutional clients.
Corporations Individuals Pension funds Families Fund managers Family offices Foundations Family foundations & endowments Endowments Privately held Sovereign businesses wealth funds
Wealth Management
Leading advisor to affluent market
AUM $217 Billion AUC $504 Billion
Leading global custodian
AUC $5.2 Trillion AUM $698 Billion
Asset Management
Leading asset manager for personal and institutional clients
AUM $915 Billion
Operations & Technology
Integrated global operating platform
Serving personal and institutional clients $1.9 Billion in technology spending 2011-2013
As of March 31, 2014
3 Morgan Stanley Financials Conference – June 10, 2014
|
|
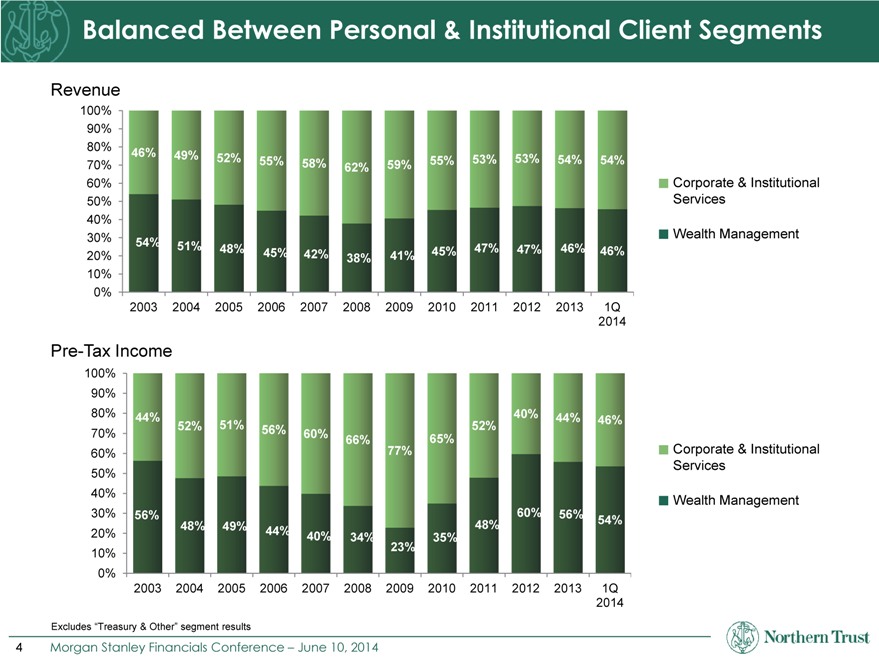
Balanced Between Personal & Institutional Client Segments
Revenue
100%
90%
80%
70%
60% Corporate & Institutional
50% Services
40%
30% Wealth Management
20%
10%
0%
2003 2004 2005 2006 2007 2008 2009 2010 2011 2012 2013 1Q
2014
2014
Pre-Tax Income
100%
90%
80% 44% 40% 44% 46%
70%
60% Corporate & Institutional
50% Services
40% Wealth Management
30%
20%
10%
0%
2003 2004 2005 2006 2007 2008 2009 2010 2011 2012 2013 1Q
2014
Excludes “Treasury & Other” segment results
4 Morgan Stanley Financials Conference – June 10, 2014
|
|
Focused on: Investing for the Future
Capabilities & Expertise
Strategic Locations
Risk Management
Teachnology
5 Morgan Stanley Financials Conference – June 10, 2014
|
|
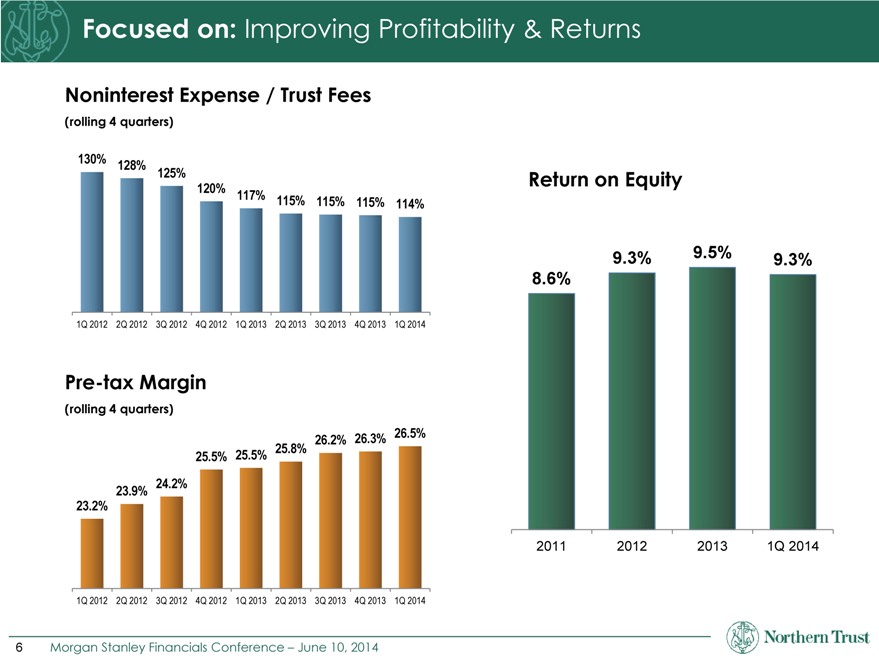
Focused on: Improving Profitability & Returns
Noninterest Expense / Trust Fees
(rolling 4 quarters)
130% 128%
125%
120% 117% 115% 115% 115% 114%
1Q 2012 2Q 2012 3Q 2012 4Q 2012 1Q 2013 2Q 2013 3Q 2013 4Q 2013 1Q 2014
Pre-tax Margin
(rolling 4 quarters)
26.2% 26.3% 26.5%
25.5% 25.5% 25.8%
23.9% 24.2%
23.2%
1Q 2012 2Q 2012 3Q 2012 4Q 2012 1Q 2013 2Q 2013 3Q 2013 4Q 2013 1Q 2014
Return on Equity
9.3% 9.5% 9.3%
86%.
2011 2012 2013 1Q 2014
6 Morgan Stanley Financials Conference – June 10, 2014
|
|
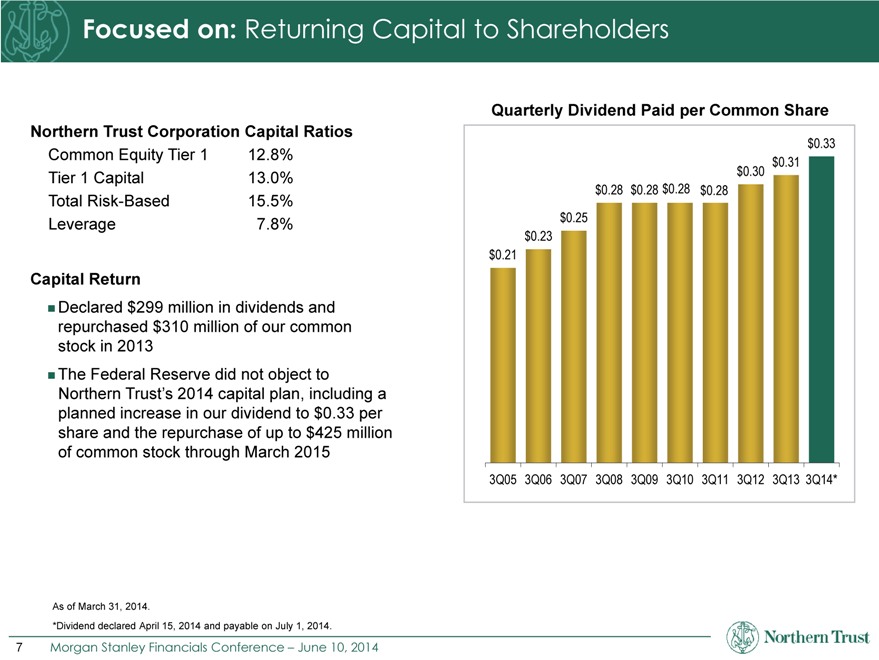
Focused on: Returning Capital to Shareholders
Northern Trust Corporation Capital Ratios
Common Equity Tier 1 12.8% Tier 1 Capital 13.0% Total Risk-Based 15.5% Leverage 7.8%
Capital Return
Declared $299 million in dividends and repurchased $310 million of our common stock in 2013The Federal Reserve did not object to Northern Trust’s 2014 capital plan, including a planned increase in our dividend to $0.33 per share and the repurchase of up to $425 million of common stock through March 2015
Quarterly Dividend Paid per Common Share
$0.33
$0.30 $0.31
$0.28 $0.28 $0.28 $0.28
$0.25
$0.23
$0.21
3Q05 3Q06 3Q07 3Q08 3Q09 3Q10 3Q11 3Q12 3Q13 3Q14*
As of March 31, 2014.
*Dividend declared April 15, 2014 and payable on July 1, 2014.
7 Morgan Stanley Financials Conference – June 10, 2014
|
|
Northern Trust Corporation: Consistently Strong and Focused
Market Leader in Focused Businesses Strong History of Organic Growth Investing for the Future Improving Profitability & Returns Returning Capital to Shareholders
8 Morgan Stanley Financials Conference – June 10, 2014
|
|
Northern Trust