Attached files
| file | filename |
|---|---|
| 8-K - 8-K - PACWEST BANCORP | a14-14876_18k.htm |
Exhibit 99.1
|
|
KBW US REGIONAL LEADERS BANK CONFERENCE The Savoy Hotel, London June 9, 2014 |
|
|
FORWARD-LOOKING STATEMENTS This communication contains certain forward-looking information about PacWest that is intended to be covered by the safe harbor for “forward-looking statements” provided by the Private Securities Litigation Reform Act of 1995. All references herein to PacWest are intended to refer to PacWest and its predecessor First Community Bancorp. All statements other than statements of historical fact are forward-looking statements. Such statements involve inherent risks and uncertainties, many of which are difficult to predict and are generally beyond the control of PacWest. Forward-looking statements speak only as of the date they are made and we assume no duty to update such statements. We caution readers that a number of important factors could cause actual results to differ materially from those expressed in, or implied or projected by, such forward-looking statements. In addition to factors previously disclosed in reports filed by PacWest with the SEC, risks and uncertainties for each institution and the combined institution include, but are not limited to: lower than expected revenues; credit quality deterioration or a reduction in real estate values could cause an increase in the allowance for credit losses and a reduction in net earnings; increased competitive pressure among depository institutions; the ability to complete any future transactions, successfully integrate such acquired entities, or achieve expected beneficial synergies and/or operating efficiencies, in each case within expected time-frames or at all; regulatory approvals may not be received on expected timeframes or at all; settlements with the FDIC related to loss-sharing arrangements; the possibility that personnel changes will not proceed as planned; the possibility that the cost of additional capital may be more than expected; the possibility that a change in the interest rate environment may reduce net interest margins; asset/liability re-pricing risks and liquidity risks; pending legal matters may take longer or cost more to resolve or may be resolved adversely; general economic conditions, either nationally or in the market areas in which the entities operate or anticipate doing business, are less favorable than expected; and environmental conditions, including natural disasters, may disrupt business, impede operations, or negatively impact the values of collateral securing loans. For a more complete discussion of risks and uncertainties, investors and security holders are urged to read PacWest’s reports filed with or furnished to the SEC. Pro forma, projected and estimated numbers are used for illustrative purposes only and are not forecasts, and actual results may differ materially. June 9, 2014 2 |
|
|
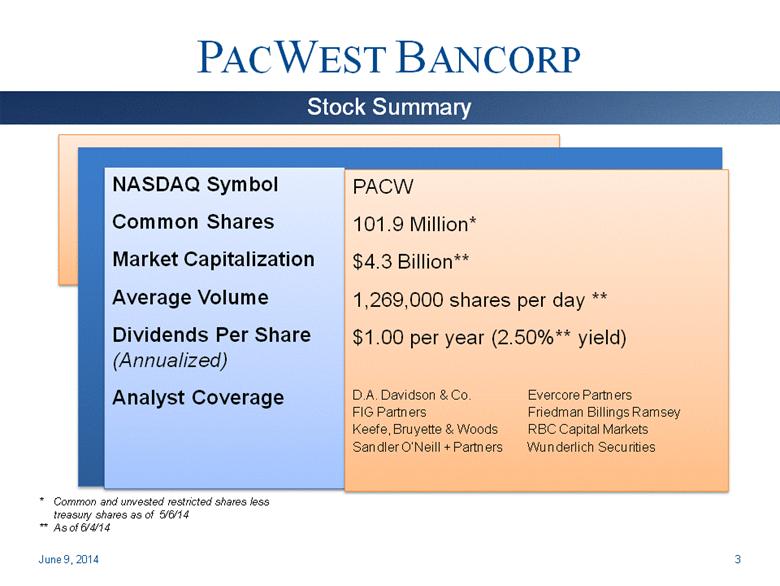
PACWEST BANCORP NASDAQ Symbol Common Shares Market Capitalization Average Volume Dividends Per Share (Annualized) Analyst Coverage PACW 101.9 Million* $4.3 Billion** 1,269,000 shares per day ** $1.00 per year (2.50%** yield) D.A. Davidson & Co. Evercore Partners FIG Partners Friedman Billings Ramsey Keefe, Bruyette & Woods RBC Capital Markets Sandler O’Neill + Partners Wunderlich Securities June 9, 2014 Stock Summary * Common and unvested restricted shares less treasury shares as of 5/6/14 ** As of 6/4/14 3 |
|
|
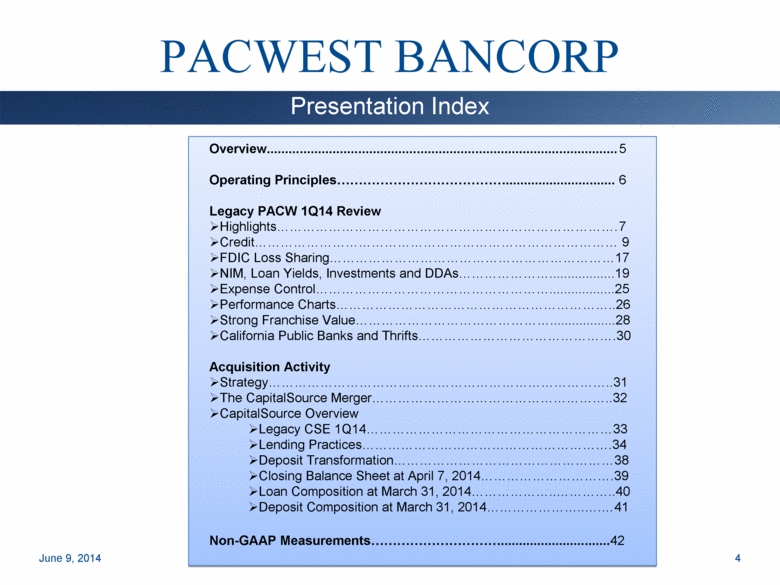
PACWEST BANCORP June 9, 2014 Presentation Index Overview 5 Operating Principles 6 Legacy PACW 1Q14 Review Highlights 7 Credit 9 FDIC Loss Sharing 17 NIM, Loan Yields, Investments and DDAs 19 Expense Control25 Performance Charts 26 Strong Franchise Value 28 California Public Banks and Thrifts 30 Acquisition Activity Strategy 31 The CapitalSource Merger 32 CapitalSource Overview Legacy CSE 1Q14 33 Lending Practices 34 Deposit Transformation 38 Closing Balance Sheet at April 7, 2014 39 Loan Composition at March 31, 2014 40 Deposit Composition at March 31, 2014 41 Non-GAAP Measurements 42 4 |
|
|
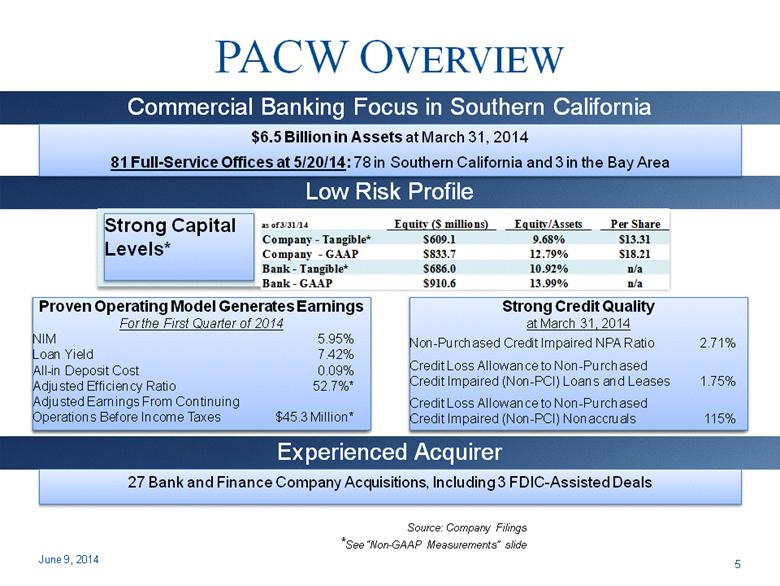
PACW OVERVIEW $6.5 Billion in Assets at March 31, 2014 81 Full-Service Offices at 5/20/14: 78 in Southern California and 3 in the Bay Area June 9, 2014 Commercial Banking Focus in Southern California Source: Company Filings *See “Non-GAAP Measurements” slide Strong Capital Levels* Proven Operating Model Generates Earnings For the First Quarter of 2014 NIM 5.95% Loan Yield 7.42% All-in Deposit Cost 0.09% Adjusted Efficiency Ratio 52.7%* Adjusted Earnings From Continuing Operations Before Income Taxes $45.3 Million* Strong Credit Quality at March 31, 2014 Non-Purchased Credit Impaired NPA Ratio 2.71% Credit Loss Allowance to Non-Purchased Credit Impaired (Non-PCI) Loans and Leases 1.75% Credit Loss Allowance to Non-Purchased Credit Impaired (Non-PCI) Nonaccruals 115% Low Risk Profile Experienced Acquirer 27 Bank and Finance Company Acquisitions, Including 3 FDIC-Assisted Deals 5 as of 3/31/14 Equity ($ millions) Equity/Assets Per Share Company - Tangible* $609.1 9.68% $13.31 Company - GAAP $833.7 12.79% $18.21 Bank - Tangible* $686.0 10.92% n/a Bank - GAAP $910.6 13.99% n/a |
|
|
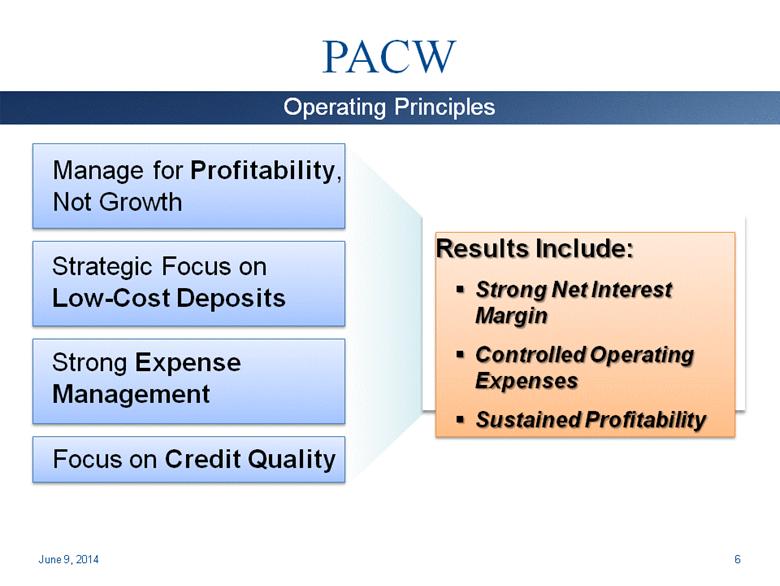
PACW Manage for Profitability, Not Growth Strategic Focus on Low-Cost Deposits Strong Expense Management Focus on Credit Quality Results Include: Strong Net Interest Margin Controlled Operating Expenses Sustained Profitability June 9, 2014 Operating Principles 6 |
|
|
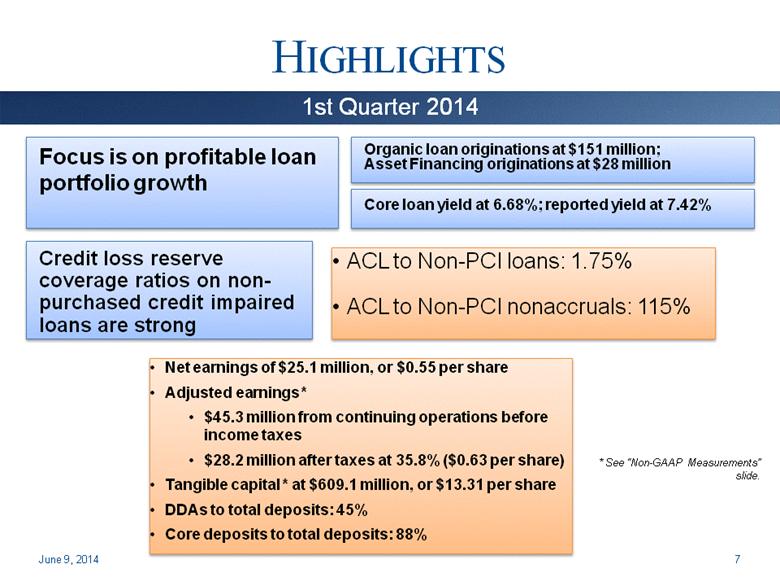
HIGHLIGHTS Focus is on profitable loan portfolio growth Organic loan originations at $151 million; Asset Financing originations at $28 million Core loan yield at 6.68%; reported yield at 7.42% June 9, 2014 1st Quarter 2014 Credit loss reserve coverage ratios on non-purchased credit impaired loans are strong ACL to Non-PCI loans: 1.75% ACL to Non-PCI nonaccruals: 115% Net earnings of $25.1 million, or $0.55 per share Adjusted earnings * $45.3 million from continuing operations before income taxes $28.2 million after taxes at 35.8% ($0.63 per share) Tangible capital * at $609.1 million, or $13.31 per share DDAs to total deposits: 45% Core deposits to total deposits: 88% * See “Non-GAAP Measurements” slide. 7 |
|
|
HIGHLIGHTS June 9, 2014 Solid Earnings Track Record * See “Non-GAAP Measurements” slide. 8 Adjusted Earnings From Continuing Operations Before Income Taxes Net Earnings (Loss) PacWest Bancorp ($ in Millions) 1Q11 2Q11 3Q11 4Q11 1Q12 2Q12 3Q12 4Q12 1Q13 2Q13 3Q13 4Q13 1Q14 Adjusted Earnings from Continuing Operations Before Income Taxes* $28.4 $31.6 $29.1 $28.4 $30.9 $30.0 $33.4 $33.9 $27.3 $27.9 $38.1 $38.2 $45.3 Net Earnings (Loss) $10.71 $12.8 $13.3 $13.9 $5.3 $15.6 $16.1 $19.9 $13.5 $4.3 $24.2 $3.1 $25.1 |

|
|
CREDIT June 9, 2014 Credit Quality is Strong (1) Classified loans and leases are those with a credit risk rating of substandard or doubtful. 9 March 31, December 31, September 30, June 30, March 31, December 31, September 30, June 30, 2014 2013 2013 2013 2013 2012 2012 2012 (Dollars in thousands) Non-PCI Credit Quality Metrics: Allowance for credit losses 66,955 $ 67,816 $ 67,801 $ 69,926 $ 71,896 $ 72,119 $ 75,012 $ 78,031 $ Nonaccrual loans and leases 58,121 46,774 50,845 51,689 43,127 41,762 39,185 55,894 Classified loans and leases (1) 150,511 127,311 130,791 128,181 107,178 104,054 100,308 144,075 Performing restructured loans 35,101 41,648 80,237 83,543 80,501 106,288 112,834 103,815 Net charge-offs (recoveries) 861 (15) 2,125 1,970 223 2,893 1,019 3,706 Provision for credit losses - - - - - - (2,000) - Allowance for credit losses to loans and leases 1.75% 1.73% 1.72% 1.78% 2.41% 2.35% 2.44% 2.71% Allowance for credit losses to nonaccrual loans and leases 115.2% 145.0% 133.3% 135.3% 166.7% 172.7% 191.4% 139.6% Nonperforming assets to loans and leases and other real estate owned 2.71% 2.48% 2.67% 2.91% 3.17% 3.14% 3.27% 4.37% |

|
|
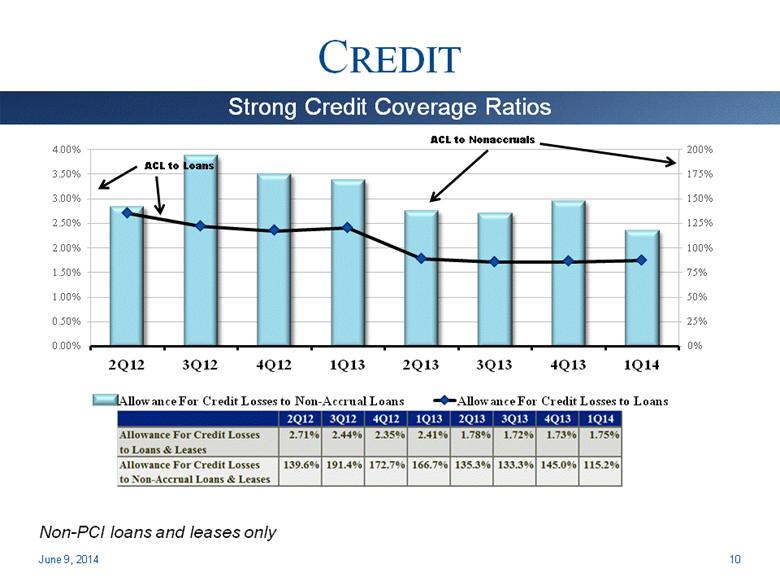
CREDIT June 9, 2014 Strong Credit Coverage Ratios Non-PCI loans and leases only ACL to Loans 10 Allowance For Credit Losses to Non-Accrual Loans Allowance For Credit Losses to Loans 2Q12 3Q12 4Q12 1Q13 2Q13 3Q13 4Q13 1Q14 Allowance For Credit Losses to Loans & Leases 2.71% 2.44% 2.35% 2.41% 1.78% 1.72% 1.73% 1.75% Allowance For Credit Losses to Non-Accrual Loans & Leases 139.6% 191.4% 172.7% 166.7% 135.3% 133.3% 145.0% 115.2% |
|
|
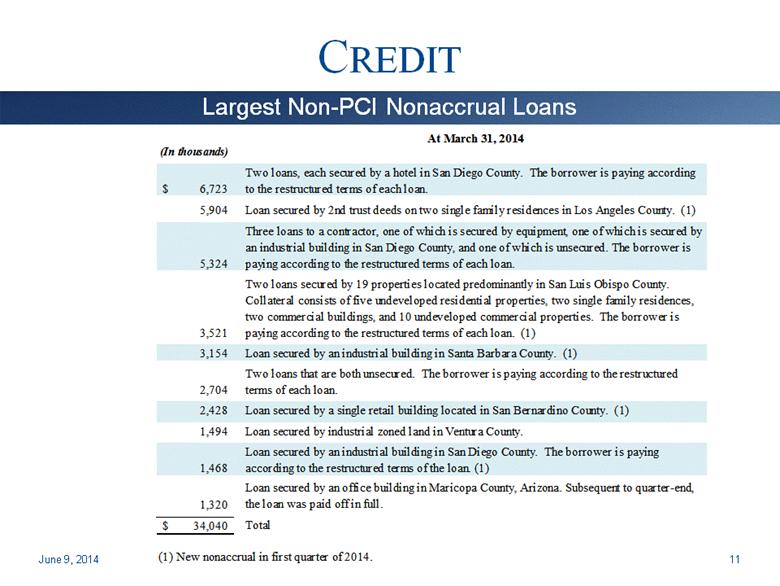
CREDIT June 9, 2014 Largest Non-PCI Nonaccrual Loans 11 At March 31, 2014 (In thousands) For Info Only - not for Print 6,723 $ Two loans, each secured by a hotel in San Diego County. The borrower is paying according to the restructured terms of each loan. 5,904 Loan secured by 2nd trust deeds on two single family residences in Los Angeles County. (1) 5,324 Three loans to a contractor, one of which is secured by equipment, one of which is secured by an industrial building in San Diego County, and one of which is unsecured. The borrower is paying according to the restructured terms of each loan. 3,521 Two loans secured by 19 properties located predominantly in San Luis Obispo County. Collateral consists of five undeveloped residential properties, two single family residences, two commercial buildings, and 10 undeveloped commercial properties. The borrower is paying according to the restructured terms of each loan. (1) 3,154 Loan secured by an industrial building in Santa Barbara County. (1) 2,704 Two loans that are both unsecured. The borrower is paying according to the restructured terms of each loan. 2,428 Loan secured by a single retail building located in San Bernardino County. (1) 1,494 Loan secured by industrial zoned land in Ventura County. 1,468 Loan secured by an industrial building in San Diego County. The borrower is paying according to the restructured terms of the loan. (1) 1,320 Loan secured by an office building in Maricopa County, Arizona. Subsequent to quarter-end, the loan was paid off in full. 34,040 $ Total (1) New nonaccrual in first quarter of 2014. |
|
|
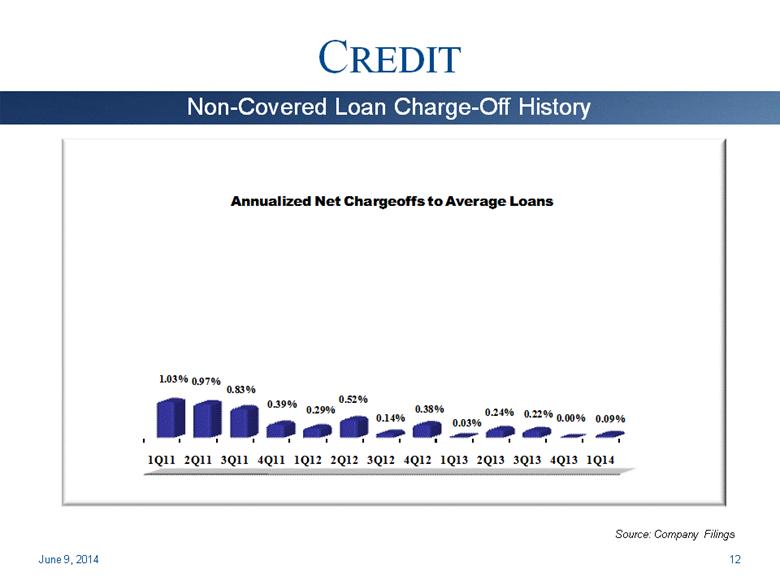
CREDIT June 9, 2014 Non-Covered Loan Charge-Off History Source: Company Filings 12 1Q11 2Q11 3Q11 4Q11 1Q12 2Q12 3Q12 4Q12 1Q13 2Q13 3Q13 4Q13 1Q14 1.03% 0.97% 0.83% 0.39% 0.29% 0.52% 0.14% 0.38% 0.03% 0.24% 0.22% 0.00% 0.09% Annualized Net Chargeoffs to Average Loans |
|
|
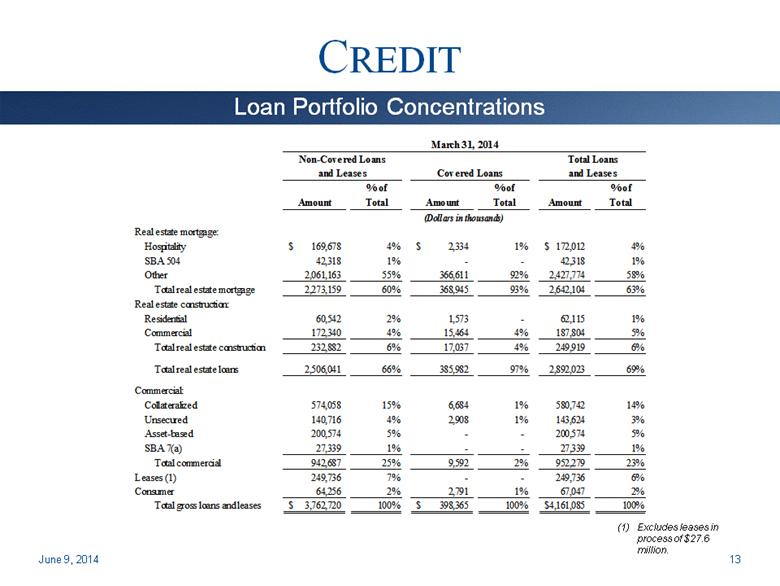
CREDIT June 9, 2014 Loan Portfolio Concentrations (1) Excludes leases in process of $27.6 million. 13 March 31, 2014 Non-Covered Loans Total Loans and Leases Covered Loans and Leases Rounding %'s % of % of % of Amount Total Amount Total Amount Total (Dollars in thousands) Real estate mortgage: Hospitality 169,678 $ 4% 2,334 $ 1% 172,012 $ 4% SBA 504 42,318 1% - - 42,318 1% Other 2,061,163 55% 366,611 92% 2,427,774 58% Total real estate mortgage 2,273,159 60% 368,945 93% 2,642,104 63% Real estate construction: Residential 60,542 2% 1,573 - 62,115 1% Commercial 172,340 4% 15,464 4% 187,804 5% Total real estate construction 232,882 6% 17,037 4% 249,919 6% Total real estate loans 2,506,041 66% 385,982 97% 2,892,023 69% Commercial: Collateralized 574,058 15% 6,684 1% 580,742 14% Unsecured 140,716 4% 2,908 1% 143,624 3% Asset-based 200,574 5% - - 200,574 5% SBA 7(a) 27,339 1% - - 27,339 1% Total commercial 942,687 25% 9,592 2% 952,279 23% Leases (1) 249,736 7% - - 249,736 6% Consumer 64,256 2% 2,791 1% 67,047 2% Total gross loans and leases 3,762,720 $ 100% 398,365 $ 100% 4,161,085 $ 100% |
|
|
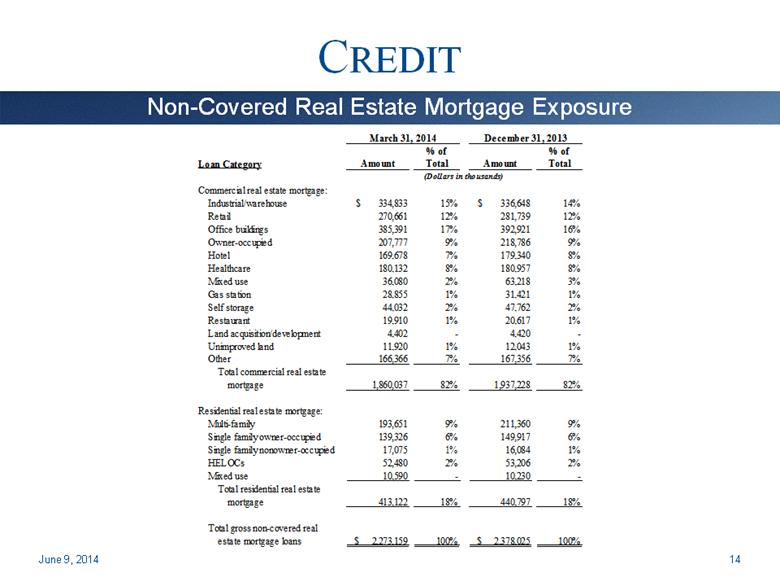
CREDIT June 9, 2014 Non-Covered Real Estate Mortgage Exposure 14 March 31, 2014 December 31, 2013 % of % of Loan Category Amount Total Amount Total (Dollars in thousands) Commercial real estate mortgage: Industrial/warehouse $ 334,833 15% $ 336,648 14% Retail 270,661 12% 281,739 12% Office buildings 385,391 17% 392,921 16% Owner-occupied 207,777 9% 218,786 9% Hotel 169,678 7% 179,340 8% Healthcare 180,132 8% 180,957 8% Mixed use 36,080 2% 63,218 3% Gas station 28,855 1% 31,421 1% Self storage 44,032 2% 47,762 2% Restaurant 19,910 1% 20,617 1% Land acquisition/development 4,402 - 4,420 - Unimproved land 11,920 1% 12,043 1% Other 166,366 7% 167,356 7% Total commercial real estate mortgage 1,860,037 82% 1,937,228 82% Residential real estate mortgage: Multi-family 193,651 9% 211,360 9% Single family owner-occupied 139,326 6% 149,917 6% Single family nonowner-occupied 17,075 1% 16,084 1% HELOCs 52,480 2% 53,206 2% Mixed use 10,590 - 10,230 - Total residential real estate mortgage 413,122 18% 440,797 18% Total gross non-covered real estate mortgage loans $ 2,273,159 100% $ 2,378,025 100% |
|
|
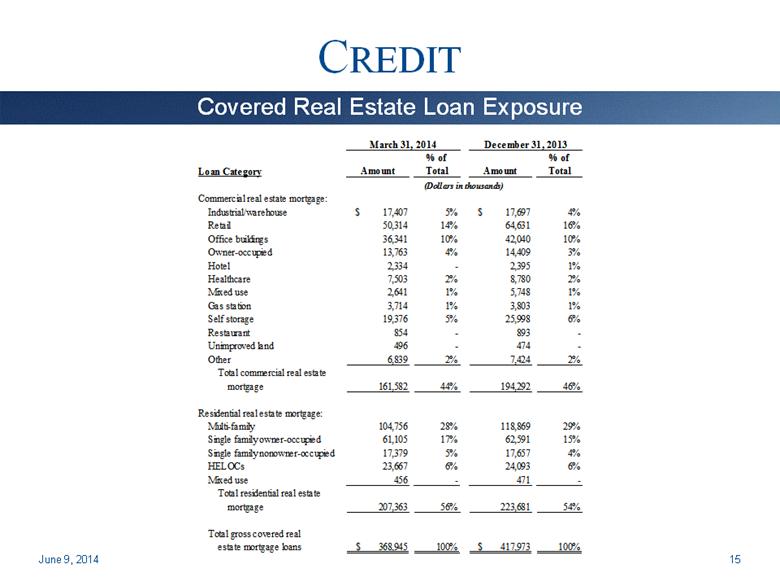
CREDIT June 9, 2014 Covered Real Estate Loan Exposure 15 March 31, 2014 December 31, 2013 % of % of Loan Category Amount Total Amount Total (Dollars in thousands) Commercial real estate mortgage: Industrial/warehouse $ 17,407 5% $ 17,697 4% Retail 50,314 14% 64,631 16% Office buildings 36,341 10% 42,040 10% Owner-occupied 13,763 4% 14,409 3% Hotel 2,334 - 2,395 1% Healthcare 7,503 2% 8,780 2% Mixed use 2,641 1% 5,748 1% Gas station 3,714 1% 3,803 1% Self storage 19,376 5% 25,998 6% Restaurant 854 - 893 - Unimproved land 496 - 474 - Other 6,839 2% 7,424 2% Total commercial real estate mortgage 161,582 44% 194,292 46% Residential real estate mortgage: Multi-family 104,756 28% 118,869 29% Single family owner-occupied 61,105 17% 62,591 15% Single family nonowner-occupied 17,379 5% 17,657 4% HELOCs 23,667 6% 24,093 6% Mixed use 456 - 471 - Total residential real estate mortgage 207,363 56% 223,681 54% Total gross covered real estate mortgage loans $ 368,945 100% $ 417,973 100% |
|
|
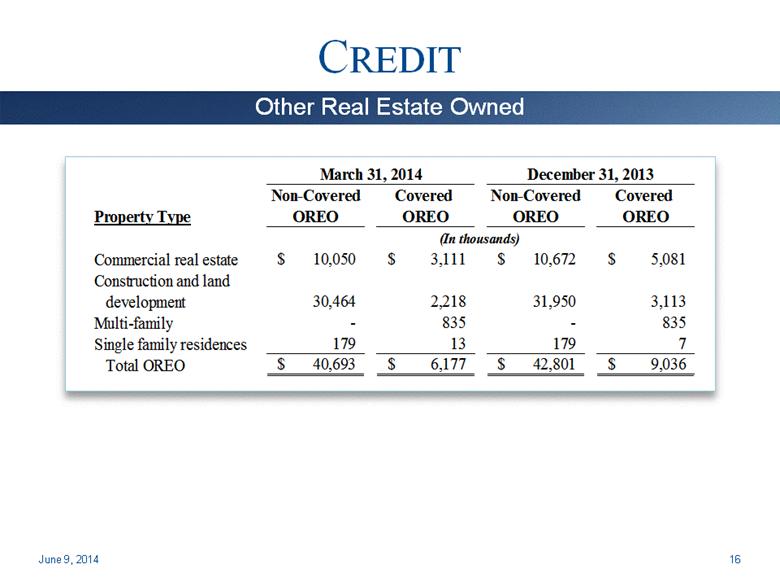
CREDIT June 9, 2014 Other Real Estate Owned 16 March 31, 2014 December 31, 2013 Non-Covered Covered Non-Covered Covered Property Type OREO OREO OREO OREO (In thousands) Commercial real estate 10,050 $ 3,111 $ 10,672 $ 5,081 $ Construction and land development 30,464 2,218 31,950 3,113 Multi-family - 835 - 835 Single family residences 179 13 179 7 Total OREO 40,693 $ 6,177 $ 42,801 $ 9,036 $ |
|
|
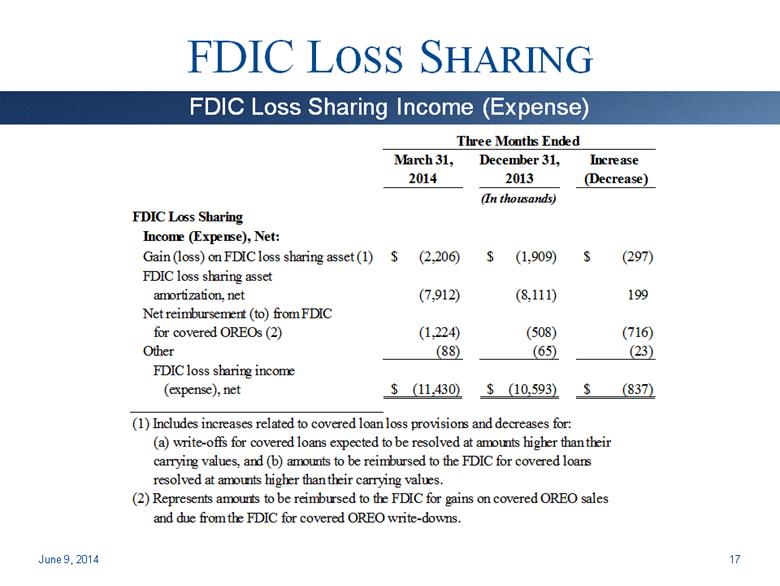
FDIC LOSS SHARING June 9, 2014 FDIC Loss Sharing Income (Expense) 17 Three Months Ended March 31, December 31, Increase 2014 2013 (Decrease) (In thousands) FDIC Loss Sharing Income (Expense), Net: Gain (loss) on FDIC loss sharing asset (1) (2,206) $ (1,909) $ (297) $ FDIC loss sharing asset amortization, net (7,912) (8,111) 199 Net reimbursement (to) from FDIC for covered OREOs (2) (1,224) (508) (716) Other (88) (65) (23) FDIC loss sharing income (expense), net (11,430) $ (10,593) $ (837) $ (1) Includes increases related to covered loan loss provisions and decreases for: (a) write-offs for covered loans expected to be resolved at amounts higher than their carrying values, and (b) amounts to be reimbursed to the FDIC for covered loans resolved at amounts higher than their carrying values. (2) Represents amounts to be reimbursed to the FDIC for gains on covered OREO sales and due from the FDIC for covered OREO write-downs. |
|
|
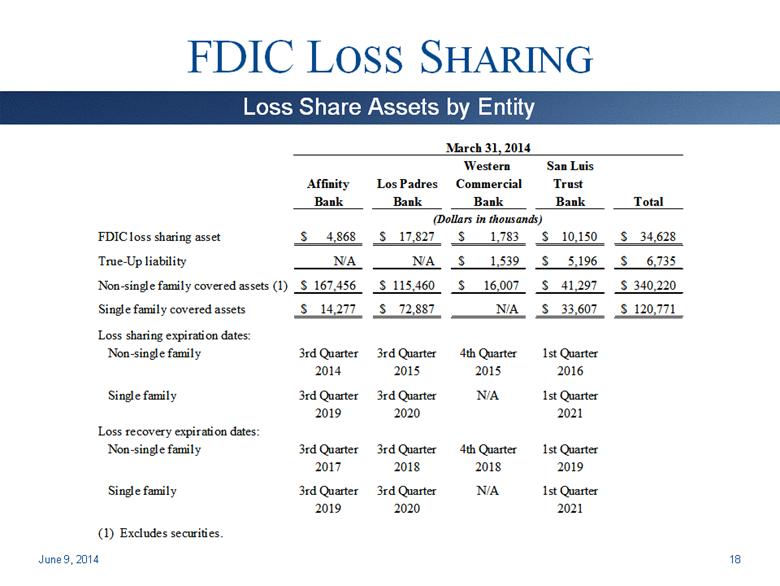
FDIC LOSS SHARING June 9, 2014 18 Loss Share Assets by Entity March 31, 2014 Rounding Western San Luis Affinity Los Padres Commercial Trust Bank Bank Bank Bank Total (Dollars in thousands) (In thousands) FDIC loss sharing asset 4,868 $ 17,827 $ 1,783 $ 10,150 $ 34,628 $ True-Up liability N/A N/A 1,539 $ 5,196 $ 6,735 $ Non-single family covered assets (1) 167,456 $ 115,460 $ 16,007 $ 41,297 $ 340,220 $ Single family covered assets 14,277 $ 72,887 $ N/A 33,607 $ 120,771 $ Loss sharing expiration dates: Non-single family 3rd Quarter 3rd Quarter 4th Quarter 1st Quarter 2014 2015 2015 2016 Single family 3rd Quarter 3rd Quarter N/A 1st Quarter 2019 2020 2021 Loss recovery expiration dates: Non-single family 3rd Quarter 3rd Quarter 4th Quarter 1st Quarter 2017 2018 2018 2019 Single family 3rd Quarter 3rd Quarter N/A 1st Quarter 2019 2020 2021 (1) Excludes securities. |
|
|
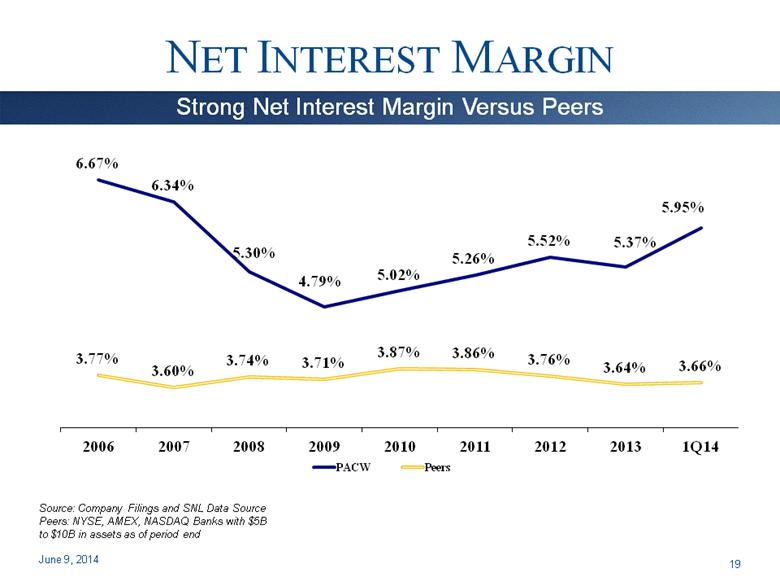
NET INTEREST MARGIN June 9, 2014 Strong Net Interest Margin Versus Peers Source: Company Filings and SNL Data Source Peers: NYSE, AMEX, NASDAQ Banks with $5B to $10B in assets as of period end 19 |
|
|
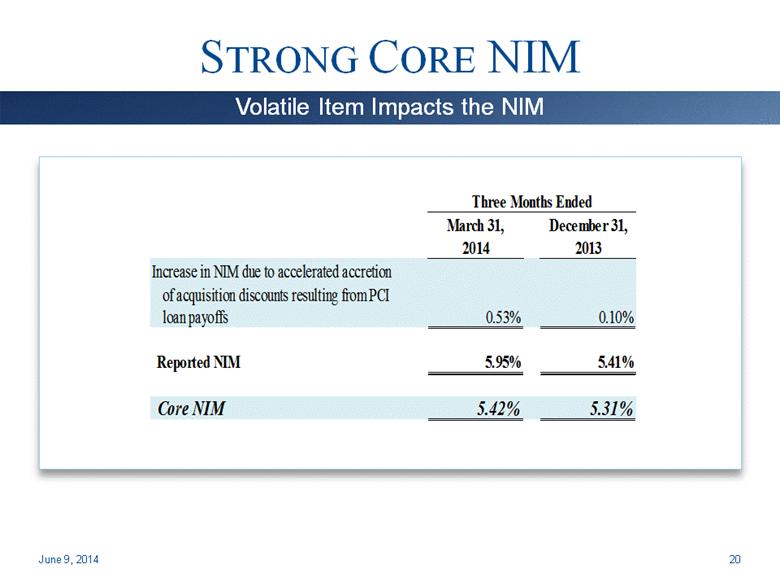
STRONG CORE NIM June 9, 2014 Volatile Item Impacts the NIM 20 Three Months Ended March 31, December 31, 2014 2013 Increase in NIM due to accelerated accretion of acquisition discounts resulting from PCI loan payoffs 0.53% 0.10% Reported NIM 5.95% 5.41% Core NIM 5.42% 5.31% |
|
|
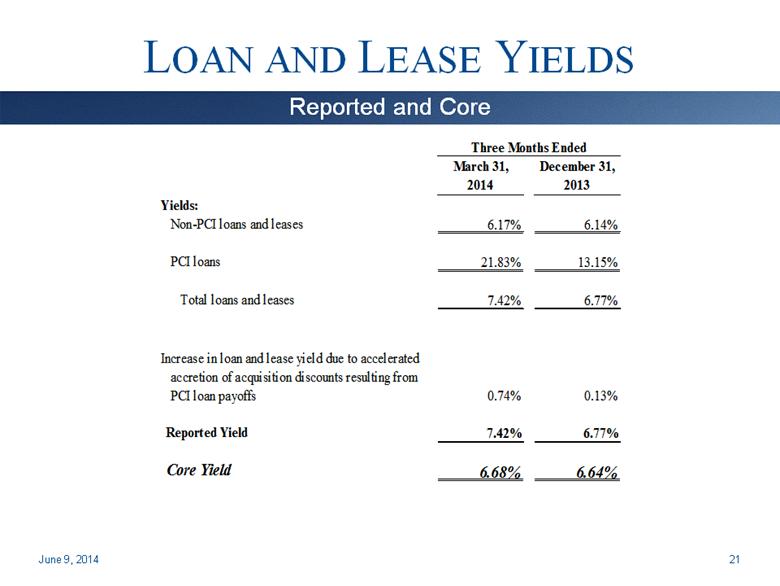
LOAN AND LEASE YIELDS June 9, 2014 21 Reported and Core Three Months Ended March 31, December 31, 2014 2013 Yields: Non-PCI loans and leases 6.17% 6.14% PCI loans 21.83% 13.15% Total loans and leases 7.42% 6.77% Increase in loan and lease yield due to accelerated accretion of acquisition discounts resulting from PCI loan payoffs 0.74% 0.13% Reported Yield 7.42% 6.77% Core Yield 6.68% 6.64% |
|
|
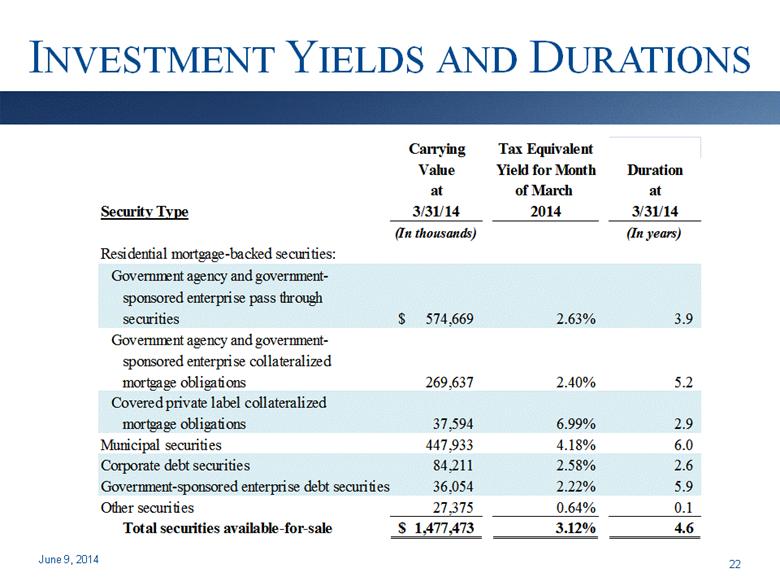
INVESTMENT YIELDS AND DURATIONS June 9, 2014 22 Carrying Tax Equivalent Value Yield for Month Duration at of March at Security Type 3/31/14 2014 3/31/14 (In thousands) (In years) Residential mortgage-backed securities: Government agency and government- sponsored enterprise pass through securities 574,669 $ 2.63% 3.9 Government agency and government- sponsored enterprise collateralized mortgage obligations 269,637 2.40% 5.2 Covered private label collateralized mortgage obligations 37,594 6.99% 2.9 Municipal securities 447,933 4.18% 6.0 Corporate debt securities 84,211 2.58% 2.6 Government-sponsored enterprise debt securities 36,054 2.22% 5.9 Other securities 27,375 0.64% 0.1 Total securities available-for-sale 1,477,473 $ 3.12% 4.6 |
|
|
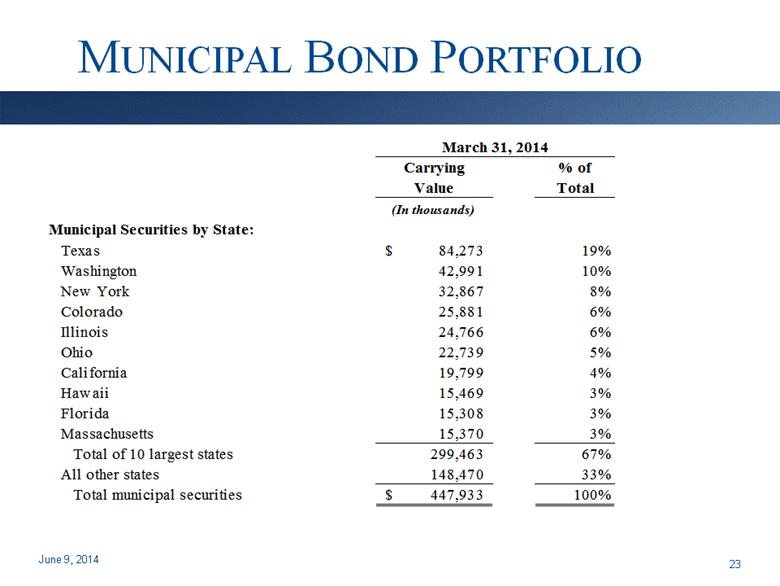
MUNICIPAL BOND PORTFOLIO June 9, 2014 23 March 31, 2014 Carrying % of Value Total (In thousands) Municipal Securities by State: Texas 84,273 $ 19% Washington 42,991 10% New York 32,867 8% Colorado 25,881 6% Illinois 24,766 6% Ohio 22,739 5% California 19,799 4% Hawaii 15,469 3% Florida 15,308 3% Massachusetts 15,370 3% Total of 10 largest states 299,463 67% All other states 148,470 33% Total municipal securities 447,933 $ 100% |
|
|
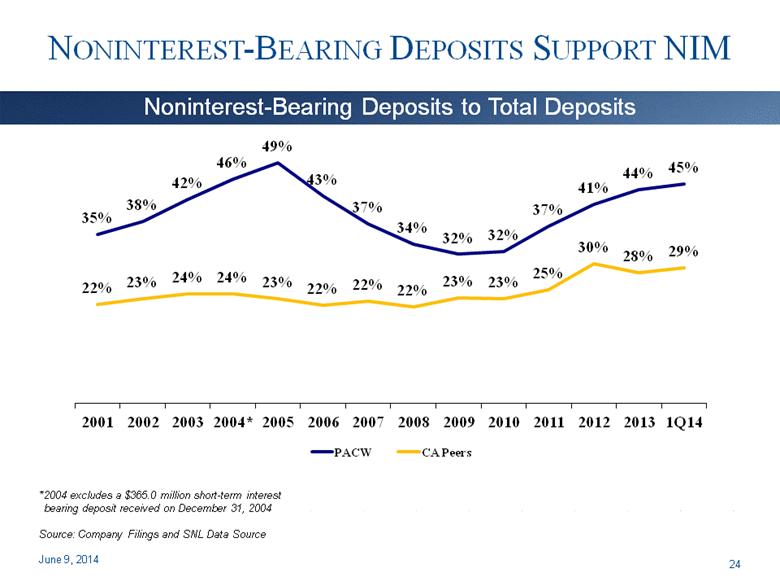
NONINTEREST-BEARING DEPOSITS SUPPORT NIM June 9, 2014 Noninterest-Bearing Deposits to Total Deposits * 2004 excludes a $365.0 million short-term interest bearing deposit received on December 31, 2004 Source: Company Filings and SNL Data Source 24 |
|
|
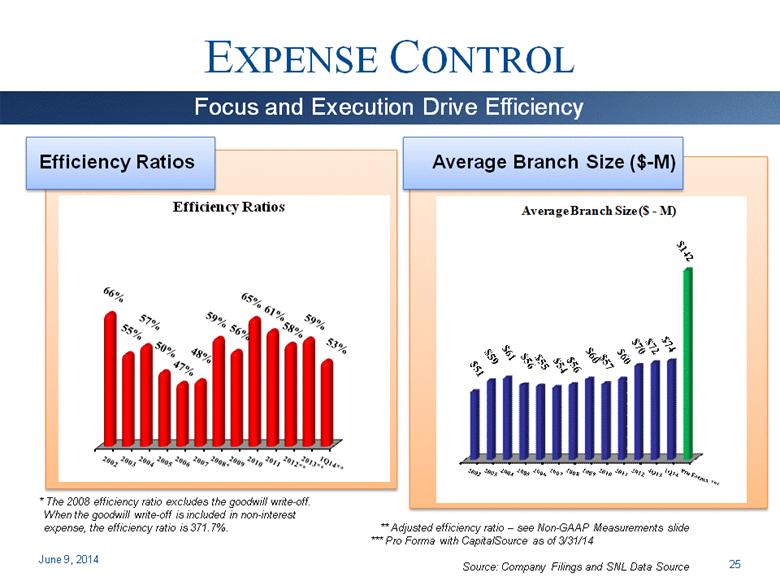
Efficiency Ratios Average Branch Size ($-M) EXPENSE CONTROL June 9, 2014 Focus and Execution Drive Efficiency * The 2008 efficiency ratio excludes the goodwill write-off. When the goodwill write-off is included in non-interest expense, the efficiency ratio is 371.7%. ** Adjusted efficiency ratio – see Non-GAAP Measurements slide *** Pro Forma with CapitalSource as of 3/31/14 Source: Company Filings and SNL Data Source 25 Average Branch Size ($ - M) |
|
|
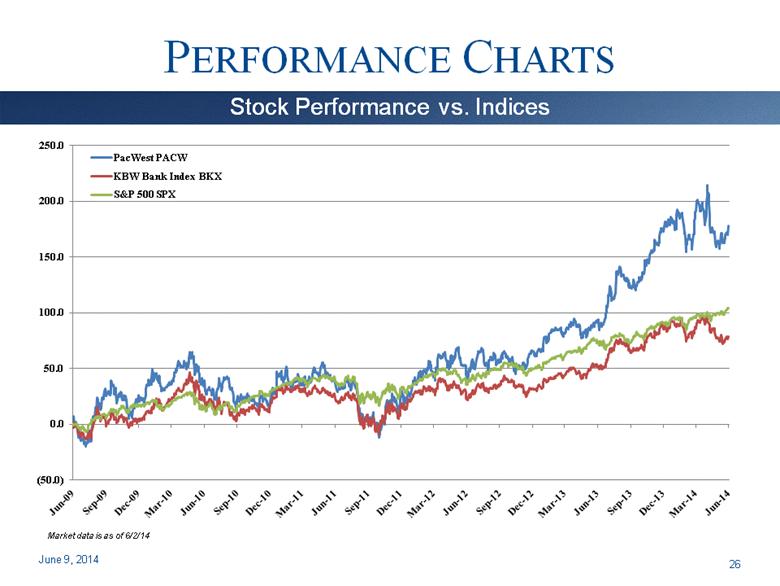
PERFORMANCE CHARTS June 9, 2014 Stock Performance vs. Indices 26 Market data is as of 6/2/14 |
|
|
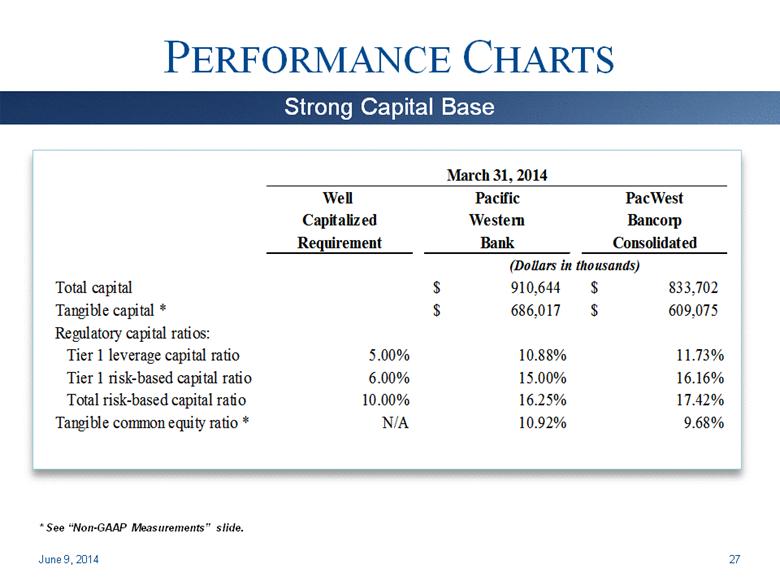
PERFORMANCE CHARTS June 9, 2014 Strong Capital Base * See “Non-GAAP Measurements” slide. 27 March 31, 2014 Well Pacific PacWest Capitalized Western Bancorp Requirement Bank Consolidated (Dollars in thousands) Total capital 910,644 $ 833,702 $ Tangible capital * 686,017 $ 609,075 $ Regulatory capital ratios: Tier 1 leverage capital ratio 5.00% 10.88% 11.73% Tier 1 risk-based capital ratio 6.00% 15.00% 16.16% Total risk-based capital ratio 10.00% 16.25% 17.42% Tangible common equity ratio * N/A 10.92% 9.68% |
|
|
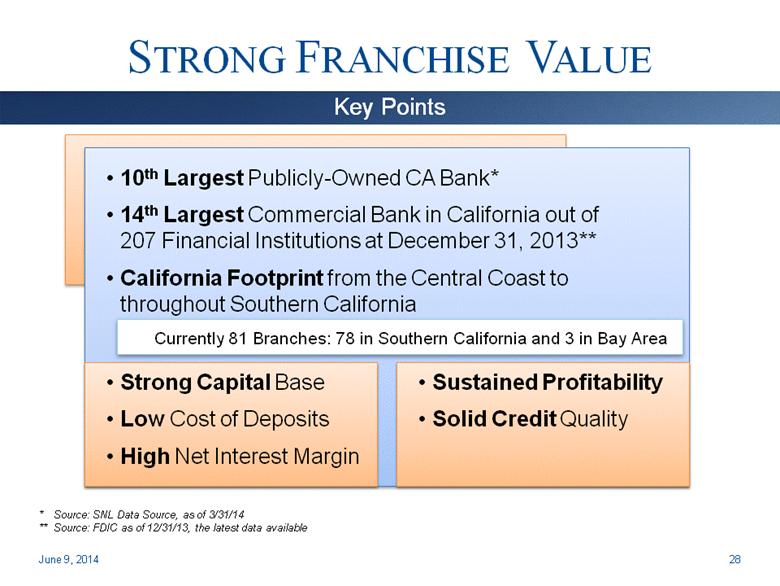
STRONG FRANCHISE VALUE 10th Largest Publicly-Owned CA Bank* 14th Largest Commercial Bank in California out of 207 Financial Institutions at December 31, 2013** California Footprint from the Central Coast to throughout Southern California Currently 81 Branches: 78 in Southern California and 3 in Bay Area June 9, 2014 Key Points * Source: SNL Data Source, as of 3/31/14 ** Source: FDIC as of 12/31/13, the latest data available Strong Capital Base Low Cost of Deposits High Net Interest Margin Sustained Profitability Solid Credit Quality 28 |
|
|
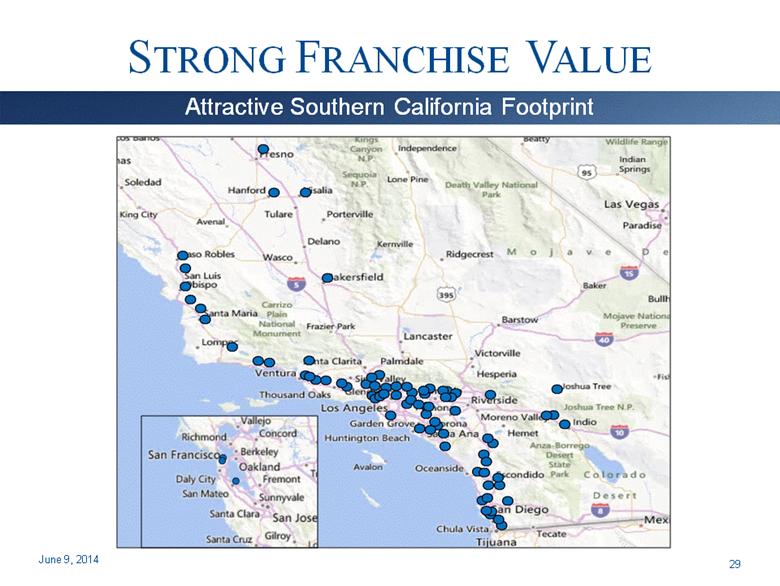
STRONG FRANCHISE VALUE June 9, 2014 Attractive Southern California Footprint 29 |
|
|
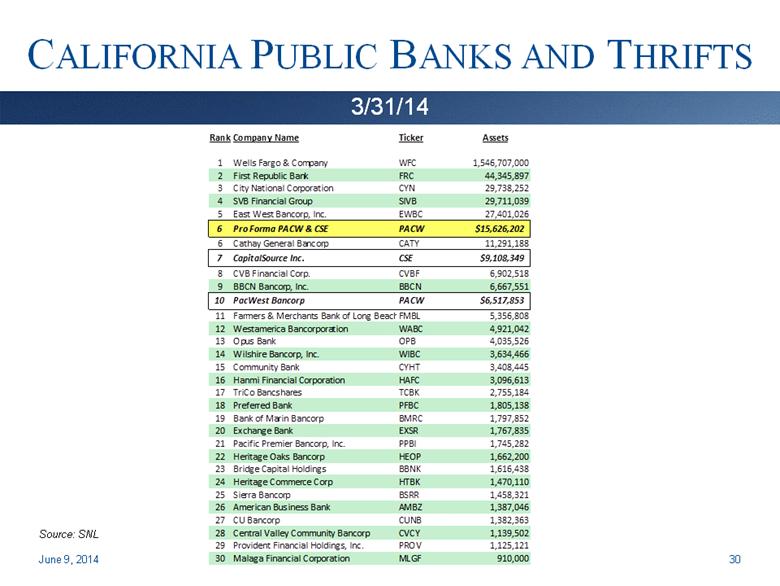
CALIFORNIA PUBLIC BANKS AND THRIFTS June 9, 2014 3/31/14 Source: SNL 30 Rank Company Name Ticker Assets 1 Wells Fargo & Company WFC 1,546,707,000 2 First Republic Bank FRC 44,345,897 3 City National Corporation CYN 29,738,252 4 SVB Financial Group SIVB 29,711,039 5 East West Bancorp, Inc. EWBC 27,401,026 6 Pro Forma PACW & CSE PACW $15,626,202 6 Cathay General Bancorp CATY 11,291,188 7 CapitalSource Inc. CSE $9,108,349 8 CVB Financial Corp. CVBF 6,902,518 9 BBCN Bancorp, Inc. BBCN 6,667,551 10 PacWest Bancorp PACW $6,517,853 11 Farmers & Merchants Bank of Long Beach FMBL 5,356,808 12 Westamerica Bancorporation WABC 4,921,042 13 Opus Bank OPB 4,035,526 14 Wilshire Bancorp, Inc. WIBC 3,634,466 15 Community Bank CYHT 3,408,445 16 Hanmi Financial Corporation HAFC 3,096,613 17 TriCo Bancshares TCBK 2,755,184 18 Preferred Bank PFBC 1,805,138 19 Bank of Marin Bancorp BMRC 1,797,852 20 Exchange Bank EXSR 1,767,835 21 Pacific Premier Bancorp, Inc. PPBI 1,745,282 22 Heritage Oaks Bancorp HEOP 1,662,200 23 Bridge Capital Holdings BBNK 1,616,438 24 Heritage Commerce Corp HTBK 1,470,110 25 Sierra Bancorp BSRR 1,458,321 26 American Business Bank AMBZ 1,387,046 27 CU Bancorp CUNB 1,382,363 28 Central Valley Community Bancorp CVCY 1,139,502 29 Provident Financial Holdings, Inc. PROV 1,125,121 30 Malaga Financial Corporation MLGF 910,000 |
|
|
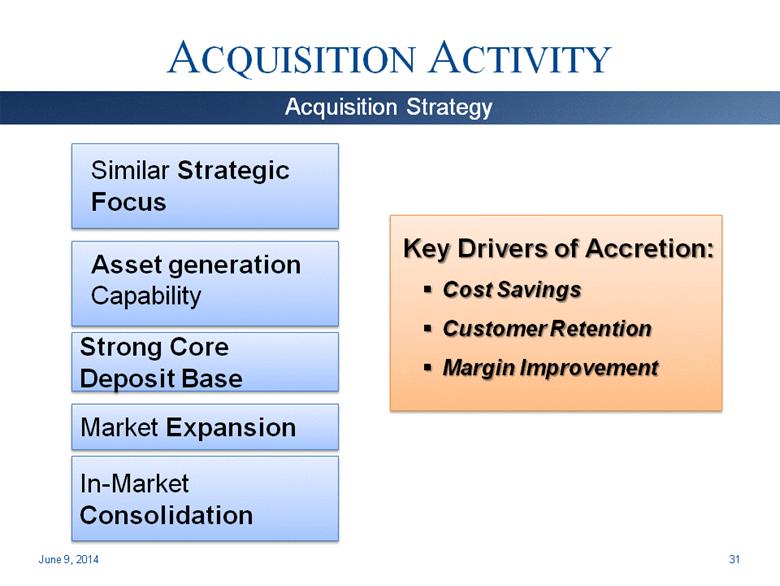
In-Market Consolidation Strong Core Deposit Base ACQUISITION ACTIVITY Similar Strategic Focus Asset generation Capability Key Drivers of Accretion: Cost Savings Customer Retention Margin Improvement June 9, 2014 Acquisition Strategy 31 Market Expansion |
|
|
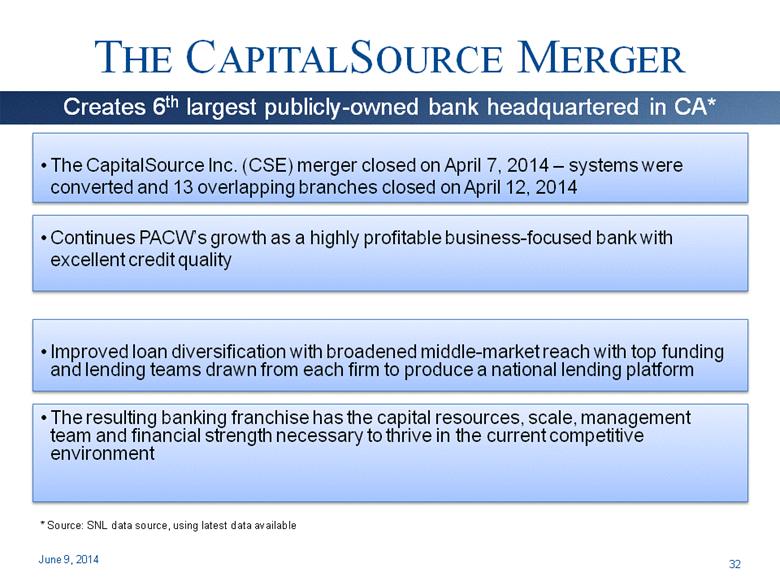
THE CAPITALSOURCE MERGER The CapitalSource Inc. (CSE) merger closed on April 7, 2014 – systems were converted and 13 overlapping branches closed on April 12, 2014 Continues PACW’s growth as a highly profitable business-focused bank with excellent credit quality Improved loan diversification with broadened middle-market reach with top funding and lending teams drawn from each firm to produce a national lending platform The resulting banking franchise has the capital resources, scale, management team and financial strength necessary to thrive in the current competitive environment June 9, 2014 Creates 6th largest publicly-owned bank headquartered in CA* 32 * Source: SNL data source, using latest data available |
|
|
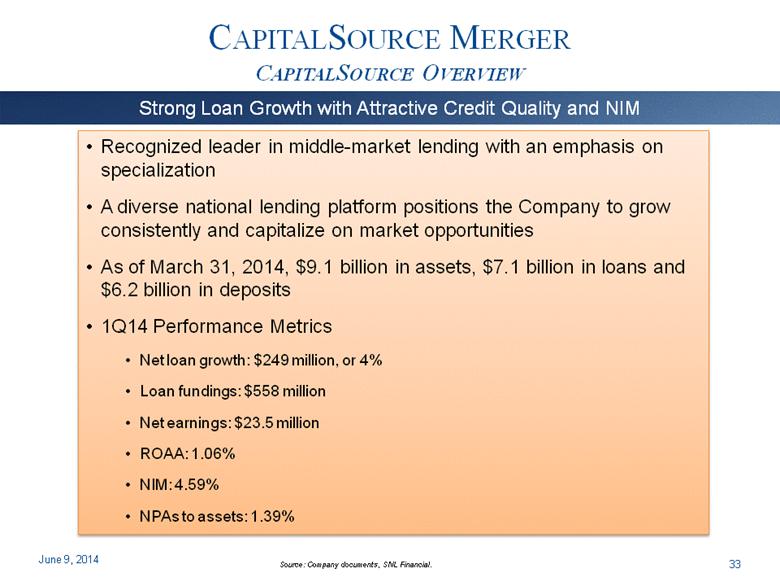
CAPITALSOURCE MERGER CAPITALSOURCE OVERVIEW 33 Strong Loan Growth with Attractive Credit Quality and NIM Recognized leader in middle-market lending with an emphasis on specialization A diverse national lending platform positions the Company to grow consistently and capitalize on market opportunities As of March 31, 2014, $9.1 billion in assets, $7.1 billion in loans and $6.2 billion in deposits 1Q14 Performance Metrics Net loan growth: $249 million, or 4% Loan fundings: $558 million Net earnings: $23.5 million ROAA: 1.06% NIM: 4.59% NPAs to assets: 1.39% Source: Company documents, SNL Financial. June 9, 2014 |
|
|
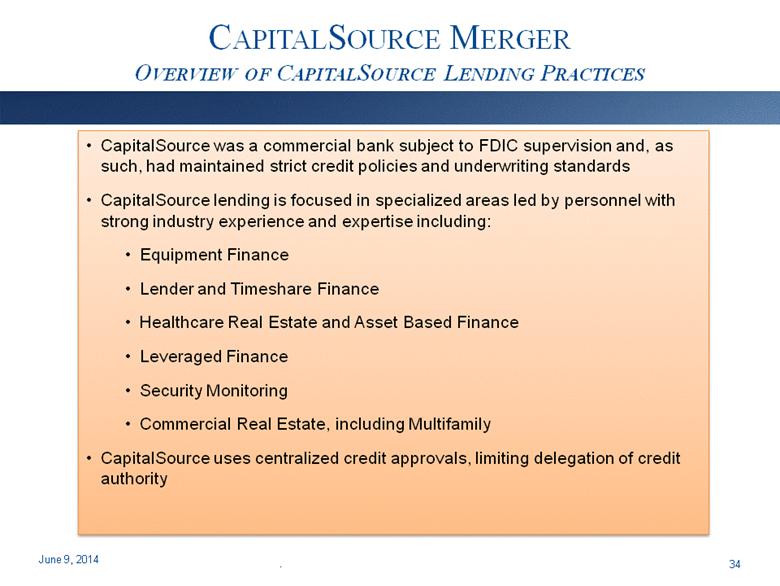
CAPITALSOURCE MERGER OVERVIEW OF CAPITALSOURCE LENDING PRACTICES 34 CapitalSource was a commercial bank subject to FDIC supervision and, as such, had maintained strict credit policies and underwriting standards CapitalSource lending is focused in specialized areas led by personnel with strong industry experience and expertise including: Equipment Finance Lender and Timeshare Finance Healthcare Real Estate and Asset Based Finance Leveraged Finance Security Monitoring Commercial Real Estate, including Multifamily CapitalSource uses centralized credit approvals, limiting delegation of credit authority . June 9, 2014 |
|
|
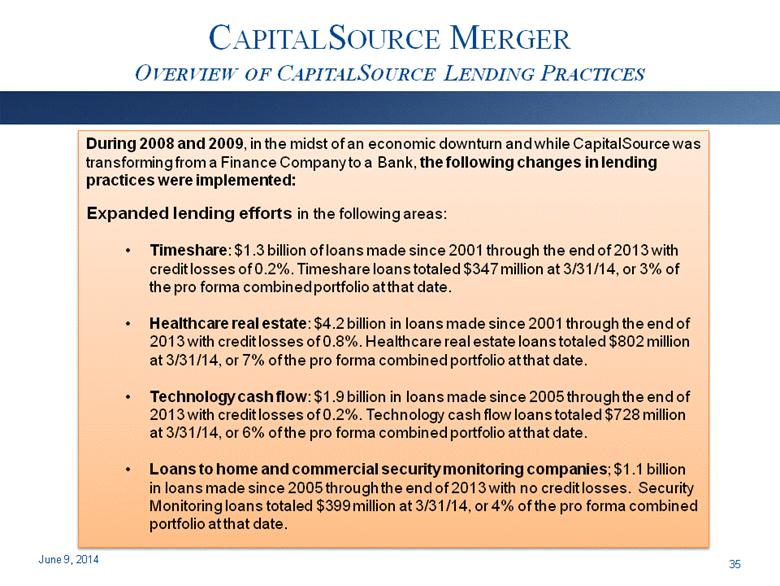
CAPITALSOURCE MERGER OVERVIEW OF CAPITALSOURCE LENDING PRACTICES 35 During 2008 and 2009, in the midst of an economic downturn and while CapitalSource was transforming from a Finance Company to a Bank, the following changes in lending practices were implemented: Expanded lending efforts in the following areas: Timeshare: $1.3 billion of loans made since 2001 through the end of 2013 with credit losses of 0.2%. Timeshare loans totaled $347 million at 3/31/14, or 3% of the pro forma combined portfolio at that date. Healthcare real estate: $4.2 billion in loans made since 2001 through the end of 2013 with credit losses of 0.8%. Healthcare real estate loans totaled $802 million at 3/31/14, or 7% of the pro forma combined portfolio at that date. Technology cash flow: $1.9 billion in loans made since 2005 through the end of 2013 with credit losses of 0.2%. Technology cash flow loans totaled $728 million at 3/31/14, or 6% of the pro forma combined portfolio at that date. Loans to home and commercial security monitoring companies; $1.1 billion in loans made since 2005 through the end of 2013 with no credit losses. Security Monitoring loans totaled $399 million at 3/31/14, or 4% of the pro forma combined portfolio at that date. June 9, 2014 |
|
|
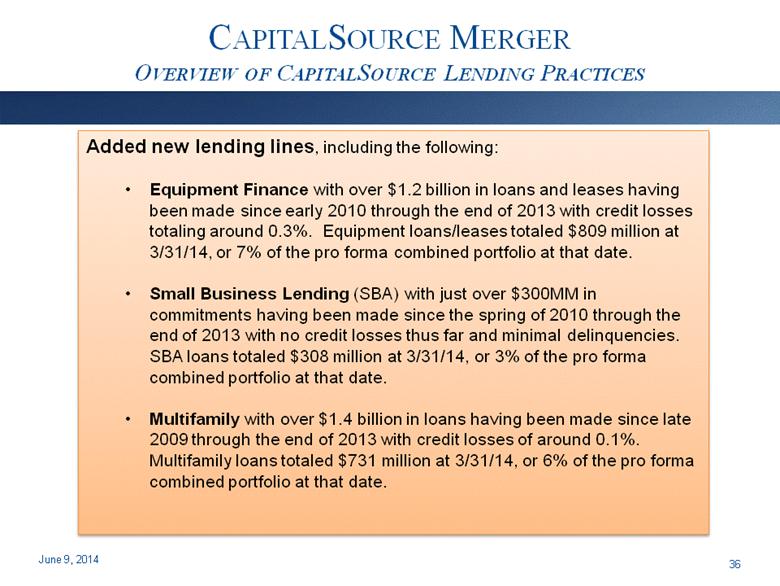
CAPITALSOURCE MERGER OVERVIEW OF CAPITALSOURCE LENDING PRACTICES 36 Added new lending lines, including the following: Equipment Finance with over $1.2 billion in loans and leases having been made since early 2010 through the end of 2013 with credit losses totaling around 0.3%. Equipment loans/leases totaled $809 million at 3/31/14, or 7% of the pro forma combined portfolio at that date. Small Business Lending (SBA) with just over $300MM in commitments having been made since the spring of 2010 through the end of 2013 with no credit losses thus far and minimal delinquencies. SBA loans totaled $308 million at 3/31/14, or 3% of the pro forma combined portfolio at that date. Multifamily with over $1.4 billion in loans having been made since late 2009 through the end of 2013 with credit losses of around 0.1%. Multifamily loans totaled $731 million at 3/31/14, or 6% of the pro forma combined portfolio at that date. June 9, 2014 |
|
|
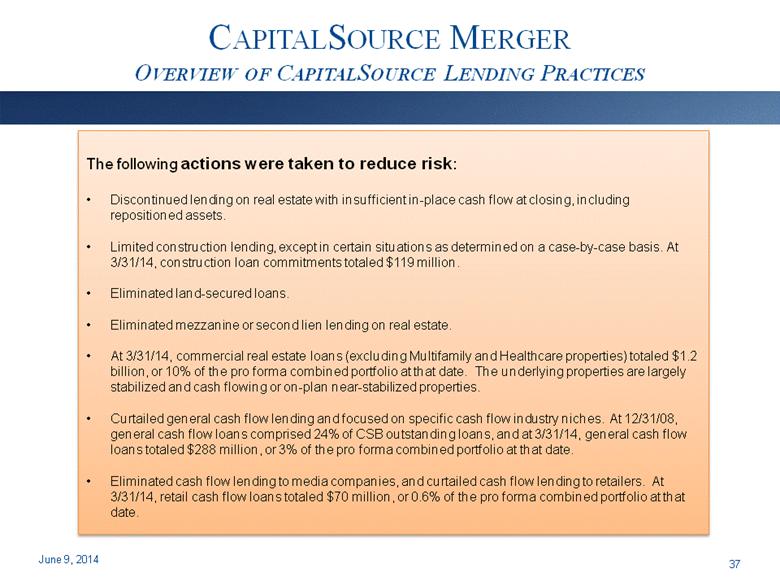
CAPITALSOURCE MERGER OVERVIEW OF CAPITALSOURCE LENDING PRACTICES 37 The following actions were taken to reduce risk: Discontinued lending on real estate with insufficient in-place cash flow at closing, including repositioned assets. Limited construction lending, except in certain situations as determined on a case-by-case basis. At 3/31/14, construction loan commitments totaled $119 million. Eliminated land-secured loans. Eliminated mezzanine or second lien lending on real estate. At 3/31/14, commercial real estate loans (excluding Multifamily and Healthcare properties) totaled $1.2 billion, or 10% of the pro forma combined portfolio at that date. The underlying properties are largely stabilized and cash flowing or on-plan near-stabilized properties. Curtailed general cash flow lending and focused on specific cash flow industry niches. At 12/31/08, general cash flow loans comprised 24% of CSB outstanding loans, and at 3/31/14, general cash flow loans totaled $288 million, or 3% of the pro forma combined portfolio at that date. Eliminated cash flow lending to media companies, and curtailed cash flow lending to retailers. At 3/31/14, retail cash flow loans totaled $70 million, or 0.6% of the pro forma combined portfolio at that date. June 9, 2014 |
|
|
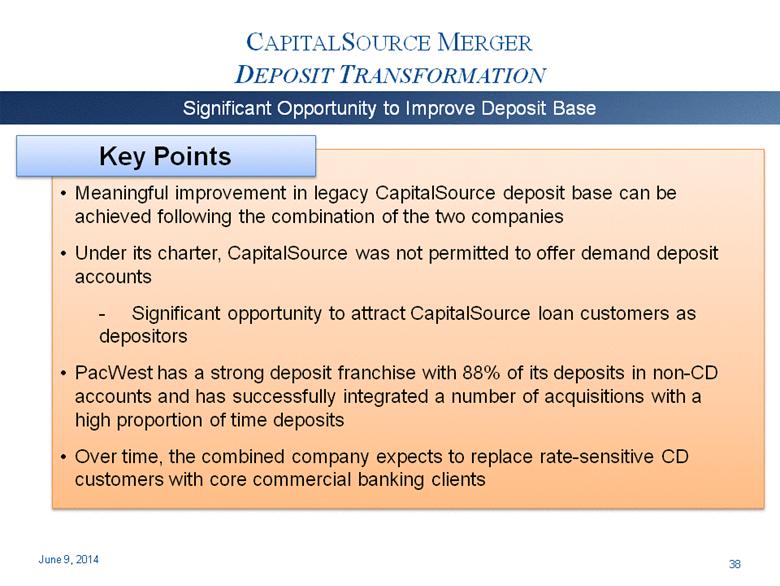
CAPITALSOURCE MERGER DEPOSIT TRANSFORMATION 38 Significant Opportunity to Improve Deposit Base Key Points Meaningful improvement in legacy CapitalSource deposit base can be achieved following the combination of the two companies Under its charter, CapitalSource was not permitted to offer demand deposit accounts - Significant opportunity to attract CapitalSource loan customers as depositors PacWest has a strong deposit franchise with 88% of its deposits in non-CD accounts and has successfully integrated a number of acquisitions with a high proportion of time deposits Over time, the combined company expects to replace rate-sensitive CD customers with core commercial banking clients June 9, 2014 |
|
|
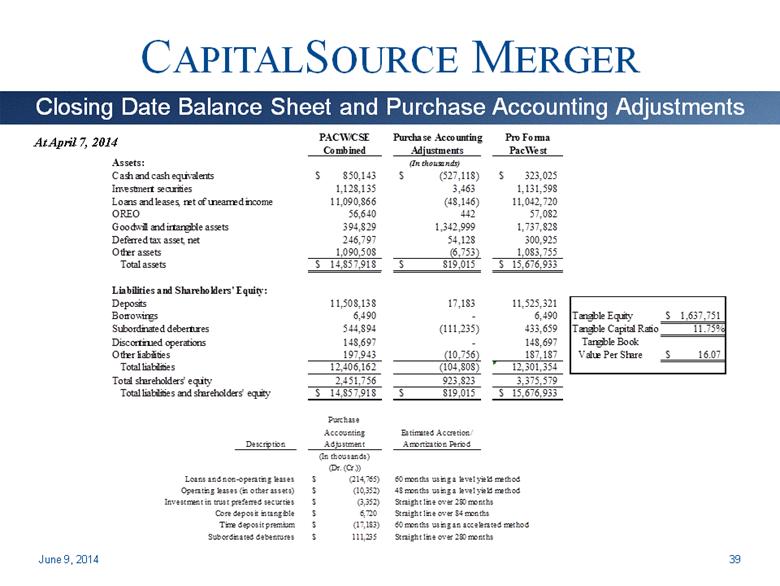
CAPITALSOURCE MERGER June 9, 2014 39 Closing Date Balance Sheet and Purchase Accounting Adjustments At April 7, 2014 PACW/CSE Purchase Accounting Pro Forma Combined Adjustments PacWest Assets: (In thousands) Cash and cash equivalents 850,143 $ (527,118) $ 323,025 $ Investment securities 1,128,135 3,463 1,131,598 Loans and leases, net of unearned income 11,090,866 (48,146) 11,042,720 OREO 56,640 442 57,082 Goodwill and intangible assets 394,829 1,342,999 1,737,828 Deferred tax asset, net 246,797 54,128 300,925 Other assets 1,090,508 (6,753) 1,083,755 Total assets 14,857,918 $ 819,015 $ 15,676,933 $ Liabilities and Shareholders' Equity: Deposits 11,508,138 17,183 11,525,321 Borrowings 6,490 - 6,490 Tangible Equity 1,637,751 $ Subordinated debentures 544,894 (111,235) 433,659 Tangible Capital Ratio 11.75% Discontinued operations 148,697 - 148,697 Other liabilities 197,943 (10,756) 187,187 16.07 $ Total liabilities 12,406,162 (104,808) 12,301,354 Total shareholders' equity 2,451,756 923,823 3,375,579 Total liabilities and shareholders' equity 14,857,918 $ 819,015 $ 15,676,933 $ Purchase Accounting Estimated Accretion/ Description Adjustment Amortization Period (In thousands) (Dr. (Cr.)) Loans and non-operating leases (214,765) $ 60 months using a level yield method Operating leases (in other assets) (10,352) $ 48 months using a level yield method Investment in trust preferred securties (3,352) $ Straight line over 280 months Core deposit intangible 6,720 $ Straight line over 84 months Time deposit premium (17,183) $ 60 months using an accelerated method Subordinated debentures 111,235 $ Straight line over 280 months Tangible Book Value Per Share |
|
|
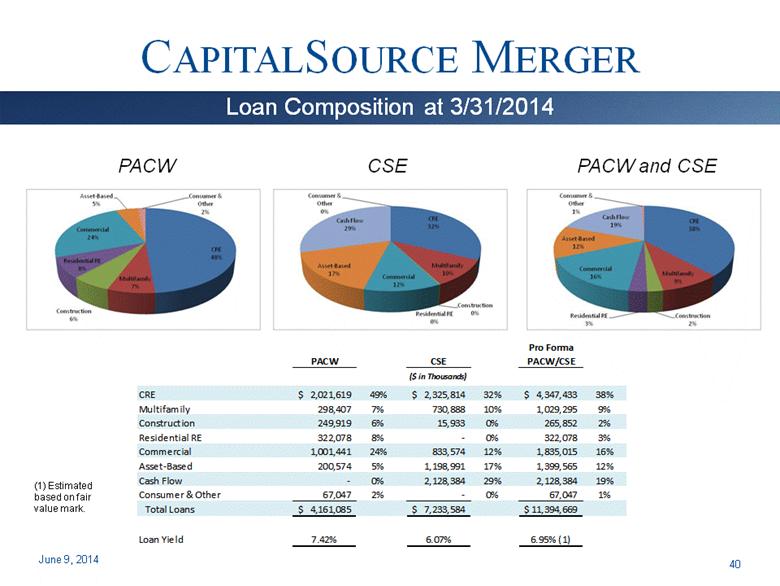
CAPITALSOURCE MERGER June 9, 2014 40 Loan Composition at 3/31/2014 PACW CSE PACW and CSE (1) Estimated based on fair value mark. Pro Forma PACW CSE PACW/CSE ($ in Thousands) CRE 2,021,619 $ 49% 2,325,814 $ 32% 4,347,433 $ 38% Multifamily 298,407 7% 730,888 10% 1,029,295 9% Construction 249,919 6% 15,933 0% 265,852 2% Residential RE 322,078 8% - 0% 322,078 3% Commercial 1,001,441 24% 833,574 12% 1,835,015 16% Asset-Based 200,574 5% 1,198,991 17% 1,399,565 12% Cash Flow - 0% 2,128,384 29% 2,128,384 19% Consumer & Other 67,047 2% - 0% 67,047 1% Total Loans 4,161,085 $ 7,233,584 $ 11,394,669 $ Loan Yield 7.42% 6.07% 6.95% (1) |
|
|
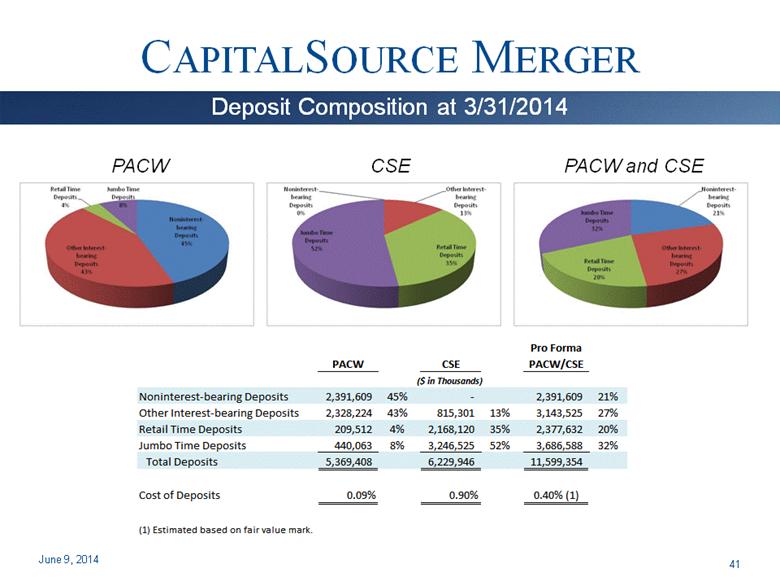
CAPITALSOURCE MERGER June 9, 2014 41 Deposit Composition at 3/31/2014 PACW CSE PACW and CSE Pro Forma PACW CSE PACW/CSE ($ in Thousands) Noninterest-bearing Deposits 2,391,609 45% - 2,391,609 21% Other Interest-bearing Deposits 2,328,224 43% 815,301 13% 3,143,525 27% Retail Time Deposits 209,512 4% 2,168,120 35% 2,377,632 20% Jumbo Time Deposits 440,063 8% 3,246,525 52% 3,686,588 32% Total Deposits 5,369,408 6,229,946 11,599,354 Cost of Deposits 0.09% 0.90% 0.40% (1) (1) Estimated based on fair value mark. |
|
|
NON-GAAP MEASUREMENTS The Company uses certain non-GAAP financial measures to provide meaningful supplemental information regarding the Company’s operational performance and to enhance investors’ overall understanding of such financial performance. These non-GAAP financial measures are presented for supplemental informational purposes only for understanding the Company’s operating results and should not be considered a substitute for financial information presented in accordance with GAAP. These non-GAAP financial measures presented by the Company may be different from non-GAAP financial measures used by other companies. The table on the following slide presents a reconciliation of the non-GAAP financial measurements to the GAAP financial measurements and certain key performance ratios. June 9, 2014 Overview 42 |
|
|
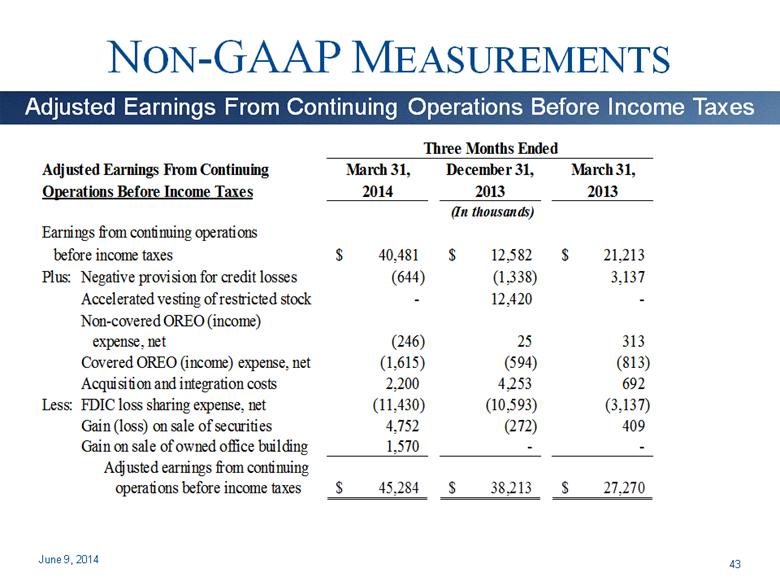
NON-GAAP MEASUREMENTS June 9, 2014 Adjusted Earnings From Continuing Operations Before Income Taxes 43 Adjusted Earnings From Continuing March 31, December 31, March 31, Operations Before Income Taxes 2014 2013 2013 (In thousands) Earnings from continuing operations before income taxes 40,481 $ 12,582 $ 21,213 $ Plus: Negative provision for credit losses (644) (1,338) 3,137 Accelerated vesting of restricted stock - 12,420 - Non-covered OREO (income) expense, net (246) 25 313 Covered OREO (income) expense, net (1,615) (594) (813) Acquisition and integration costs 2,200 4,253 692 Less: FDIC loss sharing expense, net (11,430) (10,593) (3,137) Gain (loss) on sale of securities 4,752 (272) 409 Gain on sale of owned office building 1,570 - - Adjusted earnings from continuing operations before income taxes 45,284 $ 38,213 $ 27,270 $ Three Months Ended |
|
|
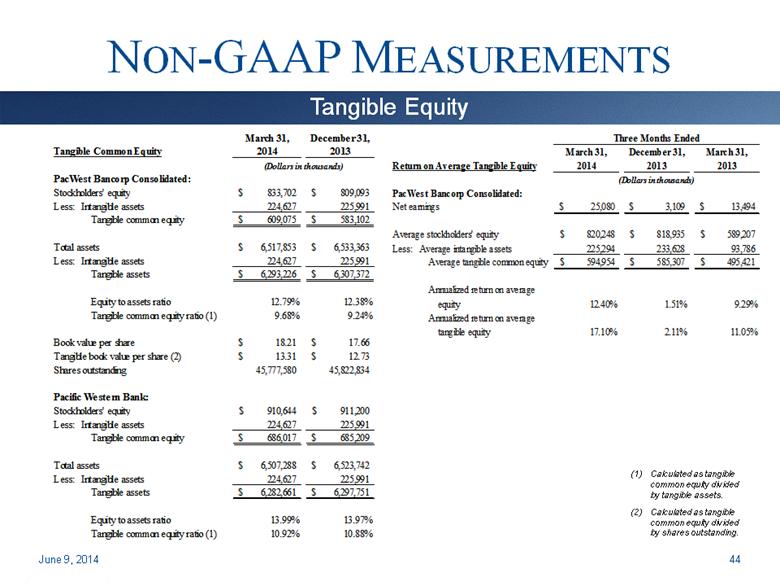
NON-GAAP MEASUREMENTS June 9, 2014 Tangible Equity Calculated as tangible common equity divided by tangible assets. Calculated as tangible common equity divided by shares outstanding. 44 March 31, December 31, March 31, Return on Average Tangible Equity 2014 2013 2013 (Dollars in thousands) PacWest Bancorp Consolidated: Net earnings 25,080 $ 3,109 $ 13,494 $ Average stockholders' equity 820,248 $ 818,935 $ 589,207 $ Less: Average intangible assets 225,294 233,628 93,786 Average tangible common equity 594,954 $ 585,307 $ 495,421 $ Annualized return on average equity 12.40% 1.51% 9.29% Annualized return on average tangible equity 17.10% 2.11% 11.05% Three Months Ended March 31, December 31, Tangible Common Equity 2014 2013 (Dollars in thousands) PacWest Bancorp Consolidated: Stockholders' equity $833,702 $809,093 Less: Intangible assets 224,627 225,991 Tangible common equity $609,075 $583,102 Total assets $6,517,853 $6,533,363 Less: Intangible assets 224,627 225,991 Tangible assets $6,293,226 $6,307,372 Equity to assets ratio 12.79% 12.38% Tangible common equity ratio (1) 9.68% 9.24% Book value per share $18.21 $17.66 Tangible book value per share (2) $13.31 $12.73 Shares outstanding 45,777,580 45,822,834 Pacific Western Bank: Stockholders' equity $910,644 $911,200 Less: Intangible assets 224,627 225,991 Tangible common equity $686,017 $685,209 Total assets $6,507,288 $6,523,742 Less: Intangible assets 224,627 225,991 Tangible assets $6,282,661 $6,297,751 Equity to assets ratio 13.99% 13.97% Tangible common equity ratio (1) 10.92% 10.88% |
|
|
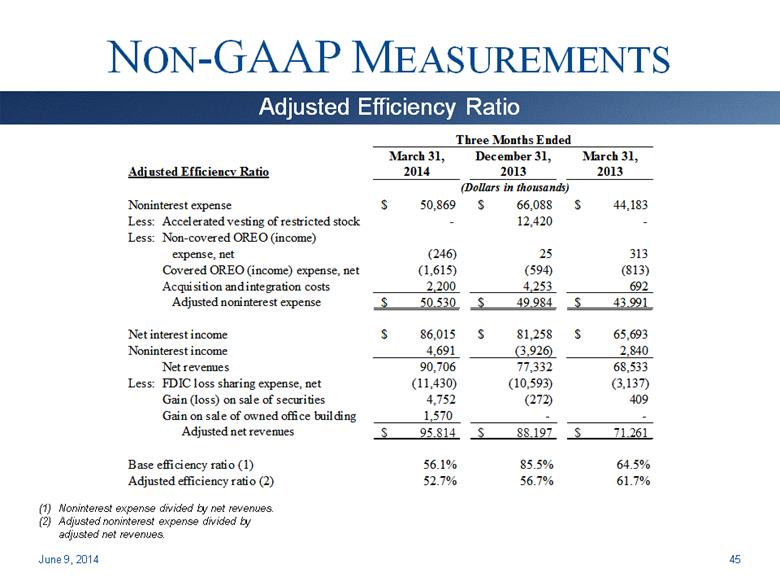
NON-GAAP MEASUREMENTS June 9, 2014 Adjusted Efficiency Ratio Noninterest expense divided by net revenues. Adjusted noninterest expense divided by adjusted net revenues. 45 March 31, December 31, March 31, Adjusted Efficiency Ratio 2014 2013 2013 (Dollars in thousands) Noninterest expense $ 50,869 $ 66,088 $ 44,183 Less: Accelerated vesting of restricted stock - 12,420 - Less: Non-covered OREO (income) expense, net (246) 25 313 Covered OREO (income) expense, net (1,615) (594) (813) Acquisition and integration costs 2,200 4,253 692 Adjusted noninterest expense $ 50,530 $ 49,984 $ 43,991 Net interest income $ 86,015 $ 81,258 $ 65,693 Noninterest income 4,691 (3,926) 2,840 Net revenues 90,706 77,332 68,533 Less: FDIC loss sharing expense, net (11,430) (10,593) (3,137) Gain (loss) on sale of securities 4,752 (272) 409 Gain on sale of owned office building 1,570 - - Adjusted net revenues $ 95,814 $ 88,197 $ 71,261 Base efficiency ratio (1) 56.1% 85.5% 64.5% Adjusted efficiency ratio (2) 52.7% 56.7% 61.7% Three Months Ended |