Attached files
| file | filename |
|---|---|
| 8-K - 8-K - CMS ENERGY CORP | a14-14924_18k.htm |
Exhibit 99.1
|
|
Investor Meetings June 9-11, 2014 |
|
|
Baird 2014 Zurich Symposium June 12, 2014 |

|
; |
This presentation is made as of the date hereof and contains “forward-looking statements” as defined in Rule 3b-6 of the Securities Exchange Act of 1934, Rule 175 of the Securities Act of 1933, and relevant legal decisions. The forward-looking statements are subject to risks and uncertainties. All forward-looking statements should be considered in the context of the risk and other factors detailed from time to time in CMS Energy’s and Consumers Energy’s Securities and Exchange Commission filings. Forward-looking statements should be read in conjunction with “FORWARD-LOOKING STATEMENTS AND INFORMATION” and “RISK FACTORS” sections of CMS Energy’s and Consumers Energy’s Form 10-K for the year ended December 31, 2013 and as updated in subsequent 10-Qs. CMS Energy’s and Consumers Energy’s “FORWARD-LOOKING STATEMENTS AND INFORMATION” and “RISK FACTORS” sections are incorporated herein by reference and discuss important factors that could cause CMS Energy’s and Consumers Energy’s results to differ materially from those anticipated in such statements. CMS Energy and Consumers Energy undertake no obligation to update any of the information presented herein to reflect facts, events or circumstances after the date hereof. The presentation also includes non-GAAP measures when describing CMS Energy’s results of operations and financial performance. A reconciliation of each of these measures to the most directly comparable GAAP measure is included in the appendix and posted on our website at www.cmsenergy.com. CMS Energy provides historical financial results on both a reported (Generally Accepted Accounting Principles) and adjusted (non-GAAP) basis and provides forward-looking guidance on an adjusted basis. Management views adjusted earnings as a key measure of the company’s present operating financial performance, unaffected by discontinued operations, asset sales, impairments, regulatory items from prior years, or other items. These items have the potential to impact, favorably or unfavorably, the company's reported earnings in future periods. Because the company is not able to estimate the impact of these matters, the company is not providing a reconciliation to the comparable future period reported earnings. 1 |
|
|
Electric Utility 1.8 million electric customers 8,600 MW of capacity Gas Utility 1.7 million gas customers 312 TBtu gas storage (3rd biggest in US) Consumers Energy . . . . Territory . . . . one of largest investors and employers in Michigan. Lake Winds Energy Park 2 Fourth largest combination utility in the United States! Overview Fourth largest combination utility in the United States! Premium Regulatory Environment Jackson Cross Winds Energy Park |

|
|
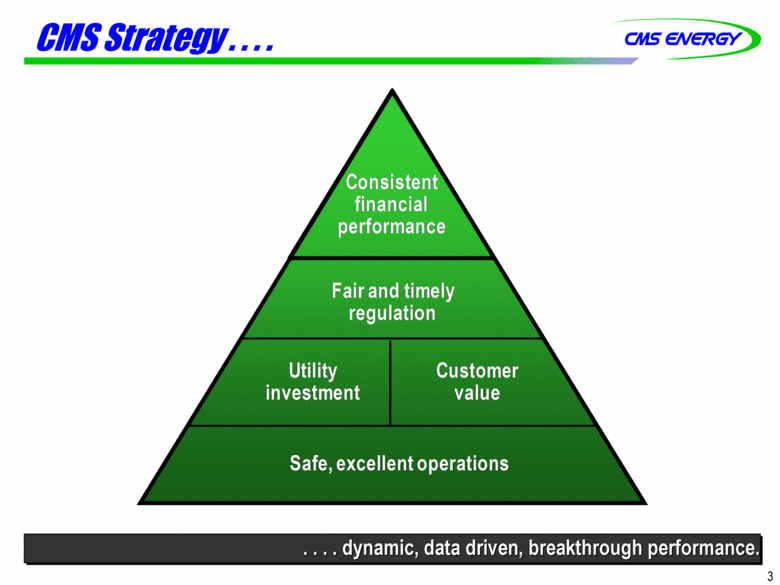
CMS Strategy . . . . . . . . dynamic, data driven, breakthrough performance. 3 Consistent financial performance Fair and timely regulation Utility investment Customer value Safe, excellent operations |
|
|
Why CMS Energy CMS Energy MODEL . . . . Investment Ten year - $15 billion Small, bite size projects None “Bet The Company” Self-funded Upside Catalysts A. Capex >$15 billion B. PPA’s expire = 2,000 MW C. Credit ratings D. Sales E. Capacity price increases F. Continuous cost reductions Self-Imposed Limits Sustainable base rates < 2% inflation Investment “Needed Not Wanted” RESULTS Consistent Predictable . . . . benefits customers AND shareowners. 4 |

|
|
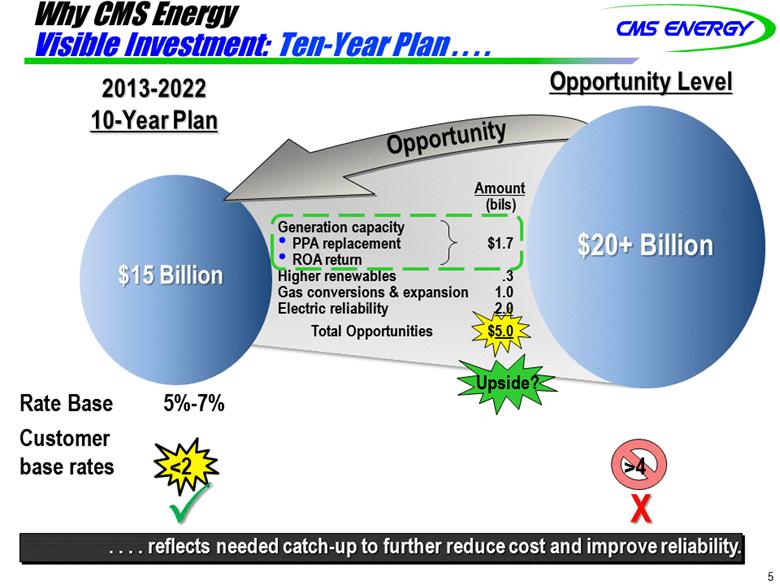
Why CMS Energy Visible Investment: Ten-Year Plan . . . . 5 . . . . reflects needed catch-up to further reduce cost and improve reliability. 2013-2022 10-Year Plan Opportunity Level $15 Billion $15 Billion $20+ Billion Opportunity Amount (bils) Generation capacity PPA replacement $1.7 ROA return Higher renewables .3 Gas conversions & expansion 1.0 Electric reliability 2.0 Total Opportunities $5.0 X Rate Base 5%-7% Customer base rates <2 >4 Upside? |
|
|
Why CMS Energy Self-Initiated Cost Control . . . . 6 . . . . creates more headroom for capital investment. Average Annual O&M Change +6% Peers -2% CMS Flat -2% Average -3% Plan Conservatively Upside? _ _ _ _ _ a -8% Before reinvestment Peers +2% Peers CMS CMS CMS CMS |

|
|
Why CMS Energy Constructive Regulation . . . . 7 . . . . strong law on the books supported by a quality commission. Tier 1 State Ranking Barclays Research Michigan John Quackenbush (R), Chairman Term Ends: July 2, 2017 Greg White (I) Term Ends: July 2, 2015 Sally Talberg (I) Term Ends: July 2, 2019 Commission |

|
|
Why CMS Energy Mindset . . . . . . . . drives consistent “real” growth. $0.81 _ _ _ _ _ Adjusted EPS (non-GAAP) excluding MTM in 2004-2006 b $1.25 excluding discontinued Exeter operations and accounting changes related to convertible debt and restricted stock Int’l Sale b 10-Year Actual 7% CAGR $1.78 $1.74 $1.08 Dividend Payout 0% 25% 30% 40% 49% 58% 62% 62% 60%-70% 32% 27% 14% 39% 80% 6% Peers 4% 6% 8 5% - 7% 5% - 7% $1.66 |

|
|
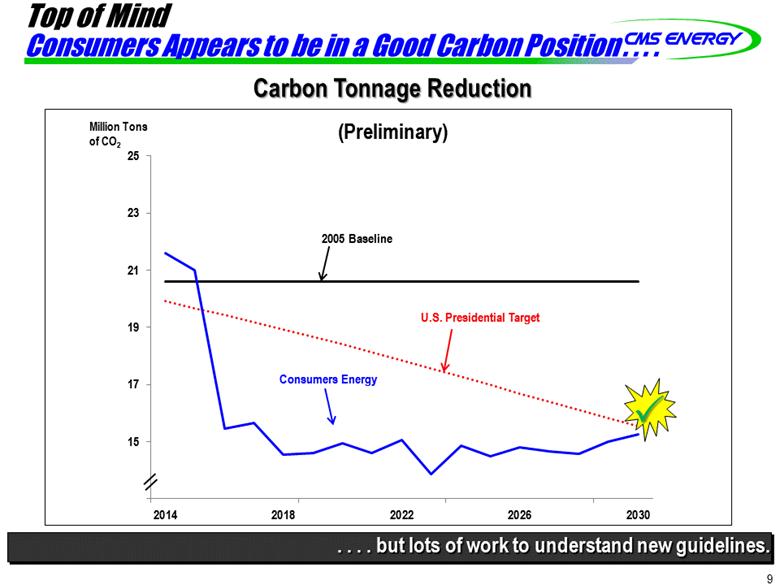
Top of Mind Consumers Appears to be in a Good Carbon Position . . . . 9 . . . . but lots of work to understand new guidelines. Carbon Tonnage Reduction (Preliminary) Million Tons of CO2 U.S. Presidential Target Consumers Energy |
|
|
Top of Mind Energy Law Improvements . . . . 10 . . . . builds on 2008 Law. Outlook Regulatory Support (from the right) Michigan Governor Rick Snyder MPSC Chairman John Quackenbush Michigan Energy Office Director Steve Bakkal Industrial class Energy-intensive $150 million customer opportunity 780 MW capacity Governor’s Race Non-energy campaign issues New wind gas generation Buy, build, convert Rate Design Elections Near-term catalysts next 12 to 18 months “ROA” Fix New Capacity Competitiveness |

|
|
Top of Mind Michigan Governor’s Race . . . . 11 . . . . focus on non-energy issues. Mark Schauer Democrat, Challenger Rick Snyder Republican, Incumbent Campaign Issues Education Jobs Roads Detroit On Energy On ROA 35% 45% As Senate Democratic Leader, Mark played a key role in the successful passage of the 2008 Energy Law. “Choice creates a lot of challenges and problems, essentially trying to arbitrage markets.” -Governor Rick Snyder *Polling data from most recent poll, Detroit News, 5/20-5/22 |

|
|
$? $49M Top of Mind Gas Customer Bills . . . . . . . . down 10% over the last three years! 12 Settled $16M 2012 2013 2014 2015 $0 Investment $0 Stay-out O&M bills down 10%! -- |

|
|
Top of Mind Electric Residential Bills Competitive . . . . 13 O&M Tax Cross Winds Self-initiated Rate design, regulatory ROA Policy, Legislator Consumers higher than Midwest peer avg Below Midwest peers . . . . industrial rates improving through cooperative steps. Electric Rate Case Avoided Industrial Electric Rate (vs Midwest Average) |

|
|
CMS Energy MODEL . . . . Investment Ten year - $15 billion Small, bite size projects None “Bet The Company” Self-funded Upside Catalysts A. Capex >$15 billion B. PPA’s expire = 2,000 MW C. Credit ratings D. Sales E. Capacity price increases F. Continuous cost reductions Self-Imposed Limits Sustainable base rates < 2% inflation Investment “Needed Not Wanted” RESULTS Consistent Predictable . . . . benefits customers AND shareowners. 14 |

|
|
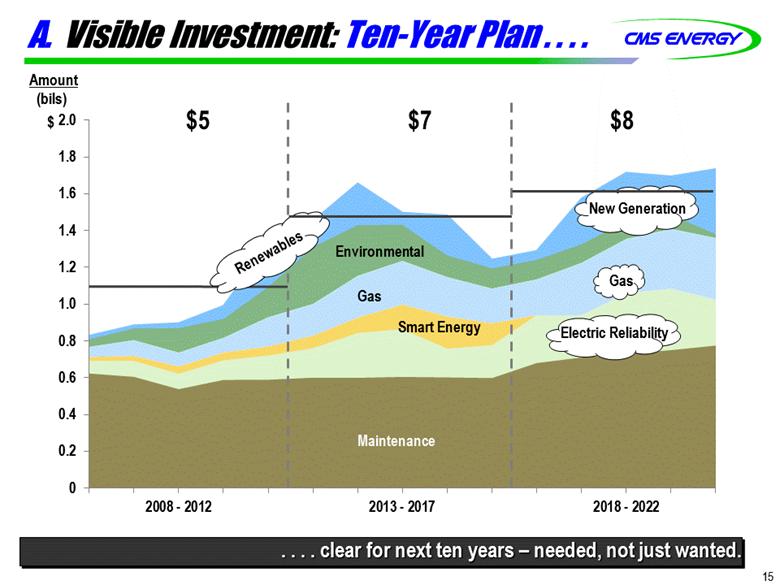
A. Visible Investment: Ten-Year Plan . . . . . . . . clear for next ten years – needed, not just wanted. Amount (bils) $ Environmental Gas Smart Energy Maintenance $5 $7 $8 New Generation Gas Electric Reliability 15 Renewables |
|
|
Visible Investment: Catch-Up . . . . 16 2013 Pct of Market Cap Cap Inv OCF Liquidity CMS 21% 20% 24% Peers 18 16 20 21% 20% 24% . . . . creates unique opportunity; with OCF already stronger than peers. Amount (billions) $1.8 CMS Peers _ _ _ _ _ Source: 10K; actual amounts through 2012 smoothed for illustration $1.5 Restructuring Catch Up |

|
|
Visible Investment: Customer-Driven . . . . Clean Power $2.3 Billion Reliability $4.2 Billion . . . . ten-year plan small and incremental with no big bets. Renewable energy Jackson gas plant Gas storage Propane switching Gas transmission Gas distribution Electric reliability Consumers Smart Energy Electric distribution Capacity $1.6 Billion Infrastructure $5.4 Billion Environmental New gas capacity Ludington Pumped Storage 17 |

|
|
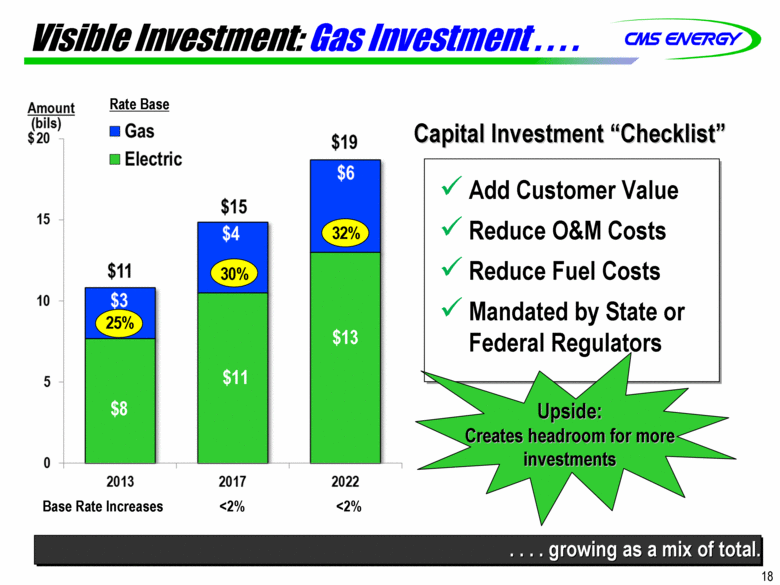
Visible Investment: Gas Investment . . . . 18 . . . . growing as a mix of total. Base Rate Increases <2% <2% Capital Investment “Checklist” Add Customer Value Reduce O&M Costs Reduce Fuel Costs Mandated by State or Federal Regulators $8 $11 $13 Upside: Creates headroom for more investments Rate Base 25% 32% 30% |
|
|
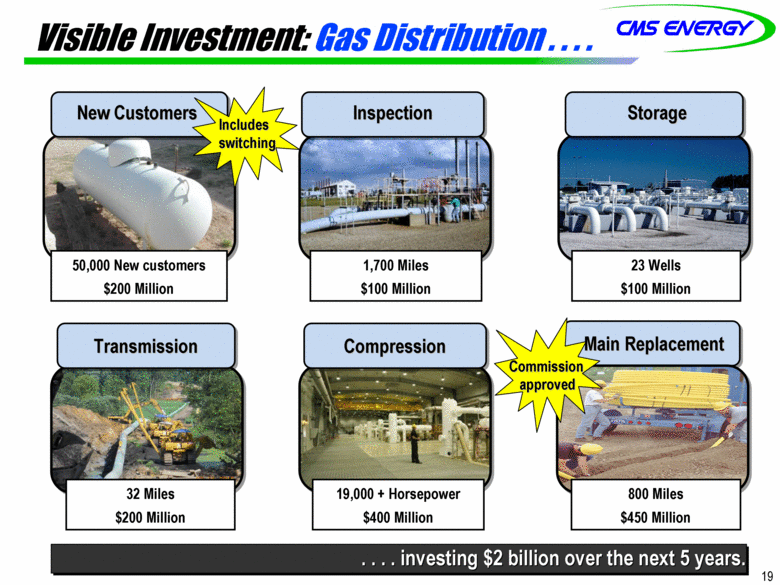
Visible Investment: Gas Distribution . . . . 19 . . . . investing $2 billion over the next 5 years. New Customers Inspection Storage Compression Transmission 50,000 New customers $200 Million 1,700 Miles $100 Million 23 Wells $100 Million 800 Miles $450 Million 19,000 + Horsepower $400 Million 32 Miles $200 Million Includes switching Commission approved Main Replacement |
|
|
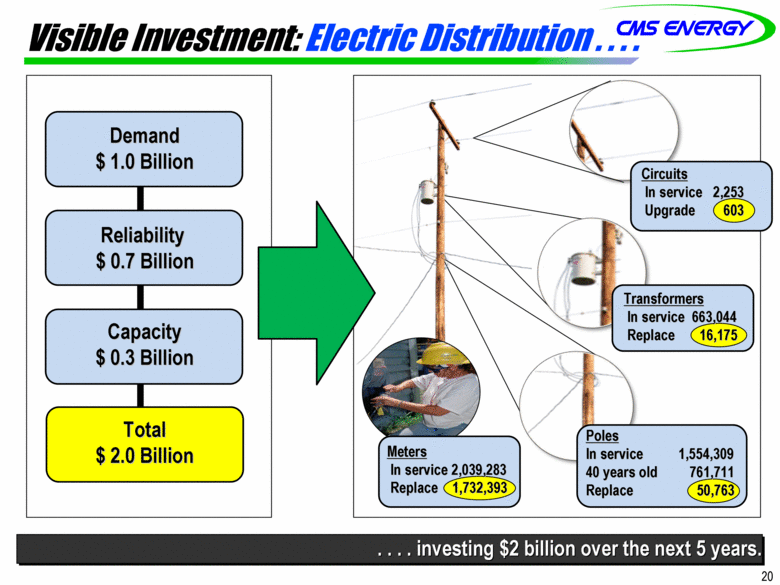
20 Demand $ 1.0 Billion . . . . investing $2 billion over the next 5 years. Visible Investment: Electric Distribution . . . . Reliability $ 0.7 Billion Capacity $ 0.3 Billion Total $ 2.0 Billion Circuits In service 2,253 Upgrade 603 Transformers In service 663,044 Replace 16,175 Poles In service 1,554,309 40 years old 761,711 Replace 50,763 Meters In service 2,039,283 Replace 1,732,393 |
|
|
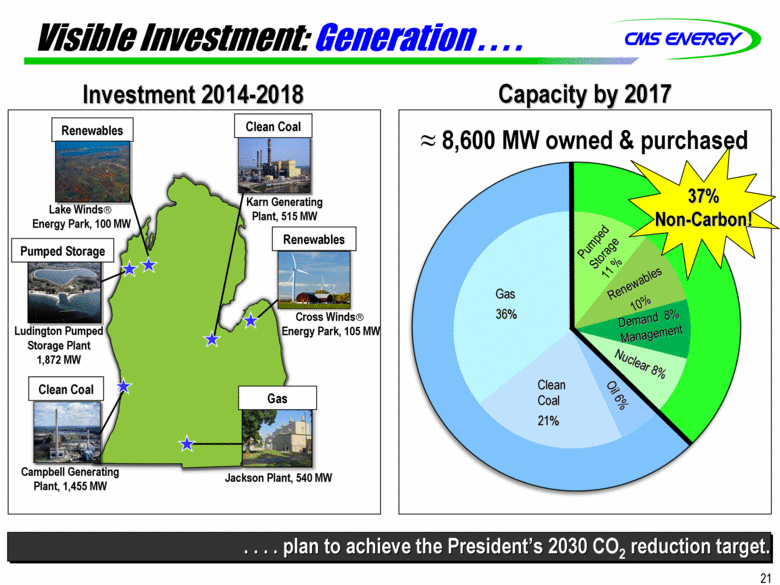
Visible Investment: Generation . . . . . . . . plan to achieve the President’s 2030 CO2 reduction target. Cross Winds Energy Park, 105 MW Jackson Plant, 540 MW Ludington Pumped Storage Plant 1,872 MW Campbell Generating Plant, 1,455 MW Karn Generating Plant, 515 MW 21 Investment 2014-2018 Capacity by 2017 Pumped Storage Clean Coal Renewables Gas Clean Coal Gas 36% Clean Coal 21% Pumped Storage 11 % Renewables 10% Demand 8% Management Nuclear 8% Oil 6% 37% Non-Carbon! Renewables Lake Winds Energy Park, 100 MW 8,600 MW owned & purchased |
|
|
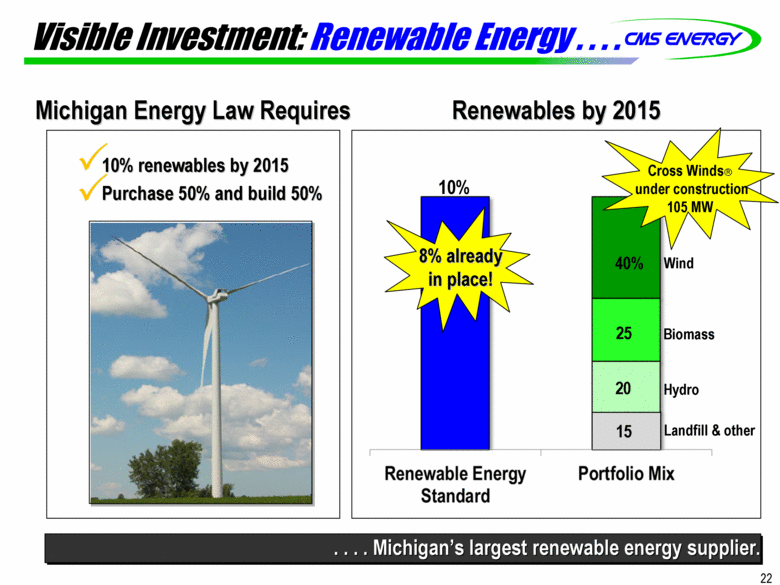
Visible Investment: Renewable Energy . . . . 22 10% 40% 25 15 Biomass Landfill & other 10% renewables by 2015 Purchase 50% and build 50% Renewables by 2015 8% already in place! . . . . Michigan’s largest renewable energy supplier. Michigan Energy Law Requires Hydro Cross Winds under construction 105 MW 20 Wind |
|
|
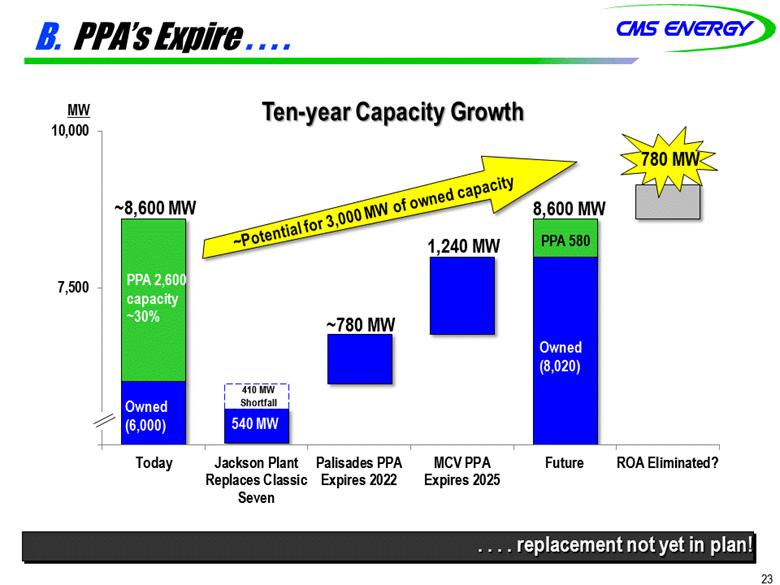
B. PPA’s Expire . . . . 23 . . . . replacement not yet in plan! Ten-year Capacity Growth ~780 MW 1,240 MW ~Potential for 3,000 MW of owned capacity MW PPA 2,600 capacity ~30% ~8,600 MW 540 MW 410 MW Shortfall Owned (6,000) 780 MW 8,600 MW Owned (8,020) PPA 580 |
|
|
New Capacity Opportunities . . . . Replace PPA With New Build Full Year Impact Customer Bill Investor (EPS) (mils) 1,000 MW of PPA’s expire - $325 0 ¢ Add 1,000 MW owned capacity + 325 + 5 Impact Flat Incremental Step-up Not in Plan 2 points Build - Thetford Expand - Zeeland Buy - ? LT PPA 24 . . . . upside not in plan. + 5¢ Upside: Capacity Options |

|
|
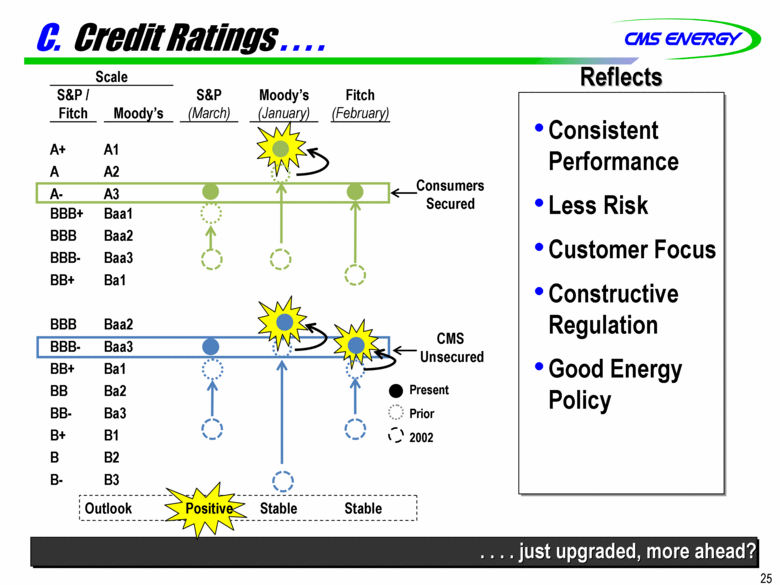
C. Credit Ratings . . . . . . . . just upgraded, more ahead? Consistent Performance Less Risk Customer Focus Constructive Regulation Good Energy Policy Reflects Present Prior 2002 Scale S&P / Fitch Moody’s S&P (March) Moody’s (January) Fitch (February) A+ A1 A A2 Consumers Secured A- A3 BBB+ Baa1 BBB Baa2 BBB- Baa3 BB+ Ba1 CMS Unsecured BBB Baa2 BBB- Baa3 BB+ Ba1 BB Ba2 BB- Ba3 B+ B1 B B2 B- B3 Outlook Positive Stable Stable 25 |
|
|
D. Sales Growth . . . . . . . . even after Energy Efficiency. Annual Electric Salesa Economic Indicators Annual Industrial Sales Grand Rapids Michigan U.S Building Permits* + 36% +17% +13% GDP (real) 2010 thru 2012 14 11 7 Population 2010 Census thru July 2013 3 0 2 Unemployment April 2014 5.1% 7.4% 6.3% *Annualized numbers May thru April _ _ _ _ _ a Weather normalized vs prior year b Negative with “E1” 26 Growth Upside? Upside? |

|
|
Michigan’s Economic Turnaround . . . . . . . . continues to improve, GDP 5th best in the nation. 27 2007 2008 2009 2010 2011 2012 2013 2014 Jobs in Millions + 250,000 Jobs Structural Improvements Jobs Recovery Unemployment dropped nearly 50%! Source: Business Leaders for Michigan |

|
|
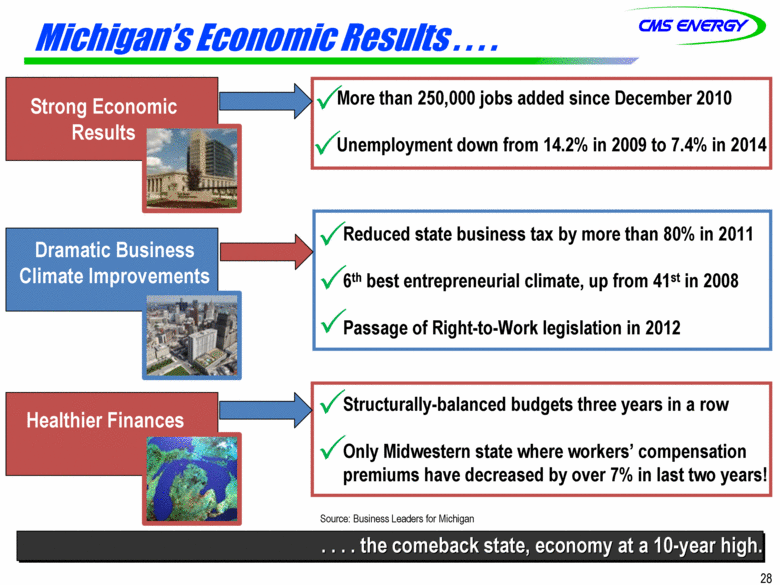
Michigan’s Economic Results . . . . 28 . . . . the comeback state, economy at a 10-year high. Strong Economic Results Dramatic Business Climate Improvements Healthier Finances More than 250,000 jobs added since December 2010 Unemployment down from 14.2% in 2009 to 7.4% in 2014 Reduced state business tax by more than 80% in 2011 6th best entrepreneurial climate, up from 41st in 2008 Passage of Right-to-Work legislation in 2012 Structurally-balanced budgets three years in a row Only Midwestern state where workers’ compensation premiums have decreased by over 7% in last two years! Source: Business Leaders for Michigan |
|
|
Michigan Economy Performance . . . . . . . . among the best in the nation. Gross Domestic Product – 2010 through 2012 Source: U.S. Department of Commerce – bea.gov, real GDP 2005 chained dollars, 2012 advance and 2009 – 2011 revised, 6/6/13 Highest quintile Fourth quintile Third quintile Second quintile Lowest quintile 11% WA 8.1 OR 13.8 CA 5.0 NV 2.9 MT 6.7 ID 2.1 WY (3.5) UT 8.7 AZ 4.2 NM 0.7 CO 6.2 ND 31.0 SD 4.7 NE 7.4 KS 7.3 OK 4.7 TX 13.0 MN 8.2 IA 6.6 MO 4.3 AR 4.6 LA 4.6 WI 5.9 IL 5.9 MS 3.2 AL 5.0 TN 8.4 MI 11.0 IN 12.3 OH 7.3 KY 8.6 VA 6.1 WV 8.7 PA 5.9 MD 7.5 DE 1.4 NJ 3.1 NY 6.6 CT 1.0 RI 2.4 NH 6.1 MA 7.9 ME 2.7 DC 5.7 HI 6.9 AK 1.2 FL 3.6 GA 5.7 SC 7.6 NC 5.6 VT 8.2 U.S. Total = 6.7% 5th Best 29 |

|
|
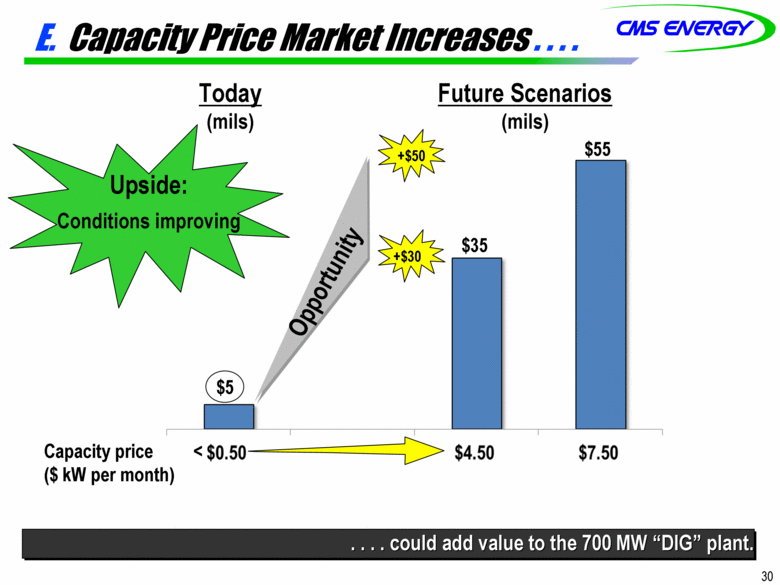
E. Capacity Price Market Increases . . . . 30 . . . . could add value to the 700 MW “DIG” plant. Capacity price < ($ kW per month) Today (mils) Future Scenarios (mils) $5 +$30 $55 $35 +$50 Opportunity Upside: Conditions improving |
|
|
F. Continuous O&M Cost Reductions . . . . 31 . . . . holds down rates and allows better system reliability. _ _ _ _ _ a O&M Change excluding major storms Amount (mils) $ |

|
|
Continuous Cost Reduction . . . . . . . . a way of life at CMS. Past Progress $100k Each $60k Each Future Examples Fuel Mix Benefits MW Employees 2016 Retire Coal - 900 - 300 2016 Add GCC + 540 + 20 Total -360 - 280 Future Savings (mils) $25 People Productivity = $64 million Headcount Future Annual Savings (mils) 2002-2012 Actions completed $25 2013 EGWP, OPEB & other 50 Future savings $75 Fuel and Benefits $100 32 |

|
|
Key Takeaways . . . . 33 . . . . distinguish CMS favorably with customers and owners. _ _ _ _ _ a Adjusted EPS (non-GAAP) excluding MTM in 2004-2006 EPS a “Real” Growth (No “Resets”) $2.00 Core Fundamentals 10-Year Visible Investment Among Best In Cost Control Conservative Planning Supportive Regulatory Catalysts Upside Target 5% - 7% Actual = 7% +11% Target 6% - 8% Actual EPS = 8% +7% +12% +12% +4% +7% +7% +7% +8% 7% 5% 7% 5% |

|
|
Appendix |
|
|
Capacity Diversity . . . . 35 . . . . evolving to cleaner generation while becoming more cost competitive. 2005 2017 2013 |

|
|
36 Generation Strategy: New Supply Sources . . . . . . . . combined cycle gas is the most attractive new source of supply. Levelized cost of new build ¢/kWh Gas price= $3.00 $4.50 $6.00 W/ tax credit W/o tax credit W/ emission controls Today $3.00 per watt 5¢ 6¢ 7¢ 6¢ 9¢ 10¢ 12¢ 22¢ 8¢ Back-up 11¢ Back-up 6¢ Wind Combined Cycle Gas Plant Residential Solar 15¢ Future $2.00 per watt? a b c Cost of Zeeland/Jackson plant: 5¢ “Big 5” coal units: 7¢ Palisades PPA: 5.5¢ a b c |

|
|
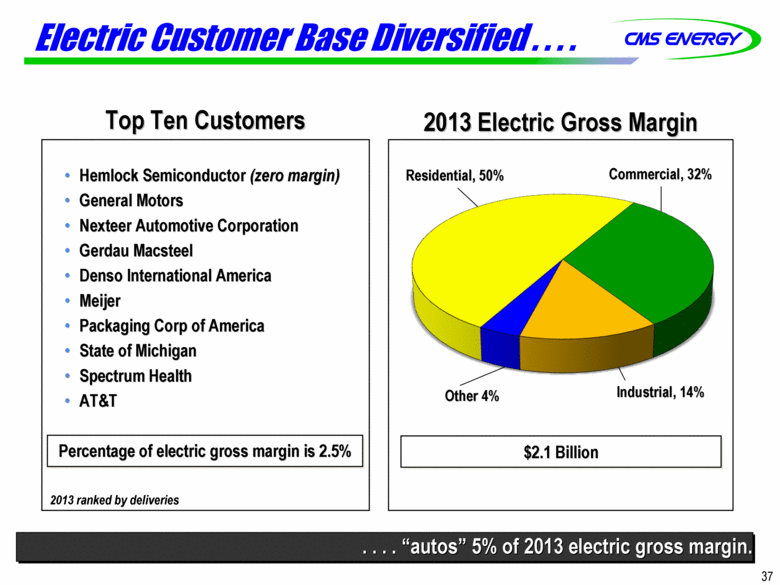
Electric Customer Base Diversified . . . . 37 . . . . “autos” 5% of 2013 electric gross margin. Hemlock Semiconductor (zero margin) General Motors Nexteer Automotive Corporation Gerdau Macsteel Denso International America Meijer Packaging Corp of America State of Michigan Spectrum Health AT&T Top Ten Customers $2.1 Billion 2013 Electric Gross Margin Residential, 50% Commercial, 32% Industrial, 14% Percentage of electric gross margin is 2.5% Other 4% 2013 ranked by deliveries |
|
|
Operating Cash Flow Growth . . . . Amount (bils) $ Investment Cash flow before dividend _ _ _ _ _ a Non-GAAP NOLs & Credits $0.7 $0.6 $0.4 $0.5 $0.4 $0.2 $0.1 Gross operating cash flowa up $0.1 billion per year . . . . self-funds investment and strategy. Up $0.5 Billion $2.1 Interest Working capital and taxes $1.6 $1.9 $2.0 $1.7 $1.8 $1.45 $2.2 $1.4 $1.5 38 |

|
|
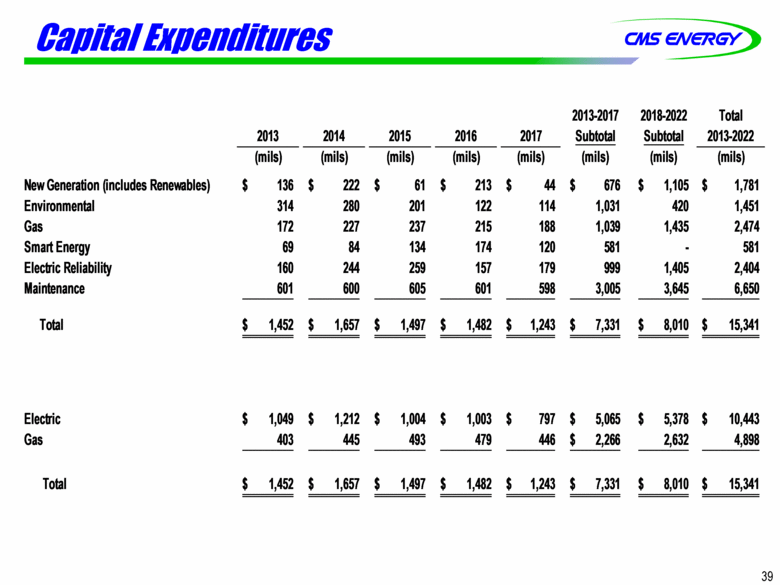
Capital Expenditures 39 (mils) |
|
|
GAAP Reconciliation |
|
|
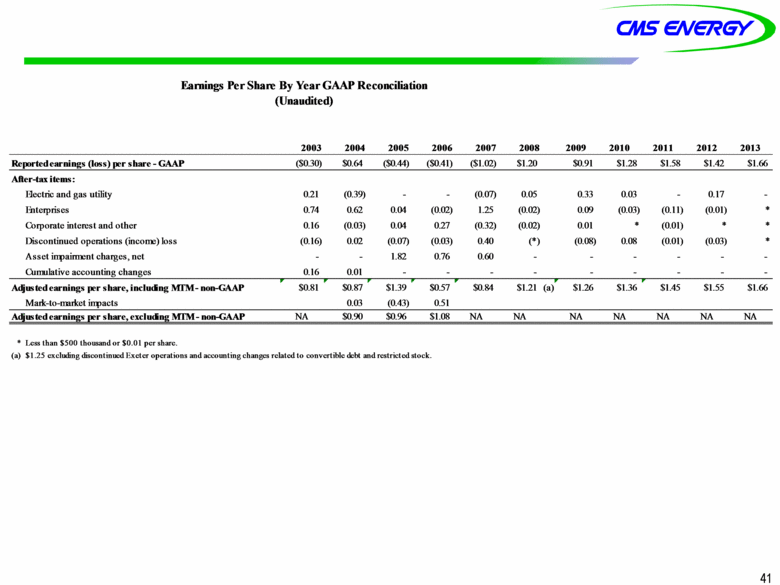
41 2003 2004 2005 2006 2007 2008 2009 2010 2011 2012 2013 Reported earnings (loss) per share - GAAP ($0.30) $0.64 ($0.44) ($0.41) ($1.02) $1.20 $0.91 $1.28 $1.58 $1.42 $1.66 After-tax items: Electric and gas utility 0.21 (0.39) - - (0.07) 0.05 0.33 0.03 - 0.17 - Enterprises 0.74 0.62 0.04 (0.02) 1.25 (0.02) 0.09 (0.03) (0.11) (0.01) * Corporate interest and other 0.16 (0.03) 0.04 0.27 (0.32) (0.02) 0.01 * (0.01) * * Discontinued operations (income) loss (0.16) 0.02 (0.07) (0.03) 0.40 (*) (0.08) 0.08 (0.01) (0.03) * Asset impairment charges, net - - 1.82 0.76 0.60 - - - - - - Cumulative accounting changes 0.16 0.01 - - - - - - - - - Adjusted earnings per share, including MTM - non-GAAP $0.81 $0.87 $1.39 $0.57 $0.84 $1.21 (a) $1.26 $1.36 $1.45 $1.55 $1.66 Mark-to-market impacts 0.03 (0.43) 0.51 Adjusted earnings per share, excluding MTM - non-GAAP NA $0.90 $0.96 $1.08 NA NA NA NA NA NA NA * Less than $500 thousand or $0.01 per share. (a) $1.25 excluding discontinued Exeter operations and accounting changes related to convertible debt and restricted stock. Earnings Per Share By Year GAAP Reconciliation (Unaudited) |
|
|
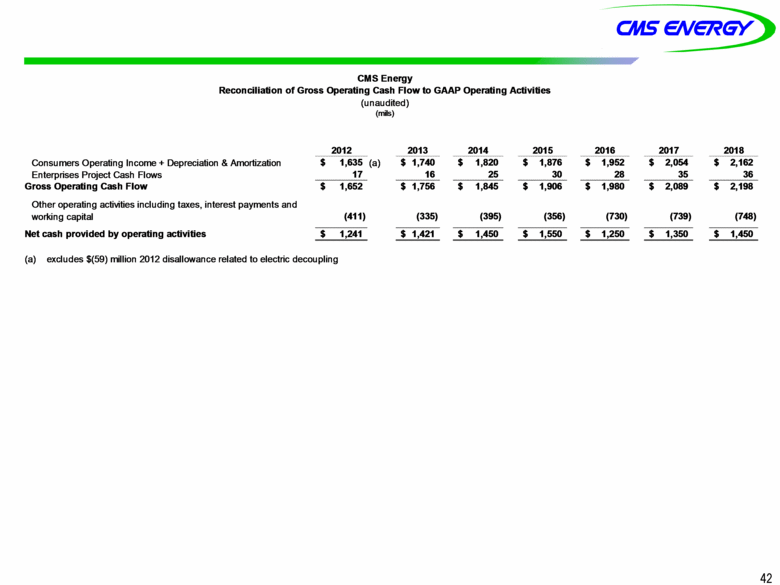
42 2012 2013 2014 2015 2016 2017 2018 Consumers Operating Income + Depreciation & Amortization 1,635 $ (a) 1,740 $ 1,820 $ 1,876 $ 1,952 $ 2,054 $ 2,162 $ Enterprises Project Cash Flows 17 16 25 30 28 35 36 Gross Operating Cash Flow 1,652 $ 1,756 $ 1,845 $ 1,906 $ 1,980 $ 2,089 $ 2,198 $ (411) (335) (395) (356) (730) (739) (748) Net cash provided by operating activities 1,241 $ 1,421 $ 1,450 $ 1,550 $ 1,250 $ 1,350 $ 1,450 $ (a) excludes $(59) million 2012 disallowance related to electric decoupling CMS Energy Reconciliation of Gross Operating Cash Flow to GAAP Operating Activities (unaudited) (mils) Other operating activities including taxes, interest payments and working capital |