Attached files
| file | filename |
|---|---|
| 8-K - FORM 8-K - ImmunoCellular Therapeutics, Ltd. | d737200d8k.htm |
| EX-99.2 - EX-99.2 - ImmunoCellular Therapeutics, Ltd. | d737200dex992.htm |
 A
randomized, double-blind, placebo- controlled phase 2 trial of
dendritic cell (DC) vaccination with ICT-107 in newly
diagnosed glioblastoma (GBM) patients
Patrick Y. Wen, David A. Reardon, Surasak Phuphanich, Terri
Armstrong, Robert Aiken, Joseph C. Landolfi, William T. Curry,
Jay-Jiguang Zhu, Michael J. Glantz, David M. Peereboom,
James Markert, Renato V. LaRocca, Donald O'Rourke, Karen L.
Fink, Lyndon J. Kim, Michael L. Gruber, Glenn Jay Lesser,
Edward Pan, Santosh Kesari, Elma S. Hawkins, John Yu
June 1, 2014
Exhibit 99.1 |
 Rationale for Immunotherapy in GBM
Presented by: Patrick Wen, MD
•
Immunoprivilege of the CNS is
circumvented in diseased brain tissue
such as in brain tumors and MS
•
Patients with GBM demonstrate
impaired immune function in numbers
and function of cytotoxic and helper T
cells, and dendritic cells have decreased
antigen presentation
•
DC vaccination removes DCs from
immunosuppressive milieu, increasing
the yield and potency of these antigen
presenting cells
•
T cells generated from DCs can target
intracranial glioblastoma |
   ICT-107 is an Autologous Six-antigen
DC Vaccine
Six 9-amino acid antigen epitopes
•
MAGE-1 (HLA -
A1)
•
AIM-2 (A1)
•
gp100 (HLA -
A2)
•
IL-13R
2 (A2)
•
HER2/neu (A2)
•
TRP-2 (A2)
MHC
Class I
Matured, Activated,
Peptide-loaded DC
Rationale for antigen choice
•
Targeting multiple antigens minimizes tumor escape
•
High expression levels for all antigens on GBM samples
•
Bias toward TAA associated with cancer stem cells
Control used in Ph II
•
Matured, activated DC without peptide loading
Presented by: Patrick Wen, MD |
   ICT-107 Phase I Highlights from ASCO 2013
Presented by: Patrick Wen, MD
A 33% immune response rate was
observed in patients by intracellular
FACS staining of IFNgamma
A 33% immune response rate was
observed in patients by intracellular
FACS staining of IFNgamma |
                    ICT-107 Ph II Trial Design
Surgery
Screen
and
Enroll
SOC
Chemo-
radiation
Eligibility
Confirmation
Patient-Specific
Vaccination
•
ICT-107 or Control
•
1/wk for 4 wks
Consent
Randomize
Week –
1
SOC Maintenance TMZ
Week –
2
Rest Week
Week –
3
Clinical Assessments
+ maintenance vaccine
(ICT-107 or Control)
+ tumor assessments
Week –
4
Rest Week
Presented by: Patrick Wen, MD
Maintenance includes vaccination on a 1, 3, 6, 6…
monthly schedule as long as the patient does not recur
Apheresis |
 Eligibility Criteria and Objectives
Key INCLUSION Criteria
–
Complete surgical resection or minimum residual tumor <1 cm3 GBM
–
Human leukocyte antigen (HLA) A1, HLA-A2, or HLA-A1/A2
–
Karnofsky Performance Status (KPS) score of
70%
Key EXCLUSION Criteria
–
Recurrent disease
–
Radiosurgery and placement of Gliadel
PRIMARY OBJECTIVE
–
OS
SECONDARY OBJECTIVEs
–
PFS
–
Safety and tolerability of ICT-107
–
Describe the immune response to ICT-107
–
Determine predictors of response
Presented by: Patrick Wen, MD |
         Patient
Disposition October 2013 and April 2014 Data Analysis
All patients
enrolled
N = 278
All patients
randomized
N = 124
ICT-107
N = 81
Control
N = 43
Patients on study
Oct: N = 14 (17%)
April: N = 12 (15%)
Patients on study
Oct: N = 7 (16%)
April: N = 5 (12%)
Patients off study
Oct: N = 67 (83%)
April: N = 69 (85%)
Reasons:
Progressive Disease
Oct: N = 48 (59%)
Apr: N = 50 (62%)
Other*
Oct: N = 19 (23%)
Apr: N = 19 (23%)
Patients off study
Oct: N = 36 (84%)
April: N = 38 (88%)
Reasons:
Progressive Disease
Oct: N = 29 (67%)
Apr: N = 30 (70%)
Other*
Oct: N = 7 (16%)
Apr: N = 8 (19%)
Presented by: Patrick Wen, MD
* Other includes treatment completion, withdrawn
consent, investigator withdrawn, etc. |
  Patient
Demographics Population Characteristic
ICT-107
(N=81)
Control
(N=43)
Total
(N=124)
P-Value
Fishers Exact
Gender [n(%)]
0.082
Male
44 (54.3%)
31 (72.1%)
75 (60.5%)
Female
37 (45.7%)
12 (27.9%)
49 (39.5%)
Age Category [n(%)]
0.830
<50 years
20 (24.7%)
12 (27.9%)
32 (25.8%)
>50 years
61 (75.3%)
31 (72.1%)
92 (74.2%)
MGMT status [n (%)]
0.476
Methylated
28 (34.6%)
18 (41.9%)
46 (37.1%)
Unmethylated
47 (58.0%)
24 (55.8%)
71 (57.3%)
KPS Category [n (%)]
0.241
100
24 (29.6%)
8 (18.6%)
32 (25.8%)
90
36 (44.4%)
18 (41.9%)
54 (43.5%)
<90
20 (24.7%)
17 (39.5%)
37 (29.8%)
HLA Type [n (%)]
0.289
A1=Positive, A2=Negative
33 (40.7%)
14 (32.6%)
47 (37.9%)
A1=Negative, A2=Positive
42 (51.9%)
22 (51.2%)
64 (51.6%)
A1=Positive, A2=Positive
6 (7.4%)
7 (16.3%)
13 (10.5%)
Resection Status
0.834
Complete resection
58 (71.6%)
32 (74.4%)
90 (72.6%)
Subtotal resection
23 (28.4%)
11 (25.6%)
34 (27.4%)
Presented by: Patrick Wen, MD |
 Safety
– Common Adverse Events
A E Category
ICT-107 (N=80)
Control DC (N=43)
Grade 2
Grade 3
Grade 4
Grade 2
Grade 3
Grade 4
Nervous system
25(31.3%)
14(17.%)
21(48.8%)
7(16.3%)
General
16(20.0%)
6(7.5%)
12(27.9%)
5(11.6%)
Fatigue
9(11.3%)
3(3.8%)
8(18.6%)
3(7.0%)
Gastrointestinal
11(13.8%)
6(14.0%)
Musculoskeletal
10(12.5%)
1(1.3%)
8(18.6%)
Weakness
2(2.5%)
3(7.0%)
3(7.0%)
Investigations
5(6.3%)
4(5.0%)
4(9.3%)
2(4.7%)
WBC Decreased
4(5.0%)
0(0.0%)
Skin/subcut
7(8.8%)
7(16.3%)
Blood/lymphatic
9(11.3%)
6(7.5%)
6(14.0%)
4(9.3%)
Infections
13(16.3%)
11(25.6%)
Psychiatric
9(11.3%)
6(14.0%)
Metabolism
5(6.3%)
3(3.8%)
7(16.3%)
4(9.3%)
Procedural
complications
9(11.3%)
4(9.3%)
Adverse Events by Body System with an Incidence >5%
Presented by: Patrick Wen, MD |
 Safety –
SAEs Above Grade 3
Active Patients and Control Patients
Presented by: Patrick Wen, MD
Pt #
SAE
CTCAE
Grade
Resolution
Relationship
to Drug
1
Intracranial hemorrhage
4
Resolved with sequelae
NR
Increase intracranial pressure
5
Fatal
NR
Cardiac arrest
4
Resolved
NR
Retroperitoneal hemorrhage
5
Fatal
NR
Thrombocytopenia
4
Resolved
NR
Neutropenia
4
Resolved
NR
2
Thrombocytopenia
4
Resolved
NR
3
Septic shock
4
Resolved
NR
4
Pulmonary embolism
4
Resolved
NR
5
Pulmonary emboli-bilateral
4
Resolved with sequelae
NR
DVT right lower extremity
4
Resolved with sequelae
NR
6
Thrombocytopenia
4
Resolved
NR
7
Seizure
4
Resolved
NR
Seizure
4
Resolved
NR
Altered mental state
4
Unknown
NR
8
Thromboembolic event
4
Resolved
NR
9
Acute renal failure
5
Fatal
NR |
 OS
(From Randomization) for ITT and PP Populations
Updated in April 2014
Presented by: Patrick Wen, MD
DAYS
ITT Population (N=124)
ICT-107
N = 81 (51 events)
Median = 18.3 mo (14.89, 21.14)
HR = 0.87
Age, MGMT stratified P* = 0.643
Control
N = 43 (28 events)
Median = 16.7 mo (12.33, 23.05)
Numeric
but
not
statistical
treatment
benefit
PP Population (N=117)
ICT-107
N = 75 (46 events)
Median = 18.6 mo (15.32, 23.47)
HR = 0.79
Age, MGMT stratified P* = 0.477
Control
N = 42 (27 events)
Median = 16.7 mo (12.85, 23.05)
* Two-sided log-rank p-value |
 PFS
for the ITT and PP Populations (Central Radiology Review)
Updated in April 2014
Presented by: Patrick Wen, MD
DAYS
* Two-sided log-rank p-value
ITT Population (N=124)
ICT-107
N = 81 (61 events)
Median = 11.2 mo (8.22, 13.05)
HR = 0.57
Age, MGMT stratified P* = 0.011
Control
N = 43 (39 events)
Median = 9 mo (5.52, 10.29)
PP Population (N=117)
ICT-107
N = 75 (57)
Median = 11.4 mo (8.68, 13.05)
HR = 0.54
Age, MGMT stratified P* = 0.006
Control
N = 42 (38)
Median = 9.0 mo (5.00, 10.29)
Statistical
treatment benefit |
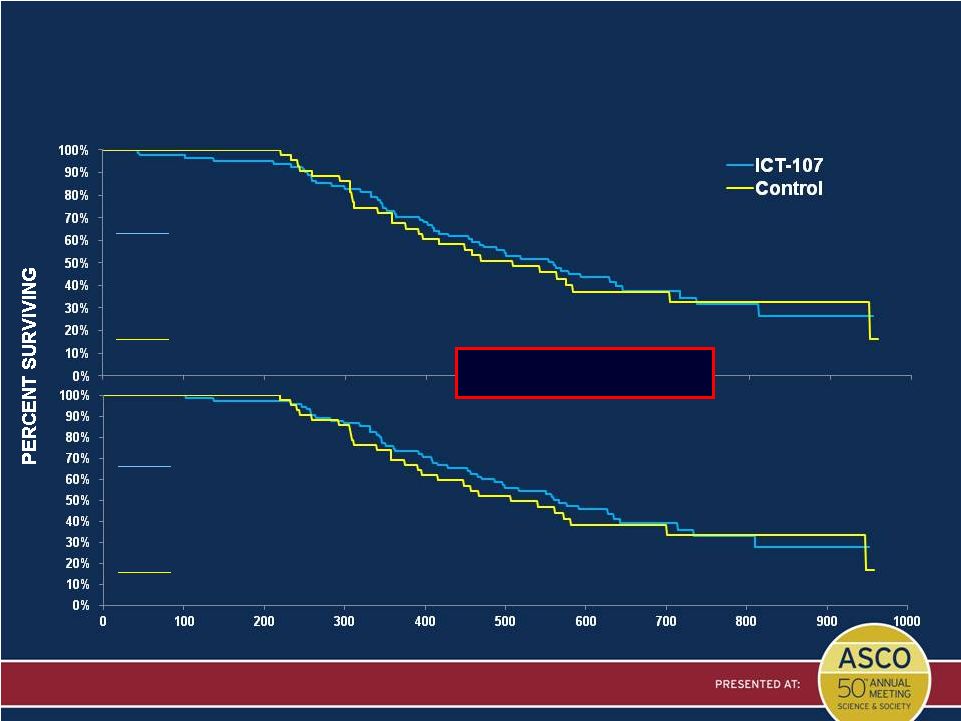
 MGMT
Status Creates Two Different Patient Populations From the Survival
Perspective Per-Protocol Population with April 2014 Survival Data
Presented by: Patrick Wen, MD
DAYS
PP Population (N=117*)
MGMT –
Methylated (N = 42)
ICT-107
N = 25 (8 events)
Median = not yet defined
HR = 0.797
Age
stratified
P
†
=0.683
Control
N = 17 (6 events)
Median = not yet defined
MGMT –
Unmethylated (68)
ICT-107
N = 44 (33 events)
Median = 15.4mo (11.93, 18.94)
HR = 0.765
Age
stratified
P
†
=
0.347
Control
N = 24 (21 events)
Median = 14.2 mo (10.22, 17.75)
* 110 of 117 in PP population have MGMT defined
†
Two-sided log-rank p-value
The MGMT methylated control has
at least double the median survival
of the unmethylated control |
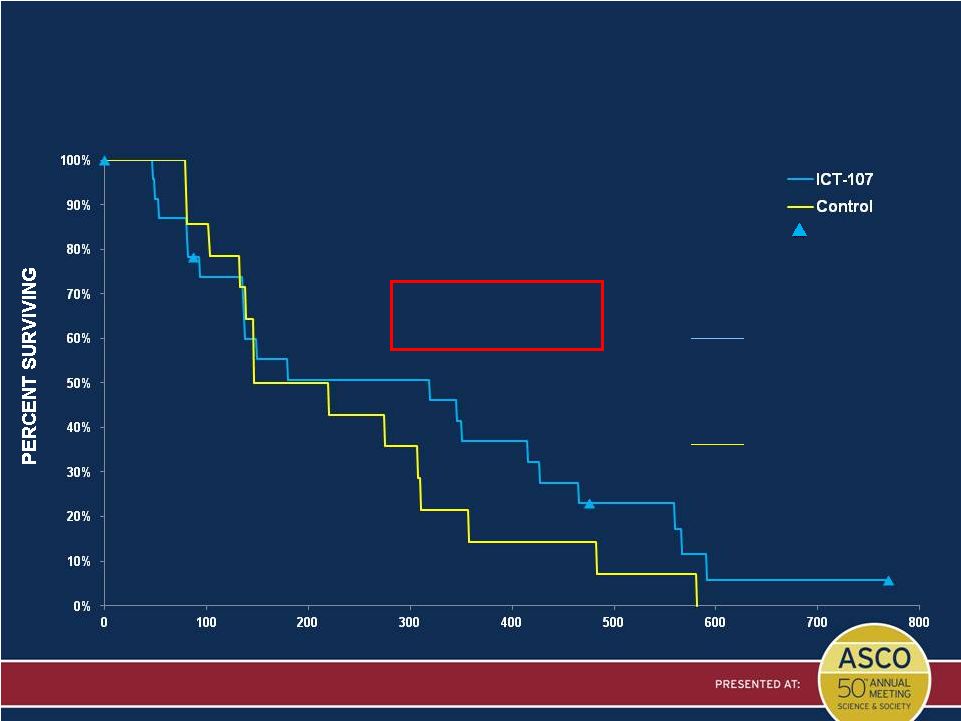
 OS
in
the
Unmethylated
MGMT
and
HLA-A2
†
Subgroup
Per-Protocol Population with April 2014 Survival Data
Presented by: Patrick Wen, MD
Censored
PP Population (N=38)
ICT-107
N = 24 (19 events)
Median = 15.8 mo (11.38, 18.94)
HR = 0.612
Age, MGMT stratified P* = 0.175
Control
N = 14 (13 events)
Median = 11.8 mo (8.52, 18.44)
4-month median survival
advantage and indications of
a long-term survival benefit
•
21% of treated alive
•
7% of control alive
DAYS
* Two-sided log-rank p-value
†
includes HLA-A1/A2 dual positives |
 Presented by: Patrick Wen, MD
DAYS
Censored
PFS in the Unmethylated MGMT and HLA-A2 Subgroup
(Central Radiology Review)
Per-Protocol Population with April 2014 PFS Data
PP Population (N=38)
ICT-107
N = 24 (20 events)
Median = 10.5 mo (4.47, 14.04)
HR = 0.758
Age, MGMT stratified P* = 0.442
Control
N = 14 (14 events)
Median = 6.0 mo (3.39, 10.22)
Non-statistical PFS
treatment advantage of
4.5 months at medians
* Two-sided log-rank p-value |
 OS in
the Methylated MGMT and HLA-A2 Subgroup Per-Protocol Population with
April 2014 Survival Data Presented by: Patrick Wen, MD
DAYS
Censored
PP Population (N=31)
ICT-107
N = 17 (6 events)
Median = not yet defined
HR = 0.683
Age stratified P* = 0.508
Control
N = 14 (6 events)
Median = not yet defined
Median survival not yet defined
Majority of patients still alive
•
65% of treated alive
•
57% of control alive
* Two-sided log-rank p-value |
 Presented by: Patrick Wen, MD
PFS in the Methylated MGMT and HLA-A2 Subgroup
(Central Radiology Review)
Per-Protocol Population with April 2014 PFS Data
Censored
PP Population (N=31)
ICT-107
N = 17 (9 events)
Median = 24.1 mo (CI not defined)
HR = 0.259
Age stratified P* = 0.005
Control
N = 14 (13 events)
Median 8.5 mo (3.58,13.64)
DAYS
Statistical PFS treatment
benefit of 15.6 months at
medians
* Two-sided log-rank p-value |
 Quality of Life Assessed via FACT-BR and
Performance Status
Presented by: Patrick Wen, MD
ICT-107 N =
Control N =
P-value* =
66
40
0.004
60
37
0.005
54
33
0.022
48
27
0.047
81
43
0.200
* Signed rank test
One week
prior to first
vaccination
3 weeks post
induction
7 weeks post
induction
11 weeks post
induction
15 weeks post
induction
FACT-BR Findings
•
Change from baseline in QOL reporting was not different between the experimental and
control arms during the maintenance phase, at progression, or at treatment
completion •
ICT-107 patients maintained QOL longer as they progressed later
•
Findings limited by small sample size and attrition at end of study
Karnofsky Performance Status (KPS) Monitoring |
 Proportion of Steroid Usage During Trial
Presented by: Patrick Wen, MD
DAYS –
Time to First Usage of Dexamethasone and Decadron
ITT Population (N=124)
ICT-107
N = 81 (24 events)
30% Steroid Usage
MGMT, Age stratified P* = 0.1395
Control
N = 43 (19 events)
44% Steroid Usage
* Two-sided log-rank p-value |
 Relationship between Indicators of Vaccine
Potency and Survival
Cox Proportional Hazards Model –
Assessments of DC Maturity and Activation in
Vaccine Prior to Administration
Presented by: Patrick Wen, MD
Vaccines for All ICT-107 Patients with Parameter Values –
Overall Survival Model
Vaccines
for
All
HLA-A2
†
ICT-107
Patients
with
Parameter
Values
–
Overall
Survival
Model
Correlation of these markers of DC function to survival was present only in the
ICT107 group; not control. Suggests that the maturation of DCs was relevant
only when the DCs were loaded with antigen. * Cox Proportional Hazard Models
run with two variables: Il-12 or HLA-DR (both continuous log-transformed variables)
†
Includes dual HLA-A1/A2 patients
December 2013
April 2014
Parameter*
Coefficient
P-value
Coefficient
P-value
IL-12 secretion
-0.75
0.027
-0.67
0.048
HLA-DR expression
-1.04
0.024
-1.13
0.006
December 2013
April 2014
Parameter*
Coefficient
P-value
Coefficient
P-value
IL-12 secretion
-1.13
0.012
-1.03
0.021
HLA-DR expression
-0.95
0.074
-0.883
0.066 |
 Antigen-Specific Vaccine Response
Presented by: Patrick Wen, MD
All Patients (N = 111)
HLA-A2 Patients (N = 68)
Percent of Patients with at Least One Response to Antigen Challenge in
Elispot |
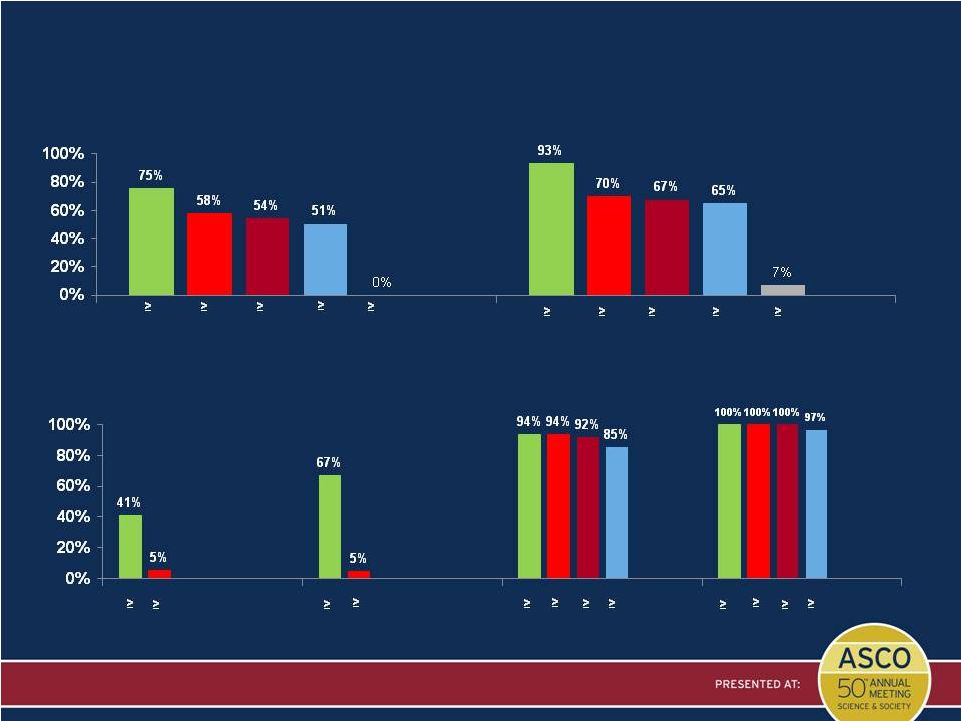 Antigen Presentation in Primary Tumors
Percent of Patients Expressing Antigens via qPCR
Presented by: Patrick Wen, MD
1
2
3
4
5
1
2
3
4
5
1
2
1
2
ICT-107
ICT-107
Control
Control
Percent of All Patients (N = 124) Expressing 6 Antigens in ICT-107
1
2
3
4
1
2
3
4
ICT-107
Control
Percent of All Patients (N = 124) Expressing HLA
Specific Antigens in ICT-107
HLA-A1* (N = 60) Expressing A1 Antigens
HLA-A2* (N =77) Expressing A2 Antigens
* Includes dual A1/A2 positive patients |
 Conclusions for ICT-107 Ph II
Presented by: Patrick Wen, MD
•
No significant difference in adverse events between ICT-107 and control
•
The vaccine is biologically active in terms of producing an immune response
•
PFS was statistically improved for the entire treated population
•
ICT-107 activity is strongest in the HLA-A2 subgroup clinically,
immunologically, and with regard to antigen expression. This activity is
observed in both the MGMT methylated and unmethylated subgroups
•
Extended PFS in the treated group appears to come with commensurate improved
quality of life
–
Quality of Life, as measured by FACT-BR, is maintained equally until
progression for ICT-107 and Control patients
–
ICT-107 patients retain greater performance
capacity, as measured by
KPS,
than controls and tend to be placed on steroids later
•
Vaccine potency as measured by HLA-DR expression and IL-12 secretion is
predictive of OS
•
Results support advancement to a phase III trial |
 Acknowledgements
Presented by: Patrick Wen, MD
The Authors and ImmunoCellular Therapeutics Wish to Thank
Additional Investigators:
Andrew Sloan, Susan C. Pannullo, James Chandler, Jeffrey Raizer,
David Schiff,
Tina Mayer, Will Curry, Jay Grewel
Terri Armstrong for analysis of the QOL data
Trial Sites:
Johns Hopkins University, New York University, University of Texas at Houston,
Northwestern University, Arizona Cancer Center, New Jersey Neuroscience
Institute, UC San Diego, Moffitt Cancer Center, Penn State, University of
Pennsylvania, University of Virginia, Wake Forest
Cornell Presbyterian, Massachusetts General, Kentuckiana Cancer Institute,
Cedars-Sinai Medical Center, University Hospital Case Medical Center, Rush
University, Overlook Hospital, Baylor University, Cleveland Clinic, University of
Alabama, Thomas Jefferson, Long Island Brain Center
Patients and Families |