Attached files
| file | filename |
|---|---|
| 8-K - 8-K - TIAA FSB Holdings, Inc. | form8-kforeverbankinvestor.htm |
EVERBANK FINANCIAL CORP INVESTOR PRESENTATION June 2014 FOR MORE INFORMATION: Investor Relations, 877.755.6722 Investor.Relations@EverBank.com www.abouteverbank.com/ir
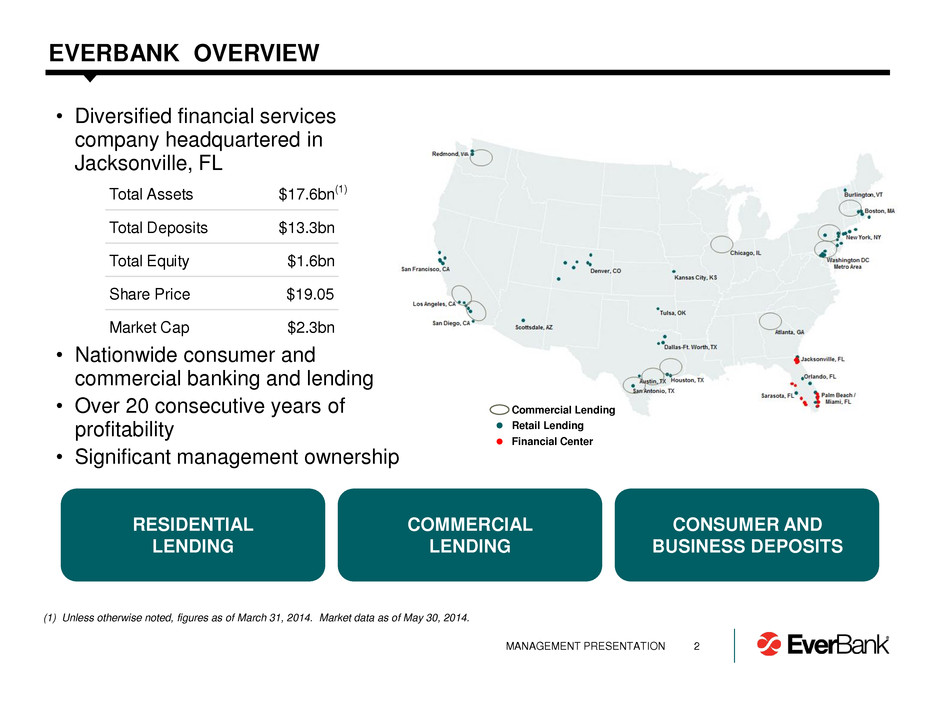
• Diversified financial services company headquartered in Jacksonville, FL • Nationwide consumer and commercial banking and lending • Over 20 consecutive years of profitability • Significant management ownership 2 EVERBANK OVERVIEW (1) Unless otherwise noted, figures as of March 31, 2014. Market data as of May 30, 2014. Commercial Lending Retail Lending Financial Center RESIDENTIAL LENDING COMMERCIAL LENDING CONSUMER AND BUSINESS DEPOSITS (1) MANAGEMENT PRESENTATION Total Assets $17.6bn Total Deposits $13.3bn Total Equity $1.6bn Share Price $19.05 Market Cap $2.3bn

3 STRATEGIC EVOLUTION AND GROWTH 2008 – 2012 Addition of Diversified Asset Generation 2013 – 2014 Optimization of Business Platforms 2014+ Execute on Core Growth Strategy EVOLUTION 5 YEAR COMPOUND ANNUAL GROWTH1 TOTAL ASSETS TOTAL LOANS HFI TOTAL DEPOSITS TANGIBLE BOOK VALUE / SHARE 20% 5% EverBank Banks $5-25bn in Assets 24% 4% EverBank Banks $5-25bn in Assets 22% 9% EverBank Banks $5-25bn in Assets 11% 6% EverBank Banks $5-25bn in Assets MARCH INVESTOR PRESENTATION (1) Compound annual growth from 2008 to 2013.

4 STRATEGIC INITIATIVES MORE DIVERSIFIED MORE SIMPLIFIED POSITIONED FOR GROWTH INITIATIVES RESULT OF RECENT INITIATIVES • Built and acquired diverse asset generation channels • Commercial real estate • Commercial finance • Warehouse finance • Retail lending • Invested significantly in corporate governance and infrastructure • Exited wholesale lending business • Realigned commercial lending platforms • Sold non-performing commercial loans and REO • Sold default servicing portfolio and platform • Executed asset rotation strategy • Completed DFAST submission JUNE INVESTOR PRESENTATION
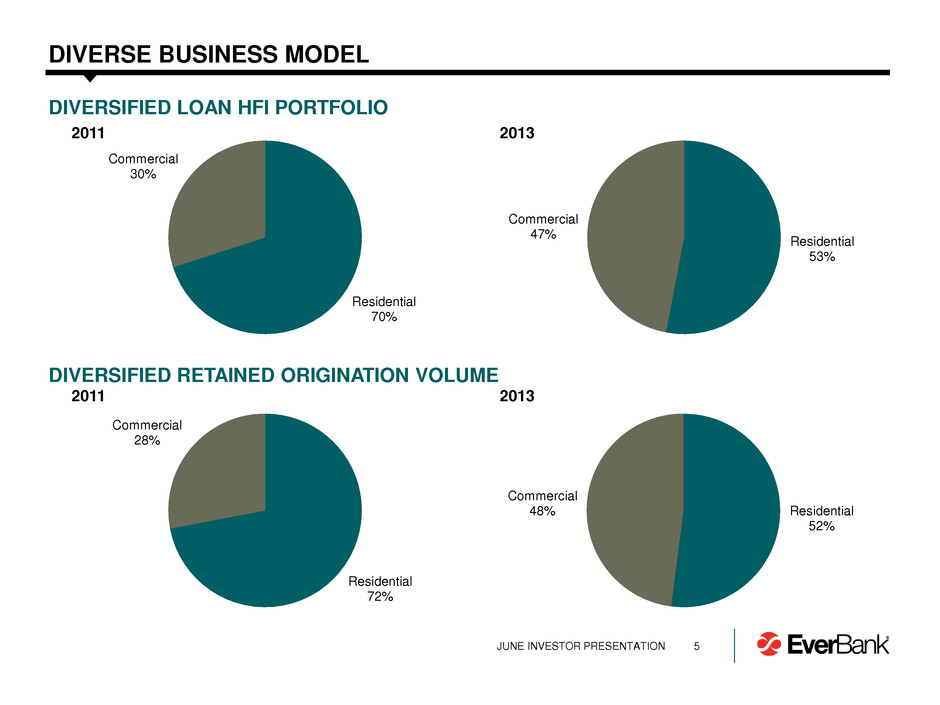
Residential 53% Commercial 47% 2011 5 DIVERSE BUSINESS MODEL Residential 52% Commercial 48% DIVERSIFIED LOAN HFI PORTFOLIO DIVERSIFIED RETAINED ORIGINATION VOLUME 2011 2013 2013 Residential 70% Commercial 30% JUNE INVESTOR PRESENTATION Residential 72% Commercial 28%
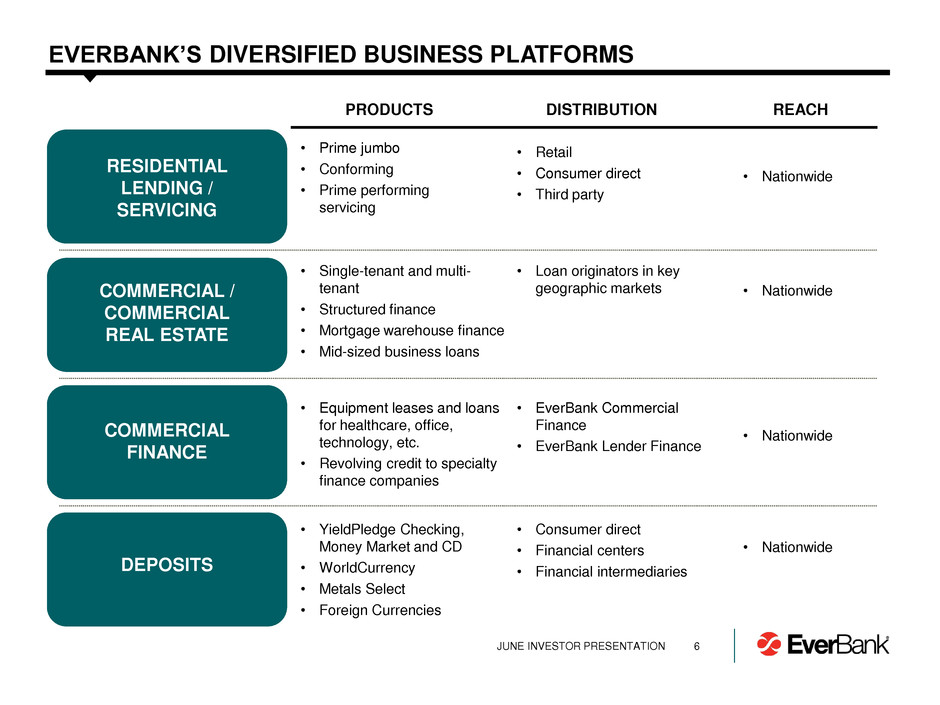
6 EVERBANK’S DIVERSIFIED BUSINESS PLATFORMS RESIDENTIAL LENDING / SERVICING COMMERCIAL / COMMERCIAL REAL ESTATE COMMERCIAL FINANCE DEPOSITS • Prime jumbo • Conforming • Prime performing servicing • Single-tenant and multi- tenant • Structured finance • Mortgage warehouse finance • Mid-sized business loans • Equipment leases and loans for healthcare, office, technology, etc. • Revolving credit to specialty finance companies • YieldPledge Checking, Money Market and CD • WorldCurrency • Metals Select • Foreign Currencies PRODUCTS DISTRIBUTION REACH • Nationwide • Nationwide • Nationwide • Nationwide • Retail • Consumer direct • Third party • Loan originators in key geographic markets • EverBank Commercial Finance • EverBank Lender Finance • Consumer direct • Financial centers • Financial intermediaries JUNE INVESTOR PRESENTATION
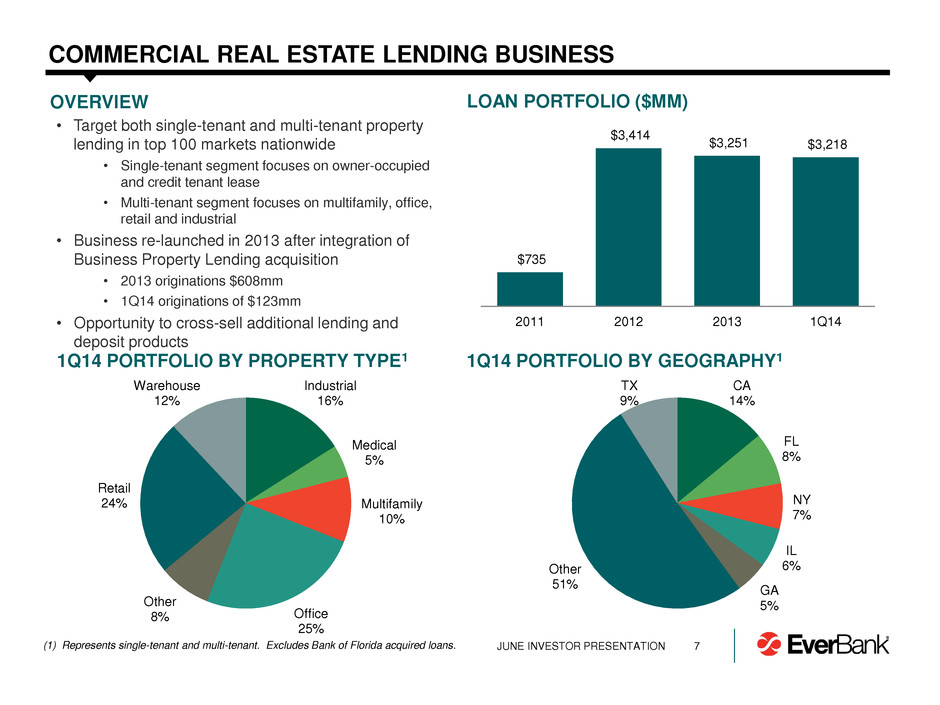
• Target both single-tenant and multi-tenant property lending in top 100 markets nationwide • Single-tenant segment focuses on owner-occupied and credit tenant lease • Multi-tenant segment focuses on multifamily, office, retail and industrial • Business re-launched in 2013 after integration of Business Property Lending acquisition • 2013 originations $608mm • 1Q14 originations of $123mm • Opportunity to cross-sell additional lending and deposit products 7 COMMERCIAL REAL ESTATE LENDING BUSINESS 1Q14 PORTFOLIO BY PROPERTY TYPE1 1Q14 PORTFOLIO BY GEOGRAPHY1 OVERVIEW JUNE INVESTOR PRESENTATION Industrial 16% Medical 5% Multifamily 10% Office 25% Other 8% Retail 24% Warehouse 12% CA 14% FL 8% NY 7% IL 6% GA 5% Other 51% TX 9% LOAN PORTFOLIO ($MM) $735 $3,414 $3,251 $3,218 2011 2012 2013 1Q14 (1) Represents single-tenant and multi-tenant. Excludes Bank of Florida acquired loans.
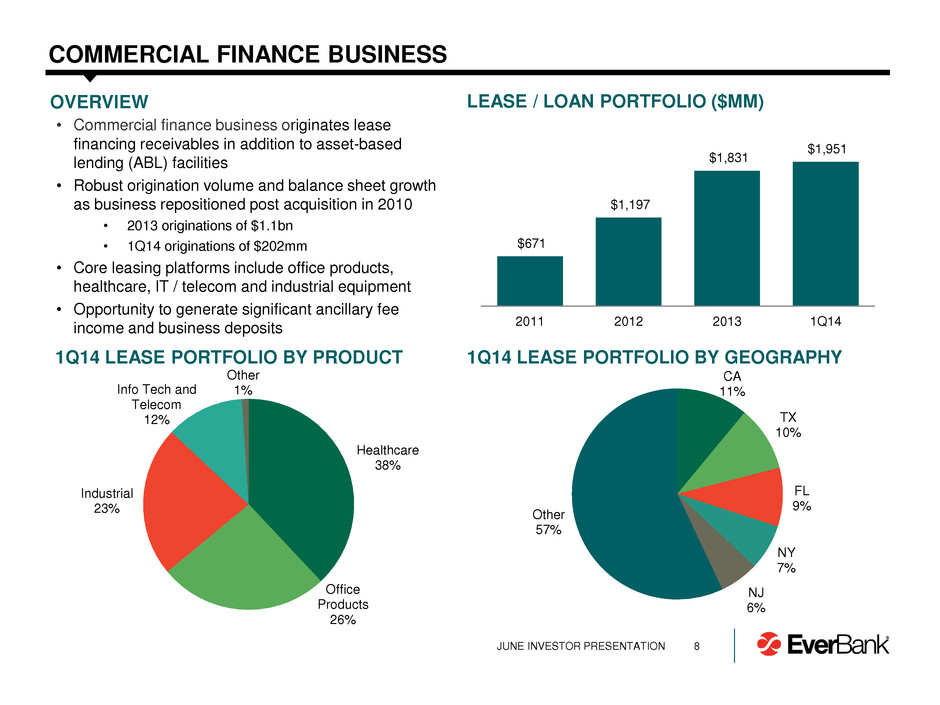
CA 11% TX 10% FL 9% NY 7% NJ 6% Other 57% 8 COMMERCIAL FINANCE BUSINESS • Commercial finance business originates lease financing receivables in addition to asset-based lending (ABL) facilities • Robust origination volume and balance sheet growth as business repositioned post acquisition in 2010 • 2013 originations of $1.1bn • 1Q14 originations of $202mm • Core leasing platforms include office products, healthcare, IT / telecom and industrial equipment • Opportunity to generate significant ancillary fee income and business deposits LEASE / LOAN PORTFOLIO ($MM) 1Q14 LEASE PORTFOLIO BY GEOGRAPHY OVERVIEW $671 $1,197 $1,831 $1,951 2011 2012 2013 1Q14 JUNE INVESTOR PRESENTATION 1Q14 LEASE PORTFOLIO BY PRODUCT Healthcare 38% Office Products 26% Industrial 23% Info Tech and Telecom 12% Other 1%
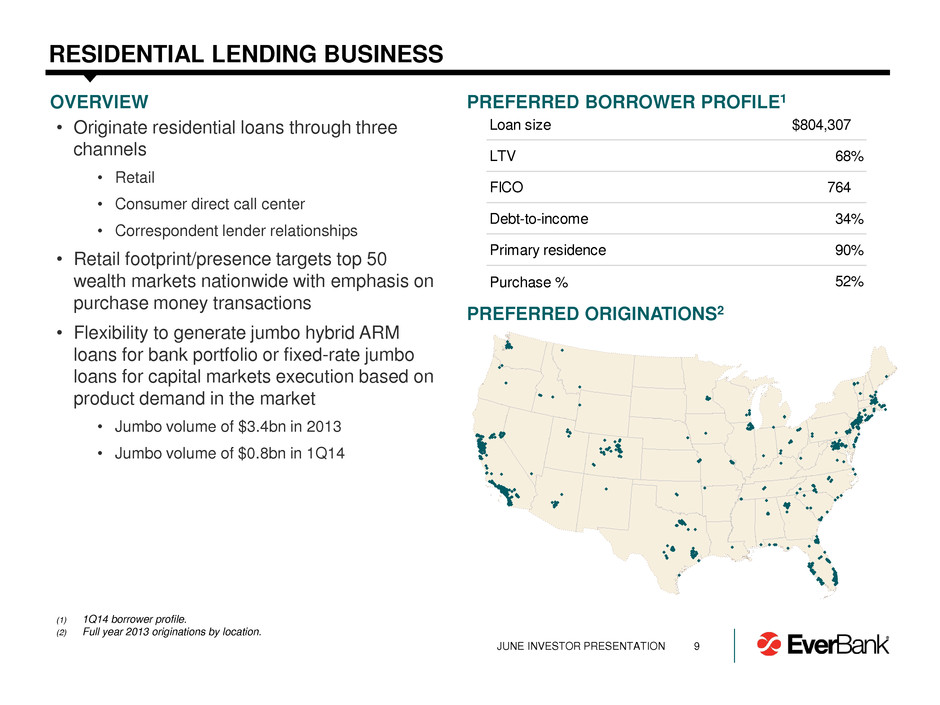
9 RESIDENTIAL LENDING BUSINESS OVERVIEW • Originate residential loans through three channels • Retail • Consumer direct call center • Correspondent lender relationships • Retail footprint/presence targets top 50 wealth markets nationwide with emphasis on purchase money transactions • Flexibility to generate jumbo hybrid ARM loans for bank portfolio or fixed-rate jumbo loans for capital markets execution based on product demand in the market • Jumbo volume of $3.4bn in 2013 • Jumbo volume of $0.8bn in 1Q14 PREFERRED BORROWER PROFILE1 PREFERRED ORIGINATIONS2 JUNE INVESTOR PRESENTATION (1) 1Q14 borrower profile. (2) Full year 2013 originations by location. Loan size 804,307$ LTV 68% ICO 764 Debt-to-income 34% Primary residence 90% Purchase % 52%
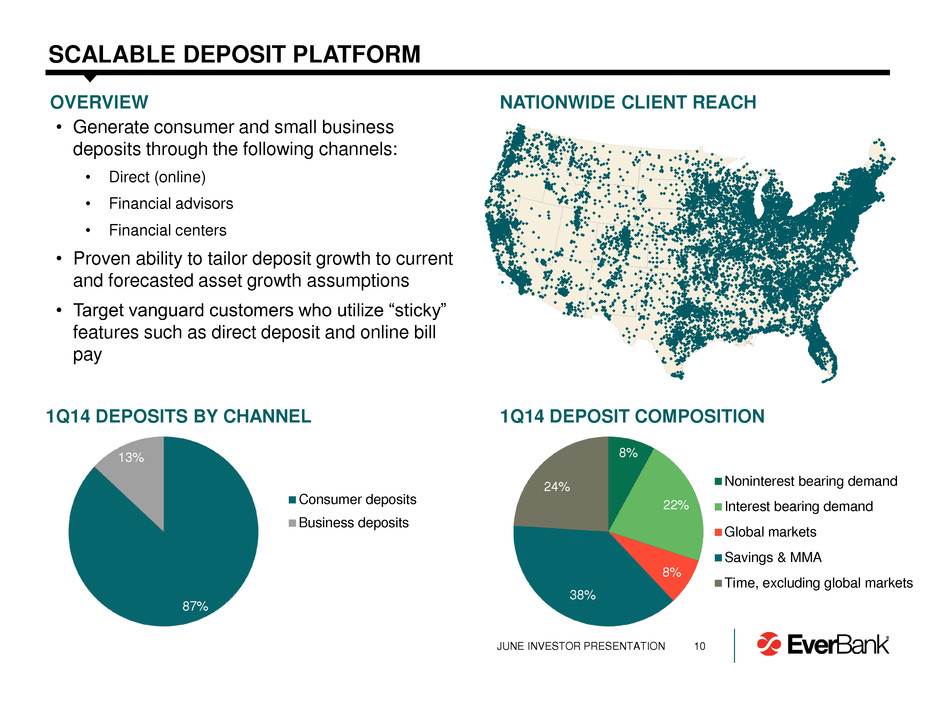
OVERVIEW • Generate consumer and small business deposits through the following channels: • Direct (online) • Financial advisors • Financial centers • Proven ability to tailor deposit growth to current and forecasted asset growth assumptions • Target vanguard customers who utilize “sticky” features such as direct deposit and online bill pay SCALABLE DEPOSIT PLATFORM 10 NATIONWIDE CLIENT REACH 1Q14 DEPOSIT COMPOSITION 1Q14 DEPOSITS BY CHANNEL 8% 22% 8% 38% 24% Noninterest bearing demand Interest bearing demand Global markets Savings & MMA Time, excluding global markets 87% 13% Consumer deposits Business deposits JUNE INVESTOR PRESENTATION
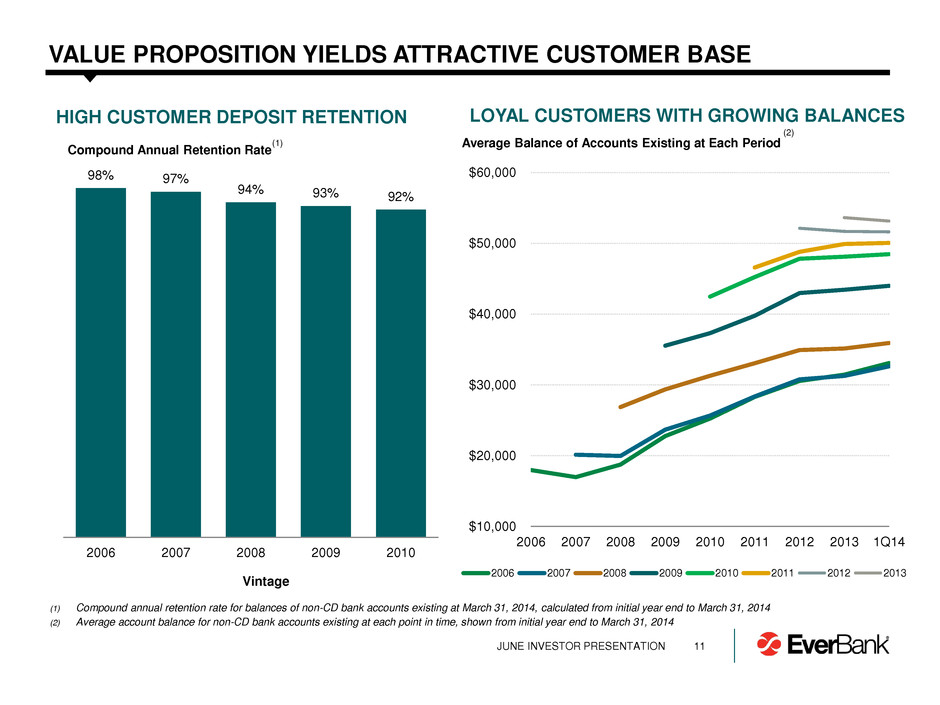
98% 97% 94% 93% 92% 2006 2007 2008 2009 2010 Compound Annual Retention Rate 11 VALUE PROPOSITION YIELDS ATTRACTIVE CUSTOMER BASE Vintage (1) HIGH CUSTOMER DEPOSIT RETENTION LOYAL CUSTOMERS WITH GROWING BALANCES (1) Compound annual retention rate for balances of non-CD bank accounts existing at March 31, 2014, calculated from initial year end to March 31, 2014 (2) Average account balance for non-CD bank accounts existing at each point in time, shown from initial year end to March 31, 2014 (2) JUNE INVESTOR PRESENTATION $10,000 $20,000 $30,000 $40,000 $50,000 $60,000 2006 2007 2008 2009 2010 2011 2012 2013 1Q14 Average Balance of Accounts Existing at Each Period 2006 2007 2008 2009 2010 2011 2012 2013
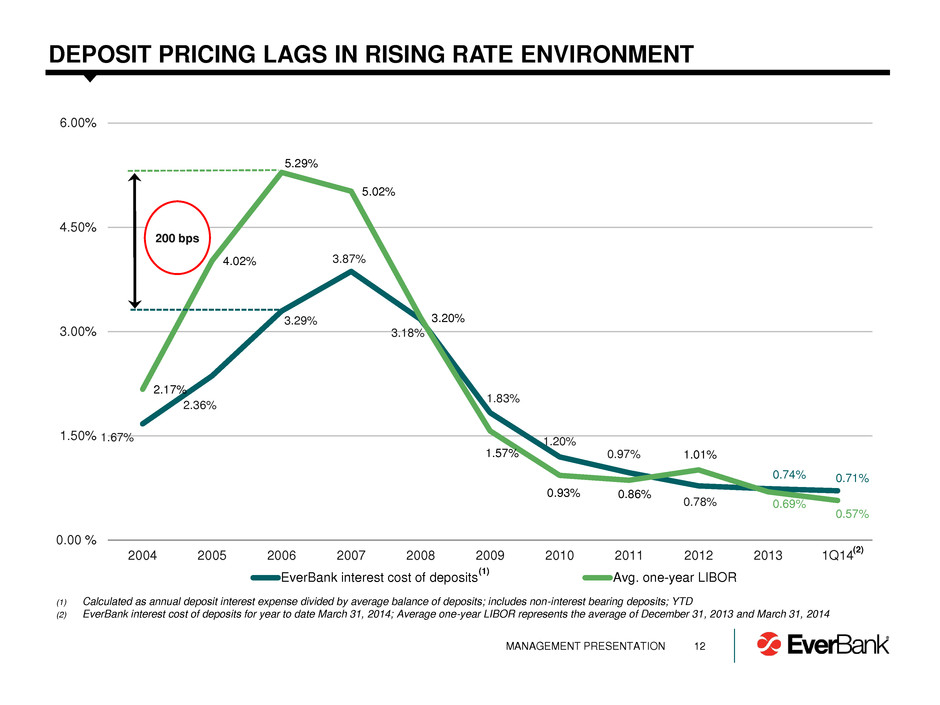
1.67% 2.36% 3.29% 3.87% 3.18% 1.83% 1.20% 0.97% 0.78% 0.74% 0.71% 2.17% 4.02% 5.29% 5.02% 3.20% 1.57% 0.93% 0.86% 1.01% 0.69% 0.57% 0.00 % 1.50% 3.00% 4.50% 6.00% 2004 2005 2006 2007 2008 2009 2010 2011 2012 2013 1Q14 EverBank interest cost of deposits Avg. one-year LIBOR 200 bps 12 DEPOSIT PRICING LAGS IN RISING RATE ENVIRONMENT (1) Calculated as annual deposit interest expense divided by average balance of deposits; includes non-interest bearing deposits; YTD (2) EverBank interest cost of deposits for year to date March 31, 2014; Average one-year LIBOR represents the average of December 31, 2013 and March 31, 2014 (1) (2) MANAGEMENT PRESENTATION
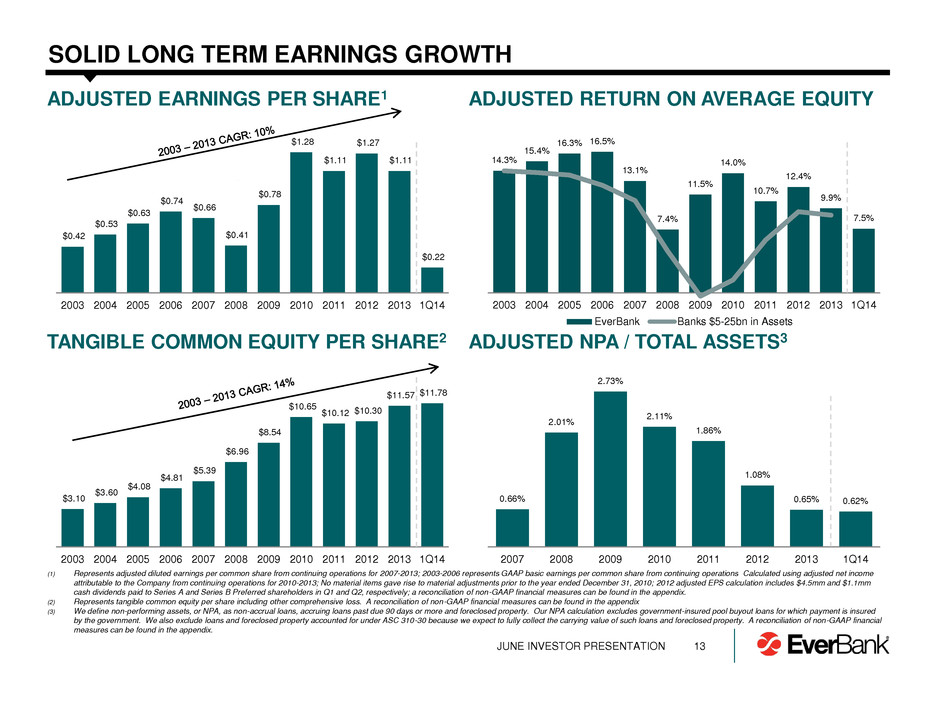
13 SOLID LONG TERM EARNINGS GROWTH ADJUSTED EARNINGS PER SHARE1 $0.42 $0.53 $0.63 $0.74 $0.66 $0.41 $0.78 $1.28 $1.11 $1.27 $1.11 $0.22 2003 2004 2005 2006 2007 2008 2009 2010 2011 2012 2013 1Q14 (1) Represents adjusted diluted earnings per common share from continuing operations for 2007-2013; 2003-2006 represents GAAP basic earnings per common share from continuing operations Calculated using adjusted net income attributable to the Company from continuing operations for 2010-2013; No material items gave rise to material adjustments prior to the year ended December 31, 2010; 2012 adjusted EPS calculation includes $4.5mm and $1.1mm cash dividends paid to Series A and Series B Preferred shareholders in Q1 and Q2, respectively; a reconciliation of non-GAAP financial measures can be found in the appendix. (2) Represents tangible common equity per share including other comprehensive loss. A reconciliation of non-GAAP financial measures can be found in the appendix (3) We define non-performing assets, or NPA, as non-accrual loans, accruing loans past due 90 days or more and foreclosed property. Our NPA calculation excludes government-insured pool buyout loans for which payment is insured by the government. We also exclude loans and foreclosed property accounted for under ASC 310-30 because we expect to fully collect the carrying value of such loans and foreclosed property. A reconciliation of non-GAAP financial measures can be found in the appendix. TANGIBLE COMMON EQUITY PER SHARE2 $3.10 $3.60 $4.08 $4.81 $5.39 $6.96 $8.54 $10.65 $10.12 $10.30 $11.57 $11.78 2003 2004 2005 2006 2007 2008 2009 2010 2011 2012 2013 1Q14 14.3% 15.4% 16.3% 16.5% 13.1% 7.4% 11.5% 14.0% 10.7% 12.4% 9.9% 7.5% 2003 2004 2005 2006 2007 2008 2009 2010 2011 2012 2013 1Q14 EverBank Banks $5-25bn in Assets ADJUSTED RETURN ON AVERAGE EQUITY ADJUSTED NPA / TOTAL ASSETS3 0.66% 2.01% 2.73% 2.11% 1.86% 1.08% 0.65% 0.62% 2007 2008 2009 2010 2011 2012 2013 1Q14 JUNE INVESTOR PRESENTATION
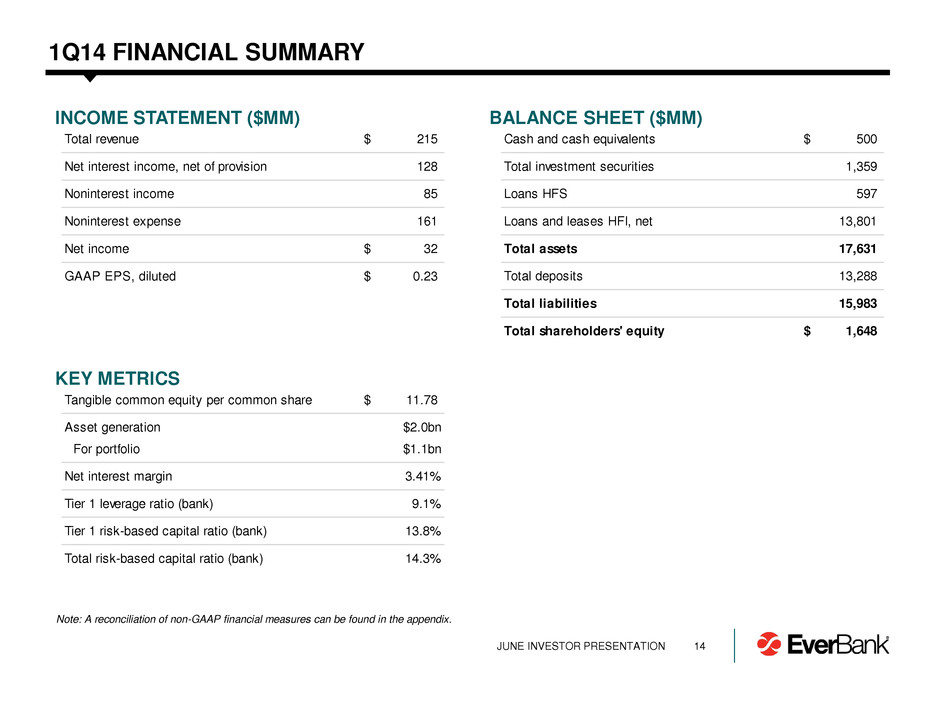
14 1Q14 FINANCIAL SUMMARY Note: A reconciliation of non-GAAP financial measures can be found in the appendix. BALANCE SHEET ($MM) INCOME STATEMENT ($MM) KEY METRICS JUNE INVESTOR PRESENTATION Total revenue 215$ Net interest income, net of provision 128 Noninterest income 85 Noninterest expense 161 Net income 32$ GAAP EPS, diluted 0.23$ Cash and cash equivalents 500$ Total investment securities 1,359 Loans HFS 597 Loans and leases HFI, net 13,801 Total assets 17,631 Total deposits 13,288 Total liabilities 15,983 Total shareholders' equity 1,648$ Tangible common equity per common share 11.78$ Asset generation $2.0bn For portfolio $1.1bn Net interest margin 3.41% Tier 1 leverage ratio (bank) 9.1% Tier 1 risk-based capital ratio (bank) 13.8% Total risk-based capital ratio (bank) 14.3%
APPENDIX
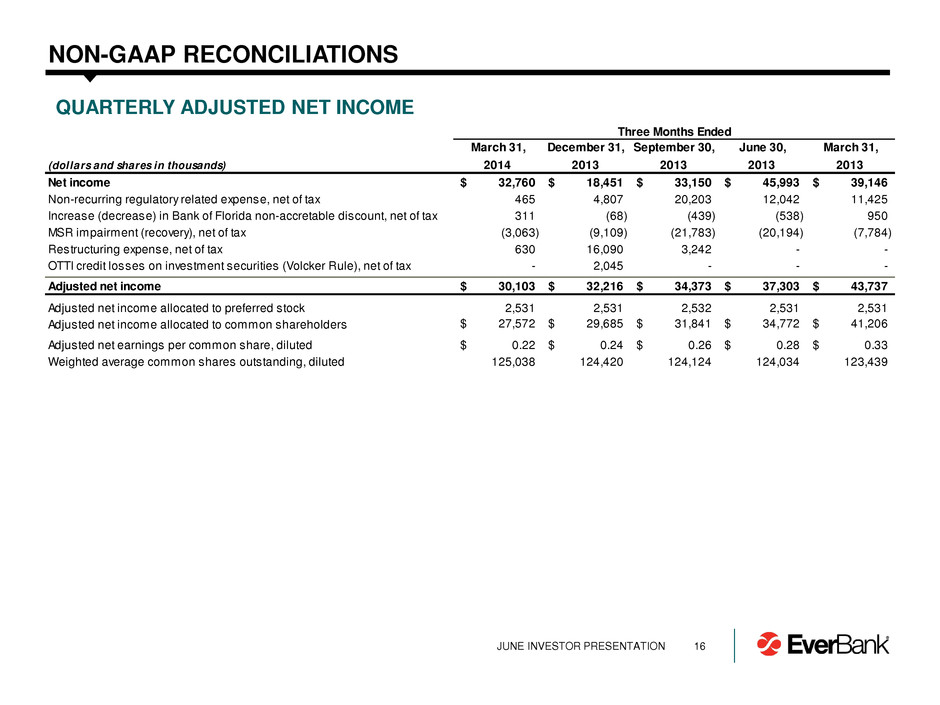
16 NON-GAAP RECONCILIATIONS QUARTERLY ADJUSTED NET INCOME JUNE INVESTOR PRESENTATION Three Months Ended March 31, December 31, September 30, June 30, March 31, (dollars and shares in thousands) 2014 2013 2013 2013 2013 Net income 32,760$ 18,451$ 33,150$ 45,993$ 39,146$ Non-recurring regulatory related expense, net of tax 465 4,807 20,203 12,042 11,425 Increase (decrease) in Bank of Florida non-accretable discount, net of tax 311 (68) (439) (538) 950 MSR impairment (recovery), net of tax (3,063) (9,109) (21,783) (20,194) (7,784) Restructuring expense, net of tax 630 16,090 3,242 - - OTTI credit losses on investment securities (Volcker Rule), net of tax - 2,045 - - - Adjusted net income 30,103$ 32,216$ 34,373$ 37,303$ 43,737$ Adjusted net income allocated to preferred stock 2,531 2,531 2,532 2,531 2,531 Adjusted net income allocated to common shareholders 27,572$ 29,685$ 31,841$ 34,772$ 41,206$ Adjusted net earnings per common share, diluted 0.22$ 0.24$ 0.26$ 0.28$ 0.33$ Weighted average common shares outstanding, diluted 125,038 124,420 124,124 124,034 123,439
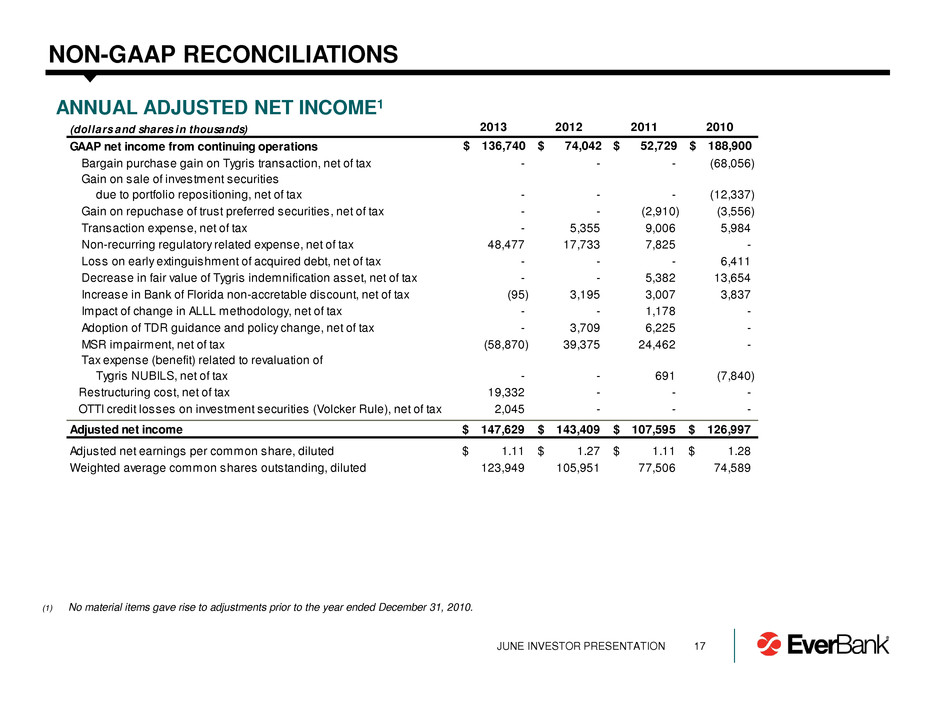
17 NON-GAAP RECONCILIATIONS ANNUAL ADJUSTED NET INCOME1 (1) No material items gave rise to adjustments prior to the year ended December 31, 2010. JUNE INVESTOR PRESENTATION (dollars and shares in thousands) 2013 2012 2011 2010 GAAP net income from continuing operations $ 136,740 $ 74,042 $ 52,729 $ 188,900 Bargain purchase gain on Tygris transaction, net of tax - - - (68,056) Gain on sale of investment securities due to portfolio repositioning, net of tax - - - (12,337) Gain on repuchase of trust preferred securities, net of tax - - (2,910) (3,556) Transaction expense, net of tax - 5,355 9,006 5,984 Non-recurring regulatory related expense, net of tax 48,477 17,733 7,825 - Loss on early extinguishment of acquired debt, net of tax - - - 6,411 Decrease in fair value of Tygris indemnification asset, net of tax - - 5,382 13,654 Increase in Bank of Florida non-accretable discount, net of tax (95) 3,195 3,007 3,837 Impact of change in ALLL methodology, net of tax - - 1,178 - Adoption of TDR guidance and policy change, net of tax - 3,709 6,225 - MSR impairment, net of tax (58,870) 39,375 24,462 - Tax expense (benefit) related to revaluation of ygris NUBILS, net of tax - - 691 (7,840) Restructuring cost, net of tax 19,332 - - - OTTI credit losses on investment securities (Volcker Rule), net of tax 2,045 - - - Adjusted net income 147,629$ 143,409$ 107,595$ 126,997$ Adjusted net earnings per common share, diluted 1.11$ 1.27$ 1.11$ 1.28$ Weighted average common shares outstanding, diluted 123,949 105,951 77,506 74,589
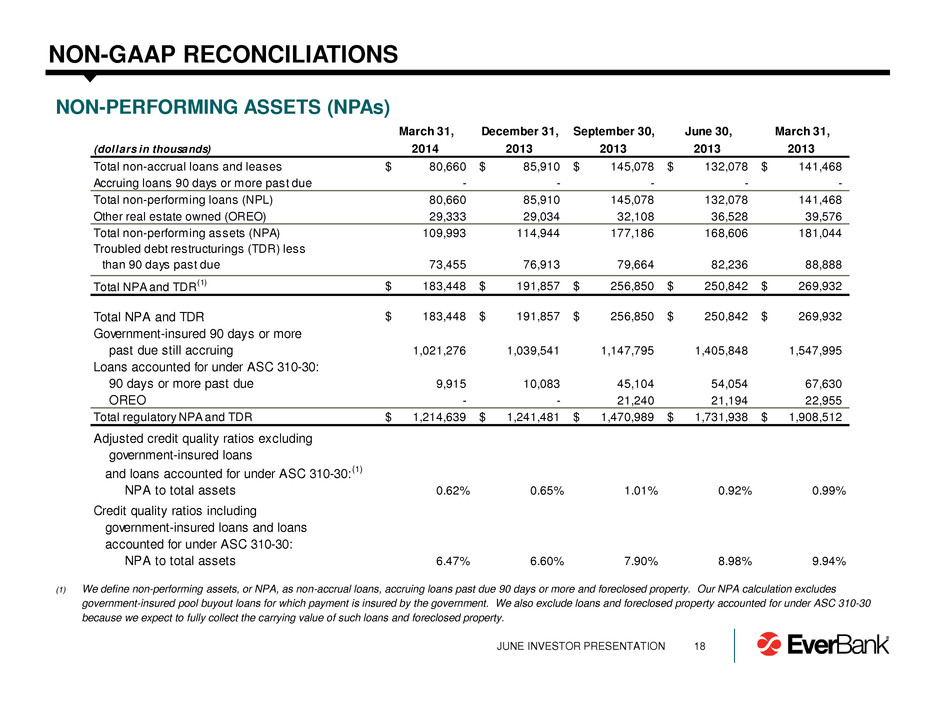
18 NON-GAAP RECONCILIATIONS NON-PERFORMING ASSETS (NPAs) JUNE INVESTOR PRESENTATION (1) We define non-performing assets, or NPA, as non-accrual loans, accruing loans past due 90 days or more and foreclosed property. Our NPA calculation excludes government-insured pool buyout loans for which payment is insured by the government. We also exclude loans and foreclosed property accounted for under ASC 310-30 because we expect to fully collect the carrying value of such loans and foreclosed property. March 31, December 31, September 30, June 30, March 31, (dollars in thousands) 2014 2013 2013 2013 2013 Total non-accrual loans and leases 80,660$ 85,910$ 145,078$ 132,078$ 141,468$ Accruing loans 90 days or more past due - - - - - Total non-performing loans (NPL) 80,660 85,910 145,078 132,078 141,468 Other real estate owned (OREO) 29,333 29,034 32,108 36,528 39,576 Total non-performing assets (NPA) 109,993 114,944 177,186 168,606 181,044 Troubled debt restructurings (TDR) less than 90 days past due 73,455 76,913 79,664 82,236 88,888 Total NPA and TDR (1) 183,448$ 191,857$ 256,850$ 250,842$ 269,932$ Total NPA and TDR 183,448$ 191,857$ 256,850$ 250,842$ 269,932$ Government-insured 90 days or more past due still accruing 1,021,276 1,039,541 1,147,795 1,405,848 1,547,995 Loans accounted for under ASC 310-30: 90 days or more past due 9,915 10,083 45,104 54,054 67,630 OREO - - 21,240 21,194 22,955 Total regulatory NPA and TDR 1,214,639$ 1,241,481$ 1,470,989$ 1,731,938$ 1,908,512$ Adjusted credit quality ratios excluding government-insured loans and loans accounted for under ASC 310-30: (1) NPA to total assets 0.62% 0.65% 1.01% 0.92% 0.99% Credit quality ratios including government-insured loans and loans accounted for under ASC 310-30: NPA to total assets 6.47% 6.60% 7.90% 8.98% 9.94%
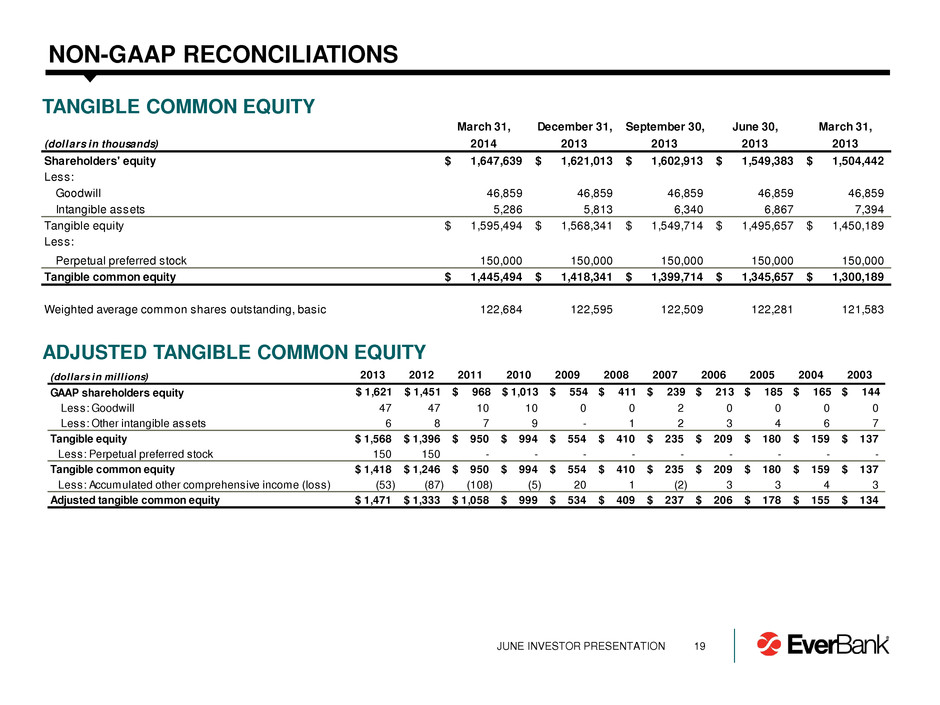
March 31, December 31, September 30, June 30, March 31, (dollars in thousands) 2014 2013 2013 2013 2013 Shareholders' equity 1,647,639$ 1,621,013$ 1,602,913$ 1,549,383$ 1,504,442$ Less: Goodwill 46,859 46,859 46,859 46,859 46,859 Intangible assets 5,286 5,813 6,340 6,867 7,394 Tangible equity 1,595,494$ 1,568,341$ 1,549,714$ 1,495,657$ 1,450,189$ Less: Perpetual preferred stock 150,000 150,000 150,000 150,000 150,000 Tangible common equity 1,445,494$ 1,418,341$ 1,399,714$ 1,345,657$ 1,300,189$ Weighted average common shares outstanding, basic 122,684 122,595 122,509 122,281 121,583 19 NON-GAAP RECONCILIATIONS ADJUSTED TANGIBLE COMMON EQUITY (dollars in millions) 2013 2012 20 1 2010 2009 2008 2007 2006 005 2004 2003 GAAP sharehold rs equity $ 1,621 $ 1,451 $ 968 $ 1,013 $ 5 4 $ 411 $ 239 $ 213 $ 85 $ 165 $ 144 Less: Goodwill 47 47 10 10 0 0 2 0 0 0 0 Less: Other intangible assets 6 8 7 9 - 1 2 3 4 6 7 Tangible equity 1,568$ 1,396$ 950$ 994$ 554$ 410$ 235$ 209$ 180$ 159$ 137$ Less: Perpetual preferred stock 150 150 - - - - - - - - - Tangible common equity 1,418$ 1,246$ 950$ 994$ 554$ 410$ 235$ 209$ 180$ 159$ 137$ Less: Accumulated other comprehensive income (loss) (53) (87) (108) (5) 20 1 (2) 3 3 4 3 Adjusted tangible common equity 1,471$ 1,333$ 1,058$ 999$ 534$ 409$ 237$ 206$ 178$ 155$ 134$ TANGIBLE COMMON EQUITY JUNE INVESTOR PRESENTATION
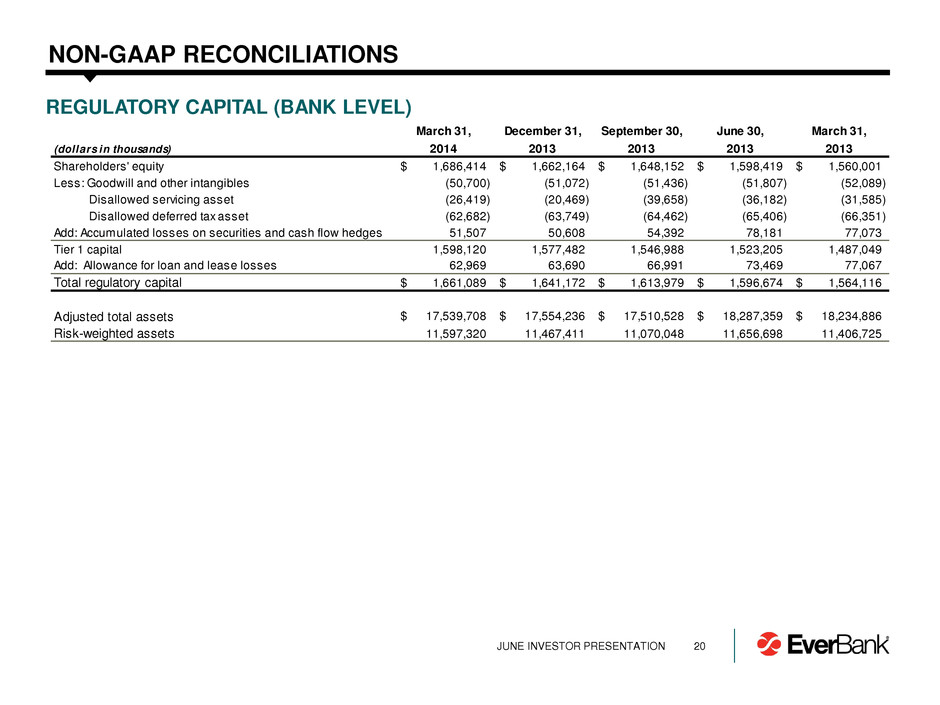
20 NON-GAAP RECONCILIATIONS REGULATORY CAPITAL (BANK LEVEL) March 31, December 31, September 30, June 30, March 31, (dollars in thousands) 2014 2013 2013 2013 2013 Shareholders' equity 1,686,414$ 1,662,164$ 1,648,152$ 1,598,419$ 1,560,001$ Less: Goodwill and other intangibles (50,700) (51,072) (51,436) (51,807) (52,089) Disallowed servicing asset (26,419) (20,469) (39,658) (36,182) (31,585) Disallowed deferred tax asset (62,682) (63,749) (64,462) (65,406) (66,351) Add: ccumulated losses on securities and cash flow hedges 51,507 50,608 54,392 78,181 77,073 Tier 1 capital 1,598,120 1,577,482 1,546,988 1,523,205 1,487,049 Add: Allowance for loan and lease losses 62,969 63,690 66,991 73,469 77,067 Total regulatory capital 1,661,089$ 1,641,172$ 1,613,979$ 1,596,674$ 1,564,116$ Adjusted total assets 17,539,708$ 17,554,236$ 17,510,528$ 18,287,359$ 18,234,886$ Risk-weighted assets 11,597,320 11,467,411 11,070,048 11,656,698 11,406,725 JUNE INVESTOR PRESENTATION
21 DISCLAIMER THIS PRESENTATION HAS BEEN PREPARED BY EVERBANK FINANCIAL CORP ("EVERBANK" OR THE “COMPANY”) SOLELY FOR INFORMATIONAL PURPOSES BASED ON ITS OWN INFORMATION, AS WELL AS INFORMATION FROM PUBLIC SOURCES. THIS PRESENTATION HAS BEEN PREPARED TO ASSIST INTERESTED PARTIES IN MAKING THEIR OWN EVALUATION OF EVERBANK AND DOES NOT PURPORT TO CONTAIN ALL OF THE INFORMATION THAT MAY BE RELEVANT. IN ALL CASES, INTERESTED PARTIES SHOULD CONDUCT THEIR OWN INVESTIGATION AND ANALYSIS OF EVERBANK AND THE DATA SET FORTH IN THIS PRESENTATION AND OTHER INFORMATION PROVIDED BY OR ON BEHALF OF EVERBANK. EXCEPT AS OTHERWISE INDICATED, THIS PRESENTATION SPEAKS AS OF THE DATE HEREOF. THE DELIVERY OF THIS PRESENTATION SHALL NOT, UNDER ANY CIRCUMSTANCES, CREATE ANY IMPLICATION THAT THERE WILL BE NO CHANGE IN THE AFFAIRS OF THE COMPANY AFTER THE DATE HEREOF. CERTAIN OF THE INFORMATION CONTAINED HEREIN MAY BE DERIVED FROM INFORMATION PROVIDED BY INDUSTRY SOURCES. EVERBANK BELIEVES THAT SUCH INFORMATION IS ACCURATE AND THAT THE SOURCES FROM WHICH IT HAS BEEN OBTAINED ARE RELIABLE. EVERBANK CANNOT GUARANTEE THE ACCURACY OF SUCH INFORMATION, HOWEVER, AND HAS NOT INDEPENDENTLY VERIFIED SUCH INFORMATION. THIS PRESENTATION MAY CONTAIN CERTAIN FORWARD-LOOKING STATEMENTS AS DEFINED IN THE PRIVATE SECURITIES LITIGATION REFORM ACT OF 1995, AND SUCH STATEMENTS ARE INTENDED TO BE COVERED BY THE SAFE HARBOR PROVIDED BY THE SAME. WORDS SUCH AS “OUTLOOK,” “BELIEVES,” “EXPECTS,” “POTENTIAL,” “CONTINUES,” “MAY,” “WILL,” “COULD,” “SHOULD,” “SEEKS,” “APPROXIMATELY,” “PREDICTS,” “INTENDS,” “PLANS,” “ESTIMATES,” “ANTICIPATES” OR THE NEGATIVE VERSION OF THOSE WORDS OR OTHER COMPARABLE WORDS ARE INTENDED TO IDENTIFY FORWARD-LOOKING STATEMENTS BUT ARE NOT THE EXCLUSIVE MEANS OF IDENTIFYING SUCH STATEMENTS. THESE FORWARD-LOOKING STATEMENTS ARE NOT HISTORICAL FACTS, AND ARE BASED ON CURRENT EXPECTATIONS, ESTIMATES AND PROJECTIONS ABOUT THE COMPANY’S INDUSTRY, MANAGEMENT’S BELIEFS AND CERTAIN ASSUMPTIONS MADE BY MANAGEMENT, MANY OF WHICH, BY THEIR NATURE, ARE INHERENTLY UNCERTAIN AND BEYOND THE COMPANY’S CONTROL. ACCORDINGLY, YOU ARE CAUTIONED THAT ANY SUCH FORWARD-LOOKING STATEMENTS ARE NOT GUARANTEES OF FUTURE PERFORMANCE AND ARE SUBJECT TO CERTAIN RISKS, UNCERTAINTIES AND ASSUMPTIONS THAT ARE DIFFICULT TO PREDICT. ALTHOUGH THE COMPANY BELIEVES THAT THE EXPECTATIONS REFLECTED IN SUCH FORWARD-LOOKING STATEMENTS ARE REASONABLE AS OF THE DATE MADE, EXPECTATIONS MAY PROVE TO HAVE BEEN MATERIALLY DIFFERENT FROM THE RESULTS EXPRESSED OR IMPLIED BY SUCH FORWARD-LOOKING STATEMENTS. UNLESS OTHERWISE REQUIRED BY LAW, EVERBANK ALSO DISCLAIMS ANY OBLIGATION TO UPDATE ITS VIEW OF ANY SUCH RISKS OR UNCERTAINTIES OR TO ANNOUNCE PUBLICLY THE RESULT OF ANY REVISIONS TO THE FORWARD-LOOKING STATEMENTS MADE IN THIS PRESENTATION. INTERESTED PARTIES SHOULD NOT PLACE UNDUE RELIANCE ON ANY FORWARD-LOOKING STATEMENT AND SHOULD CONSIDER THE UNCERTAINTIES AND RISKS DISCUSSED UNDER THE HEADINGS “RISK FACTORS” AND “MANAGEMENT’S DISCUSSION AND ANALYSIS OF FINANCIAL CONDITION AND RESULTS OF OPERATIONS” IN EVERBANK’S ANNUAL REPORT ON FORM 10-K, QUARTERLY REPORTS ON FORM 10-Q AND IN OTHER FILINGS WITH THE SECURITIES AND EXCHANGE COMMISSION. JUNE INVESTOR PRESENTATION
