Attached files
| file | filename |
|---|---|
| 8-K - 8-K - LCNB CORP | lcnb-x8xkinvestorpresentat.htm |

Non-Deal Roadshow Presentation June 6, 2014

li i i d h l i f i i i d i i Forward-Looking Statements This presentation as well as other written or oral communications made from time to time by us, may contain certain forward-looking information within the meaning of the Securities Act of 1933, as amended, and the Securities Exchange Act of 1934, as amended. These statements relate to future events or future predictions, including events or predictions relating to our future financial performance, and are generally identifiable by the use of forward-looking terminology such as “believes,” “expects,” “may,” “will,” “should,” “plan,” “intend,” “target,” or “anticipates” or the negative thereof or comparable terminology, or by discussion of strategy or goals or other future events, circumstances or effects. These forward-looking statements regarding future events and circumstances involve known and unknown risks, uncertainties and other factors that may cause our actual results, levels of activity, financial condition, performance or achievements to be materially different from any future results, levels of activity, financial condition, performance or achievements expressed or implied by such forward-looking statements. This information is based on various assumptions, estimates or judgments by us that may not prove to be correct. Important factors to consider and evaluate in such forward-looking statements include: · changes in competitive and market factors that might affect our results of operations; · changes in laws and regulations, including without limitation changes in capital requirements under the Basel III capital standards; · changes in our business strategy or an inability to execute our strategy due to the occurrence of unanticipated events; · our ability to identify potential candidates for, and consummate, acquisition or investment transactions; · the timing of acquisition or investment transactions; · our failure to complete any or all of the transactions described herein on the terms currently contemplated; · local, regional and national economic conditions and events and the impact they may have on us and our customers; · targeted or estimated returns on assets and equity, growth rates and future asset levels; · our ability to attract deposits and other sources of liquidity and capital; · changes in the financial performance and/or condition of our borrowers; · changes in the level of non-performing and classified assets and charge-offs; · changes in estimates of future loan loss reserve requirements based upon the periodic review thereof under relevant regulatory and accounting requirements, as well as changes in borrowers payment behavior and creditworthiness; · changes in our capital structure resulting from future capital offerings or acquisitions; · inflation, interest rate, securities market and monetary fluctuations; · the affects on our mortgage warehouse lending and retail mortgage businesses of changes in the mortgage origination markets, including changes due to changes in monetary policies, interest rates an t e regulation of mortgage originators, services and securitizers; 1

expected Forward-Looking Statements · timely development and acceptance of new banking products and services and perceived overall value of these products and services by users; · changes in consumer spending, borrowing and saving habits; · technological changes; · our ability to grow, increase market share and control expenses, and maintain sufficient liquidity; · volatility in the credit and equity markets and its effect on the general economy; · the potential for customer fraud; · effects of changes in accounting policies and practices, as may be adopted by the regulatory agencies, as well as the Public Company Accounting Oversight Board, the Financial Accounting Standards Board and other accounting standard setters; · the businesses of the Bank and any acquisition targets or merger partners and subsidiaries not integrating successfully or such integration being more difficult, time-consuming or costly than expected; · our ability to integrate currently contemplated and future acquisition targets may be unsuccessful, or may be more difficult, time-consuming or costly than ted; and · material differences in the actual financial results of merger and acquisition activities compared with expectations. These forward-looking statements are subject to significant uncertainties and contingencies, many of which are beyond our control. Although we believe that the expectations reflected in the forward-looking statements are reasonable, we cannot guarantee future results, levels of activity, financial condition, performance or achievements. Accordingly, there can be no assurance that actual results will meet our expectations or will not be materially lower than the results contemplated in this presentation. You are cautioned not to place undue reliance on these forward-looking statements, which speak only as of the date of this document or, in the case of documents referred to or incorporated by reference, the dates of those documents. We do not undertake any obligation to release publicly any revisions to these forward-looking statements to reflect events or circumstances after the date of this document or to reflect the occurrence of unanticipated events, except as may be required under applicable law. 2

Executive Summary

C i t tl t bl di id d T 6 ti h f 32 f i LCNB Investment Highlights 135 year-old community bank located in attractive markets in southwestern Ohio with good demographics, stable home prices, and sound economic activity Stable & Attractive Markets High and consistent profitability driven by disciplined organic loan growth, diversified revenue base, and low-cost, core deposits – 37 of the last 38 years with 1% or above ROAA1 Cons sten y s a e viden s Consistent, High- Performing Franchise Strong asset quality and capital ratios driven by conservative underwriting of loans and robust earnings Leverageable platform and ability to drive earnings growth through acquisitions Recognized by American Banker as one of the top 200 community banks in the nation2 Seasoned management team with extensive history of working together op executives have an average of years of experience LCNB viewed as “acquirer of choice” in its markets – Completed 2 acquisitions in last 15 months3 Target-rich environment for additional acquisitions – 29 banks with assets between $200 million and $800 million in and around current markets4 – Highly selective in choosing right partner Financially Attractive Acquisitions Source: SNL Financial, Company documents. 1 LCNB data from 1975 to 2013. 2 American Banker May 2014. Defined as exchange listed community banks with assets less than $2.0 billion. Ranked by average 3 year ROAE as of year end 2013. 3 Eaton Nation Bank and Trust acquisition completed 1/24/2014 and First Capital Bancshares acquisition completed 1/11/2013. 4 Defined as banks and thrifts in the following MSAs: Athens OH, Bellefontaine OH, Celina OH, Chillicothe OH, Cincinnati OH, Columbus OH, Dayton OH, Greenville OH, Huntington-Ashland OH, Point Pleasant OH, Portsmouth OH, Sidney OH, Springfield OH, Urbana OH, Wapakoneta OH, Washington Court House OH and Wilmington OH. 4 Seasoned Management Team

Highlights of 1Q 2014 Acquisition of Eaton National Bank and Trust Co. Add d i t l $183 illi i t $124 illi i l $134 illi i d it d 5 b h Common Equity Raise C it i d t h i f $17 50 14% i t LCNB’ t t di i f Recent Events LCNB reported quarterly core EPS of $0.24. Core net income increased from $2.1 million in 1Q 2013 to $2.2 million in 1Q 2014 Net interest income continued to increase, growing from $7.0 million in 1Q 2013 to $8.4 million in 1Q 2014, due primarily to higher earning assets Quarterly core ROAA and core ROAE remained strong at 0.84% and 7.5% Asset quality remained strong with 1Q 2014 NPAs/Assets of 0.63%, representing top 20% of all publicly traded, U.S. banks; Net charge-offs continued to remain low, with 1Q 2014 charge-off ratio of 0.18% LCNB continued to be very well capitalized, with 1Q 2014 tangible common equity to tangible assets of 8.6% Closed acquisition of Eaton National Bank and Trust Co. on January 24, 2014 – e approx ma e y $183 mil ion in assets, $124 mil ion in loans, $134 million in deposits and 5 branches – Purchase price of $24.8 million (100% cash), equal to 1.42x tangible book value – Expected to be immediately accretive to earnings Raised $28.8 million of common equity on October 31, 2013 – Proceeds were used to finance the acquisition of Eaton National – ommon equity raise at a per share price of $1 .50, a 14% premium to LC B’s current trading price of $15.351 Source: SNL Financial, Company documents. 1 Market data as of 5/30/2014. 5
Franchise Overview

LCNB Branch Map LCNB Deposits in Top Three Markets Major business lines include: : 1 14 release The LCNB Franchise $1,134 million in assets and $985 million in deposits headquartered in Lebanon, OH, in Warren County 36 branches in southwestern Ohio, primarily in and around the Cincinnati MSA 11th largest bank in the Cincinnati MSA by deposits – Warren County, inside Cincinnati MSA, is #2 fastest growing county in Ohio with 5.35% projected population growth rate compared to the national average of 3.47% – Warren County also possesses the #2 highest median household income in Ohio at $66,787, compared to the national average of $50,157 lines include Deposits ($000s) Percent of Franchise (%) Market Branches 2013 Rank – Retail – Commercial – Trust and Wealth Management with $263 million under management and an Investment Services Division with $121 million1 Cincinnati 22 11 630,448 65% Dayton 7 10 195,825 20% Chillicothe 5 4 117,459 12% Source: SNL Financial, Company documents. 1 Source LCNB Q earnings release. 7 T otal in Top 3 34 943,732 97% re rk

Unemployment Rate Median Household Income $0 2013-2018 Projected Population Change Cincinnati Represents a Vibrant, Attractive Market... Cincinnati’s unemployment rate of 5.8% was below both the national average of 6.7% and Ohio’s at 6.1% in March Apart from the15 Fortune 1000 companies headquartered there, Cincinnati is home to numerous small and medium-sized companies 11.0% $60,000 LCNB Franchise1 $57,898 $50,000 10.0% $40,000 $30,000 9.0% $20,000 $10,000 8.0% Cincinnati OH U.S. 7.0% 6.7% 6.1% 5.8% 4.0% 3.5% 6.0% 3.0% 2.5% 2.0% 1.5% 1.0% 5.0% Cin cin n ati MSA (5.8%) (6.1%) (6.7%) Oh io U.S. 0.5% 0.0% Cincinnati OH U.S. 8 Source: SNL Financial, bls.gov. 1 Weighted by county. J a n 1 0 M a r 1 0 M a y 1 0 J u l 1 0 S e p 1 0 N o v 1 0 J a n 1 1 M a r 1 1 M a y 1 1 J u l 1 1 S e p 1 1 N o v 1 1 J a n 1 2 M a r 1 2 M a y 1 2 J u l 1 2 S e p 1 2 N o v 1 2 J a n 1 3 M a r 1 3 M a y 1 3 J u l 1 3 S e p 1 3 N o v 1 3 J a n 1 4 M a r 1 4 3.6% LCNB Franchise1 2.6% 1.9% 0.7% $52,513 $51,314 $46,291
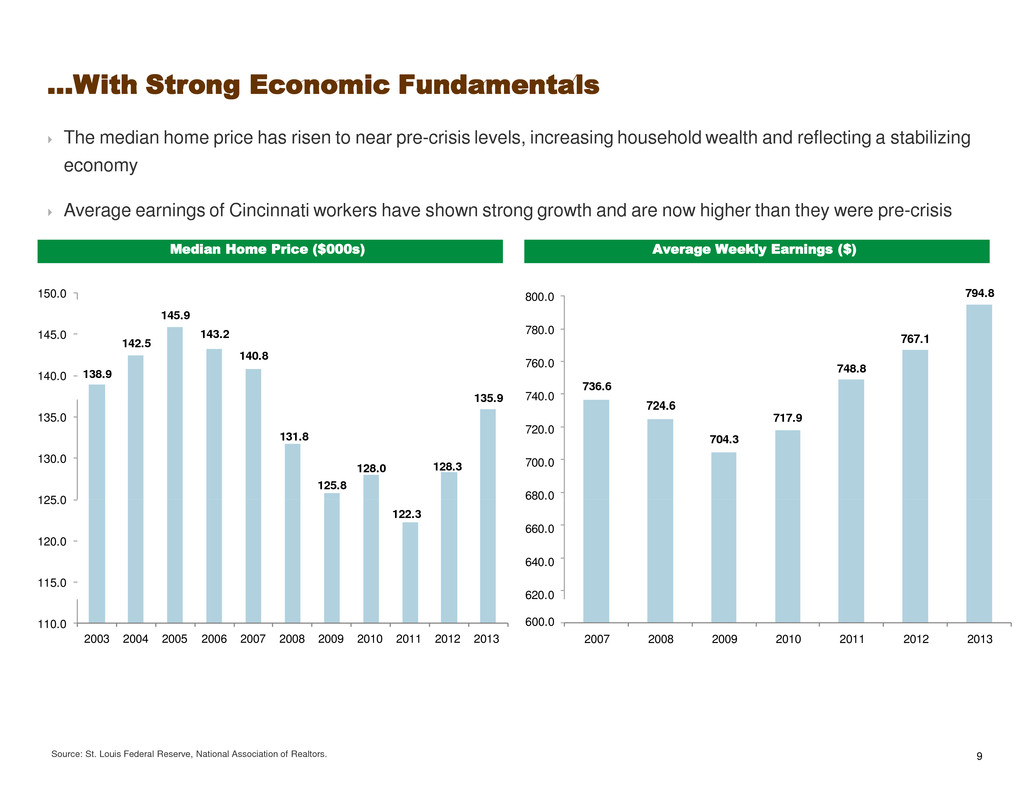
Average Weekly Earnings ($) Median Home Price ($000s) 125 0 ...With Strong Economic Fundamentals The median home price has risen to near pre-crisis levels, increasing household wealth and reflecting a stabilizing economy Average earnings of Cincinnati workers have shown strong growth and are now higher than they were pre-crisis 794.8 150.0 800.0 145.9 145.0 140.0 135.9 135.0 130.0 . 120.0 115.0 110.0 2003 2004 2005 2006 2007 2008 2009 2010 2011 2012 2013 2007 2008 2009 2010 2011 2012 2013 Source: St. Louis Federal Reserve, National Association of Realtors. 9 780.0 760.0 740.0 720.0 700.0 680.0 660.0 640.0 620.0 767.1 142.5 143.2 140.8 748.8 138.9 736.6 131.8 128.0 128.3 125.8 724.6 717.9 704.3 122.3 600.0
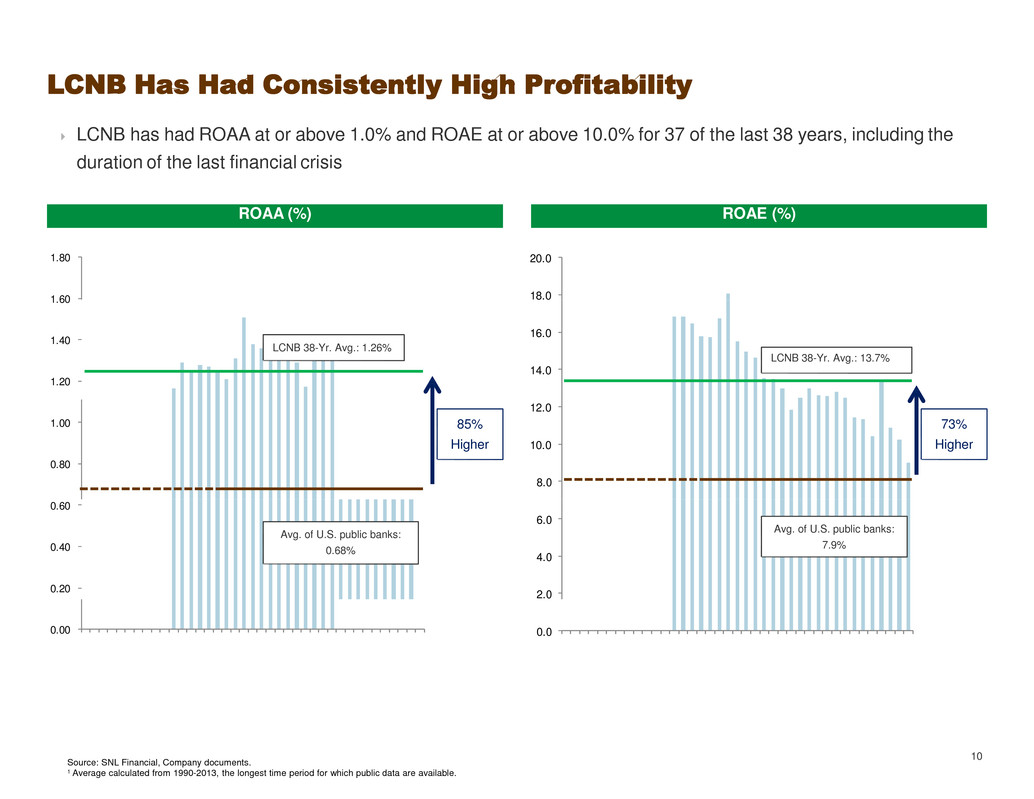
LCNB Has Had Consistently High Profitability LCNB has had ROAA at or above 1.0% and ROAE at or above 10.0% for 37 of the last 38 years, including the duration of the last financial crisis 1.80 20.0 18.0 1.60 16.0 1.40 14.0 1.20 12.0 1.00 85% Higher 73% Higher 10.0 0.80 8.0 0.60 6.0 0.40 4.0 0.20 2.0 0.00 0.0 10 Source: SNL Financial, Company documents. 1 Average calculated from 1990-2013, the longest time period for which public data are available. 1 9 7 5 1 9 7 7 1 9 7 9 1 9 8 1 1 9 8 3 1 9 8 5 1 9 8 7 1 9 8 9 1 9 9 1 1 9 9 3 1 9 9 5 1 9 9 7 1 9 9 9 2 0 0 1 2 0 0 3 2 0 0 5 2 0 0 7 2 0 0 9 2 0 1 1 2 0 1 3 1 9 7 5 1 9 7 7 1 9 7 9 1 9 8 1 1 9 8 3 1 9 8 5 1 9 8 7 1 9 8 9 1 9 9 1 1 9 9 3 1 9 9 5 1 9 9 7 1 9 9 9 2 0 0 1 2 0 0 3 2 0 0 5 2 0 0 7 2 0 0 9 2 0 1 1 2 0 1 3 LCNB 38-Yr. Avg.: 13.7% Avg. of U.S. public banks: 7.9% LCNB 38-Yr. Avg.: 1.26% Avg. of U.S. public banks: 0.68% ROAA (%) ROAE (%)
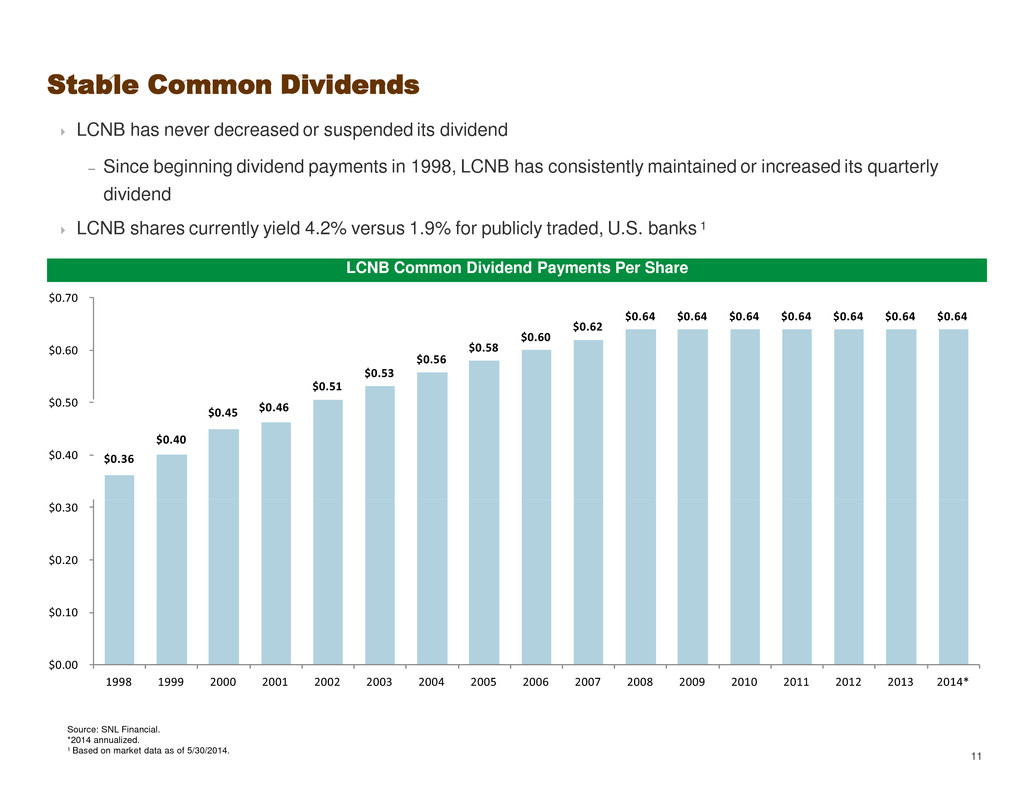
$0 50 Stable Common Dividends LCNB has never decreased or suspended its dividend – Since beginning dividend payments in 1998, LCNB has consistently maintained or increased its quarterly dividend LCNB shares currently yield 4.2% versus 1.9% for publicly traded, U.S. banks 1 $0.70 $0.62 $0.60 $0.58 $0.60 $0.56 $0.53 $0.51 . $0.40 $0.30 $0.20 $0.10 $0.00 1998 1999 2000 2001 2002 2003 2004 2005 2006 2007 2008 2009 2010 2011 2012 2013 2014* Source: SNL Financial. *2014 annualized. 1 Based on market data as of 5/30/2014. 11 $0.64 $0.64 $0.64 $0.64 $0.64 $0.64 $0.64 $0.45 $0.46 $0.40 $0.36 LCNB Common Dividend Payments Per Share

Secondary Market Head of Real Estate Lending and Chief Lending Seasoned Management Team Experienced management team with an average of 32 years of banking experience and many executives have worked together for over 20 years 12 Name Title Experience Background Stephen P. Wilson Chairman & CEO 38 Joined LCNB in 1975 and LCNB Board of Directors in 1982. Former Chairman of the American Bankers Association (2010 - 2011) and a former Board Member of the Federal Reserve Bank of Cleveland. Steve P. Foster President, COO & Director 39 Joined LCNB in 1977 and has served as Internal Auditor, Branch Manager, Loan Officer and CFO. He was elected to the LCNB Board of Directors in 2005. Robert C. Haines Chief Financial Officer 21 Joined LCNB in 1992 and has served as Internal Auditor, Assistant Trust Officer, Vice President of IT, and CFO. Bernard H. Wright, Jr. Sr. Executive Vice President 38 Joined LCNB in 1977 and serves as Head of the trust department, Investment Officer for the bank's investment portfolio, and as LCNB’s primary contact with its transfer agent. Eric J. Meilstrup Executive Vice President 25 Joined LCNB in 1988 and has served in Item Processing and various positions in Operations. Currently runs LCNB Operations. Matthew P. Layer Executive Vice President 31 Joined LCNB in 1982 and has served as Branch Manager, Head of Secondary arket, ead of eal Estate Lending, and hief Lending Officer.

$8 0 Case Study: Leveraging the Platform Through Acquisitions Acquisition of Eaton National (completed January 24, 2014) added approximately $183 million in assets, $124 million in loans and $134 million in deposits Acquisition of First Capital (completed January 11, 2013) added approximately $151 million in assets, $99 million in loans and $137 million in deposits $700 $5 $566 $556 $600 $550 $821 $808 $801 $500 $400 $300 $200 $100 $0 $0 Dec 12 Mar 13 Jun 13 Sep 13 Dec 13 Mar 14 Dec 12 Mar 13 Jun 13 Sep 13 Dec 13 Mar 14 Acquisition Closed Acquisition Closed Acquisition Closed $10.0 8.9 $2.3 $2.2 . $6.0 $4.0 $2.0 $0.0 $0.0 Dec 12 Mar 13 Jun 13 Sep 13 Dec 13 Mar 14 Dec 12 Mar 13 Jun 13 Sep 13 Dec 13 Mar 14 13 Source: SNL Financial. 1 Revenue calculated as net interest income plus noninterest income. Excludes gain on sale of securities and non-recurring items. $ $3.0 First Capital $2 Avg.: $2.3 Eaton National $2.5 $2.4 $9.4 $9.4 $9.7 $2.5 $7.9 .1 $2.0 $1.5 $1.0 $1.6 $0.5 Core Net Income ($MM) Revenue ($MM) $12.0 First Capital Avg.: $9.4 Eaton National Acquisition Closed $10.4 Avg.: $562 74 $1,200 First Capital Eaton National Acquisition Closed Acquisition Closed Avg.: $804 $985 $1,000 $800 $600 $400 $78 6 $454 $671 $200 Deposits ($MM) Gross Loans ($MM) $800 First Capital Acquisition Closed Eaton National Acquisition Closed $685
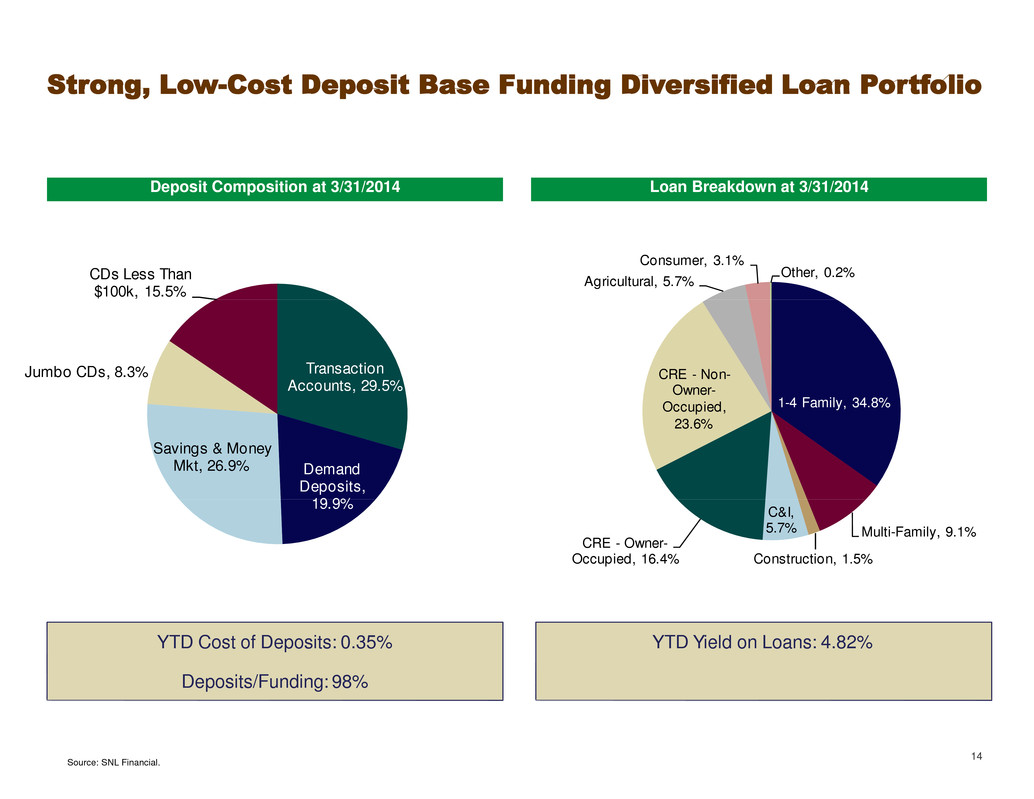
19 9% Strong, Low-Cost Deposit Base Funding Diversified Loan Portfolio Consumer, 3.1% Agricultural, 5.7% Other, 0.2% CDs Less Than $100k, 15.5% Transaction Accounts, 29.5% Jumbo CDs, 8.3% CRE - Non- Owner- 1-4 Family, 34.8% Occupied, 23.6% Savings & Money Mkt, 26.9% Demand Deposits, . C&I, 5.7% Multi-Family, 9.1% CRE - Owner- Occupied, 16.4% Construction, 1.5% 14 Source: SNL Financial. YTD Cost of Deposits: 0.35% Deposits/Funding: 98% YTD Yield on Loans: 4.82% Deposit Composition at 3/31/2014 Loan Breakdown at 3/31/2014
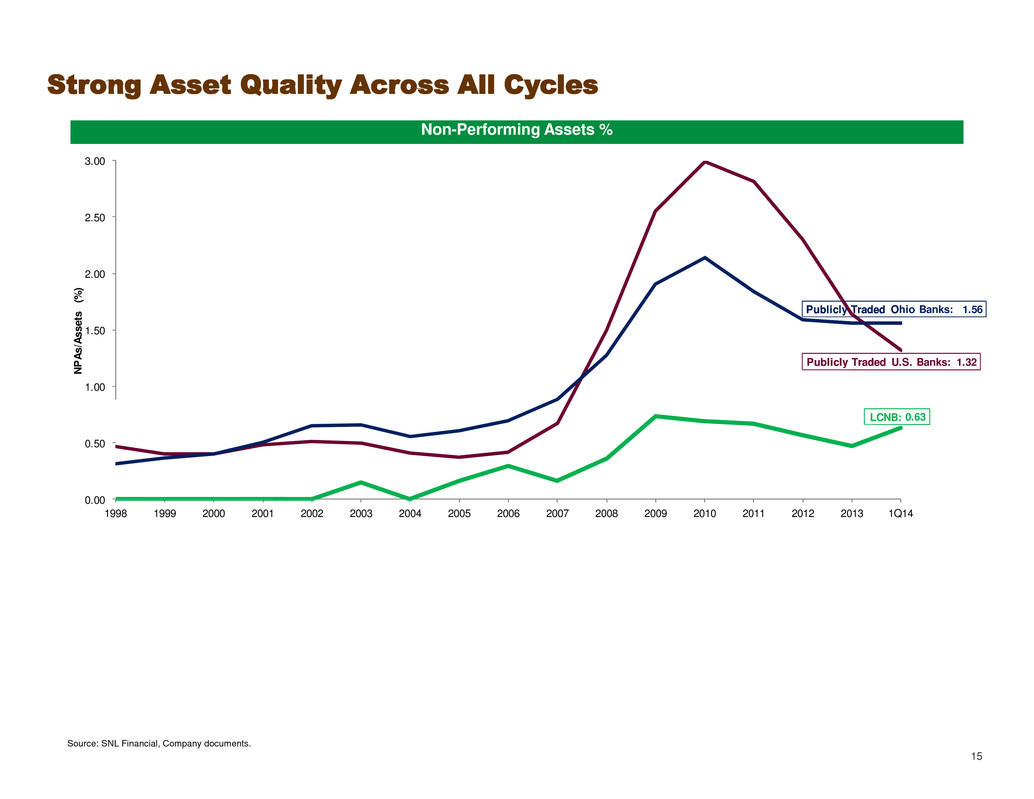
( Strong Asset Quality Across All Cycles 3.00 2.50 2.00 Publicly Traded Ohio Banks: 1.56 1.50 Publicly Traded U.S. Banks: 1.32 1.00 0.63 0.50 0.00 1998 1999 2000 2001 2002 2003 2004 2005 2006 2007 2008 2009 2010 2011 2012 2013 1Q14 Source: SNL Financial, Company documents. 15 N P A s /A s s e ts (% ) LCNB: Non-Performing Assets %

DC - Update Current Markets Present Further Consolidation Opportunities Southwestern Ohio market has 29 institutions with assets between $200 million and $800 million1 – Many targets too small to have meaningful interest from larger banks – Lower-risk transactions into known markets driven primarily by cost savings – Very familiar with most community bank targets – Highly selective in choosing right partner Total Number of Institutions: 29 Total Assets: $11.5 billion Total Number of Branches: 204 LCNB Potential Targets1 Source: SNL Financial. 1 Defined as banks and thrifts with assets between $200mm and $800mm in the following MSAs: Athens OH, Bellefontaine OH, Celina OH, Chillicothe OH, Cincinnati OH, Columbus OH, Dayton OH, Greenville OH, Huntington- Ashland OH, Point Pleasant OH, Portsmouth OH, Sidney OH, Springfield OH, Urbana OH, Wapakoneta OH, Washington Court House OH and Wilmington OH. 16 LCNB Acquisition Opportunities
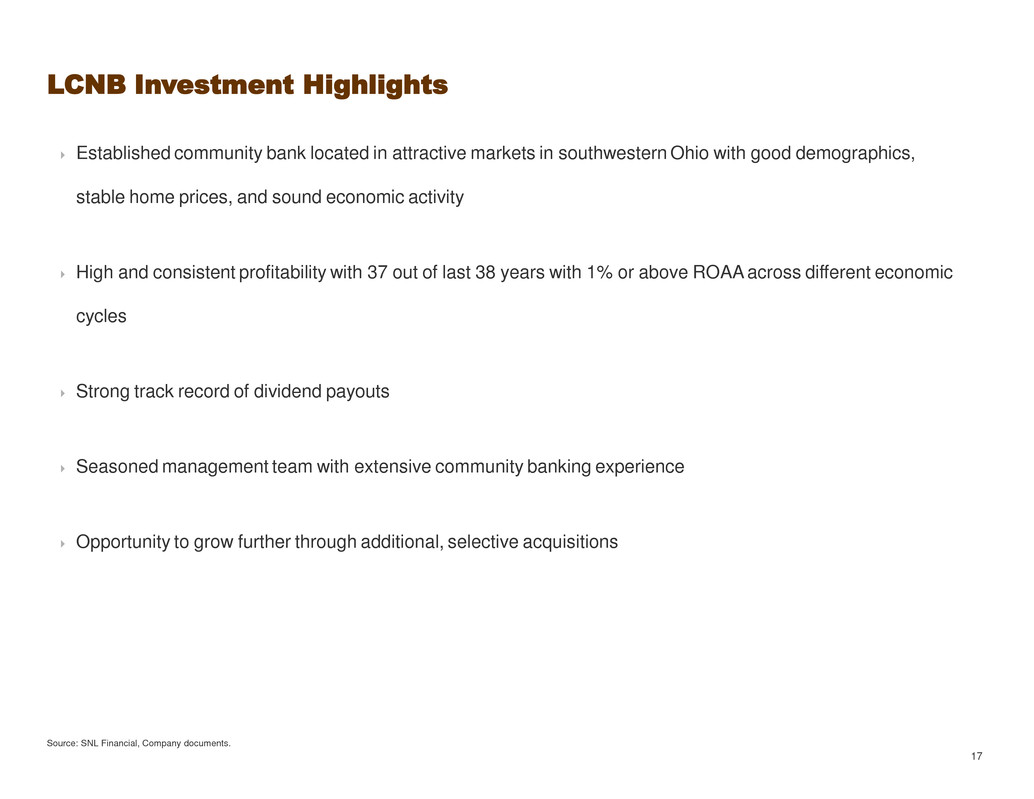
LCNB Investment Highlights Established community bank located in attractive markets in southwestern Ohio with good demographics, stable home prices, and sound economic activity High and consistent profitability with 37 out of last 38 years with 1% or above ROAA across different economic cycles Strong track record of dividend payouts Seasoned management team with extensive community banking experience Opportunity to grow further through additional, selective acquisitions Source: SNL Financial, Company documents. 17

Appendix

Financial Highlights Source: SNL Financial. 19 Year Ended 12/31/2010 12/31/2011 12/31/2012 12/31/2013 YTD 3/31/2014 Balance Sheet ($000) Total Assets 760,134 791,570 788,637 932,338 1,133,508 Gross Loans 454,991 461,262 453,783 570,766 681,826 Total Deposits 638,539 663,562 671,471 785,761 984,514 Total Equity 70,707 77,960 82,006 118,873 119,761 Profitability (%) Net Income ($000) 9,373 8,115 8,270 8,780 1,323 ROAA 1.22 1.02 1.02 0.93 0.49 ROAE 13.4 10.9 10.2 9.0 4.4 Net Interest Margin 3.89 3.70 3.52 3.57 3.61 Efficiency Ratio 60.1 63.4 63.1 63.1 68.5 Balance Sheet Ratios and Capital (%) Loans/Deposits 71.3 69.5 67.6 73.1 69.6 Tang Common Equity/Tang Assets 8.6 9.2 9.7 11.2 8.6 Tier 1 Ratio 13.3 13.9 15.1 18.0 12.6 Risk-based Capital Ratio 13.8 14.5 15.9 18.7 13.1 Leverage Ratio 8.1 8.5 9.0 11.1 8.5 Asset Quality (%) NPAs/Assets 0.69 0.67 0.57 0.47 0.63 NCOs/Avg Loans 0.44 0.39 0.18 0.08 0.18 Loan Loss Reserves/Gross Loans 0.58 0.64 0.76 0.62 0.49 Per Share Information ($) Book Value per Share 10.57 11.63 12.18 12.80 12.89 Tangible Book Value per Share 9.66 10.73 11.29 11.02 9.44 Common Dividends Declared per Share 0.64 0.64 0.64 0.64 0.16 Core EPS 1.23 1.12 1.05 1.16 0.24

Securities Portfolio FHLB Stock 1.1% Other 1.7% FRB Stock at Cost 0.5% Held to Maturity 5.0% FHLB Stock at Cost 1.1% US Treasury 10.6% Non-Taxable Municipals 30.3% U.S. Agency Notes 36.9% Available f or Sale 93.5% U.S. Agency MBS 13.2% Taxable Municipals 5.2% Certif icates of Deposit 0.9% 20 Source: SNL Financial. YTD Yield on Securities: 2.52% Securities Portfolio: $332 Million Securities Portfolio Composition at 3/31/2014 Securities Portfolio Composition at 3/31/2014

L R li d G i S iti ($587) ($58) $4 Non-GAAP Disclosure Reconciliations ($000s, Except per Share) Dec 12 Mar 13 Jun 13 Sep 13 Dec 13 Mar 14 Net Income $2,159 $1,728 $2,348 $2,357 $2,347 $1,323 Less: ea ze a ns on ecurities ($967) ($108) ( ) ($307) $4 Less: Nonrecurring Revenue Plus: Nonrecurring Expenses Plus: Amortization of Intangibles $0 $79 $14 $0 $1,055 $76 $0 $271 $85 $0 $0 $87 $0 $107 $86 $0 $1,292 $126 Total Adjustments ($874) $544 $248 $29 ($114) $1,422 After-Tax Adjustments Assumed Tax Rate ($568) 35% $354 35% $161 35% $19 35% ($74) 35% $924 35% Average Diluted Shares 6,819,117 7,610,626 7,759,438 7,787,098 8,755,416 9,413,049 Average Assets Average Equity 802,915 82,069 924,606 93,335 953,807 95,041 946,496 91,048 937,344 105,544 1,071,198 119,959 Source: SNL Financial. 21 Core Return on Average Assets 0.79% 0.90% 1.05% 1.00% 0.97% 0.84% Core Return on Average Equity 7.75% 8.92% 10.56% 10.44% 8.61% 7.49% Core Earnings per Share $0.23 $0.27 $0.32 $0.31 $0.26 $0.24 Core Net Income $1,591 $2,082 $2,509 $2,376 $2,273 $2,247 Reconciliation of Non-GAAP Items Shown on a Quarterly Basis

Core Earnings per Share $1 12 $1 16 Non-GAAP Disclosure Reconciliations ($000s, Except per Share) 2010 2011 2012 2013 Net Income $9,373 $8,115 $8,270 $8,780 Less: Realized Gains on Securities Less: Nonrecurring Revenue Plus: Nonrecurring Expenses Plus: Amortization of Intangibles ($948) ($792) $0 $57 ($948) $0 $0 $58 ($1,853) $0 $79 $57 ($1,060) $0 $1,433 $334 Total Adjustments ($1,683) ($890) ($1,717) $707 After-Tax Adjustments Assumed Tax Rate ($1,094) 35% ($579) 35% ($1,116) 35% $460 35% Average Diluted Shares 6,736,622 6,751,599 6,802,475 7,982,997 Source: SNL Financial. 22 Core Earnings per Share $1.23 $1.12 $1.05 $1.16 Core Net Income $8,279 $7,537 $7,154 $9,240 Reconciliation of Non-GAAP Items Shown on an Annual Basis
