Attached files
| file | filename |
|---|---|
| 8-K - 8-K - CYS Investments, Inc. | d738646d8k.htm |
  Kevin Grant
Chief Executive Officer
KBW Mortgage Finance Conference
June 3, 2014
Exhibit 99.1
Investment Outlook |
  Forward-Looking
Statements This
presentation
contains
forward-looking
statements,
within
the
meaning
of
Section
27A
of
the
Securities
Act
of
1933,
as
amended,
and
Section
21E
of
the
Securities
Exchange
Act
of
1934,
as
amended,
that
are
based
on
management’s
beliefs
and
assumptions,
current
expectations,
estimates
and
projections.
Such
statements,
including
information
relating
to
the
Company’s
expectations
for
distributions,
availability
and
cost
of
financing,
scalability
of
management,
market
conditions,
monetary
policy,
return
on
equity,
the
yield
curve,
the
economy,
interest
expense,
affordability
of
housing,
movements
in
interest
rates,
governmental
actions,
the
performance
of
the
Company’s
target
assets,
the
impact
of
current
Federal
Reserve
voters
on
certain
policies
of
the
Federal
Reserve,
the
policy
views
of
central
banks,
and
the
size
of
the
mortgage
market
are
not
considered
historical
facts
and
are
considered
forward-looking
information
under
the
federal
securities
laws.
This
information
may
contain
words
such
as
“believes,”
“plans,”
“expects,”
“intends,”
“estimates”
or
similar
expressions.
This
information
is
not
a
guarantee
of
the
Company’s
future
performance
and
is
subject
to
risks,
uncertainties
and
other
important
factors
that
could
cause
the
Company’s
actual
performance
or
achievements
to
differ
materially
from
those
expressed
or
implied
by
this
forward-
looking
information
and
include,
without
limitation,
changes
in
the
market
value
and
yield
of
our
assets,
changes
in
interest
rates
and
the
yield
curve,
net
interest
margin,
return
on
equity,
availability
and
terms
of
financing
and
hedging,
the
likelihood
that
proposed
legislation
is
made
law
and
the
anticipated
impact
thereof,
actions
by
the
U.S.
government
or
any
agency
thereof,
including
the
Federal
Reserve,
and
the
effects
of
such
actions
and
various
other
risks
and
uncertainties
related
to
our
business
and
the
economy,
some
of
which
are
described
in
our
filings
with
the
SEC.
Given
these
uncertainties,
you
should
not
rely
on
forward-looking
information.
The
Company
undertakes
no
obligations
to
update
any
forward-looking
information,
whether
as
a
result
of
new
information,
future
events
or
otherwise.
2 |
  CYS Overview
Focus on Cost
Efficiency
Target Assets
Agency Residential Mortgage Backed Securities
A Real Estate Investment Trust Formed in January 2006
Ample Financing
Sources
Financing lines with 38
lenders
Swap agreements with 18 counterparties
Dividend Policy
Self managed: highly scalable
Senior
Management
Kevin Grant, CEO, President, Chairman
Frances Spark, CFO
Company intends to distribute all or substantially all of its REIT
taxable income
3 |
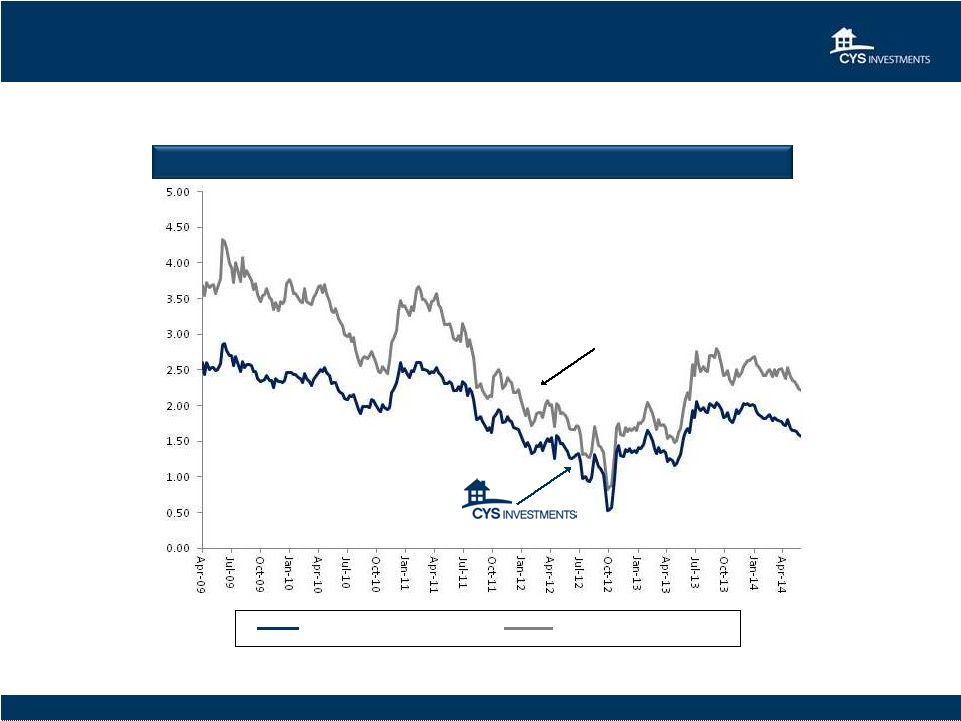  Significant
Cheapening of Agency MBS Market 15 Year: Hedged vs. Unhedged
15 Year Fixed Hedged with Swaps: April 2009 –
May 2014
15 Year Hedged
(i)
15 Year Unhedged
(ii)
Borrow Short
Invest Long
May 30, 2014
4
Source: Bloomberg.
Note:
Spreads
calculated
as:
(i)15
year
CC
Index
=
50%
4
year
swap,
and
(ii)
15
year
Current
Coupon
Index |
  Significant
Cheapening of Agency MBS Market 30 Year: Hedged vs. Unhedged
Source: Bloomberg
Note:
Spread
calculatedas:
(i)
30
year
CC
Index
-
90%
5
year
swap
30 Year Fixed Hedged with Swaps: April 2009 –
May 2014
Borrow Short
Invest Long
30 Year Hedged
30 Year Unhedged
May 30, 2014
5 |
  Volatility in
the Cap/Floor Markets Hit a Low in July 2013
30 Yr MBS -
15 Yr MBS Spread
7 Yr Cap/Floor Implied Vol
November 2012 –
May 2014
April 2012 –
May 2014
30 Year MBS Cheapened Meaningfully
Relative to 15 Year MBS
5 Year Swap vs. Fed Funds
January 2005 –
May 2014
Yield Curve
Creates positive carry
Very low cost of financing
Good ROE
Hedge flexibility very important
Fed still fighting deflation
30 Year MBS Now Priced for Operation Taper
and Tightening Monetary Policy 2015
May 30, 2014
May 30, 2014
6
May 30, 2014
Source: Bloomberg |
  Source: Board of
Governors of the Federal Reserve, March 19, 2014 Actual Economic Performance:
Sluggish vs. Fed Projections
7 |
  Appropriate Timing
of Policy Firming
•
Creates Significant Headwinds for the Economy
•
Housing Will Struggle
•
Corporate Interest Expense will rise
Appropriate Pace
of Policy Firming
Target Fed Funds Rate at Year End
Overview of FOMC Participants Assessments
of Appropriate Monetary Policy
Can the Economy Withstand
The Implied Path of 10 Year UST?
•
Forward Rate Guidance is the Fed’s Most Impactful Tool
•
Appropriate Timing and Pace will drive the Yield Curve
1.00
2.00
3.00
4.00
5.00
6.00
0.00
2014
2015
Longer
Run
%
Source: Federal Reserve March 2014 Forecast, Bloomberg, CYS
2016
Transition to a Normalized Yield Curve:
Will the Fed Push Out Forward Rate Guidance?
8
Ten Year Treasury
August 2011 -
May 2014
and Implied Projection
% |
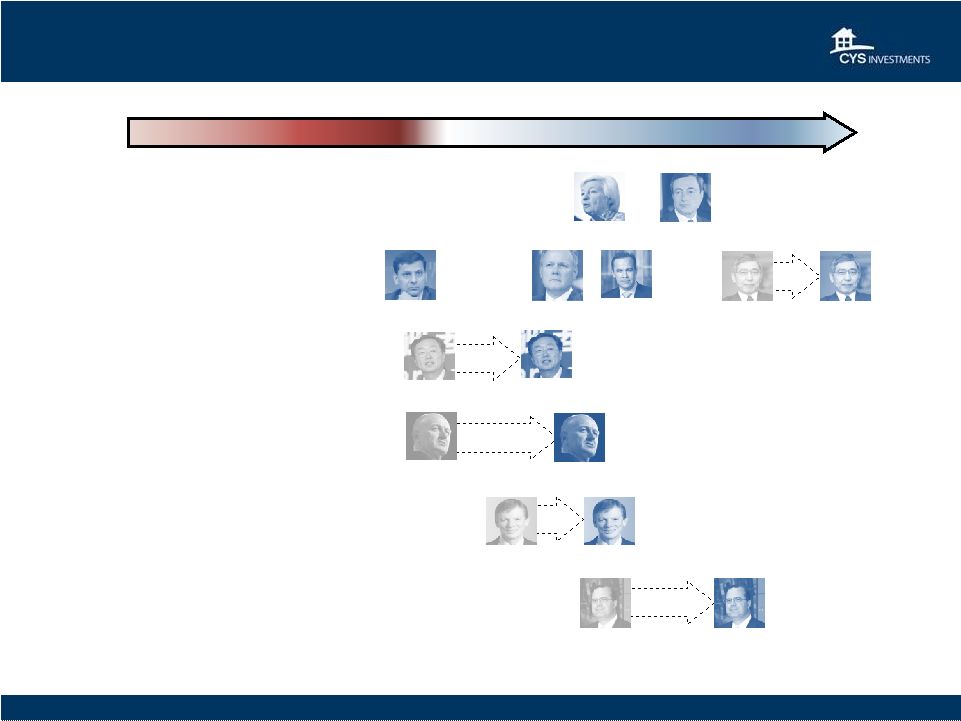
  2014-15 Fed
Voters: New Perspectives, Changing Outlooks
Powell
Source: federalreserve.gov, Barclays, Macroeconomic Advisers, LLC, Bank of America
Merrill Lynch, Bloomberg, Wall Street Journal, Indiana University, Marketwatch, Thomson Reuters, Federal Reserve
Bank of Atlanta, Federal Reserve Bank of Chicago, Federal Reserve Bank of Cleveland, Maryland
Consumer Rights Coalition, Boston Globe, Businessweek, Newsweek, Washington Post, CNBC.
Dallas:
Fisher
Minneapolis:
Kocherlakota
Philadelphia:
Plosser
Hawkish
Dovish
Neutral
2014
Voters
Yellen
Fed governors are appointed by the president and subject to Senate confirmation.
District
bank
Fed
presidents
are
chosen
by
their
individual
banks’
Boards
of
Directors
with
a
degree of oversight from the Federal Reserve Board.
Raskin’s Successor
Cleveland:
Mester
Board of
Governors
2015
Voters
New York:
Dudley
Chicago:
Evans
Richmond:
Lacker
Atlanta:
Lockhart
San Francisco:
Williams
Fischer
Brainard
Tarullo
Stein’s Successor
New York:
Dudley
9 |
  Central
Banks: Decidedly More Accommodative -
Focus on Global Deflation Risk
Draghi
EU
Hawkish
Dovish
Neutral
Xiaochuan
China
Xiaochuan
China
Tombini
Brazil
Tombini
Brazil
Australia
Stevens
Australia
Stevens
New Zealand
Wheeler
New Zealand
Wheeler
Kuroda
Japan
Canada
Poloz
Rajan
India
Kuroda
Japan
Carney
UK
Yellin
USA
10 |
  GSE Reform
Headway Source: Barclays, CYS
11 |
  Economic Recovery
Below Normal Pace U.S. Regular Conventional Gas Price
$ per gal
Updated: 2014-05-26
Capacity Utilization: Manufacturing
Updated: 2014-05-15
Civilian Unemployment Rate
Updated: 2014-05-02
CPI-U All Items, Core
Updated: 2014-05-15
Total Nonfarm Private Payroll Employment
Updated: 2014-04-30
Total Unemployed + All Marginally Attached + Total
Employed Part Time for Economic Reasons
Updated: 2014-05-02
Source: Federal Reserve Bank of St. Louis
12 |
  Housing Finance Has
Not Rebounded Source: CoreLogic, FHFA, S&P, Bloomberg, Barclays Research, National
Association of Realtors, US Census Bureau, MBA, Inside Mortgage Finance Share of
Government Guaranteed Mortgages 1990 –
2013
New and Existing Homes Months of Supply
January 1999-
April 2014
Home Ownership Rate
Jan 1990 -
present
13
New Homes
Existing Homes |
  Mortgage Market
Shrinkage Likely to Continue Source: FRB, Freddie Mac
Mortgage Debt
Outstanding
2007 -2013
Mortgage Debt Outstanding
Growth Rate
0.00%
0.50%
1.00%
9.75
10.00
10.25
10.50
10.75
11.00
11.25
11.50
1.50%
2.00%
3.50%
4.00%
4.50%
0.50%
2.00%
1.50%
1.00%
9.50
8.75
9.00
9.25
Single Family
Mortgage Origination Volume
2000 -
2015E
0
14
2000
2005
2010
2012
2013
Est.
2014
Fcst.
2015
Fcst.
1,000
2,000
3,000
4,000
Refinance Originations
Home Purchase Originations
1.9T
1.3T
1.1T
1.
Home prices now reset lower
2.
Delevering Consumers/Homeowners
3.
Psychology of lower leverage
4.
Low volume of new and existing home sales
5.
All-cash home purchase transactions, and higher downpayments
6.
Scheduled principal payments
7.
High percentage of cash-in refi’s versus cash-out refi’s.
8.
QM Rules Restrictive
Residential Mortgage Debt Decline Driven By |
  Economics of
Forward Purchase Source: Bloomberg, May 30, 2014
15 |
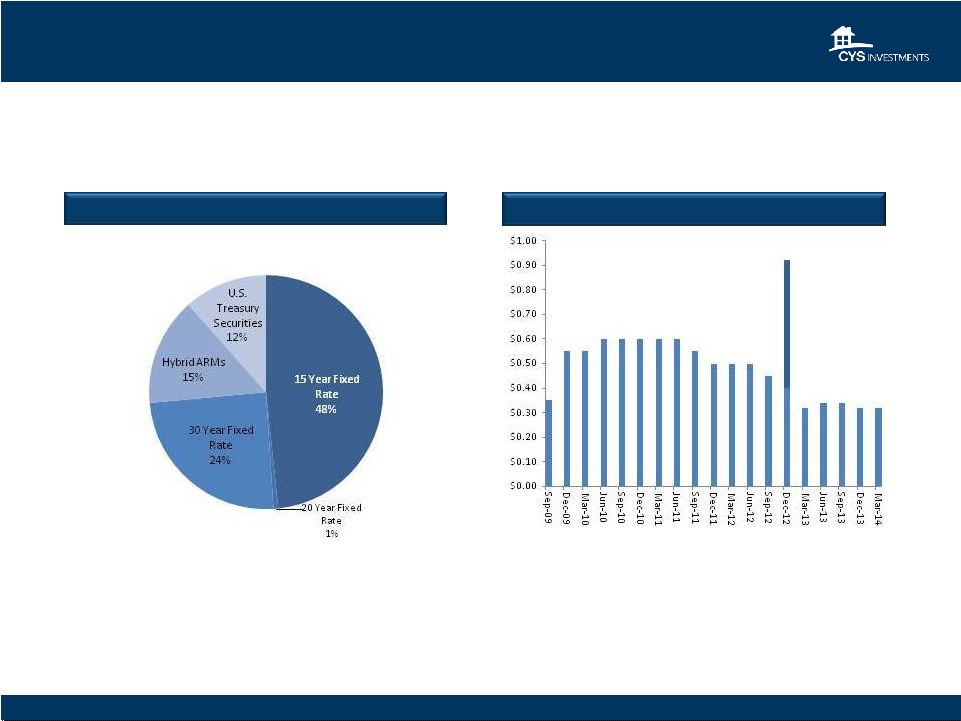  1
As of 3/31/14
$ in 000’s
Note:
the
December
2012
dividend
was
composed
of
$0.40
quarterly
cash
dividend,
and
$0.52
special
cash
dividend.
Fair Value of Total Agency RMBS and U.S. Treasuries: $13,307,735
CYS Common Stock Dividends
September
2009
–
March
2014
CYS Agency RMBS and U.S. Treasury Portfolio
1
Portfolio Composition and Dividends
16 |
  CYS Agency RMBS
and U.S. Treasury Portfolio Characteristics* Portfolio Characteristics
Face Value
Fair Value
Weighted Average
Asset Type
(in thousands)
Cost/Face
Fair Value/Face
Yield
(1)
Coupon
CPR
(2)
15 Year Fixed Rate
$ 6,227,169
$ 6,432,461
$ 102.58
$ 103.30
2.31%
3.13%
5.6%
20 Year Fixed Rate
81,294
87,371
103.04
107.48
1.94%
4.50%
11.5%
30 Year Fixed Rate
3,149,975
3,263,950
103.24
103.62
3.32%
3.96%
4.1%
Hybrid ARMs
(3)
1,946,543
1,986,641
103.55
102.06
1.98%
2.56%
9.5%
U.S. Treasury Securities
1,550,000
1,537,312
99.61
99.18
1.68%
1.50%
NA
Total
$ 12,954,981
$ 13,307,735
$ 102.53
$
102.72 2.43%
3.06%
6.1%
17 |
  (1)
Drop Income is a component of our net realized and unrealized gain (loss) on investments on
our consolidated statements of operations, and is therefore excluded from Core
Earnings. (2)
Core Earnings is defined as net income (loss) available to common shares excluding net
realized gain (loss) on investments, net unrealized gain (loss) on investments, net
realized gain (loss) on termination of swap and cap contracts and net unrealized gain
(loss) on swap and cap contracts. Financial Information
Income Statement Data
Three Months Ended
(In thousands, except per share numbers)
3/31/2014
12/31/2013
Total interest income
$84,367
$91,743
Interest expense
28,346
32,814
Net interest income
56,021
58,929
Other income (loss):
Net realized gain (loss) on investments
16,670
(22,650)
Net unrealized gain (loss) on investments
89,234
(167,671)
Net realized gain (loss) on termination of swap and cap contracts
(9,323)
(10,891)
Net unrealized gain (loss) on swap and cap contracts
(16,240)
54,633
Other income
119
-
Total other income (loss)
80,460
(146,579)
Total operating expenses
5,794
4,214
Net income (loss)
$ 130,687
$ (91,864)
Dividends on preferred stock
(5,203)
(5,203)
Net income (loss) available to common shares
$ 125,484
$ (97,067)
Net income (loss) per common share basic & diluted
$
0.78
$
(0.59) Drop income per common share (diluted)
(1)
$
0.07
$
0.07 Core Earnings per common share (diluted)
(2)
$
0.28
$
0.31 Distributions per common share
$
0.32
$
0.32 Non-GAAP Measure/Reconciliation (in 000's)
NET INCOME (LOSS) AVAILABLE TO COMMON SHARES
$ 125,484
$ (97,067)
Net realized (gain) loss on investments
(16,670)
22,650
Net unrealized (gain) loss on investments
(89,234)
167,671
Net realized (gain) loss on termination of swap and cap contracts
9,323
10,891
Net unrealized (gain) loss on swap and cap contracts
16,240
(54,633)
Core Earnings
$ 45,143
$ 49,512
18 |
  The table above
includes calculations of the Company’s Agency RMBS and U.S. Treasury Securities portfolio (“Debt Securities”)
1)
The average settled Debt Securities is calculated by averagingthe month end cost basis of
settled Debt Securities during the period. 2)
The average total Debt Securities is calculated by averaging the month end cost basis of total
Debt Securities during the period. 3)
The average repurchase agreements are calculated by averaging the month end repurchase
agreements balance during the period. 4)
The average Debt Securities liabilities are calculated by adding the average month end
repurchase agreements balance plus average unsettled Debt Securities during the period.
5)
The average stockholders' equity is calculated by averaging the month end stockholders' equity
during the period. 6)
The average common shares outstanding are calculated by averaging the daily common shares
outstanding during the period. 7)
The leverage ratio is calculated by dividing (i) the Company's
repurchase agreements balance plus payable for securities purchased minus receivable for
securities sold by (ii) stockholders' equity. 8)
The average yield on Debt Securities for the period is calculated by dividing total interest
income by average settled Debt Securities. 9)
The average yield on total Debt Securities including Drop Income for the period is calculated
by dividing total interest income plus Drop Income by average total Debt Securities.
10)
The average cost of funds and hedge for the period is calculated by dividing interest expense
by average repurchase agreements. 11)
The adjusted average cost of funds and hedge for the period is calculated by dividing interest
expense by average Debt Securities liabilities. 12)
The interest rate spread net of hedge for the period is calculated by subtracting average cost
of funds and hedge from average yield on settled Debt Securities. 13)
The interest rate spread net of hedge including Drop Income for
the period is calculated by subtracting adjusted average cost of funds and hedge from average
yield on total Debt Securities including Drop Income. 14)
The operating expense ratio for the period is calculated by dividing operating expenses by
average stockholders' equity. * All percentages are annualized.
Financial Information
(in thousands)
Three Months Ended
Key Balance Sheet Metrics
March 31, 2014
December 31, 2013
Average settled Debt Securities
(1)
$12,472,238
$13,024,294
Average total Debt Securities
(2)
$13,454,972
$14,293,267
Average repurchase agreements
(3)
$10,867,627
$11,384,159
Average Debt Securities liabilities
(4)
$11,850,361
$12,653,132
Average stockholders' equity
(5)
$1,861,121
$1,896,360
Average common shares outstanding
(6)
161,831
163,850
Leverage ratio (at period end)
(7)
6.32:1
6.97:1
Key Performance Metrics*
Average yield on settled Debt Securities
(8)
2.71%
2.82%
Average yield on total Debt Securities including Drop Income
(9)
2.85%
2.93%
Average cost of funds and hedge
(10)
1.04%
1.15%
Adjusted average cost of funds and hedge
(11)
0.96%
1.04%
Interest rate spread net of hedge
(12)
1.67%
1.67%
Interest rate spread net of hedge including Drop Income
(13)
1.89%
1.89%
Operating expense ratio
(14)
1.25%
0.89%
19 |
 Kevin
Grant Chief Executive Officer
KBW Mortgage Finance Conference
June 3, 2014
*
*
*
*
*
*
*
*
Investment Outlook |