Attached files
| file | filename |
|---|---|
| 8-K - FORM 8-K - Armada Hoffler Properties, Inc. | d738348d8k.htm |
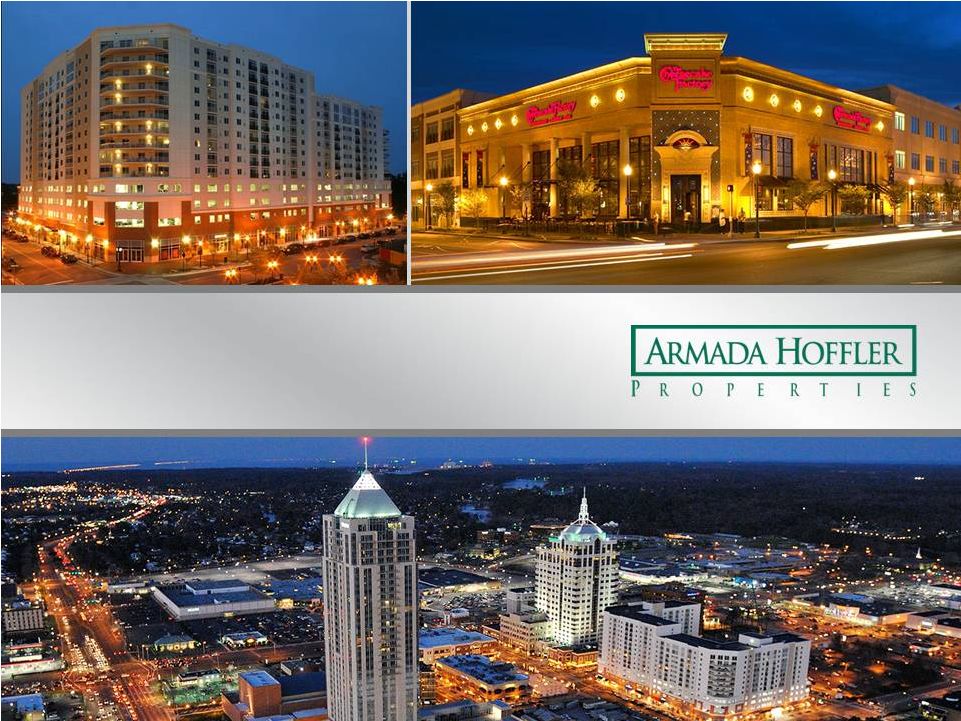
 REITWeek: NAREIT’s Investor Forum
June 2014
Exhibit 99.1 |
 Forward
Looking Statement This presentation contains forward-looking statements
within the meaning of the Private Securities Litigation Reform Act of 1995 (set
forth in Section 27A of the Securities Act of 1933, as amended, and Section 21E of the
Securities Exchange Act of 1934, as amended).
In particular, statements pertaining to our capital resources,
portfolio performance, results of operations and development pipeline contain
forward-looking statements.
Likewise, all of our statements regarding anticipated growth in
our funds from operations, core
funds from operations, adjusted funds from operations, funds available for distribution
and net operating income are forward-looking statements.
You can identify forward-looking statements by the use of forward-looking
terminology such as “believes,”
“expects,”
“may,”
“will,”
“should,”
“seeks,”
“approximately,”
“intends,”
“plans,”
“estimates”
or “anticipates”
or the negative of these words and phrases or similar words or phrases
which are predictions of or indicate future events or trends and
which do not relate solely to historical matters.
You can also identify forward-looking statements by discussions of strategy, plans
or intentions. Forward-looking statements involve numerous risks and
uncertainties and you should not rely on them as predictions of future events.
Forward-looking statements depend on assumptions, data or methods which may be
incorrect or imprecise and the Company may not be able to realize them. The Company
does not guarantee that the transactions and events described will happen as
described (or that they will happen at all). For further
discussion of risk factors and other events that could impact our future results,
please refer to the section entitled “Risk Factors”
in our most recent Annual Report on Form 10-K filed with the Securities and
Exchange Commission (the “SEC), and the documents subsequently filed by us
from time to time with the SEC. 2 |
 ARMADA
HOFFLER TODAY A Different Kind of REIT
Solid Dividend Yield Today
Powerful Growth Engine for Tomorrow
>6%
yield
~$150M
development pipeline
every ~2 years
Unique
business
model
$1.4B
assets
developed
35
years
3 |
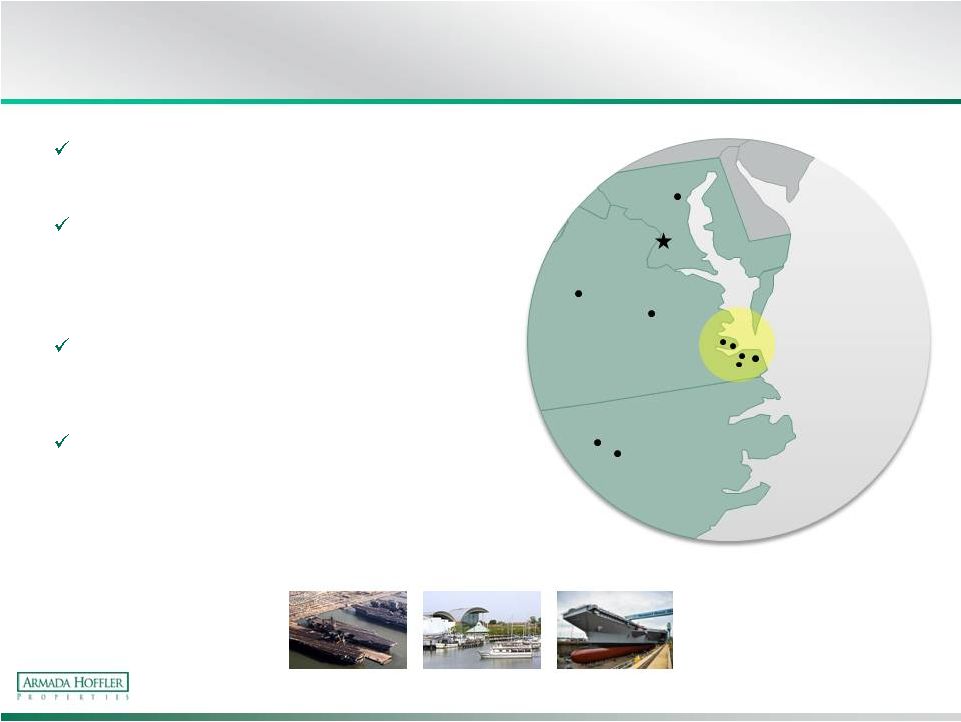
 A
DIFFERENT KIND OF REIT: At a Glance
•
Full-service REIT focused on
institutional grade office, retail
and multifamily properties
–
25 properties
–
focused on Mid-Atlantic region
•
Diversified portfolio
•
NYSE: AHH, market cap ~$319M
as of 5/28/14
•
Enterprise value > $600M
•
Management and prior
owners own ~40%
Current portfolio &
development pipeline
Previous construction/
development projects
Office
Retail
Multifamily
Pipeline
Property
Key
Virginia
North Carolina
Maryland
Washington DC
4 |
 A
DIFFERENT KIND OF REIT: Why Our Core Market is Attractive
America’s Top State
for Business –
2011
Virginia is One of the
Best States for Business
Virginia Beach –
2
nd
Most
Business-Friendly City in America
–
June 2013
“
”
“
”
“
”
•
Government named
Best-run City in U.S.
(Wall Street Journal, Jan.
2012)
•
2012 Tourism revenue $1.28
Billion
•
AAA Bond rating maintained
since 1938, longer than any
other state
•
Corporate income tax
of 6% not increased
since 1972
Hampton Roads
Virginia
•
33
rd
largest MSA in the
country
•
Only East Coast port
with 50’
deep and
unobstructed sea lanes
and channels
Virginia Beach
5 |
 A
DIFFERENT KIND OF REIT: Hampton Roads Metropolitan Area –
Stable, Growing, Diversified
65% of NOI from operating portfolio falls
within this area
Top 3 largest cities in Virginia within
Hampton Roads MSA
–
Virginia Beach #1, Norfolk #2,
Chesapeake #3
Highly skilled labor pool
–
unemployment rate of 5.3% versus
U.S. national rate of 6.5% (December 2013)
Unique
economic
growth
driver
–
one
of
two
ports
prepared
for
Post-Panamax
ships
–
shipping, warehousing, distribution
–
defense and defense-related industries
6
CHARLOTTESVILLE
RICHMOND
WASHINGTON DC
RALEIGH
DURHAM
BALTIMORE
VIRGINIA BEACH
Hampton
Newport News
Chesapeake
Norfolk |
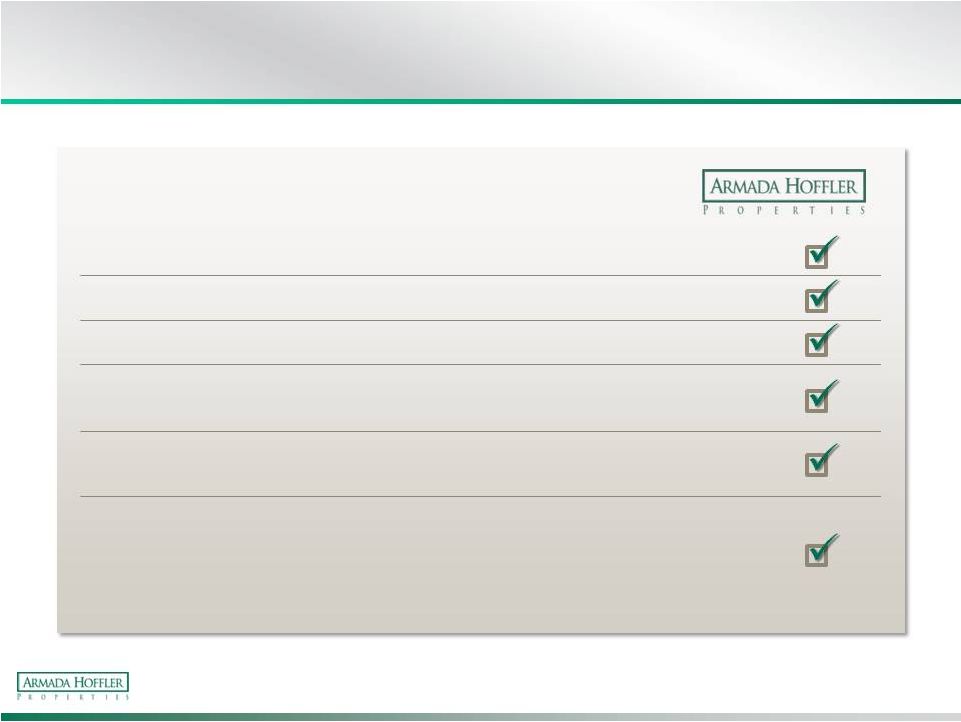
 A
DIFFERENT KIND OF REIT: Unique Integrated Business Model
CONSTRUCTION
DEVELOPMENT
STABLE PORTFOLIO
ADVANTAGE
Delivers Sustainable Low Risk Growth
•
Reduces
development risk
•
Fee income
•
Growth pipeline
•
Wholesale equity
creation
•
High occupancy
•
Consistent cash flow
7 |
 A
DIFFERENT
KIND
OF
REIT:
Integrated
Model
–
Delivers
Unique
Advantages
•
Low risk –
50-60% leased prior to breaking ground
•
Assets
developed
at
wholesale
cost
–
creates
equity
•
Focus on assets at “main and main”
at secondary and tertiary Mid-
Atlantic markets
•
Construction Division
-
Projects brand strength, drives opportunity, and mitigates
development risk
-
Fees from integrated construction business are consistently profitable
•
Spread between return on cost and market cap rates of 100-200
basis points
•
Diversified portfolio allows AHH to be opportunistic
8 |
 A
DIFFERENT KIND OF REIT: Our Integrated Model in Action –
Virginia Beach Town Center
•
Transformative central business district
development with $500M developed since 2000
exclusively by Armada Hoffler
–
City of Virginia Beach has contributed $150M
–
51% of tenants are new to City of Virginia Beach
–
34% of tenants are new to Hampton Roads
–
Visited by 63% of summer visitors
•
Executed in close collaboration with the
City of Virginia Beach
•
On-going, 17-block, multi-phase development:
–
436,500 SF Office
–
300,000 SF Retail
–
342 Apartments
–
330 Hotel Rooms
•
Additional $83.7 million of Town Center
development included in our identified pipeline
Before
After
9 |
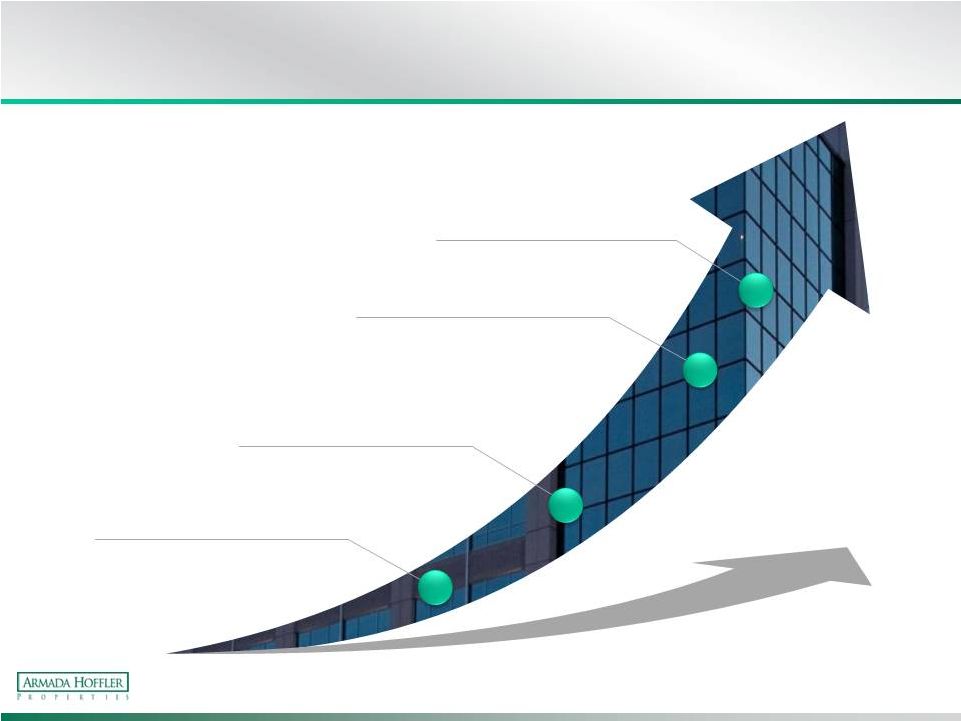 Multiple Growth Drivers
10
Stable Construction Income
that Drives Brand Recognition
and Opportunities
Development Pipeline
Strategic Acquisitions
2
3
4
Stable Portfolio with Organic
Growth Over Time
1 |
 1)
STABLE PORTFOLIO Well Balanced Portfolio
Breakdown of NOI Contribution
Three months ended 3/31/14
11
Retail
38%
Multifamily
15%
General
Contracting
11%
Office
36% |
 1)
STABLE PORTFOLIO We Attract the Best Tenants
High quality portfolio
*Representative
12
Office Tenants*
Retail Tenants* |
 1)
STABLE
PORTFOLIO
High
Occupancies
–
Historical
Outlook
Occupancy as of quarter end
Office Occupancy
Retail Occupancy
Multifamily Occupancy
Portfolios managed for long-term, stable cash flow
13
95.4%
50%
60%
70%
80%
90%
100%
10
11
12
13
14
1Q
93.4%
10
11
12
13
14
1Q
94.2%
10
11
12
13
14
1Q |
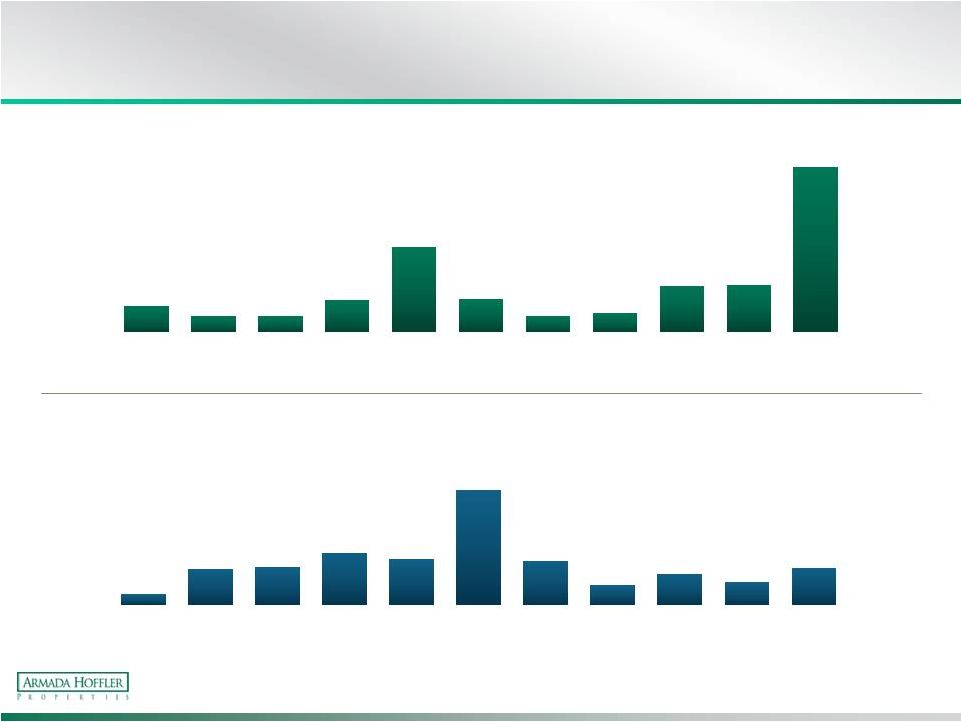 1)
STABLE PORTFOLIO Lease Renewals Actively Managed to Reduce Risk
As of 3/31/14
Year of Lease Expirations
Office Lease Expirations
(% Office Portfolio ABR)
(1)
Year of Lease Expirations
Retail Lease Terms
(% Retail Portfolio ABR)
(1)
14
5.2%
3.2%
3.2%
6.4%
17.0%
6.6%
3.8%
9.2%
9.4%
32.9%
2014
2015
2016
2017
2018
2019
2020
2021
2022
2023
There-
after
2.5%
8.0%
8.5%
11.6%
10.2%
25.3%
9.7%
4.4%
6.8%
5.1%
8.1%
2014
2015
2016
2017
2018
2019
2020
2021
2022
2023
There-
after
3.1% |
 2)
Stable Construction Income that Drives Brand
Recognition and Opportunities
15 |
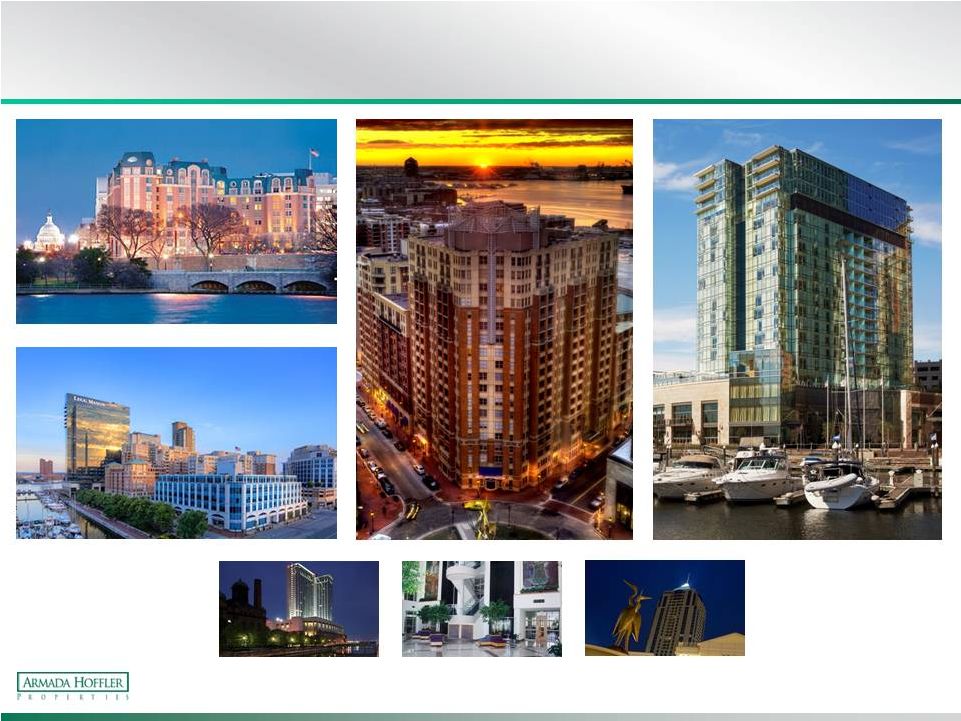
 3)
DEVELOPMENT PIPELINE Extensive Experience Developing >$1.4B of
Properties Building
relationships and
credibility
Examples
16
Smith’s Landing
Blacksburg, VA
Mandarin Oriental Hotel,
Washington DC
Hampton University Proton
Therapy Institute
2900 K Street,
Washington DC
The Swedish Embassy,
Washington DC
Tyre Neck Harris Teeter
Portsmouth, VA
Richmond Tower
Richmond, VA
249 Central Park Retail,
Virginia Beach, VA |
 3)
DEVELOPMENT PIPELINE Long Track Record of Successful Public-Private
Partnerships >20
partnerships
Unique competitive advantage
17 |
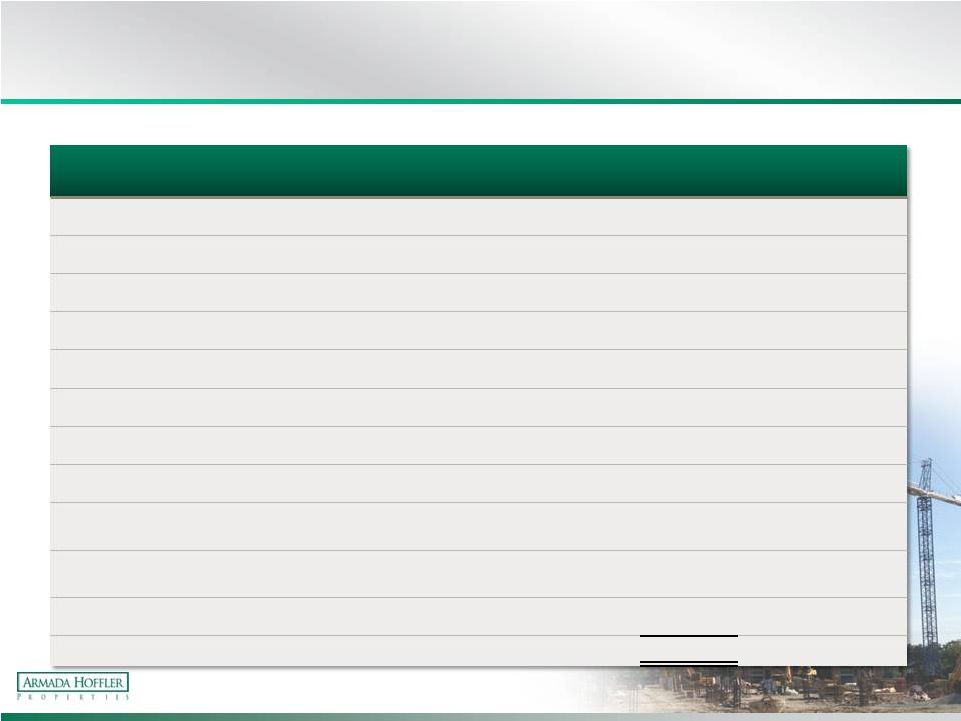 3)
DEVELOPMENT
PIPELINE
Our
Identified
Pipeline
–
Status
Today
Property
Location
Property
Type
Estimated
Cost
Stabilized Quarter
4525 Main Street
Virginia Beach, VA
Office
$
50,000
1Q 2016
Encore Apartments
Virginia Beach, VA
Multifamily
34,000
1Q 2016
Whetstone Apartments
Durham, NC
Multifamily
28,000
1Q 2016
Sandbridge Commons
Virginia Beach, VA
Retail
13,000
2Q 2016
Brooks Crossing
Newport News, VA
Office
8,000
3Q 2015
Greentree Shopping Center
Chesapeake, VA
Retail
6,000
3Q 2016
Liberty Apartments
Newport News, VA
Multifamily
30,700
3Q 2015
Oceaneering
Chesapeake, VA
Office
26,000
1Q
2015
Commonwealth of Virginia –
Chesapeake
Chesapeake, VA
Office
7,000
1Q
2015
Commonwealth of Virginia –
Virginia Beach
Virginia Beach, VA
Office
3,000
1Q
2015
Lightfoot Marketplace
Williamsburg, VA
Retail
24,000
2Q
2017
$
229,700
$ in thousands
As of 3/31/14
18 |
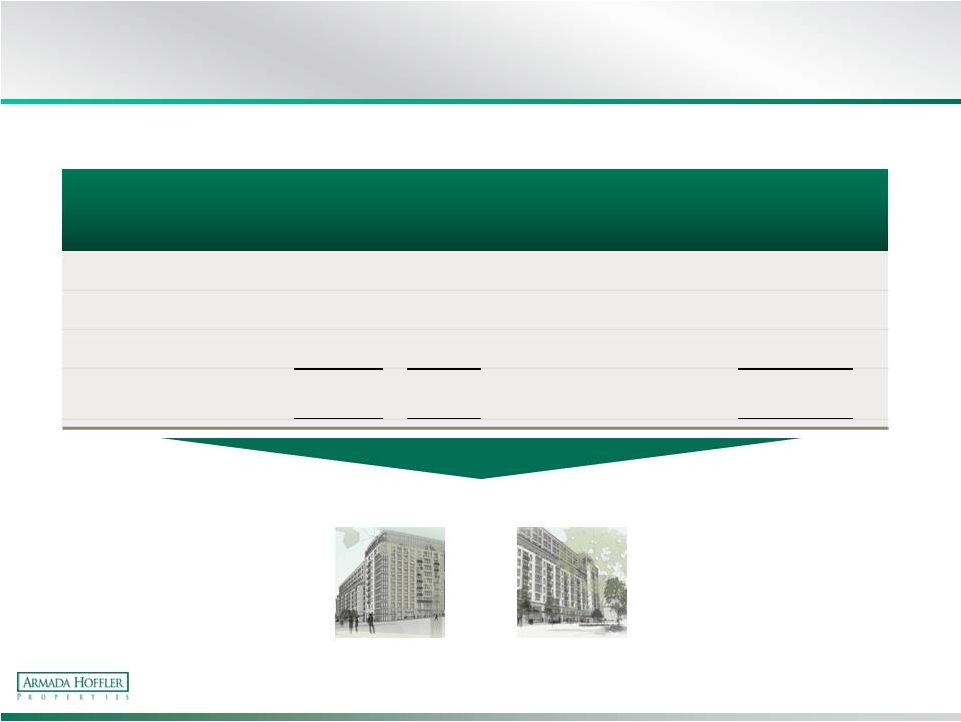 $ in
thousands Estimated
Cost
Estimated
Stabilized
NOI
Estimated
Return
on Cost
Projected
Value
Spread
The Company’s
Estimated Equity
Creation Excluding
JV Ownership
Identified Pipeline
$
139,000
$
11,400
8.20%
125 bps
$
23,903
Next Generation Pipeline
$
150,000
$
12,400
8.27%
150 bps
$
33,251
Liberty Apartments
$
30,700
(2)
$
2,000
-
Estimated Stabilized
Value / Weighted Average
$
319,700
$
25,800
8.24%
$
57,154
3) DEVELOPMENT PIPELINE
Pipelines Drive Shareholder Value Creation
Equity creation >$55M next 3-4 years
A Closer Look at the Identified and Next Generation Pipelines
(1)
Note 1:
The data reflects the Company’s current estimates, which may change as a result
of various factors. The Company can make no assurances that the estimates
below will actually be realized.
Note 2:
Purchase price.
19 |
 4)
ACQUISITION STRATEGY Execute on Strategic and Opportunistic Acquisitions
•
Properties located within or adjacent to our Mid-Atlantic footprint
•
Strong occupancy and stable cash flow
•
Credit-quality tenants
•
Smooth lease rollover with long-term anchor tenants
•
Seller interested in exchanging equity in property for AHH Operating
Partnership Units (OP Units)
•
Value add opportunities
20 |
 FINANCIAL HIGHLIGHTS
First Quarter 2014 Highlights
Financial
•
Funds From Operations (“FFO”) of $6.5 million, or
$0.20 per diluted share.
•
Core FFO of $7.1 million, or $0.22 per diluted share.
•
Occupancy increased slightly to 94.5%, compared to
94.4% as of December 31, 2013.
•
Cash dividend of $0.16 per share payable on July 10,
2014 to stockholders of record on July 1, 2014.
•
Core debt to annualized Core EBITDA -
6.9x
•
Weighted average interest rate of 3.6% and average
loan term to maturity of 9.7 years
•
Approximately 46% of debt was fixed as of March 31st
but taking into account LIBOR interest rates caps
approximately 83% of debt was fixed or hedged.
Operational
•
Eleven properties under development including
675,000 square feet of office and retail space and
686 multifamily units.
•
$165.9 million of new construction contract work,
including the Harbor Point project in Baltimore,
Maryland, and $193.3 million of backlog.
•
Anthropologie will be opening a 9,000 square foot
store at the Town Center of Virginia Beach in the
fourth quarter of 2014.
•
In May, the Company announced two new
development projects, both with the Commonwealth
of Virginia, for a total of 47,000 square feet. Both
properties will be 100% leased for 12 years starting
in early 2015.
•
In April, the Company announced Lightfoot
Marketplace, a new shopping center in Williamsburg,
Virginia that will be anchored by Harris Teeter on a
20-year lease.
21 |
 FINANCIAL HIGHLIGHTS
Track Record of Financial Results
3Q13
4Q13
1Q14
FFO
$ 5,185
$6,652
$6,475
FFO per share
0.16
0.21
0.20
Core FFO
$ 6,554
$7,098
$7,065
Core FFO per share
0.20
0.22
0.22
AFFO
$ 6,358
$6,000
$6,187
AFFO per share
0.20
0.19
0.19
22
$ in thousands, except per share |
 FINANCIAL HIGHLIGHTS
Debt Maturity
23
$ in thousands
As of 3/31/14
Interest Rate Cap Agreements At or Below 1.50%
Effective Date
Maturity Date
Strike Rate
Notional Amount
May 31, 2012
May 29, 2015
1.09%
$9,068
September 1, 2013
March 1, 2016
1.50%
40,000
October 4, 2013
April 1, 2016
1.50%
18,500
March 14, 2014
March 1, 2017
1.25%
50,000
Total Interest Rate Caps at or Below 11.50%
$117,568
Fixed Debt Outstanding
145,729
Total Fixed Interest Rate Debt (including caps)
$263,297
Fixed Interest Rate Debt as a % of Total
83%
$0
$20,000
$40,000
$60,000
$80,000
$100,000
$120,000
2014
2015
2016
2017
2018 and
thereafter |
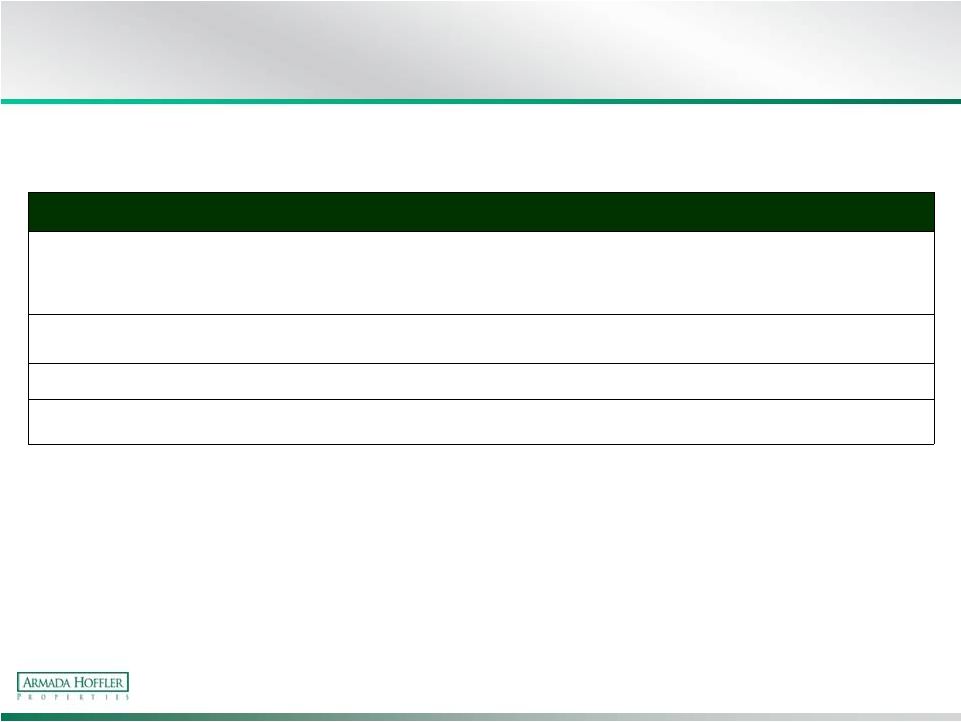 FINANCIAL HIGHLIGHTS
2014 Outlook
24
Current Parameters
Previous Parameters
As of May 13, 2014
As of February 20, 2014
(1Q14 Earnings Release)
(4Q13 Earnings Release)
Total Core FFO
(excluding the impact from non-stabilized projects)
In-line with full-year 2013 FFO
In-line with full-year 2013 FFO
Non-stabilized projects -
negative impact to FFO
(excluded from Core FFO)
Approximately $1.5 million
Approximately $1.5 million
General & administrative expense
Approximately $7.8 million
Approximately $7.8 million
Third party construction company annual segment
gross profit
Approximately $4.0 million
Approximately $4.0 million |
 REITWeek: NAREIT’s Investor Forum
June 2014 |